55. iwk - db-thueringen.de · - svm-type, here the types c-svc, nu-svc, one-class svm, epsilon-svr...
TRANSCRIPT

PROCEEDINGS
13 - 17 September 2010
Crossing Borders within the ABC Automation,
Biomedical Engineering and
Computer Science
Faculty of Computer Science and Automation
www.tu-ilmenau.de Home / Index: http://www.db-thueringen.de/servlets/DocumentServlet?id=16739
55. IWKInternationales Wissenschaftliches Kolloquium
International Scientific Colloquium

Impressum Published by Publisher: Rector of the Ilmenau University of Technology
Univ.-Prof. Dr. rer. nat. habil. Dr. h. c. Prof. h. c. Peter Scharff Editor: Marketing Department (Phone: +49 3677 69-2520)
Andrea Schneider ([email protected]) Faculty of Computer Science and Automation
(Phone: +49 3677 69-2860) Univ.-Prof. Dr.-Ing. habil. Jens Haueisen
Editorial Deadline: 20. August 2010 Implementation: Ilmenau University of Technology
Felix Böckelmann Philipp Schmidt
USB-Flash-Version. Publishing House: Verlag ISLE, Betriebsstätte des ISLE e.V.
Werner-von-Siemens-Str. 16 98693 llmenau
Production: CDA Datenträger Albrechts GmbH, 98529 Suhl/Albrechts Order trough: Marketing Department (+49 3677 69-2520)
Andrea Schneider ([email protected]) ISBN: 978-3-938843-53-6 (USB-Flash Version) Online-Version: Publisher: Universitätsbibliothek Ilmenau
Postfach 10 05 65
98684 Ilmenau
© Ilmenau University of Technology (Thür.) 2010 The content of the USB-Flash and online-documents are copyright protected by law. Der Inhalt des USB-Flash und die Online-Dokumente sind urheberrechtlich geschützt. Home / Index: http://www.db-thueringen.de/servlets/DocumentServlet?id=16739

PARAMETER OPTIMIZATION FOR SUPPORT VECTOR MACHINES BY USING A MULTICRITERIA GENETIC ALGORITHM FOR CLASSIFICATION OF SLEEP-
STAGES
M. Krautwald, D. Trommer, R. Baumgart-Schmitt, C. Walther, C. Menz
University of Applied Sciences Schmalkalden, Faculty of Electrical Engineering
ABSTRACT
In this paper a special immigrative multicriteria genetic algorithm (SIGA) will be introduced. It is based on the Non-dominated Sorting Genetic Algorithm (NSGA) II, published 2000 by Deb.
The SIGA has been adapted for parameter optimization of SVM to classify sleep-stages. Therefore it includes all values of the confusion matrix for searching fronts. The confusion matrix represents the number of concordances and disconcordances between the visually rated and the automatically generated labels of sleep stages. We separate sleep in maximum eight stages. That means the confusion matrix has up to 64 elements, which are used as criteria. Further criteria are the total correctly classified data in percent, the diagonal and the geometrical mean of the confusion matrix and the accuracy of the class with the lowest number of concordances. Furthermore the algorithm implements the principle of immigration.
How the SIGA influence the classification quality will be demonstrated in this paper. In different experiments with measured, but also with synthetic sleep data, the increase of classification quality of SVM by using the SIGA approach for parameter optimization will be shown.
Index Terms - Support Vector Machine, Genetic
Algorithm, Optimization, NSGA
1. INTRODUCTION
For Support Vector Machines (SVM), like all methods of classification, the choosing parameters determine the quality of classification. Searching these parameters is an optimization problem. This can be solved with different methods.
One approach for solving an optimization problem is the genetic algorithm, which has his background in the biological evolution.
1.1. The genetic algorithm Like in the nature the genetic algorithm has individuals. Each of them stands for one solution of the optimization problem. At the beginning there is one generation, a number of individuals, which were generated randomly. With the help of the principles
selection, mutation and recombination the next generation is built. That means the best individuals will stay alive and recombine there features. By repeating this procedure for a number of generations the solutions should become better and better.
The NSGA II algorithm by Deb is based on these principles but uses for selection non-dominated sorting only [1]. At first each generation where sort by fronts (non-dominate sorting). One front contains all individuals, which are not dominating each other, they are indifferent. If more than one criterion were used to determine dominance the approach become multi-objective. Definitions:
- x1
- x1 ~
All solutions, which are indifferent, are called “Pareto-optimal” solutions.
To sort individuals of one front the crowding-distance of each solution was determined. The crowding-distance is defined by Deb as the difference in the function values of two adjacent solutions [2][3]. The overall crowding distance is the summation of differences of all criterions (functions).
���
� ��� ��
1
2 11,1,
l
i
m
jijij IICD , [1]
with CD as the crowding-distance, I is an individual, l as the number of individuals in one front and m is the number of criteria. The boundary solutions have an infinite value that means they are always selected.
In Figure 1 the operational sequence of the NSGA II-algorithm by Deb is shown. (The yellow boxes with flattened corners describe loops.) This algorithm builds the fundament of the SIGA, which is described in the next paragraph.
The NSGA II work with three populations: - P, the population of parent-individuals, - Q, the offspring-population and - R, the combination of P and Q.
After combination of Qt and Pt all fronts were searched and the new population Pt+1 were filled with the best individuals determine by fronts and crowding distance, with t as generation counter.
527
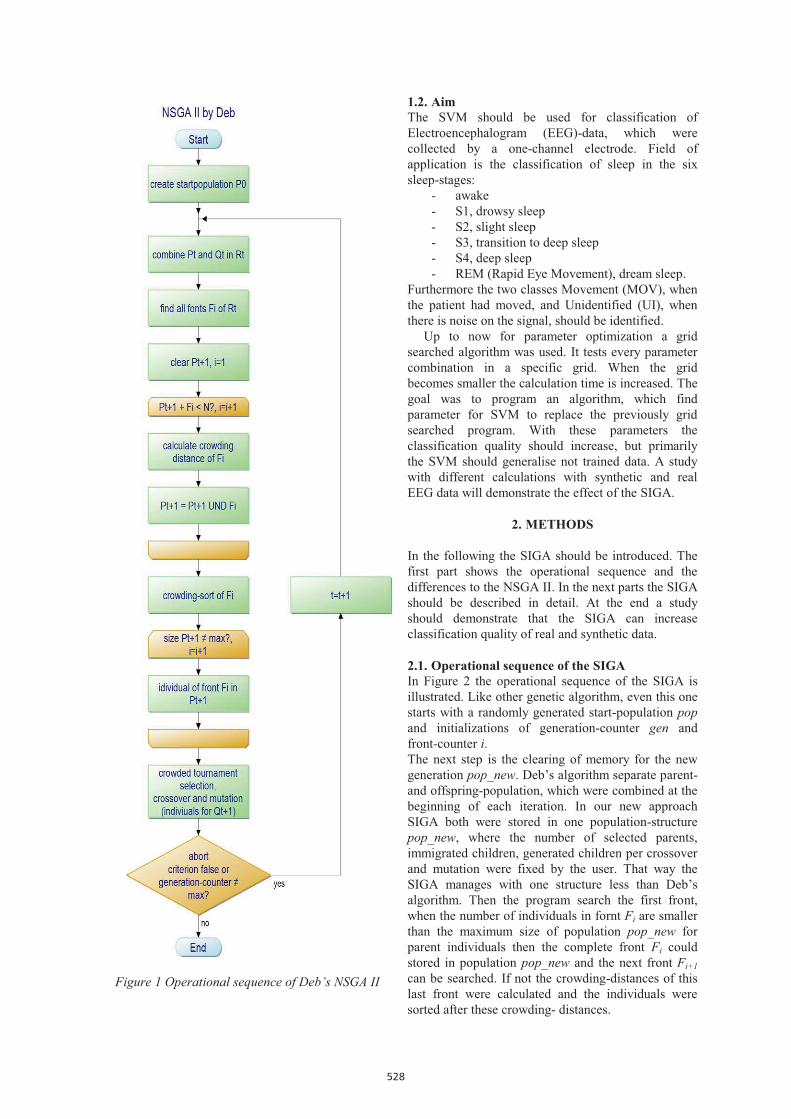
Figure 1 Operational sequence of Deb’s NSGA II
1.2. Aim The SVM should be used for classification of Electroencephalogram (EEG)-data, which were collected by a one-channel electrode. Field of application is the classification of sleep in the six sleep-stages:
- awake - S1, drowsy sleep - S2, slight sleep - S3, transition to deep sleep - S4, deep sleep - REM (Rapid Eye Movement), dream sleep.
Furthermore the two classes Movement (MOV), when the patient had moved, and Unidentified (UI), when there is noise on the signal, should be identified.
Up to now for parameter optimization a grid searched algorithm was used. It tests every parameter combination in a specific grid. When the grid becomes smaller the calculation time is increased. The goal was to program an algorithm, which find parameter for SVM to replace the previously grid searched program. With these parameters the classification quality should increase, but primarily the SVM should generalise not trained data. A study with different calculations with synthetic and real EEG data will demonstrate the effect of the SIGA.
2. METHODS
In the following the SIGA should be introduced. The first part shows the operational sequence and the differences to the NSGA II. In the next parts the SIGA should be described in detail. At the end a study should demonstrate that the SIGA can increase classification quality of real and synthetic data.
2.1. Operational sequence of the SIGA In Figure 2 the operational sequence of the SIGA is illustrated. Like other genetic algorithm, even this one starts with a randomly generated start-population popand initializations of generation-counter gen and front-counter i. The next step is the clearing of memory for the new generation pop_new. Deb’s algorithm separate parent- and offspring-population, which were combined at the beginning of each iteration. In our new approach SIGA both were stored in one population-structure pop_new, where the number of selected parents, immigrated children, generated children per crossover and mutation were fixed by the user. That way the SIGA manages with one structure less than Deb’s algorithm. Then the program search the first front, when the number of individuals in fornt Fi are smaller than the maximum size of population pop_new for parent individuals then the complete front Fi could stored in population pop_new and the next front Fi+1can be searched. If not the crowding-distances of this last front were calculated and the individuals were sorted after these crowding- distances.
528

Figure 2 Operational sequence of the SIGA
Then only the best N individuals of Fi were chosen, such that the parent-part of population pop_new can be filled.
That way the SIGA becomes more efficient than NSGA II, which searches all fronts.
Now the children-parts were filled by immigration, which will be described in chapter 2.2., by crossover and mutation. Then the population pop_new becomepopulation pop and the abort criterion were checked. If these is false the next generation were determine. At the end of all generations there are a number of pareto-optimal solutions.
2.2. Principle of Immigration A new aspect is the principle of Immigration. It based on the model of the nature. In the past when there aren’t so much people and a lot of small isolated villages it was necessary that from time to time some non-native people came in this society to bring new genetic information in this genetic pool. This principleis essential to avoid genetic diseases.
To avoid a unilaterally development of the genetic algorithm every generation some new individuals were generated randomly.
2.3. User-parameter In the program there are several parameters to be defined by the user. To be flexible and change parameter without programming a configuration file is used. In this file all parameters of the program that means genetic- and SVM-parameter are defined. The SVM-parameters are:
- SVM-Type, here the Types C-SVC, nu-SVC,one-class SVM, epsilon-SVR and can choose nu-SVR,
- SVM-Kernel, here the Kernels linear, polynomial, radial basis function (RBF) and sigmoid are possible,
- the number of classes, - the range where the parameters were search, - the resolution (accuracy) of the parameters and - the number of data-parts for cross validation.
The genetic-parameters are: - the number of individuals per generation, - the proportion of children in percent, - the mutation-rate, it determine the proportion
of individuals in percent , which mutate, - the mutation-width, it fixe the range of the
mutation and - the immigration-rate, it defines the proportion
of individuals per generation, which were generated randomly.
Furthermore a weighting matrix for the confusion matrix can be defined, so optimal adaptations on a classification problem are possible. For example the confusion of two specific classes should be avoided.Therefore the weight at this position in the weighting matrix has to be height and these parameters for SVM
529

were selected where SVM don not confuse this two classes.
The SIGA is a multi-objective algorithm. The criteria for optimization are the maximum 64 values of the confusion matrix, the total right classified data in percent, the diagonal and the geometrical mean of the confusion matrix and the accuracy of the poorest class. Each of these criteria can be activated or deactivated for optimization. Furthermore the criteria can be weighed against each other.
2.4. Implementation of non-dominate-sorting Implementation of non-dominate sorting after definition described in part 1.1 lead to a huge problem. The more criteria for optimization the more individuals are indifferent. This produces huge fronts,which have good but also poor solutions. Because the bordering solutions in crowding-sorting were always selected many of this “poor” solutions were selected for next generation. That was shown in the praxis, too. With this definition of domination and the confusion matrix as criterion only one “good” and many “poor”solutions were selected.
For solving this problem the definition of domination was modified:
- x1
- x1 ~
2.5. Studies For verifying the SIGA several calculations with real and synthetic data were performed. For all calculations the RBF Kernel was used [5].
At the one hand EEG-data were taken to classify sleep with a SVM into maximum eight classes by using 53 features. This data were collected by a one-channel electrode from the forehead. The eight classes are S1, S2, S3, S4, REM, awake, MOV and UI described in part 1.2. The eight class problem is shown in Table 1. Table 2 till Table 7 illustrates how the eight classes were combined in two till seven classes. For seven classes the UI data were deleted (Table 2). In the six class classification additionally S3 and S4 were summarized (Table 3). For five classes also MOV were deleted (Table 4). The four classes combine S1 and S2, S3 with S4 and delete MOV and UI (Table 5). For three classes additionally the class awake were included to class one (Table 6). The two class classification is a REM or Non-REM problem (Table 7).
1 2 3 4 5 6 7 8S1 S2 S3 S4 REM awake MOV UI
Table 1: Eight classes of sleep classification
1 2 3 4 5 6 7 -S1 S2 S3 S4 REM awake MOV UI
Table 2: Seven classes of sleep classification
1 2 3 3 4 5 6 -S1 S2 S3 S4 REM awake MOV UI
Table 3: Six classes of sleep classification
1 2 3 3 4 5 - -S1 S2 S3 S4 REM awake MOV UI
Table 4: Five classes of sleep classification
1 1 2 2 3 4 - -S1 S2 S3 S4 REM awake MOV UI
Table 5: Four classes of sleep classification
1 1 2 2 3 1 - -S1 S2 S3 S4 REM awake MOV UI
Table 6: Three classes of sleep classification
1 1 1 1 2 1 1 -S1 S2 S3 S4 REM awake MOV UI
Table 7: Two classes of sleep classification
At the other hand synthetic data with eight classes and two features were generated to solve the XOR-problem. That means:
121 ��� classfeaturefeature [2] Example: 8111110001 class���
Two experiments with different training data but same testing data were made. Table 8 illustrates not trained examples in experiment 1 and Table 9 not trained examples in experiment 2.
Class Feature 1 Feature 21 4 41 6 63 1 33 5 74 1 24 2 15 0 46 2 78 1 68 7 0
Table 8: Not trained examples in experiment 1
Class Feature 1 Feature 22 7 63 0 26 0 56 4 17 0 67 7 18 5 2
Table 9: Not trained examples in experiment 2
530

3. RESULTS
To compare results the grid-searched algorithm and the SIGA were executed with the same training and testing data.
3.1. Sleep classification Table 10 contains the results of sleep-stage classification for the grid searched and the SIGA with training and testing data.
grid SIGAtrain test train test
2 class 90.50% 82.02% 91.00% 83.44%3 class 88.00% 68.93% 89.33% 69.53%4 class 78.50% 64.39% 79.25% 64.54%5 class 62.60% 52.14% 63.20% 52.86%6 class 51.83% 50.84% 52.00% 51.71%7 class 48.86% 48.75% 48.86% 46.59%8 class 52.75% 43.18% 53.00% 43.20%
Table 10: Classification quality of sleep data with grid-searched algorithm and SIGA for different
classes in percent
Table 10 clarifies that in most cases the SIGA has an advantage compared to the grid-searched algorithm. Only in the seven class classification the grid searched algorithm found better parameters. This circumstance is illustrated in Figure 3. It demonstrates the difference between classification quality of genetic algorithm and grid searched one.
Figure 3: Difference between SIGA and grid-searched algorithm
Furthermore it is recognizable that with the number of classes the quantity of correct classified data decrease. Table 11 show the correct classified data of all calculations.
3.2. XOR-problem In the first experiment the grid-searched algorithm detected parameters for SVM classification, which had classified training data about 88.3%. Testing data afterwards were classified with 88% accuracy.
grid SIGAcorrect correct total
2 class 12799 13021 156053 class 10626 10720 154164 class 9926 9950 154165 class 8038 8149 154166 class 7934 8069 156057 class 7607 7270 156058 class 6849 6852 15862
Table 11: Classification quality of sleep test data with grid-searched algorithm and SIGA for different classes in number of total and correct classified data
Although all trained examples were classified correctly, only two of the not trained examples were generalised, the first and the third one of Table 8.
In contrast the SIGA could find parameters, which trained training data about 94.17% and classified testing data about 91.88%. All trained data were classified correctly and five of the ten not trained examples could be generalised, the first, the second, the third, the ninth and the last one of Table 8.
In experiment 2 the grid-searched algorithm found parameter, which classified training data with an accuracy of 87.5% and testing data with 92.63%. The SIGA detected better parameters with 90% for training data and 93.63% for testing data. In Table 12 all classification qualities are presented.
Experiment
grid SIGAtrain test train test
1 88.3% 88% 94.17% 91.88%2 87.5% 92.63% 90% 93.63%
Table 12: Classification quality for the XOR problem
All trained examples could classify correctly with the parameters of the SIGA and the last three of the seven not trained examples.
The parameter of the grid-searched algorithm was able to generalise five of the seven not trained examples in Table 9. Only the second and the third not trained example could not be generalised. But even trained examples were classified wrong in the testing stage.
4. CONCLUSION
The main problem of a genetic algorithm with so much optimization criteria is the non-dominate sorting in combination with the crowding-sorting by Deb. When the number of criteria is high there are more individuals who are indifferent, that means grant fronts. In crowding-sorting by calculating crowding distance the bordering individuals were always selected. That, the huge fronts and the selected
531

bordering solutions, is the reason why many poor solutions were selected.
By using another non-dominate sorting, which was described in part 2.4, the fronts could get smaller and more superior solutions were selected.
In contrast to Deb’s algorithm the SIGA reduces the needed number of population structures. By searching only the needed fronts the SIGA becomes more efficient.
The SIGA compared with the grid-searched one could find in most cases better parameters , which do not only increase classification quality, which is shown in part 3.1, they also generalise more not trained examples, which is describe in part 3.2. Because the SIGA based on random processes it is naturally possible that in individual case it could not find a better result. But the results of the studies sign that the SIGA compared with the grid-searched algorithm reach better solutions.
In summary a special program for genetic optimizing of parameter for SVM-sleep classification was originated. This was adapted especially for sleep-stage classification because it involves the confusion matrix as criteria.
5. REFERENCES
[1] N. Srinivas, and K. Deb, “Multiobjective Optimization Using Nondominated Sorting in Genetic Algorithms”, Evolutionary Computation, MIT Press Cambridge, MA, USA, 1994.
[2] K. Deb, A. Pratap, S. Agarwal, and T. Meyarivan, “A fast and elitist Multi-objective genetic algorithm: NSGA-II”, Evolutionary Computation, 07 August 2002, pp. 182-197.
[3] K. Deb, Multi-Objective Optimization using Evolutionary Algorithms, John Wiley & Sons, Chichester, 2001.
[4] C.-W. Hsu, C.C. Chang, C.-J.Lin, “A Practical Guid to Support Vector Classification.”, www.csie.ntu.edu.tw/~cjlin, 20 December 2007.
[5] M. Krautwald, R. Baumgart-Schmitt, D. Trommer, C. Walther, and C. Menz, „Kerneluntersuchungen SVM-basierter Klassifikation von Schlaf“, Tag der Forschung 2010, Fachhochschule Schmalkalden, Schmalkalden, pp. 101-104, 2010
532