5/5/2015dm software1 reading the holter ecg report premier 12
TRANSCRIPT
04/18/23 DM Software 1
Reading the Holter ECG Report
Premier 12
04/18/23 DM Software 2
Introduction Included in a Holter ECG recording are the following ECG
testing modalities.
These tests include the following:
* Standard Holter ECG with Full Disclosure * Heart Rate Variability (Time Domain and Frequency) * SAECG Late Potentials * ST 12-Lead Enhanced * QT, QTc, and QTd * VCG (Vectorcardiogram) * Sleep Apnea * Atrial Fibrillation * Pacemaker * FCG CADgram * Heart Rate Turbulence (soon) * T-Wave Alterans

04/18/23 DM Software 3
Topics of Discussion
The following slides will describe:
(1) your responsibility in getting high quality reports
(2) how to read the reports (3) medical reference articles on the
various subject matters
04/18/23 DM Software 4
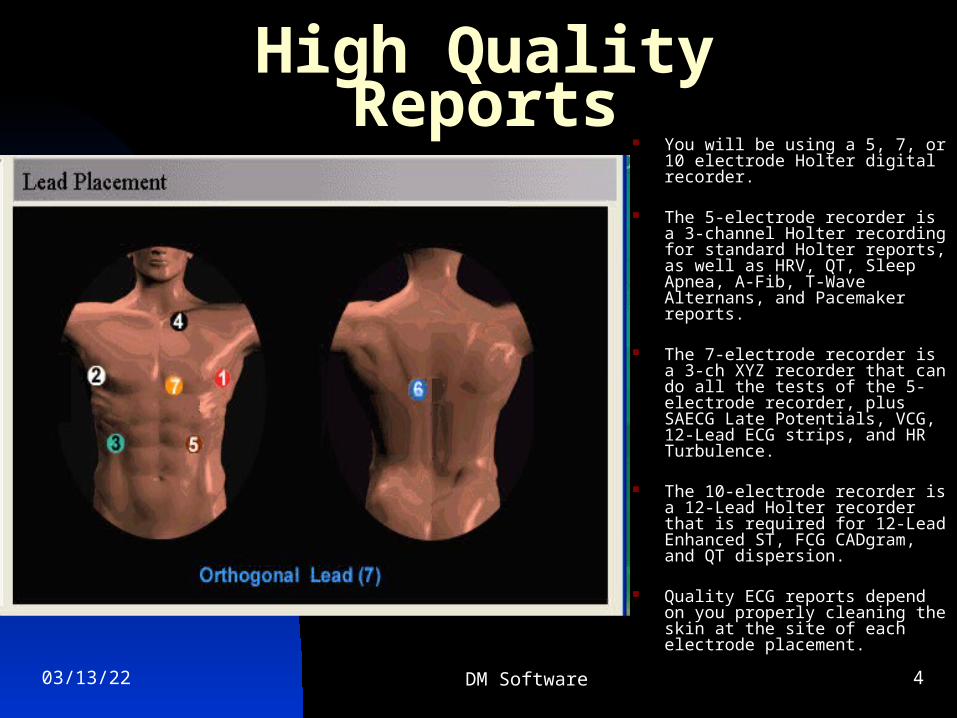
High Quality Reports You will be using a 5, 7, or 10
electrode Holter digital recorder.
The 5-electrode recorder is a 3-channel Holter recording for standard Holter reports, as well as HRV, QT, Sleep Apnea, A-Fib, T-Wave Alternans, and Pacemaker reports.
The 7-electrode recorder is a 3-ch XYZ recorder that can do all the tests of the 5-electrode recorder, plus SAECG Late Potentials, VCG, 12-Lead ECG strips, and HR Turbulence.
The 10-electrode recorder is a 12-Lead Holter recorder that is required for 12-Lead Enhanced ST, FCG CADgram, and QT dispersion.
Quality ECG reports depend on you properly cleaning the skin at the site of each electrode placement.
04/18/23 DM Software 5
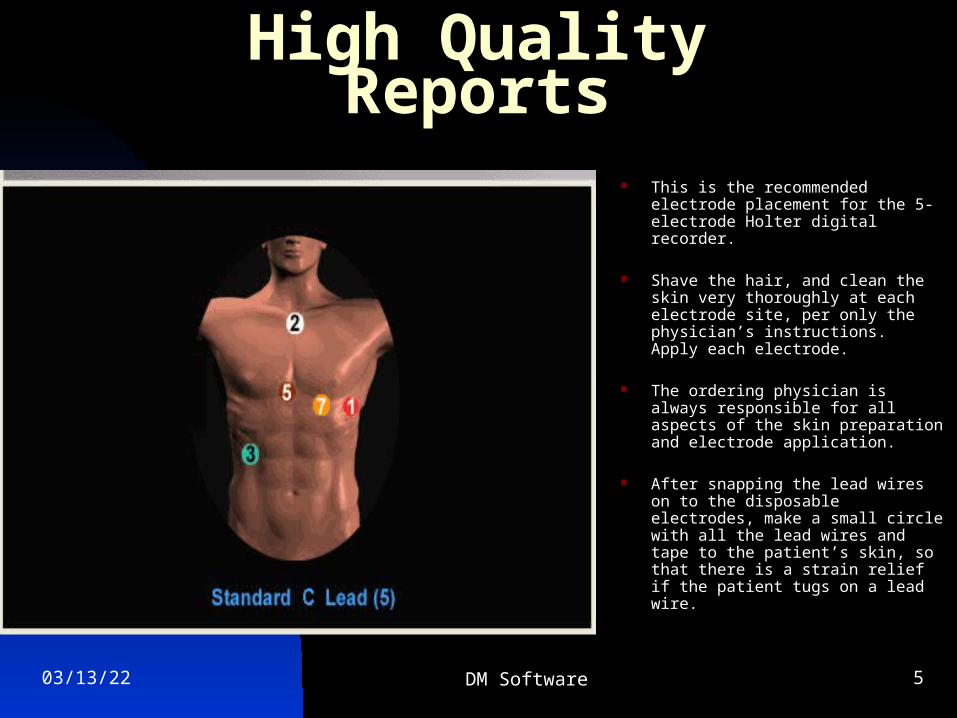
High Quality Reports
This is the recommended electrode placement for the 5-electrode Holter digital recorder.
Shave the hair, and clean the skin very thoroughly at each electrode site, per only the physician’s instructions. Apply each electrode.
The ordering physician is always responsible for all aspects of the skin preparation and electrode application.
After snapping the lead wires on to the disposable electrodes, make a small circle with all the lead wires and tape to the patient’s skin, so that there is a strain relief if the patient tugs on a lead wire.
04/18/23 DM Software 6
High Quality Reports
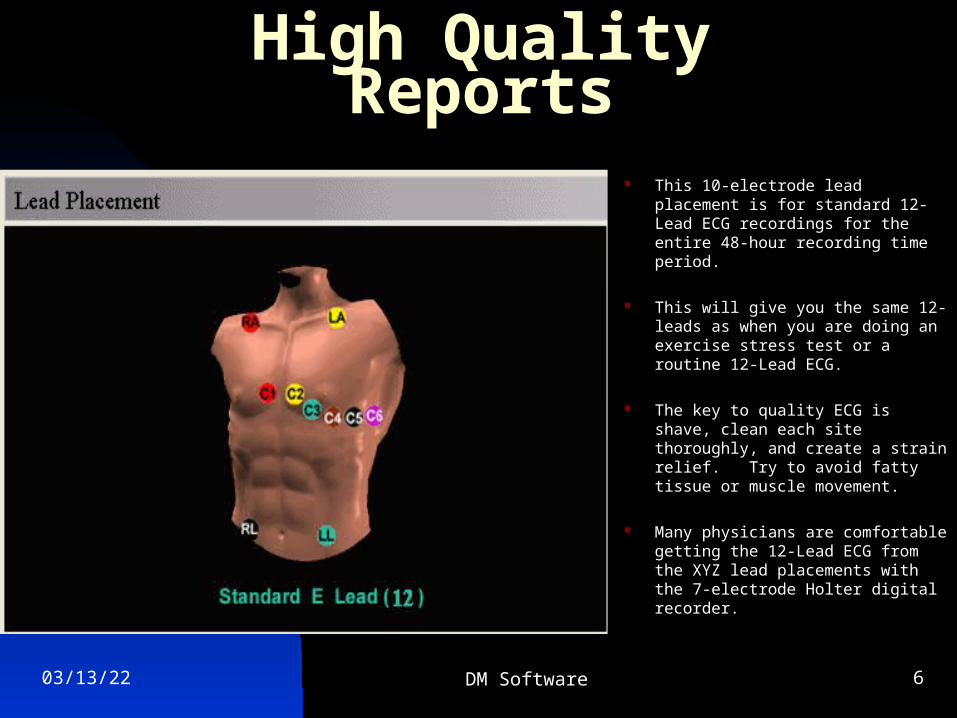
This 10-electrode lead placement is for standard 12-Lead ECG recordings for the entire 48-hour recording time period.
This will give you the same 12-leads as when you are doing an exercise stress test or a routine 12-Lead ECG.
The key to quality ECG is shave, clean each site thoroughly, and create a strain relief. Try to avoid fatty tissue or muscle movement.
Many physicians are comfortable getting the 12-Lead ECG from the XYZ lead placements with the 7-electrode Holter digital recorder.
04/18/23 DM Software 7
How to Read the Holter Reports
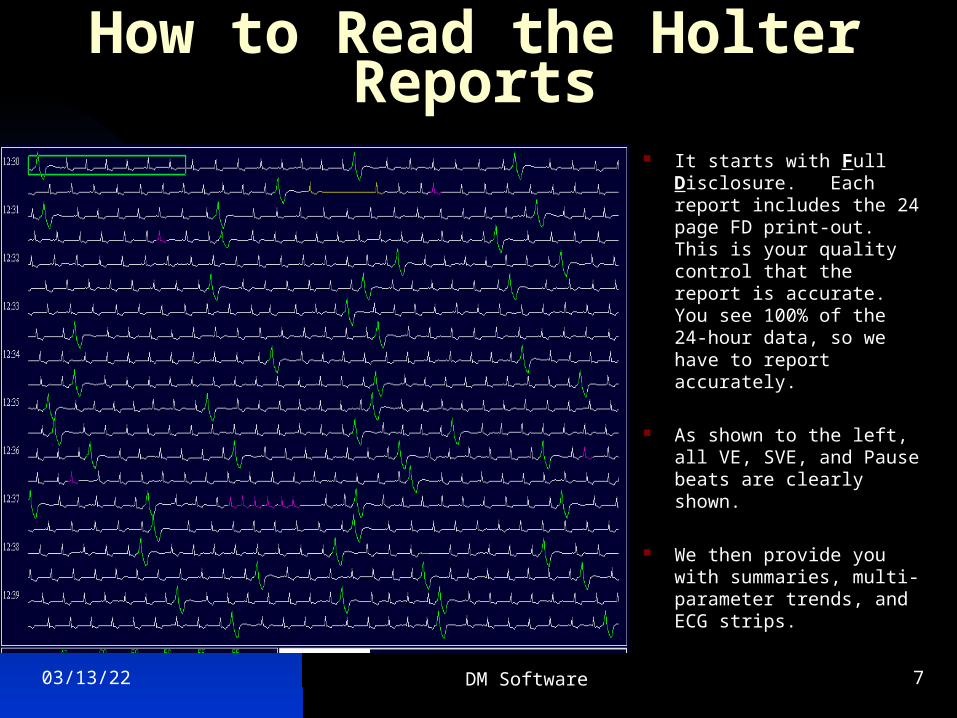
It starts with Full Disclosure. Each report includes the 24 page FD print-out. This is your quality control that the report is accurate. You see 100% of the 24-hour data, so we have to report accurately.
As shown to the left, all VE, SVE, and Pause beats are clearly shown.
We then provide you with summaries, multi-parameter trends, and ECG strips.
04/18/23 DM Software 8
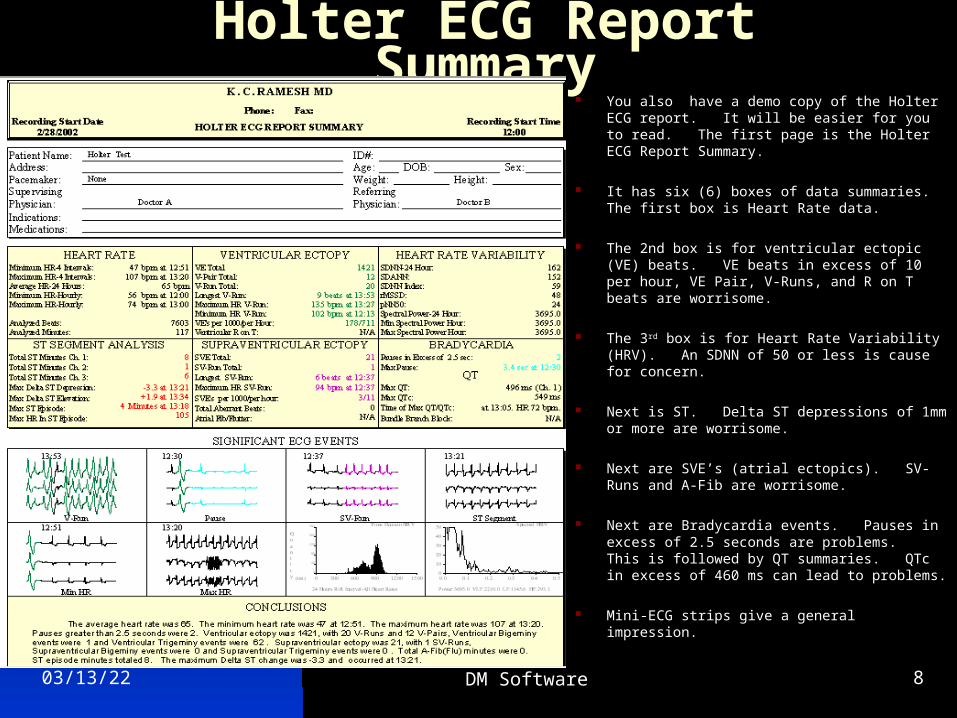
Holter ECG Report Summary You also have a demo copy of the Holter ECG
report. It will be easier for you to read. The first page is the Holter ECG Report Summary.
It has six (6) boxes of data summaries. The first box is Heart Rate data.
The 2nd box is for ventricular ectopic (VE) beats. VE beats in excess of 10 per hour, VE Pair, V-Runs, and R on T beats are worrisome.
The 3rd box is for Heart Rate Variability (HRV). An SDNN of 50 or less is cause for concern.
Next is ST. Delta ST depressions of 1mm or more are worrisome.
Next are SVE’s (atrial ectopics). SV-Runs and A-Fib are worrisome.
Next are Bradycardia events. Pauses in excess of 2.5 seconds are problems. This is followed by QT summaries. QTc in excess of 460 ms can lead to problems.
Mini-ECG strips give a general impression.
04/18/23 DM Software 9
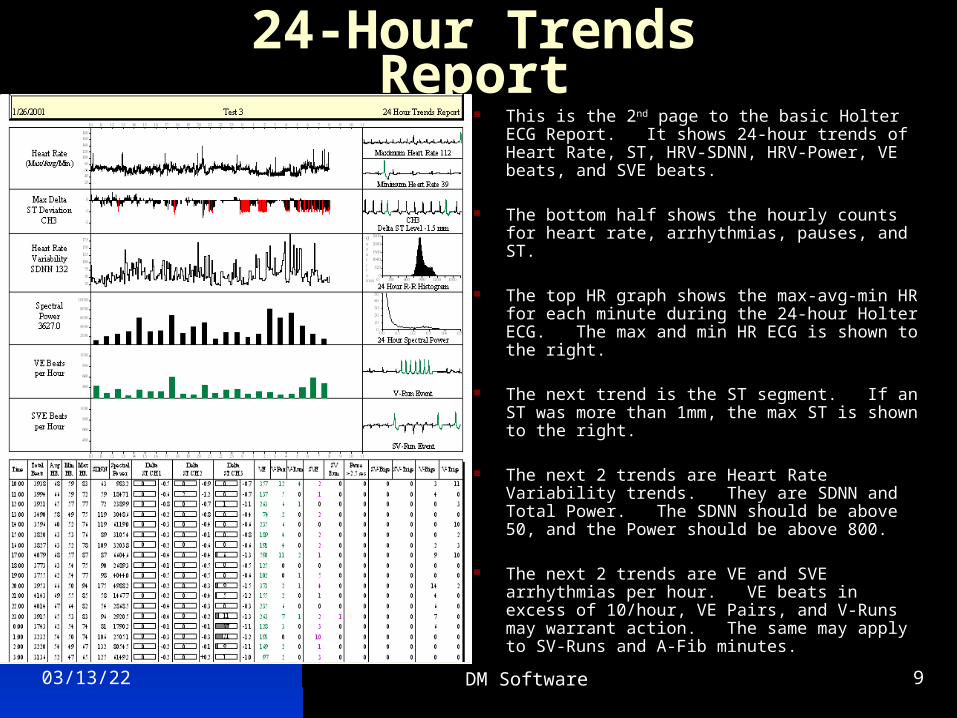
24-Hour Trends Report This is the 2nd page to the basic Holter ECG
Report. It shows 24-hour trends of Heart Rate, ST, HRV-SDNN, HRV-Power, VE beats, and SVE beats.
The bottom half shows the hourly counts for heart rate, arrhythmias, pauses, and ST.
The top HR graph shows the max-avg-min HR for each minute during the 24-hour Holter ECG. The max and min HR ECG is shown to the right.
The next trend is the ST segment. If an ST was more than 1mm, the max ST is shown to the right.
The next 2 trends are Heart Rate Variability trends. They are SDNN and Total Power. The SDNN should be above 50, and the Power should be above 800.
The next 2 trends are VE and SVE arrhythmias per hour. VE beats in excess of 10/hour, VE Pairs, and V-Runs may warrant action. The same may apply to SV-Runs and A-Fib minutes.
04/18/23 DM Software 10
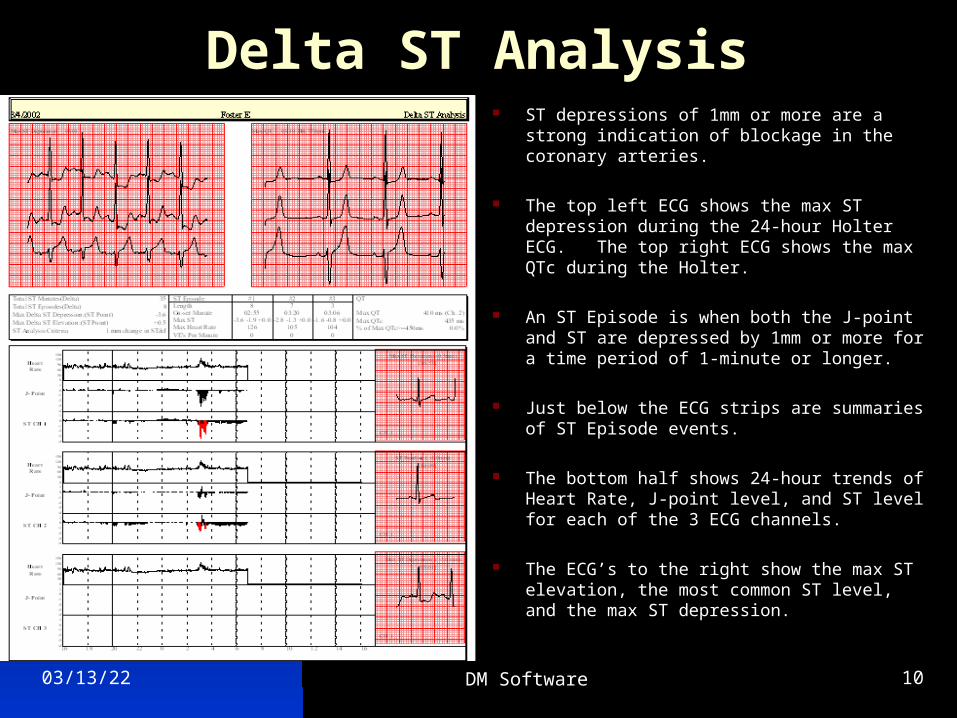
Delta ST Analysis ST depressions of 1mm or more are a strong
indication of blockage in the coronary arteries.
The top left ECG shows the max ST depression during the 24-hour Holter ECG. The top right ECG shows the max QTc during the Holter.
An ST Episode is when both the J-point and ST are depressed by 1mm or more for a time period of 1-minute or longer.
Just below the ECG strips are summaries of ST Episode events.
The bottom half shows 24-hour trends of Heart Rate, J-point level, and ST level for each of the 3 ECG channels.
The ECG’s to the right show the max ST elevation, the most common ST level, and the max ST depression.
04/18/23 DM Software 11
ECG Strips
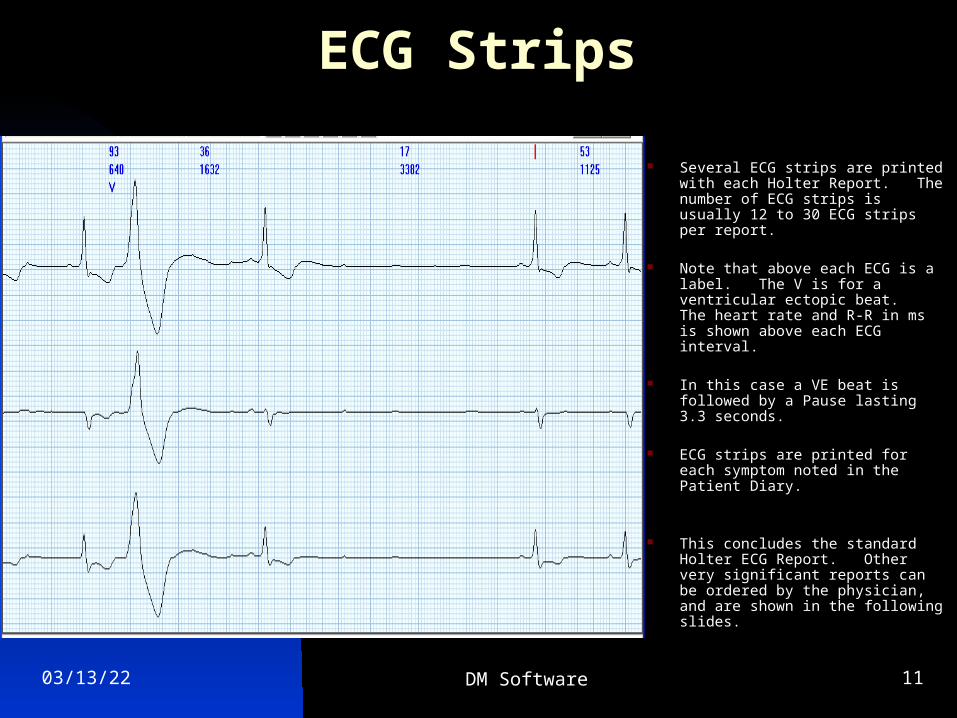
Several ECG strips are printed with each Holter Report. The number of ECG strips is usually 12 to 30 ECG strips per report.
Note that above each ECG is a label. The V is for a ventricular ectopic beat. The heart rate and R-R in ms is shown above each ECG interval.
In this case a VE beat is followed by a Pause lasting 3.3 seconds.
ECG strips are printed for each symptom noted in the Patient Diary.
This concludes the standard Holter ECG Report. Other very significant reports can be ordered by the physician, and are shown in the following slides.
04/18/23 DM Software 12
Heart Rate VariabilityTime Domain and Frequency
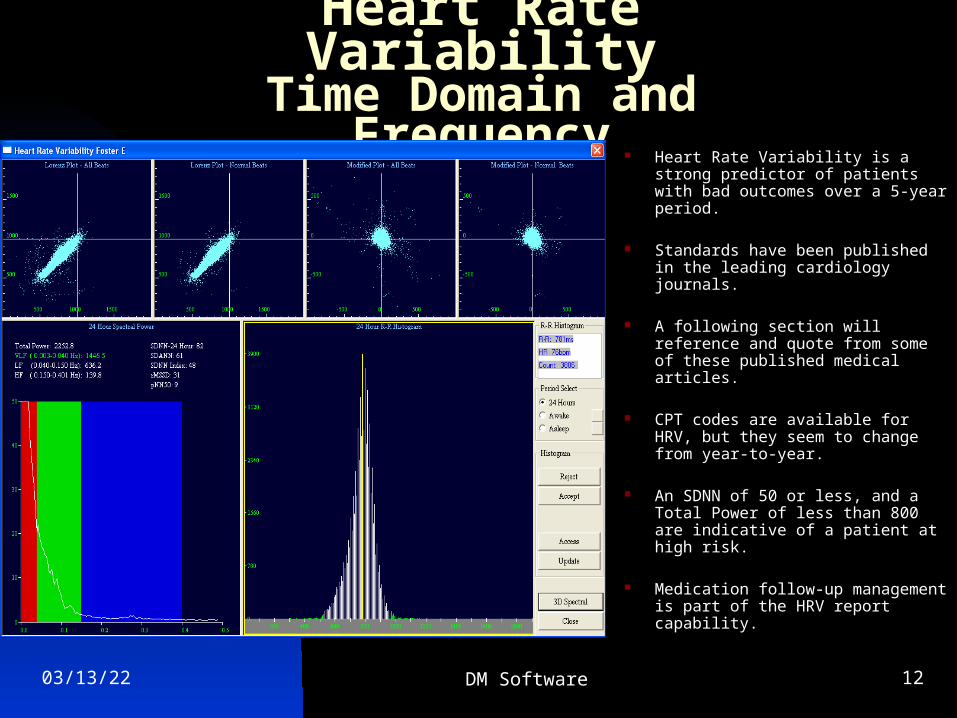
Heart Rate Variability is a strong predictor of patients with bad outcomes over a 5-year period.
Standards have been published in the leading cardiology journals.
A following section will reference and quote from some of these published medical articles.
CPT codes are available for HRV, but they seem to change from year-to-year.
An SDNN of 50 or less, and a Total Power of less than 800 are indicative of a patient at high risk.
Medication follow-up management is part of the HRV report capability.
04/18/23 DM Software 13
Heart Rate VariabilityTime Domain and Frequency
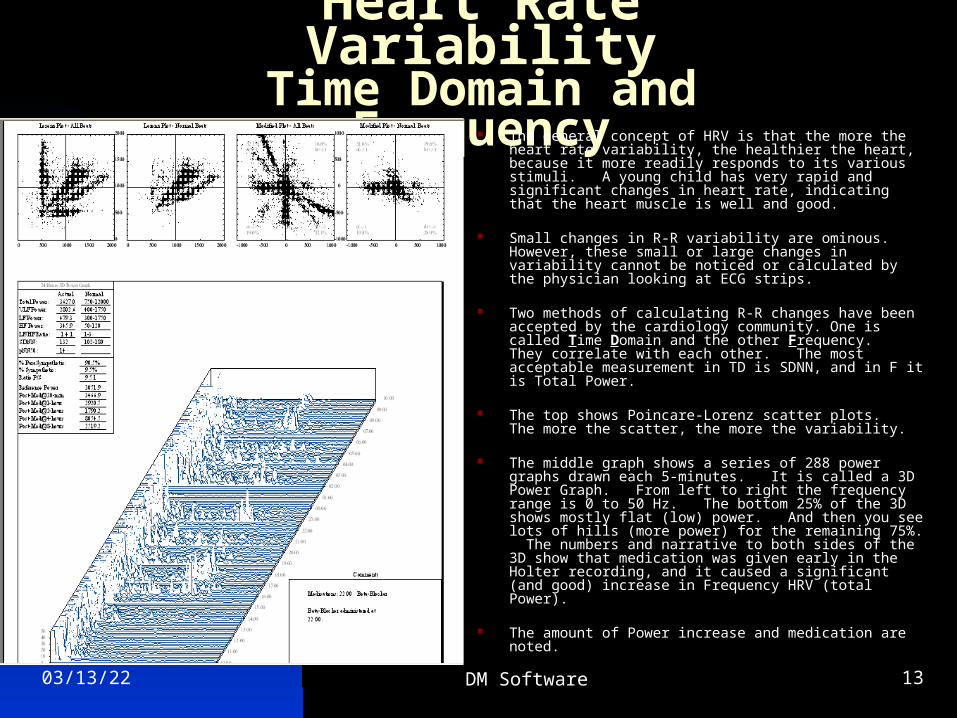
The general concept of HRV is that the more the heart rate variability, the healthier the heart, because it more readily responds to its various stimuli. A young child has very rapid and significant changes in heart rate, indicating that the heart muscle is well and good.
Small changes in R-R variability are ominous. However, these small or large changes in variability cannot be noticed or calculated by the physician looking at ECG strips.
Two methods of calculating R-R changes have been accepted by the cardiology community. One is called Time Domain and the other Frequency. They correlate with each other. The most acceptable measurement in TD is SDNN, and in F it is Total Power.
The top shows Poincare-Lorenz scatter plots. The more the scatter, the more the variability.
The middle graph shows a series of 288 power graphs drawn each 5-minutes. It is called a 3D Power Graph. From left to right the frequency range is 0 to 50 Hz. The bottom 25% of the 3D shows mostly flat (low) power. And then you see lots of hills (more power) for the remaining 75%. The numbers and narrative to both sides of the 3D show that medication was given early in the Holter recording, and it caused a significant (and good) increase in Frequency HRV (total Power).
The amount of Power increase and medication are noted.
04/18/23 DM Software 14
Heart Rate VariabilityTime Domain and Frequency
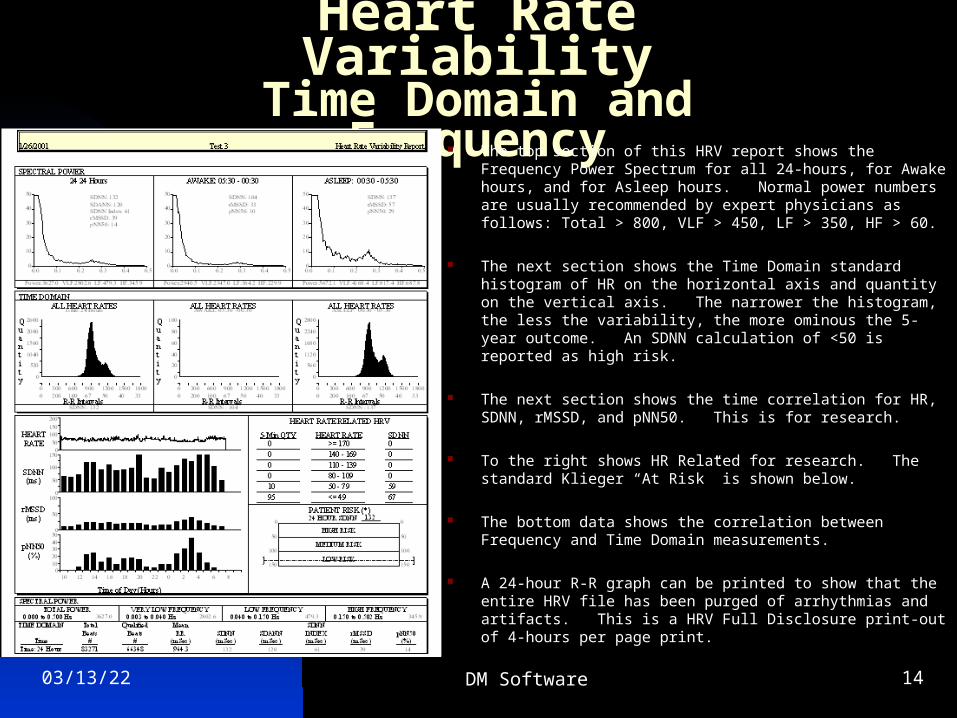
The top section of this HRV report shows the Frequency Power Spectrum for all 24-hours, for Awake hours, and for Asleep hours. Normal power numbers are usually recommended by expert physicians as follows: Total > 800, VLF > 450, LF > 350, HF > 60.
The next section shows the Time Domain standard histogram of HR on the horizontal axis and quantity on the vertical axis. The narrower the histogram, the less the variability, the more ominous the 5-year outcome. An SDNN calculation of <50 is reported as high risk.
The next section shows the time correlation for HR, SDNN, rMSSD, and pNN50. This is for research.
To the right shows HR Related for research. The standard Klieger “At Risk” is shown below.
The bottom data shows the correlation between Frequency and Time Domain measurements.
A 24-hour R-R graph can be printed to show that the entire HRV file has been purged of arrhythmias and artifacts. This is a HRV Full Disclosure print-out of 4-hours per page print.
04/18/23 DM Software 15
SAECG Late Potentials
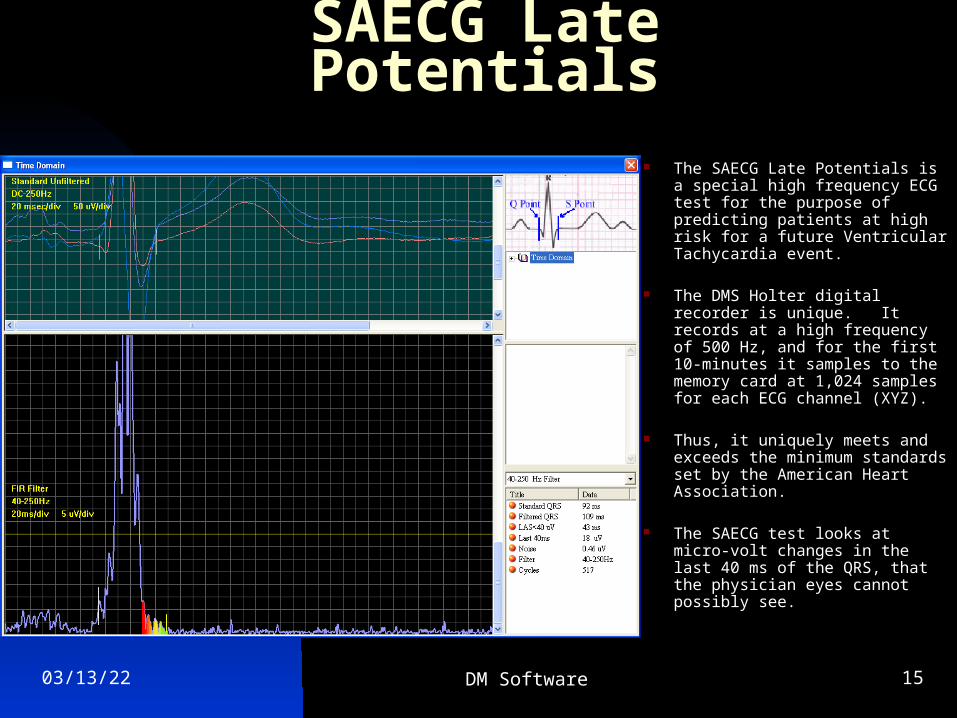
The SAECG Late Potentials is a special high frequency ECG test for the purpose of predicting patients at high risk for a future Ventricular Tachycardia event.
The DMS Holter digital recorder is unique. It records at a high frequency of 500 Hz, and for the first 10-minutes it samples to the memory card at 1,024 samples for each ECG channel (XYZ).
Thus, it uniquely meets and exceeds the minimum standards set by the American Heart Association.
The SAECG test looks at micro-volt changes in the last 40 ms of the QRS, that the physician eyes cannot possibly see.
04/18/23 DM Software 16
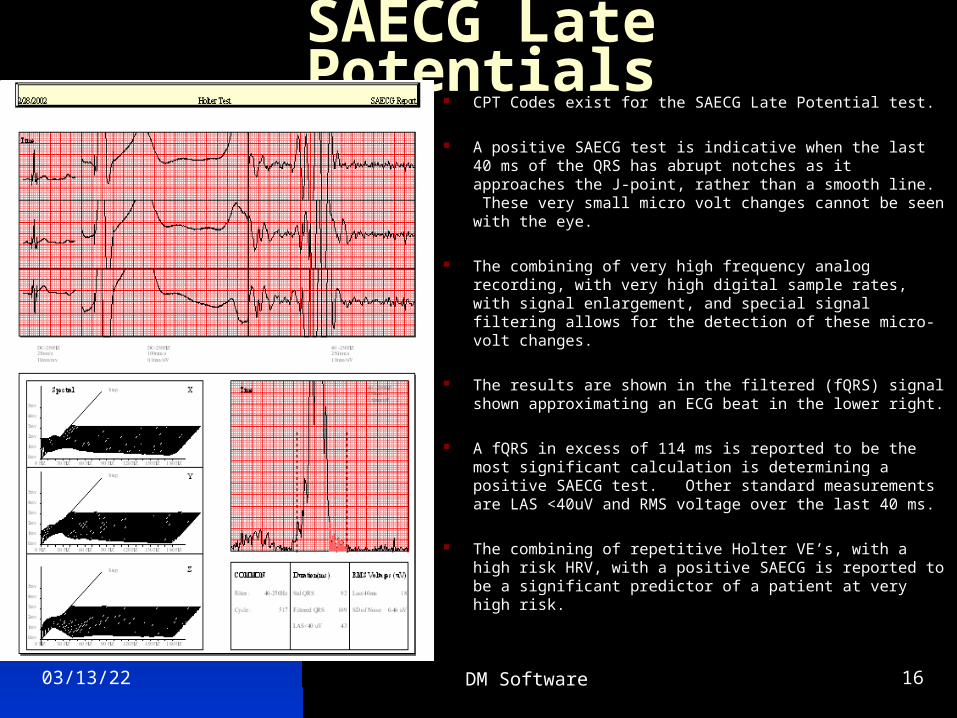
SAECG Late Potentials CPT Codes exist for the SAECG Late Potential test.
A positive SAECG test is indicative when the last 40 ms of the QRS has abrupt notches as it approaches the J-point, rather than a smooth line. These very small micro volt changes cannot be seen with the eye.
The combining of very high frequency analog recording, with very high digital sample rates, with signal enlargement, and special signal filtering allows for the detection of these micro-volt changes.
The results are shown in the filtered (fQRS) signal shown approximating an ECG beat in the lower right.
A fQRS in excess of 114 ms is reported to be the most significant calculation is determining a positive SAECG test. Other standard measurements are LAS <40uV and RMS voltage over the last 40 ms.
The combining of repetitive Holter VE’s, with a high risk HRV, with a positive SAECG is reported to be a significant predictor of a patient at very high risk.
04/18/23 DM Software 17
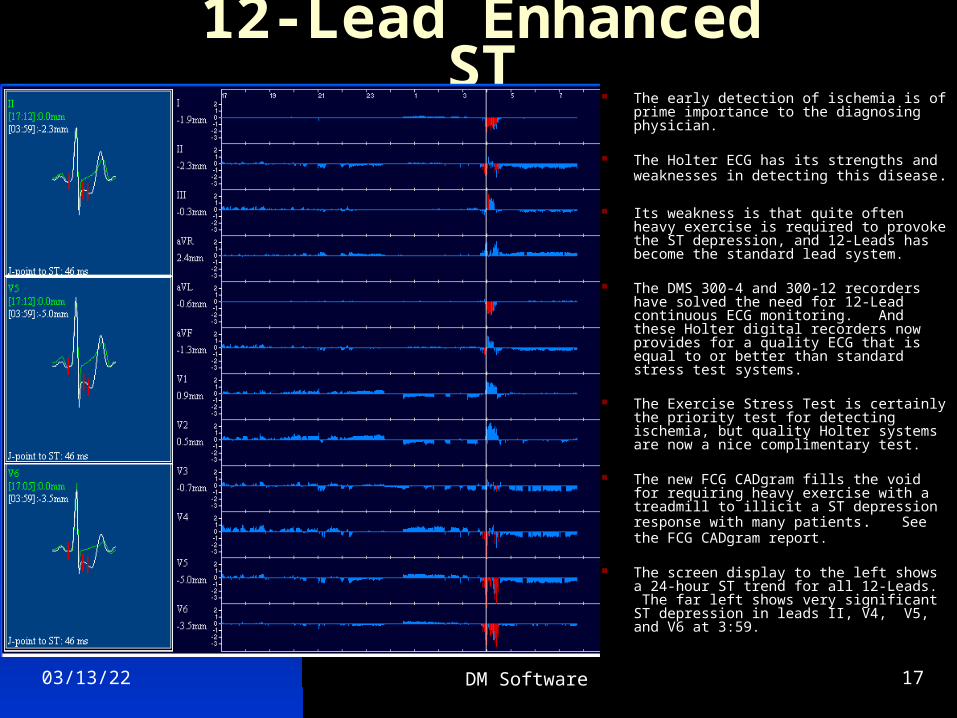
12-Lead Enhanced ST The early detection of ischemia is of prime
importance to the diagnosing physician.
The Holter ECG has its strengths and weaknesses in detecting this disease.
Its weakness is that quite often heavy exercise is required to provoke the ST depression, and 12-Leads has become the standard lead system.
The DMS 300-4 and 300-12 recorders have solved the need for 12-Lead continuous ECG monitoring. And these Holter digital recorders now provides for a quality ECG that is equal to or better than standard stress test systems.
The Exercise Stress Test is certainly the priority test for detecting ischemia, but quality Holter systems are now a nice complimentary test.
The new FCG CADgram fills the void for requiring heavy exercise with a treadmill to illicit a ST depression response with many patients. See the FCG CADgram report.
The screen display to the left shows a 24-hour ST trend for all 12-Leads. The far left shows very significant ST depression in leads II, V4, V5, and V6 at 3:59.
04/18/23 DM Software 18
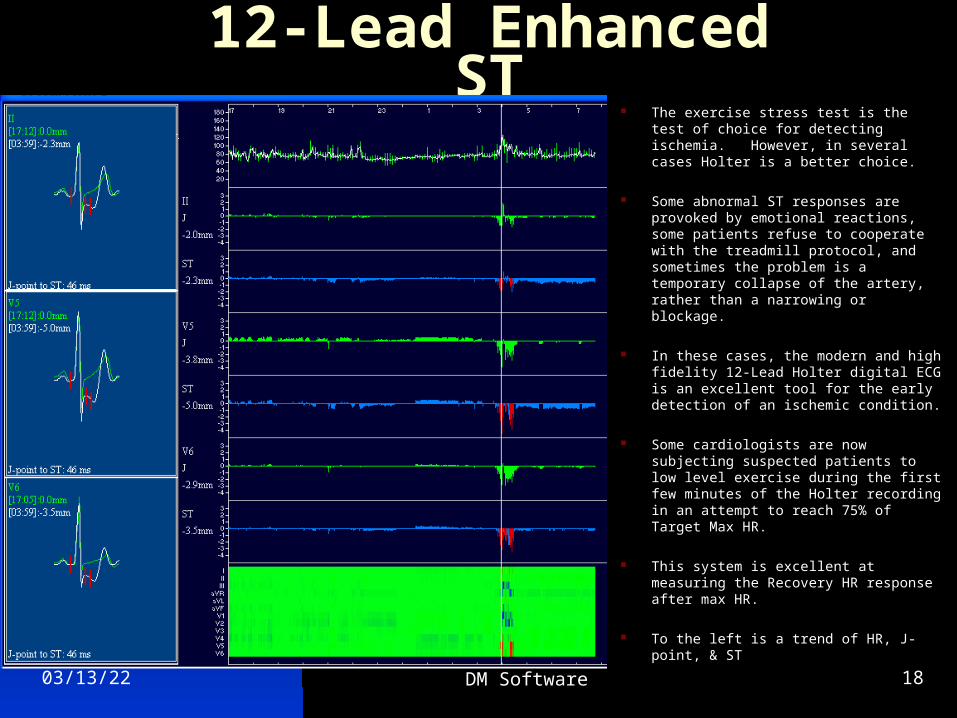
12-Lead Enhanced ST The exercise stress test is the test of
choice for detecting ischemia. However, in several cases Holter is a better choice.
Some abnormal ST responses are provoked by emotional reactions, some patients refuse to cooperate with the treadmill protocol, and sometimes the problem is a temporary collapse of the artery, rather than a narrowing or blockage.
In these cases, the modern and high fidelity 12-Lead Holter digital ECG is an excellent tool for the early detection of an ischemic condition.
Some cardiologists are now subjecting suspected patients to low level exercise during the first few minutes of the Holter recording in an attempt to reach 75% of Target Max HR.
This system is excellent at measuring the Recovery HR response after max HR.
To the left is a trend of HR, J-point, & ST
04/18/23 DM Software 19
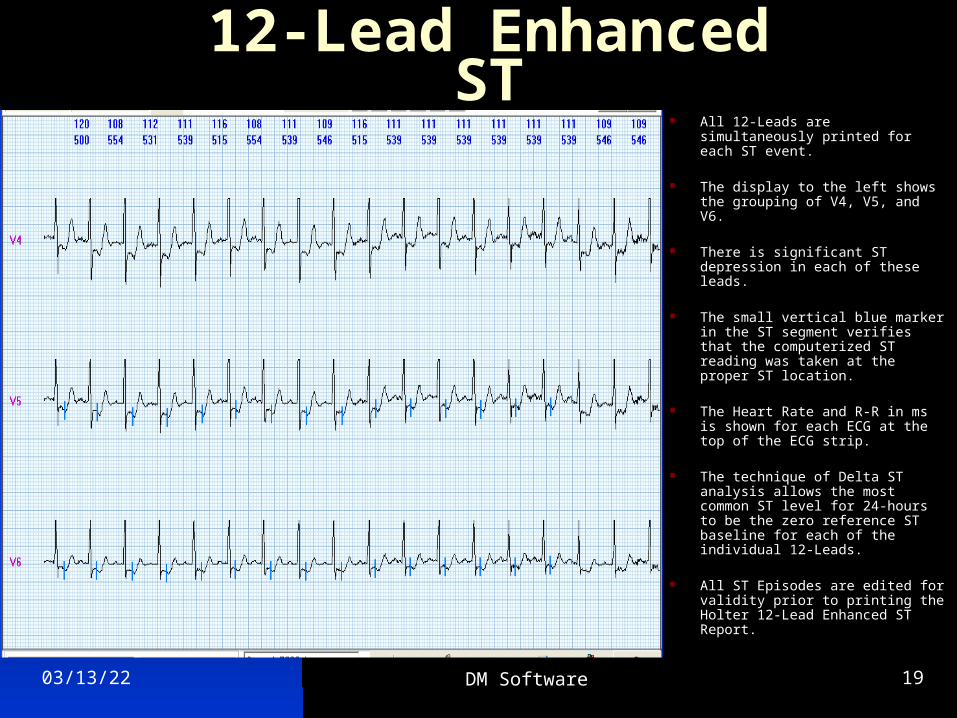
12-Lead Enhanced ST All 12-Leads are simultaneously
printed for each ST event.
The display to the left shows the grouping of V4, V5, and V6.
There is significant ST depression in each of these leads.
The small vertical blue marker in the ST segment verifies that the computerized ST reading was taken at the proper ST location.
The Heart Rate and R-R in ms is shown for each ECG at the top of the ECG strip.
The technique of Delta ST analysis allows the most common ST level for 24-hours to be the zero reference ST baseline for each of the individual 12-Leads.
All ST Episodes are edited for validity prior to printing the Holter 12-Lead Enhanced ST Report.
04/18/23 DM Software 20
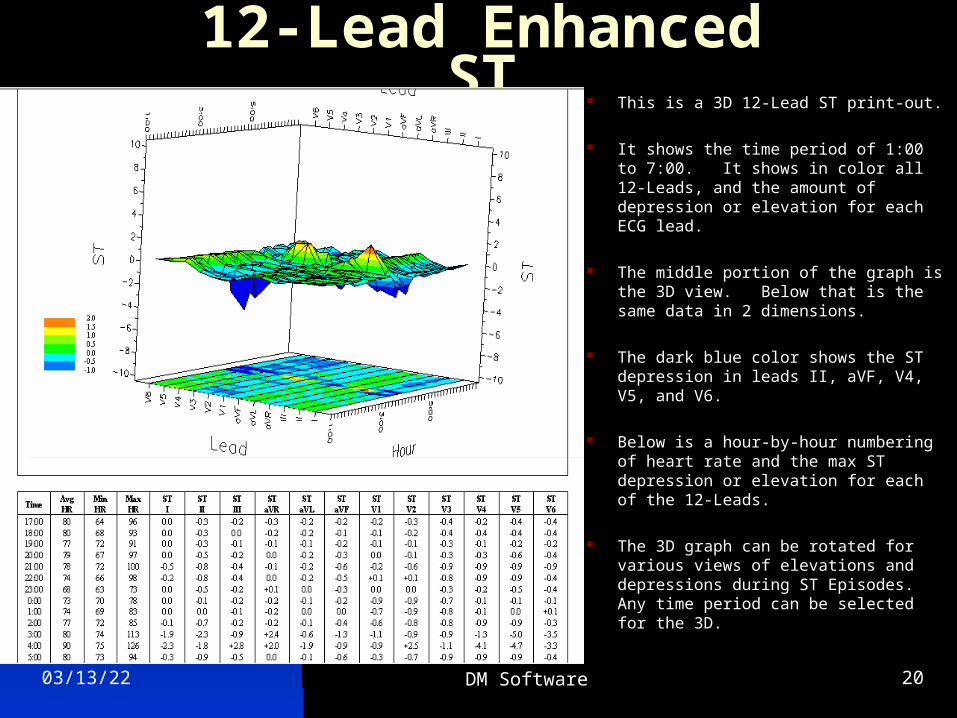
12-Lead Enhanced ST This is a 3D 12-Lead ST print-out.
It shows the time period of 1:00 to 7:00. It shows in color all 12-Leads, and the amount of depression or elevation for each ECG lead.
The middle portion of the graph is the 3D view. Below that is the same data in 2 dimensions.
The dark blue color shows the ST depression in leads II, aVF, V4, V5, and V6.
Below is a hour-by-hour numbering of heart rate and the max ST depression or elevation for each of the 12-Leads.
The 3D graph can be rotated for various views of elevations and depressions during ST Episodes. Any time period can be selected for the 3D.
04/18/23 DM Software 21
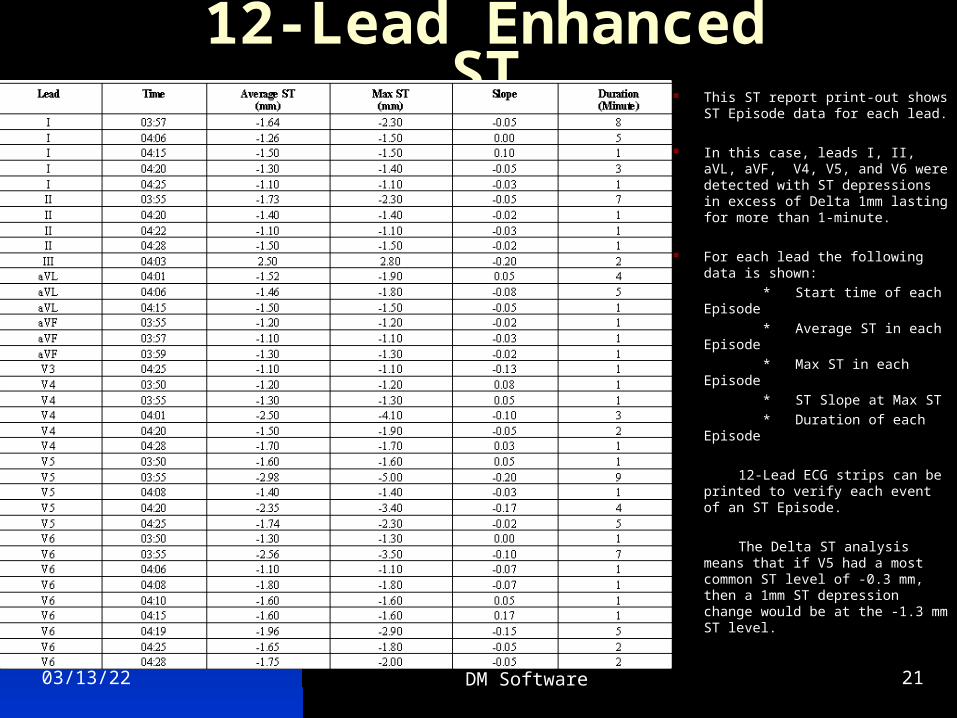
12-Lead Enhanced ST This ST report print-out shows
ST Episode data for each lead.
In this case, leads I, II, aVL, aVF, V4, V5, and V6 were detected with ST depressions in excess of Delta 1mm lasting for more than 1-minute.
For each lead the following data is shown:
* Start time of each Episode
* Average ST in each Episode
* Max ST in each Episode
* ST Slope at Max ST
* Duration of each Episode
12-Lead ECG strips can be printed to verify each event of an ST Episode.
The Delta ST analysis means that if V5 had a most common ST level of -0.3 mm, then a 1mm ST depression change would be at the -1.3 mm ST level.
04/18/23 DM Software 22
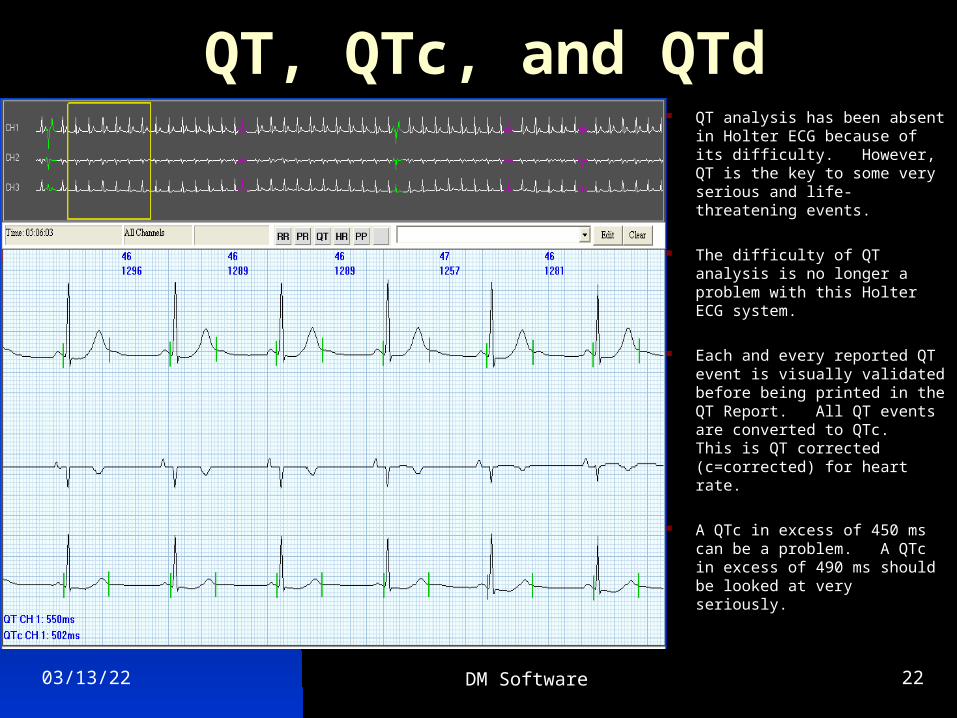
QT, QTc, and QTd QT analysis has been absent
in Holter ECG because of its difficulty. However, QT is the key to some very serious and life-threatening events.
The difficulty of QT analysis is no longer a problem with this Holter ECG system.
Each and every reported QT event is visually validated before being printed in the QT Report. All QT events are converted to QTc. This is QT corrected (c=corrected) for heart rate.
A QTc in excess of 450 ms can be a problem. A QTc in excess of 490 ms should be looked at very seriously.
04/18/23 DM Software 23
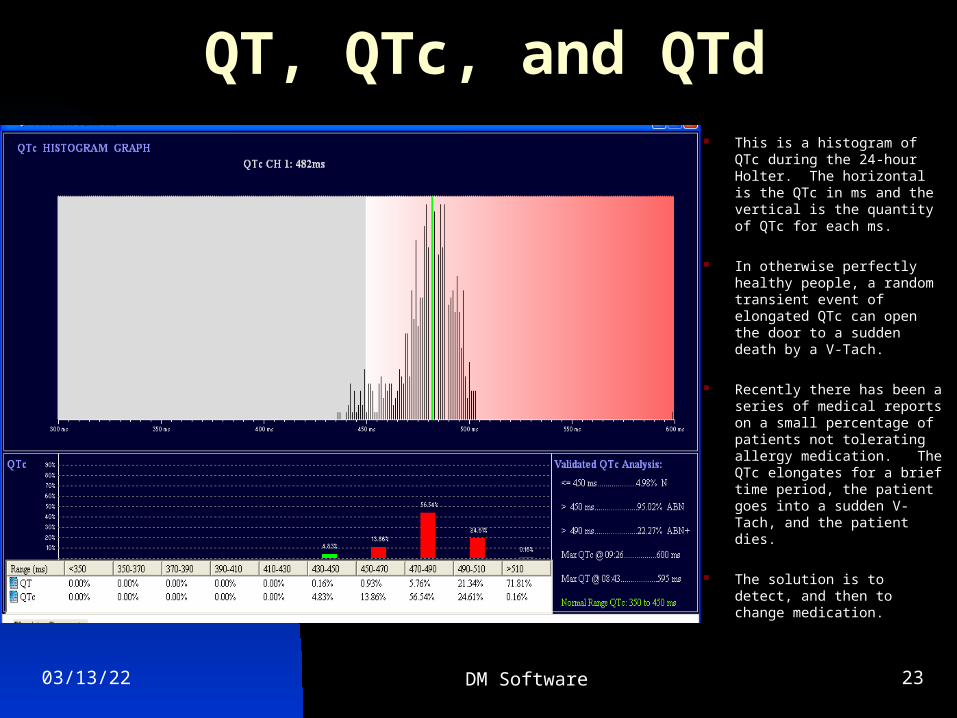
QT, QTc, and QTd This is a histogram of QTc
during the 24-hour Holter. The horizontal is the QTc in ms and the vertical is the quantity of QTc for each ms.
In otherwise perfectly healthy people, a random transient event of elongated QTc can open the door to a sudden death by a V-Tach.
Recently there has been a series of medical reports on a small percentage of patients not tolerating allergy medication. The QTc elongates for a brief time period, the patient goes into a sudden V-Tach, and the patient dies.
The solution is to detect, and then to change medication.
04/18/23 DM Software 24
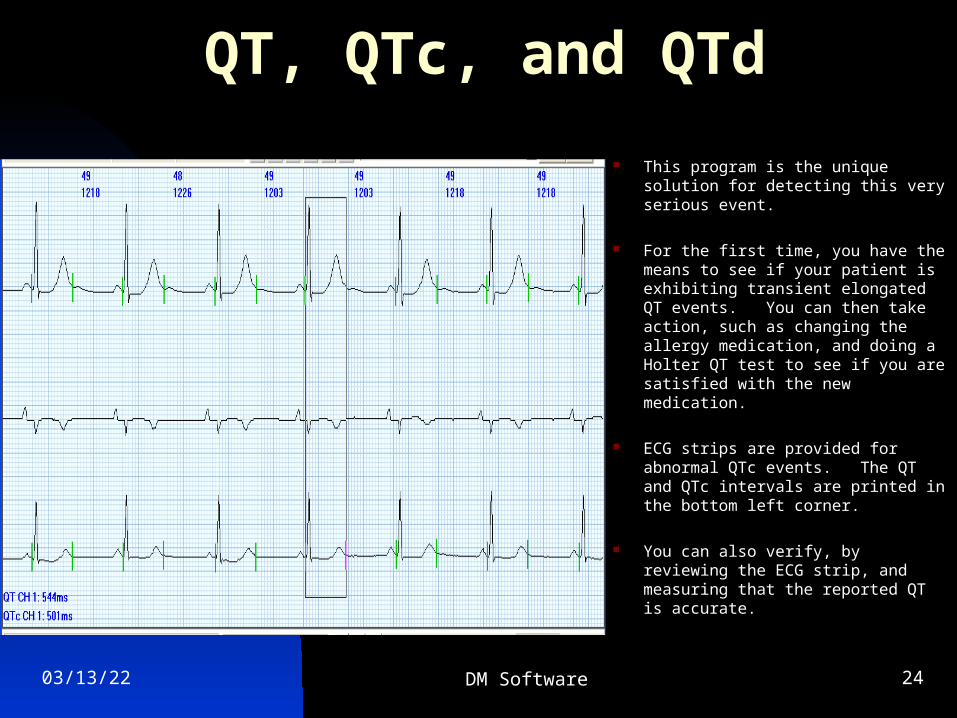
QT, QTc, and QTd
This program is the unique solution for detecting this very serious event.
For the first time, you have the means to see if your patient is exhibiting transient elongated QT events. You can then take action, such as changing the allergy medication, and doing a Holter QT test to see if you are satisfied with the new medication.
ECG strips are provided for abnormal QTc events. The QT and QTc intervals are printed in the bottom left corner.
You can also verify, by reviewing the ECG strip, and measuring that the reported QT is accurate.
04/18/23 DM Software 25
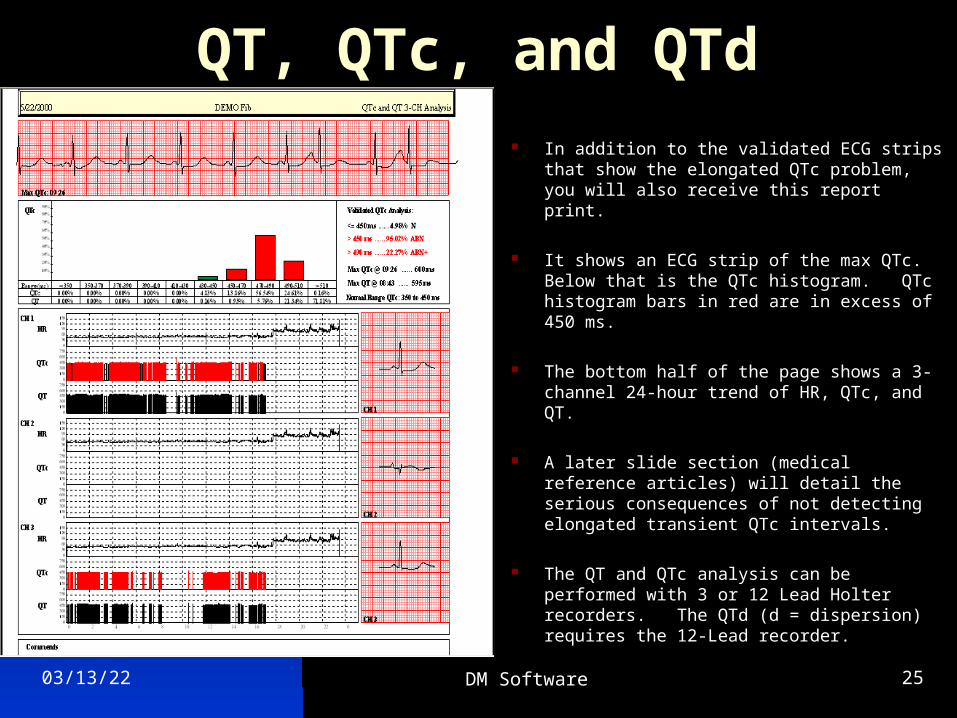
QT, QTc, and QTd In addition to the validated ECG strips that show
the elongated QTc problem, you will also receive this report print.
It shows an ECG strip of the max QTc. Below that is the QTc histogram. QTc histogram bars in red are in excess of 450 ms.
The bottom half of the page shows a 3-channel 24-hour trend of HR, QTc, and QT.
A later slide section (medical reference articles) will detail the serious consequences of not detecting elongated transient QTc intervals.
The QT and QTc analysis can be performed with 3 or 12 Lead Holter recorders. The QTd (d = dispersion) requires the 12-Lead recorder.
04/18/23 DM Software 26
QT, QTc, QTdQT dispersion
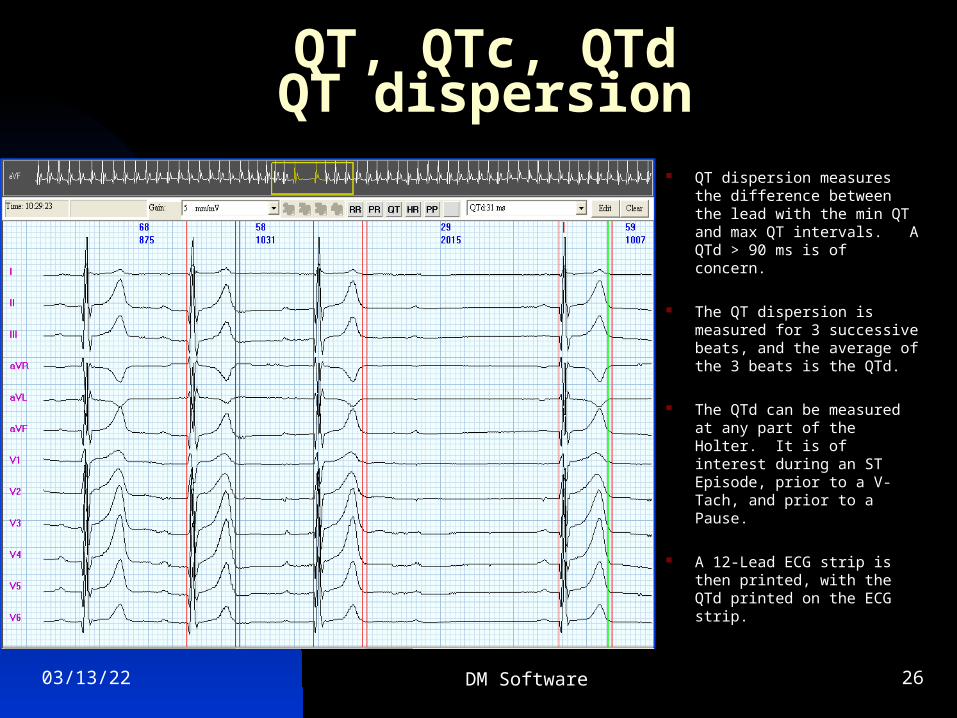
QT dispersion measures the difference between the lead with the min QT and max QT intervals. A QTd > 90 ms is of concern.
The QT dispersion is measured for 3 successive beats, and the average of the 3 beats is the QTd.
The QTd can be measured at any part of the Holter. It is of interest during an ST Episode, prior to a V-Tach, and prior to a Pause.
A 12-Lead ECG strip is then printed, with the QTd printed on the ECG strip.
04/18/23 DM Software 27
VCG (Vectorcardiogram)
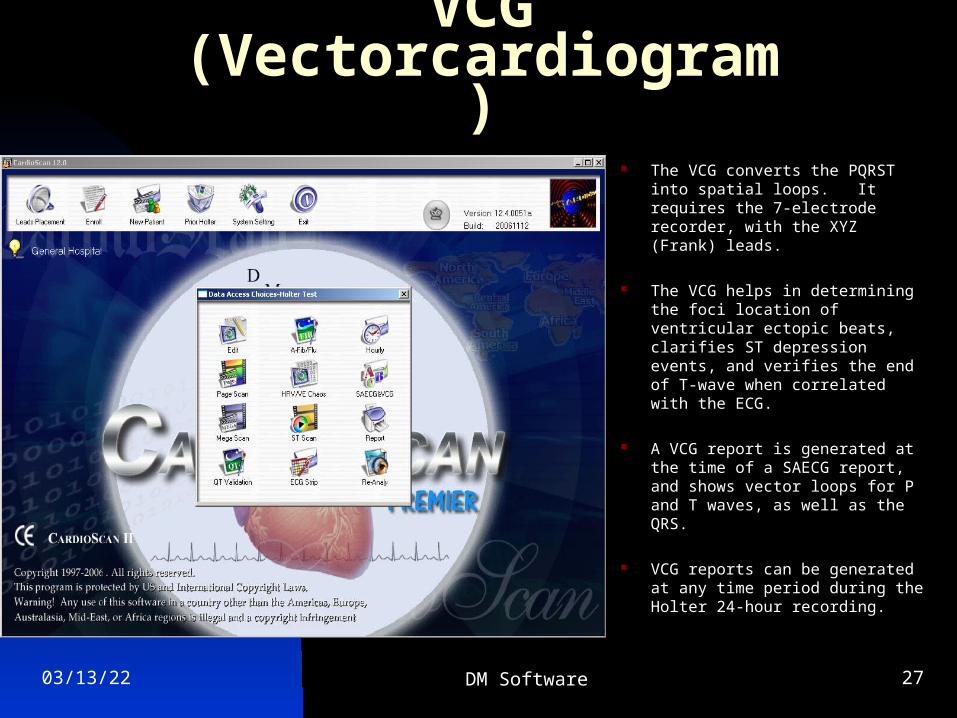
The VCG converts the PQRST into spatial loops. It requires the 7-electrode recorder, with the XYZ (Frank) leads.
The VCG helps in determining the foci location of ventricular ectopic beats, clarifies ST depression events, and verifies the end of T-wave when correlated with the ECG.
A VCG report is generated at the time of a SAECG report, and shows vector loops for P and T waves, as well as the QRS.
VCG reports can be generated at any time period during the Holter 24-hour recording.
04/18/23 DM Software 28
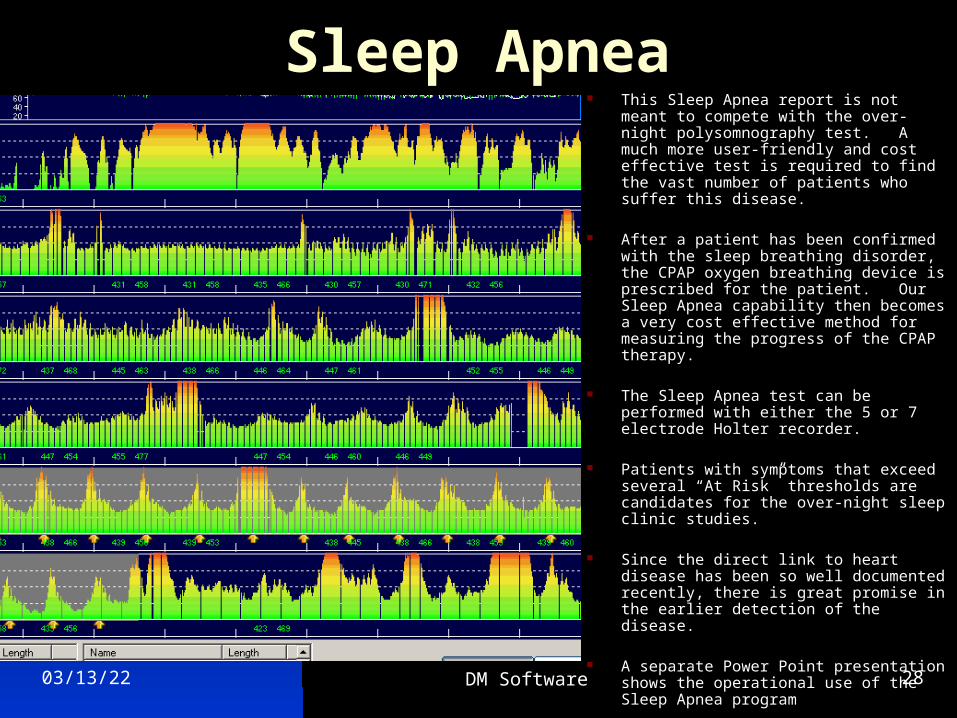
Sleep Apnea This Sleep Apnea report is not meant to
compete with the over-night polysomnography test. A much more user-friendly and cost effective test is required to find the vast number of patients who suffer this disease.
After a patient has been confirmed with the sleep breathing disorder, the CPAP oxygen breathing device is prescribed for the patient. Our Sleep Apnea capability then becomes a very cost effective method for measuring the progress of the CPAP therapy.
The Sleep Apnea test can be performed with either the 5 or 7 electrode Holter recorder.
Patients with symptoms that exceed several “At Risk” thresholds are candidates for the over-night sleep clinic studies.
Since the direct link to heart disease has been so well documented recently, there is great promise in the earlier detection of the disease.
A separate Power Point presentation shows the operational use of the Sleep Apnea program
04/18/23 DM Software 29
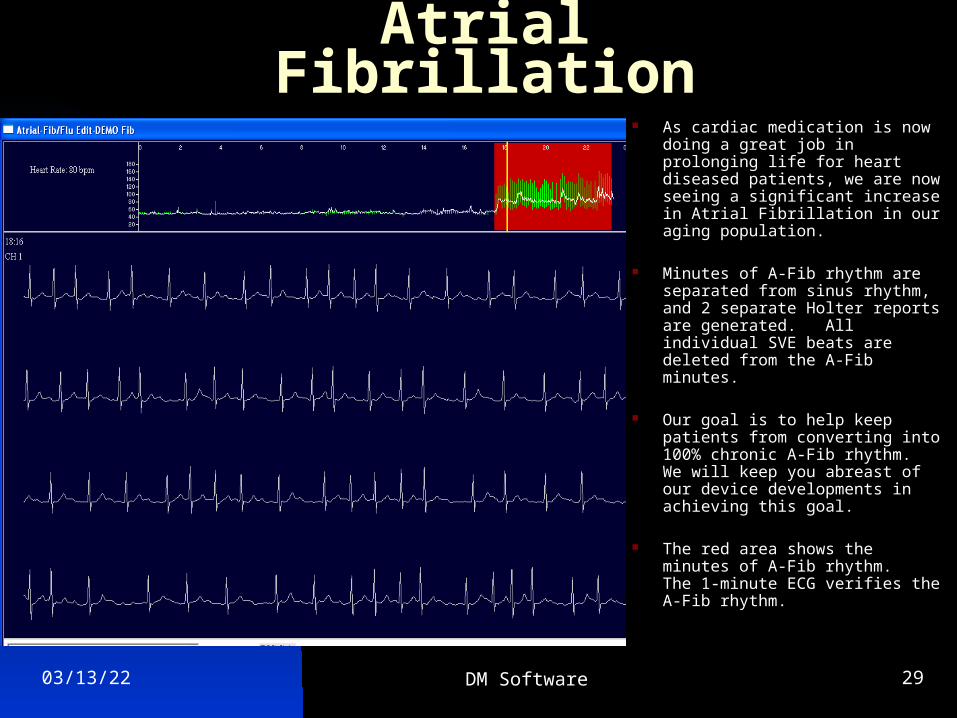
Atrial Fibrillation As cardiac medication is now
doing a great job in prolonging life for heart diseased patients, we are now seeing a significant increase in Atrial Fibrillation in our aging population.
Minutes of A-Fib rhythm are separated from sinus rhythm, and 2 separate Holter reports are generated. All individual SVE beats are deleted from the A-Fib minutes.
Our goal is to help keep patients from converting into 100% chronic A-Fib rhythm. We will keep you abreast of our device developments in achieving this goal.
The red area shows the minutes of A-Fib rhythm. The 1-minute ECG verifies the A-Fib rhythm.
04/18/23 DM Software 30
Pacemaker
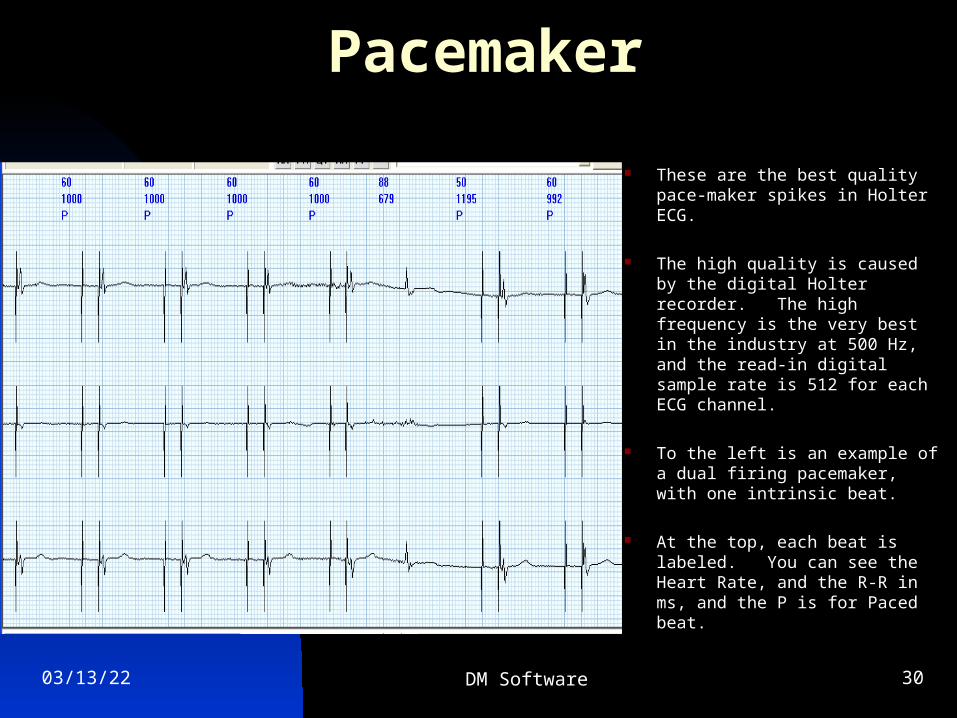
These are the best quality pace-maker spikes in Holter ECG.
The high quality is caused by the digital Holter recorder. The high frequency is the very best in the industry at 500 Hz, and the read-in digital sample rate is 512 for each ECG channel.
To the left is an example of a dual firing pacemaker, with one intrinsic beat.
At the top, each beat is labeled. You can see the Heart Rate, and the R-R in ms, and the P is for Paced beat.
04/18/23 DM Software 31
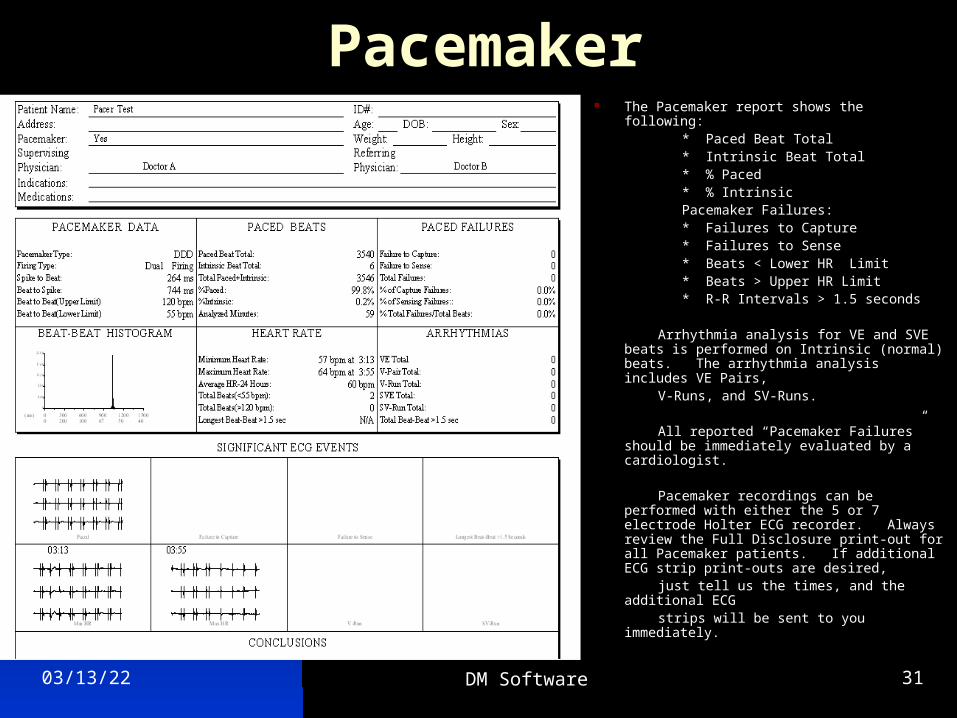
Pacemaker The Pacemaker report shows the following: * Paced Beat Total * Intrinsic Beat Total * % Paced * % Intrinsic Pacemaker Failures: * Failures to Capture * Failures to Sense * Beats < Lower HR Limit * Beats > Upper HR Limit * R-R Intervals > 1.5 seconds
Arrhythmia analysis for VE and SVE beats is performed on Intrinsic (normal) beats. The arrhythmia analysis includes VE Pairs,
V-Runs, and SV-Runs.
All reported “Pacemaker Failures” should be immediately evaluated by a cardiologist.
Pacemaker recordings can be performed with either the 5 or 7 electrode Holter ECG recorder. Always review the Full Disclosure print-out for all Pacemaker patients. If additional ECG strip print-outs are desired,
just tell us the times, and the additional ECG strips will be sent to you immediately.
04/18/23 DM Software 32
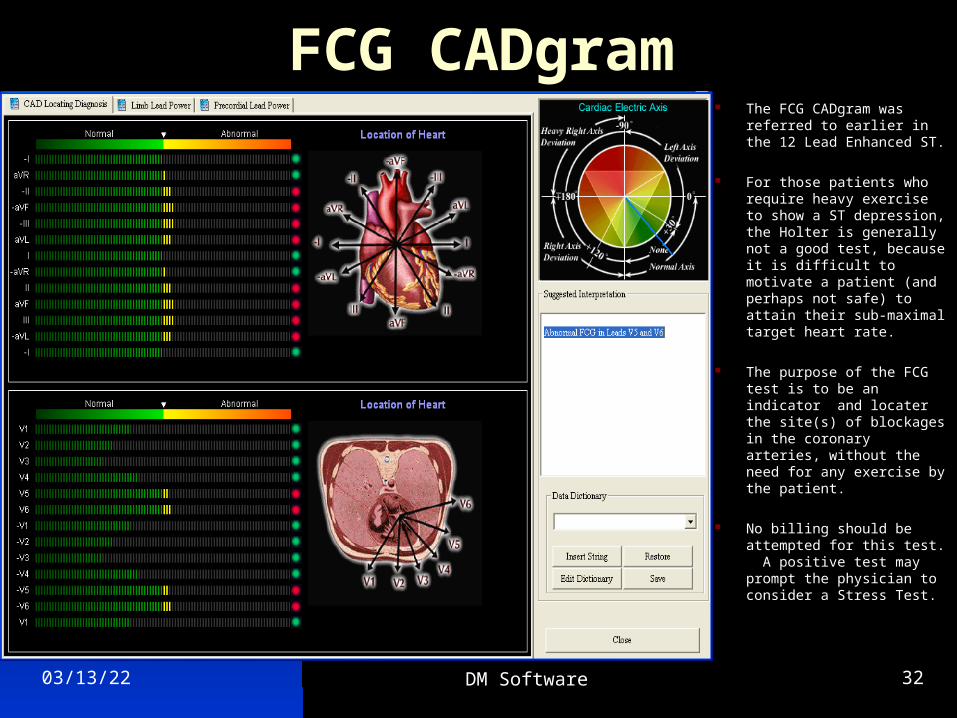
FCG CADgram The FCG CADgram was
referred to earlier in the 12 Lead Enhanced ST.
For those patients who require heavy exercise to show a ST depression, the Holter is generally not a good test, because it is difficult to motivate a patient (and perhaps not safe) to attain their sub-maximal target heart rate.
The purpose of the FCG test is to be an indicator and locater the site(s) of blockages in the coronary arteries, without the need for any exercise by the patient.
No billing should be attempted for this test. A positive test may prompt the physician to consider a Stress Test.
04/18/23 DM Software 33
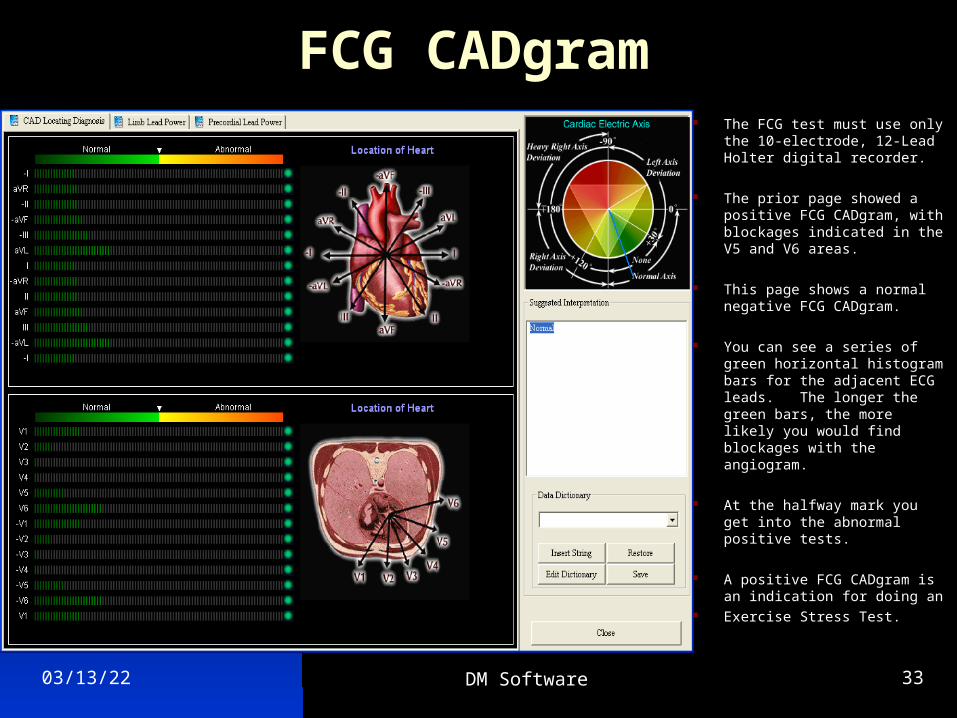
FCG CADgram The FCG test must use only
the 10-electrode, 12-Lead Holter digital recorder.
The prior page showed a positive FCG CADgram, with blockages indicated in the V5 and V6 areas.
This page shows a normal negative FCG CADgram.
You can see a series of green horizontal histogram bars for the adjacent ECG leads. The longer the green bars, the more likely you would find blockages with the angiogram.
At the halfway mark you get into the abnormal positive tests.
A positive FCG CADgram is an indication for doing an
Exercise Stress Test.
04/18/23 DM Software 34
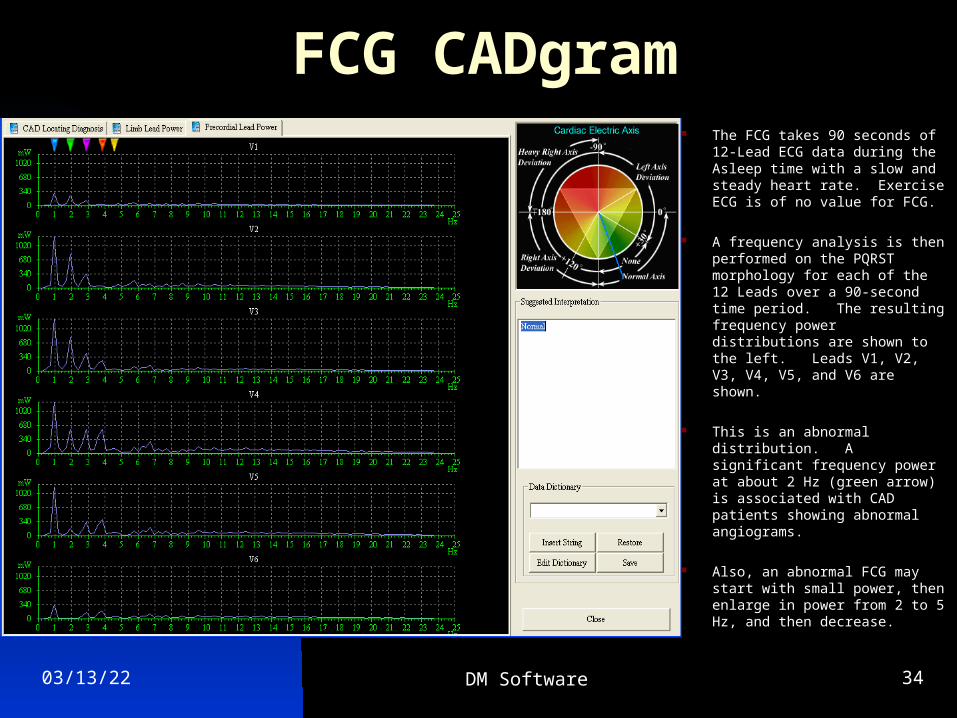
FCG CADgram The FCG takes 90 seconds of
12-Lead ECG data during the Asleep time with a slow and steady heart rate. Exercise ECG is of no value for FCG.
A frequency analysis is then performed on the PQRST morphology for each of the 12 Leads over a 90-second time period. The resulting frequency power distributions are shown to the left. Leads V1, V2, V3, V4, V5, and V6 are shown.
This is an abnormal distribution. A significant frequency power at about 2 Hz (green arrow) is associated with CAD patients showing abnormal angiograms.
Also, an abnormal FCG may start with small power, then enlarge in power from 2 to 5 Hz, and then decrease.
04/18/23 DM Software 35
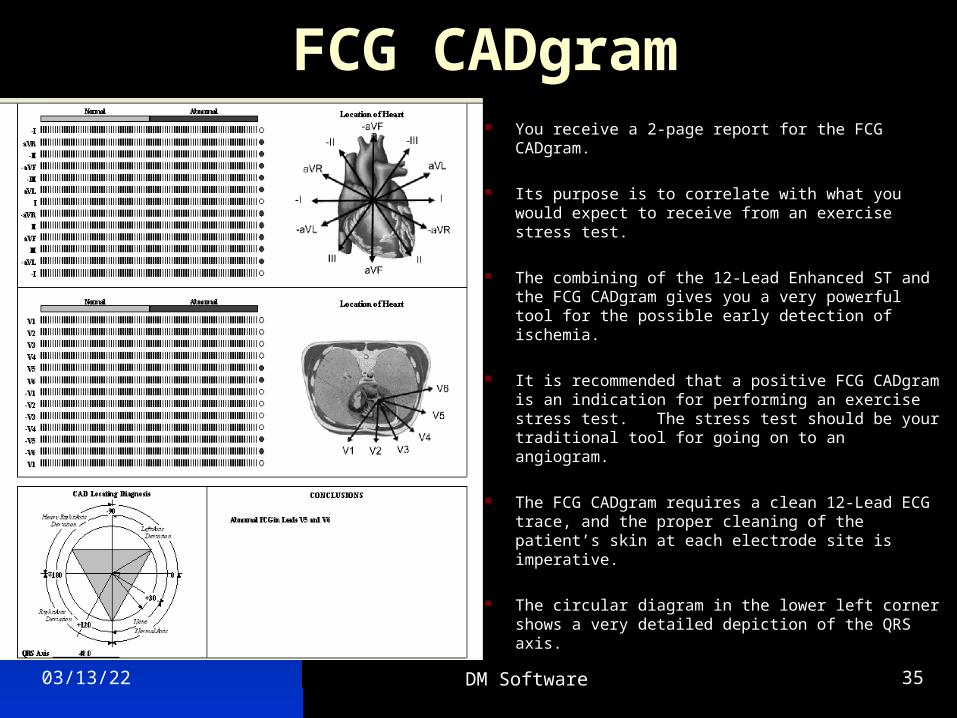
FCG CADgram You receive a 2-page report for the FCG CADgram.
Its purpose is to correlate with what you would expect to receive from an exercise stress test.
The combining of the 12-Lead Enhanced ST and the FCG CADgram gives you a very powerful tool for the possible early detection of ischemia.
It is recommended that a positive FCG CADgram is an indication for performing an exercise stress test. The stress test should be your traditional tool for going on to an angiogram.
The FCG CADgram requires a clean 12-Lead ECG trace, and the proper cleaning of the patient’s skin at each electrode site is imperative.
The circular diagram in the lower left corner shows a very detailed depiction of the QRS axis.
04/18/23 DM Software 36
Medical Reference Articles
The next section is a search of the literature as it applies to the previously described Holter ECG testing modalities.
Only the physician can order any kind of a Holter test, and only the physician can provide a diagnosis.
04/18/23 DM Software 37
ACC/AHA Guidelines for Ambulatory Electrocardiography (Holter ECG)
Crawford et al 1999
One of the primary and most widely accepted uses of Holter ECG is the determination of the relation of a patient’s transient symptoms to cardiac arrhythmias. Some symptoms are commonly caused by transient arrhythmias; syncope, near syncope, dizziness, and palpitation. However, other transient symptoms are less commonly related to rhythm abnormalities: shortness of breath, chest discomfort, weakness, diaphoresis, or neurological symptoms such as transient ischemic attack. Vertigo, which is usually not caused by an arrhythmia, must be distinguished from dizziness
If arrhythmias are thought to be causative in patients with transient symptoms, the crucial information needed is the recording of an ECG during the precise time that the symptom is occurring. With such a recording, one can determine if the symptom is related to the arrhythmia. Four outcomes are possible with Holter ECG recordings. First, typical symptoms may occur with the simultaneous documentation of a cardiac arrhythmia capable of producing such symptoms. Such a finding is most useful and may help to direct therapy. Second, symptoms may occur even though a Holter ECG recording shows no arrhythmias. This finding is also useful because it
demonstrates that the symptoms are not related to rhythm disturbances. Third, a patient may remain asymptomatic during cardiac arrhythmias documented on the recording. This finding has equivocal value. The recorded arrhythmia may or may not be relevant to the symptoms. Fourth, the patient may remain asymptomatic during the Holter ECG recording and no arrhythmias are documented. This finding is not useful.
The day-to-day variability in the frequency of arrhythmias is substantial. Most arrhythmia studies use a 24-hour recording period, although the yield may be increased slightly with longer recordings or repeated recordings. Major reductions in arrhythmia frequency are necessary to prove treatment effect. To ensure that a change is due to the treatment effect and not a spontaneous variability, a 65% to 95% reduction in arrhythmia frequency after an intervention is necessary.
Because most ischemic episodes during routine daily activities are related to increases in heart rate, it is therefore essential to encourage similar daily activities at the time of the Holter ECG. The optimal duration of recording to detect and quantify ischemia is 48 hours.
04/18/23 DM Software 38
ACC/AHA Guidelines for Ambulatory Electrocardiography (Holter ECG)
Crawford et al continued
Indications for Symptoms related to Rhythm Disturbances * Patients with unexplained recurrent palpitations. * Patients with unexplained syncope, near syncope, or episodic dizziness. * Patients with episodic shortness of breath, chest pain, or fatigue that is not otherwise explained. * Neurological events when transient atrial fibrillation or flutter is suspected. * Cerebrovascular accidents without other evidence of arrhythmias.
Indications for patients without symptoms from arrhythmia * Post-MI patients with ejection fraction < 40%. * Congestive Heart Failure. * Idiopathic hypertrophic cardiomyopathy. * Sustained myocardial contusion. * Systemic hypertensive patients with LV hypertrophy. * Post-MI patients with normal LV function. * Pre-operative arrhythmia evaluation. * Patients with Sleep Apnea. * Patients with valvular heart disease.
Indications for Heart Rate Variability * Post-MI patients with LV dysfunction. * Congestive Heart Failure. * Idiopathic hypertrophic cardiomyopathy. * Post-MI patients with normal LV function. * Diabetics to evaluate for diabetic neuropathy. * Rhythm disturbances that preclude HRV analysis.
Indications to assess Anti-arrhythmic Therapy * To assess anti-arrhythmic drug response in individuals in whom baseline frequency of arrhythmia has been characterized as reproducible and of sufficient frequency to permit analysis. * To detect pro-arrhythmic responses to anti-
arrhythmic therapy in patients at high risk. * To assess rate control during atrial fibrillation. * To document recurrent or asymptomatic non-sustained arrhythmias during therapy in the out-patient setting.
Indications for Pacemaker and ICD * Suspected pacemaker or ICD failures. * Post-operative evaluation of pacemaker and ICD
04/18/23 DM Software 39
ACC/AHA Guidelines for Ambulatory Electrocardiography (Holter ECG)
Crawford, et al continued
During the past decade, Holter ECG has been extensively used for the detection of myocardial ischemia. It is now widely accepted that Holter ECG monitoring provides accurate and clinically meaningful information about myocardial ischemia in patients with coronary disease.
Indications for Ischemia Monitoring * Patients with suspected variant angina. * Patients with chest pain who cannot exercise. * Pre-operative for vascular surgery who cannot
exercise * Patients with known CAD. * Patients with atypical chest pain syndrome. * Initial evaluation of patients with chest pain who are able to exercise.
The purposes of Holter ECG monitoring in pediatric patients include (1) the eveluation of symptoms that may be arrhythmia related; (2) risk assessment in patients with cardiovascular disease, with or without symptoms of an arrhythmia; and (3) the evaluation of cardiac rhythm after an intervention such as drug therapy or device implantation. Holter ECG monitoring is commonly used in the periodic evaluation of pediatric patients with heart
Disease, with or without symptoms of arrhythmia. The rationale for this testing is the evolution of disease processes (such as long QT syndrome or hypertrophic cardiomyopathy).
Indications for Monitoring Pediatric Patients * Syncope, near syncope, or dizziness. * Evaluation of hypertrophy or dilated cardiomyopathies * Documented long QT syndromes. * Palpitation after surgery for congenital heart disease. * Evaluation of drug efficacy during rapid somatic
growth * Asymptomatic congenital AV block, nonpaced. * Evaluate cardiac rhythm after anti-arrhythmic therapy. * Evaluate cardiac rhythm after transient AV block associated with heart surgery or catheter ablation. * Evaluate rate-responsive or physiological pacing function in symptomatic patients. * Evaluate patient less than 3-years old with a prior tachy-arrhythmia. * Follow-up of complex ventricular ectopy on ECG or exercise stress test. * Evaluate suspected incessant atrial tachycardia.
04/18/23 DM Software 40
Heart Rate VariabilityStandards of Measurement, Physiological Interpretation,
and Clinical Use
Malik et al 1996
The last two decades have witnessed the recognition of a significant relationship between the autonomic nervous system and cardiovascular mortality, including sudden cardiac death. The clinical importance of HRV became appreciated in the late 1980’s, when it was confirmed that HRV was a strong and independent predictor of mortality after an acute myocardial infarction. With the availability of new, digital, high frequency, 24-hour, multi-channel ECG recorders, HRV has the potential to provide additional valuable insight into physiological conditions and to enhance risk stratification.
Changes in HRV Related to Specific Pathologies: * Myocardial Infarction: Depressed HRV after MI reflects a
decrease in vagal activity directed to the heart, which leads to the prevalence of sympathetic mechanisms and to cardiac electrical instability. The rationale for trying to modify HRV after a MI stems from the multiple observations indicating that cardiac mortality is higher among those post MI patients who have a more depressed HRV. Intervention therapies include B-Adrenergic Blockade drugs, Anti-arrhythmic drugs, Scopolamine, Thrombolysis, and Exercise training.
Clinical Use of HRV:
Depressed HRV can be used as a predictor of risk after an acute MI, and as an early warning sign of diabetic neuropathy.
For prediction of all-cause mortality, the value of HRV is similar to that of left ventricular ejection fraction. However, HRV is superior to left ventricular ejection fraction in predicting arrhythmic events (sudden cardiac death and ventricular tachycardia). The observed depressed cut-off values of 24-hour measures of HRV is an SDNN < 50 ms.
Once clinical manifestations of diabetic autonomic neuropathy (DAN) supervene, the estimated 5-year mortality is approximately 50%. Thus, early subclinical detection of autonomic dysfunction is important for risk stratification and subsequent management. Analyses of short-term and long-term HRV have been proven useful in detecting DAN.
The Framingham Heart Study concluded that HRV offers prognostic data independent of and beyond that provided by traditional risk factors.
04/18/23 DM Software 41
Heart Rate VariabilityStandards of Measurement, Physiological Inrepretation,
and Clinical Use
Malik et al continued
Pharmacological Responses: Many medications act directly or indirectly on the autonomic nervous system, and HRV can be used to explore the influence of various agents on sympathetic and parasympathetic activity.
Disease Mechanisms: Several primary neurological disorders including Parkinson’s disease, multiple sclerosis, Guillain-Barre syndrome, and orthostatic hypotension of the Shy-Drager type are associated with altered autonomic function. Changes in HRV may be an early manifestation of the condition and may be useful in quantitating the rate of disease progression and/or the efficacy of therapeutic interventions. This same approach may also be useful in the evaluation of secondary autonomic neurological disorders that accompany diabetes mellitus, alcoholism, and spinal cord injuries.
The phenomenon that is the focus of this report is the oscillation in the interval between consecutive heartbeats, as well as the oscillations between consecutive instantaneous heart rates. This is called Heart Rate Variability (HRV).
The American College of Cardiology and American Heart Association published guidelines in 1999 for indications for using the Holter HRV test. They are as follows:
* Rhythm disturbances that preclude HRV analysis.
* Diabetic patient for evaluation of diabetic neuropathy
* Post MI patients with normal and dysfunctional LV function.
* Idiopathic hypertrophic cardiomyopathy.
* Congestive Heart Failure.
The Malik et al publication set the current standards by the North American and European Joint Task Force for HRV, and lists other indications that you have just read for using the Holter HRV testing modality.
04/18/23 DM Software 42
SAECG Late PotentialsLiterature Review
Gomes et al 2001Prediction of Long-Term Outcomes by SAECG: The SAECG is a highly amplified and signal processed ECG. Unlike standard tracings, SAECG’s can detect microvolt-level electrical potentials in the terminal QRS complex. These arise from scarred myocardium, which can be the source of re-entrant malignant ventriculararrhythmias. SAECG is a powerful predictor of pooroutcomes. The SAECG’s of 1,268 patients qualified forthe study. The primary end point of the trial was cardiacarrest or death from arrhythmia. The SAECG filtered QRSduration (fQRS) was most strongly related to both arrhythmic and cardiac death. We defined an abnormalSAECG as fQRS > 114 ms. In this prospective multi-center study, the fQRS relative to other SAECG variablesindependently predicted the primary end point of
arrhythmicdeath or cardiac arrest and cardiac death.
Kennedy et al 1992Ambulatory Holter ECG and SAECG:It is apparent from a cost-effective view-point that if thepatient requiring a SAECG also needs additional
information of heart rate, arrhythmias, or ST segment changes, then ambulatory Holter/SAECG could provide all of the data at a fraction of the cost of separate examinations. The following diagnosis criteria are advocated for positive SAECG testing at 40 Hz: (1) the fQRS duration > 114 ms, (2) < 20uV signal in the last 40 ms, and (3) LAS40 (low amplitude signals) > 38 ms
Gomes et al Role of Holter, SAECG, and Heart Rate Variability: 24-hour Holter ECG and the assessment of left
ventricular function has been employed for risk stratification. More recently SAECG and HRV also have been used. This article reviews the role of these non-invasive tests. For the prediction of malignant ventricular arrhythmias, Farell et al have reported a sensitivity of 58% and a positive accuracy of 32% in patients with both abnormal HRV and SAECG. When you combine HRV and SAECG with a Holter ECG with repetitive VE forms, the predictive accuracy increases to 58%. Breithardt et al reported that only 3% of malignant ventricular arrhythmias occurred in patients with normal SAECG results. Gomes reported that patients with a positive SAECG had 7 times the serious arrhythmic events as compared to patients with negative SAECG tests.
04/18/23 DM Software 43
12-Lead Enhanced STLiterature Review
12-Lead Holter ECG recordings open up new dimensions in detecting ischemia.
Asymptomatic Cardiac Ischemia Pilot (ACIP) Study: Stone et al The presence of asymptomatic ischemic episodes
identified by Holter ECG during routine daily activities in stable coronary patients is associated with an adverse cardiac outcome. An ischemic episode was defined as transient ST-segment deviation >1.0 mm that lasted 1.0 minute or longer. From a total of 802 participants whose exercise treadmill test (ETT) indicated the presence of ischemia, 143 had no episodes of ischemia during Holter ECG, and 659 (82%) had one or more episodes of Holter ECG ischemia. Patients with Holter ECG ischemia had a more marked ischemic response during the ETT than patients without Holter ECG ischemia. Our results indicate that there is a significant, consistent, and direct relation between indexes of ischemia by exercise testing and the presence and frequency of asymptomatic Holter ECG ischemia.
Silent Myocardial Ischemia … Chiareiello et al Chest pain is certainly the predominant symptom of
ischemic heart disease and the one most commonly used
to establish the type and efficacy of treatment. However, several studies suggest that many individuals with severe coronary artery lesions do not have angina pectoris. In these patients, episodes of transitory myocardial ischemia may be “silent,” although abnormal asymptomatic ST changes may be recorded during the Holter ECG. The silent ischemic events considerably outnumber the symptomatic ones, and it is generally accepted that nearly 75% of the transient ischemic episodes recorded during Holter ECG are asymptomatic in patients with stable angina pectoris.
Right Bundle Branch Block and ST Elevation… Brugada et al Patients with no demonstrable structural heart disease
and an abnormal ECG pattern consisting of right bundle branch block and ST-segment elevation in leads V1 through V3 are at risk of sudden death. An implantable defibrillator is at present the treatment of choice. No patient died in the implantable defibrillator group, 4 patients died in the pharmacological group, and four patients died in the no therapy group. All mortality was
due to sudden death. These results strongly stress the need for careful evaluation of asymptomatic patients with this ECG pattern and the need for family ECG screening in survivors of cardiac arrest.
04/18/23 DM Software 44
12-Lead Enhanced STLiterature Review
AHA Scientific Statement: 2000 Tests for Silent and Inducible Ischemia… Smith et al Among asymptomatic individuals, there is evidence that
development of an ischemic ECG response at low workloads of exercise testing is associated with a higher incidence of future events such as angina pectoris, myocardial infarction, and sudden death. More specifically
ST depression > 1 mm occurring within 6 minutes on the Bruce protocol (6-7 METs) has been associated with an increased relative risk of cardiovascular events in men. A study in which the Ellested protocol was used in asymptomatic men with known CHD found that ECG changes and exercise duration < 5 minutes correlated with subsequent CHD in men > 40 years of age.
ACC/AHA Practice Guidelines: 2000 Management of patients with Unstable Angina … Braunwald et al Coronary artery disease (CAD) is the leading cause of
death in the United States. Although imperfect, the 12-Lead ECG lies at the center of the decision pathway for the evaluation and management of patients with ischemic discomfort. A recording made during an episode of the presenting symptoms is particularly valuable. Importantly,
transient ST-segment changes (>0.05 mV) that develop during a symptomatic episode at rest and that resolve when the patient becomes asymptomatic strongly suggest acute ischemia and a very high likelihood of underlying severe CAD. Monitoring for recurrence of ST segment shifts provides useful diagnostic and prognostic information, although the system of monitoring for ST segment shifts must include specific methods intended to provide stable and accurate recordings.
12-Lead Holter ECG Specifications: * Electrodes: a. 10 electrodes for Wilson 12-Lead ECG (DMS-300-12) b. 7-electrodes for Frank XYZ (DMS-300-7) * Recording duration: 24 or 48 hours * % of time recording the 12-Lead ECG: 100% * ECG digital sample rate: Read-in @ 512 samples/sec. * Analysis: a. ST analysis of all 12-Leads b. ST measured at J-point and ST (with Slope) c. Most common ST level for each individual lead selected as 0-reference ST baseline d. All ST Episodes edited, verified, and validated
04/18/23 DM Software 45
QT, QTc, and QTdLiterature Review
Multiple Mechanisms on the Long-QT Syndrome: SADS Foundation Task Force on LQTS: Roden et al The long-QT syndrome (LQTS) is characterized by
prolonged QT intervals, QT interval lability, and polymorphic ventricular tachycardia. Most of the life threatening arrhythmias in LQTS occur during physical or emotional stress. Most episodes of sudden death in LQTS almost certainly result from ventricular fibrillation triggered by torsades de pointes (polymorphic ventricular tachycardia). In most patients with LQTS, the heart rate corrected QT interval (QTc by Bazett’s formula) is >0.46 seconds (460 ms). The ECG changes in LQTS include considerably more than simple prolongation of the QT interval. For example, QT dispersion (QTd), as assessed by the difference between the longest and shortest QT intervals on a 12-Lead ECG, is increased in LQTS, indicating spatial heterogeneity in repolarization. The normal range for QTd is 28 to 64 ms, but in patients with LQTS, it is 112 to 154 ms. The mortality of untreated symptomatic patients with LQTS exceeds 20% in the year after their first syncopal episode, and approaches 50% within 10 years. With therapy, this can be reduced to 3% to 4% in 5-years. Strong evidence supports the use of antiadrenergic interventions as mainstays of therapy.
Policy Conference on Potential for QT Prolongation … Haverkamp et al 1999 QT interval prolongation, and possibly increased QT
dispersion, are risk factors in a number of cardiovascular as well as non-cardiovascular diseases. A variety of drugs prolong the QT interval. These drugs generally exert their therapeutic effect by affecting potassium ion channels, thereby reducing the repolarising current, and prolonging the action potential duration and the QT interval. Anti-arrhythmic drugs which prolong cardiac repolarization are not harmless, as they may induce a potentially fatal arrhythmia, known as Torsade de Pointes. Recently, it has become apparent that a variety of non-anti-arrhythmic agents may aggravate and/or provoke Torsade de Pointes. As many as 50 clinically available or still investigational drugs have been implicated (see listing on next slide). Of concern is the interval, usually measured in years, from the marketing of these drugs to initial recognition of their association with QT interval prolongation. The risk of drug-induced Torsade de Pointes (LQTS) arrhythmias raises a dilemma of early detection of the effects of any new chemical entity on cardiac ventricular repolarization.
Note: The Holter QT, QTc, and QTd report is a specific testing modality for detecting the transient LQTS events.
04/18/23 DM Software 46
QT, QTc, and QTdLiterature Review
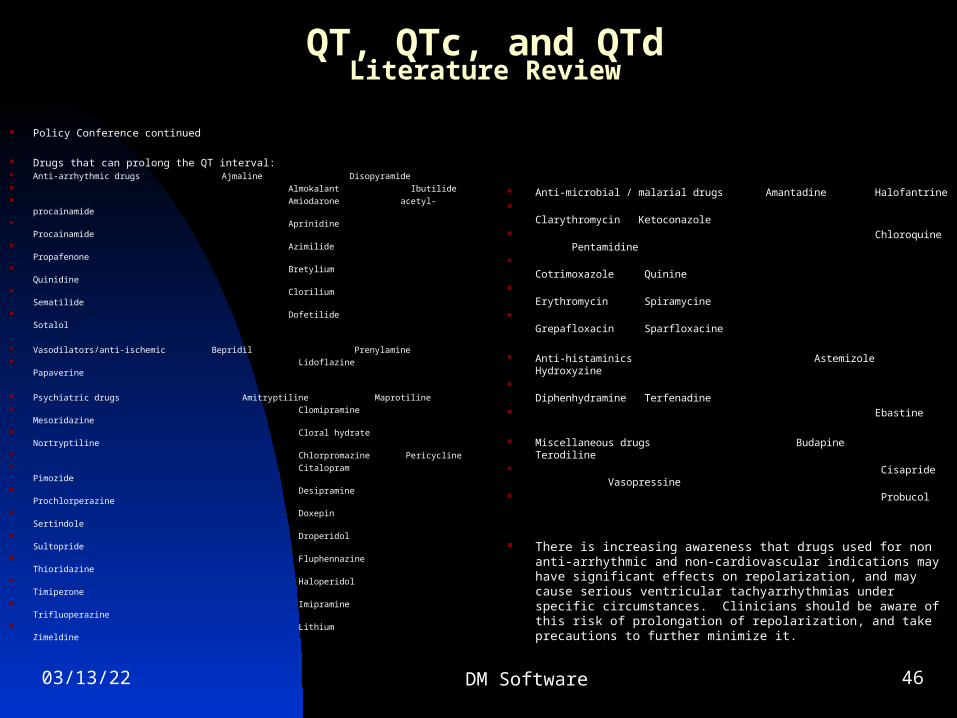
Policy Conference continued
Drugs that can prolong the QT interval: Anti-arrhythmic drugs Ajmaline Disopyramide Almokalant Ibutilide Amiodarone acetyl-procainamide Aprinidine Procainamide Azimilide Propafenone Bretylium Quinidine Clorilium Sematilide Dofetilide Sotalol
Vasodilators/anti-ischemic Bepridil Prenylamine Lidoflazine Papaverine
Psychiatric drugs Amitryptiline Maprotiline Clomipramine Mesoridazine Cloral hydrate Nortryptiline Chlorpromazine Pericycline Citalopram Pimozide Desipramine Prochlorperazine Doxepin Sertindole Droperidol Sultopride Fluphennazine Thioridazine Haloperidol Timiperone Imipramine Trifluoperazine Lithium Zimeldine
Anti-microbial / malarial drugs Amantadine Halofantrine Clarythromycin Ketoconazole Chloroquine Pentamidine Cotrimoxazole Quinine Erythromycin Spiramycine Grepafloxacin Sparfloxacine
Anti-histaminics Astemizole Hydroxyzine Diphenhydramine Terfenadine Ebastine
Miscellaneous drugs Budapine Terodiline Cisapride Vasopressine Probucol
There is increasing awareness that drugs used for non anti-arrhythmic and non-cardiovascular indications may have significant effects on repolarization, and may cause serious ventricular tachyarrhythmias under specific circumstances. Clinicians should be aware of this risk of prolongation of repolarization, and take precautions to further minimize it.
04/18/23 DM Software 47
VCG (Vectorcardiogram)Literature Review
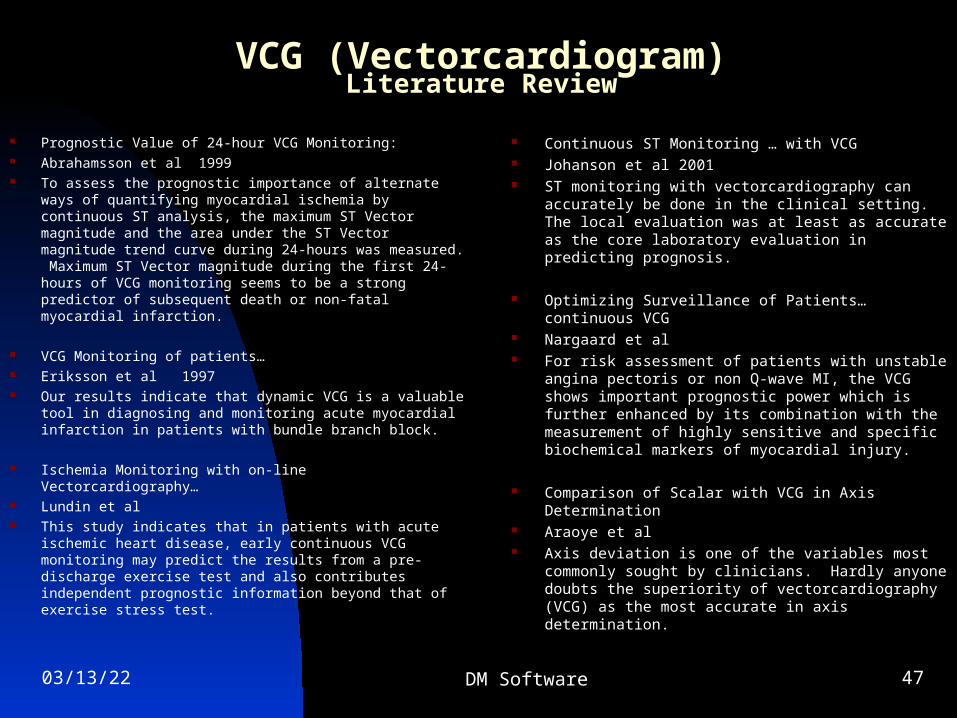
Prognostic Value of 24-hour VCG Monitoring: Abrahamsson et al 1999 To assess the prognostic importance of alternate ways of
quantifying myocardial ischemia by continuous ST analysis, the maximum ST Vector magnitude and the area under the ST Vector magnitude trend curve during 24-hours was measured. Maximum ST Vector magnitude during the first 24-hours of VCG monitoring seems to be a strong predictor of subsequent death or non-fatal myocardial infarction.
VCG Monitoring of patients… Eriksson et al 1997 Our results indicate that dynamic VCG is a valuable tool in
diagnosing and monitoring acute myocardial infarction in patients with bundle branch block.
Ischemia Monitoring with on-line Vectorcardiography… Lundin et al This study indicates that in patients with acute ischemic
heart disease, early continuous VCG monitoring may predict the results from a pre-discharge exercise test and also contributes independent prognostic information beyond that of exercise stress test.
Continuous ST Monitoring … with VCG Johanson et al 2001 ST monitoring with vectorcardiography can accurately
be done in the clinical setting. The local evaluation was at least as accurate as the core laboratory evaluation in predicting prognosis.
Optimizing Surveillance of Patients…continuous VCG Nargaard et al For risk assessment of patients with unstable angina
pectoris or non Q-wave MI, the VCG shows important prognostic power which is further enhanced by its combination with the measurement of highly sensitive and specific biochemical markers of myocardial injury.
Comparison of Scalar with VCG in Axis Determination Araoye et al Axis deviation is one of the variables most commonly
sought by clinicians. Hardly anyone doubts the superiority of vectorcardiography (VCG) as the most accurate in axis determination.
04/18/23 DM Software 48
Sleep ApneaLiterature Review
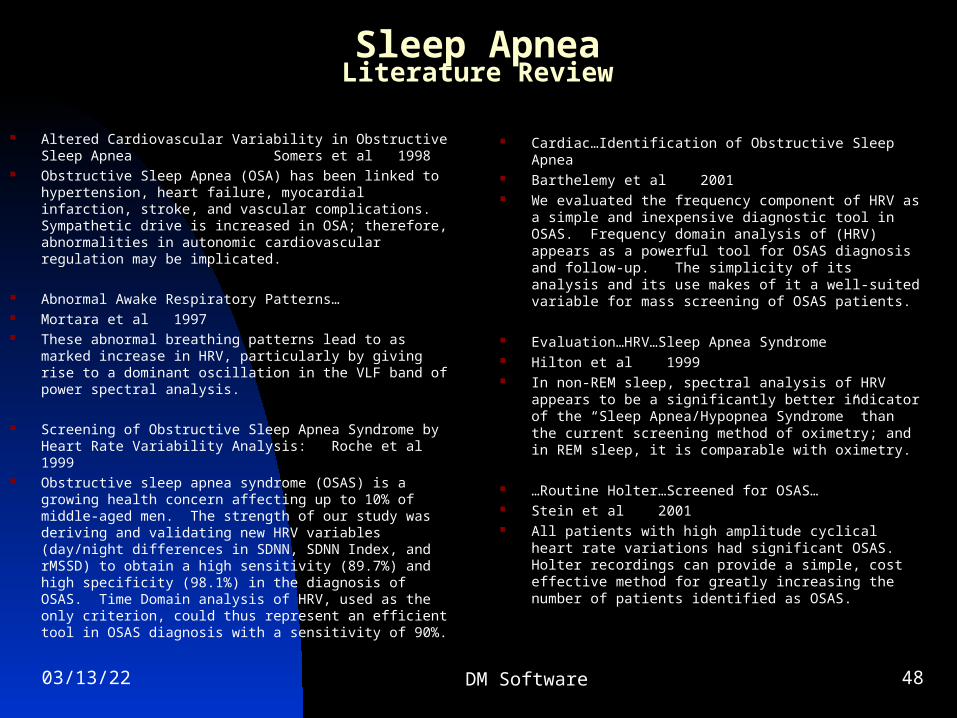
Altered Cardiovascular Variability in Obstructive Sleep Apnea Somers et al 1998
Obstructive Sleep Apnea (OSA) has been linked to hypertension, heart failure, myocardial infarction, stroke, and vascular complications. Sympathetic drive is increased in OSA; therefore, abnormalities in autonomic cardiovascular regulation may be implicated.
Abnormal Awake Respiratory Patterns… Mortara et al 1997 These abnormal breathing patterns lead to as marked
increase in HRV, particularly by giving rise to a dominant oscillation in the VLF band of power spectral analysis.
Screening of Obstructive Sleep Apnea Syndrome by Heart Rate Variability Analysis: Roche et al 1999
Obstructive sleep apnea syndrome (OSAS) is a growing health concern affecting up to 10% of middle-aged men. The strength of our study was deriving and validating new HRV variables (day/night differences in SDNN, SDNN Index, and rMSSD) to obtain a high sensitivity (89.7%) and high specificity (98.1%) in the diagnosis of OSAS. Time Domain analysis of HRV, used as the only criterion, could thus represent an efficient tool in OSAS diagnosis with a sensitivity of 90%.
Cardiac…Identification of Obstructive Sleep Apnea Barthelemy et al 2001 We evaluated the frequency component of HRV as a
simple and inexpensive diagnostic tool in OSAS. Frequency domain analysis of (HRV) appears as a powerful tool for OSAS diagnosis and follow-up. The simplicity of its analysis and its use makes of it a well-suited variable for mass screening of OSAS patients.
Evaluation…HRV…Sleep Apnea Syndrome Hilton et al 1999 In non-REM sleep, spectral analysis of HRV appears
to be a significantly better indicator of the “Sleep Apnea/Hypopnea Syndrome” than the current screening method of oximetry; and in REM sleep, it is comparable with oximetry.
…Routine Holter…Screened for OSAS… Stein et al 2001 All patients with high amplitude cyclical heart rate
variations had significant OSAS. Holter recordings can provide a simple, cost effective method for greatly increasing the number of patients identified as OSAS.
04/18/23 DM Software 49
Atrial FibrillationLiterature Review
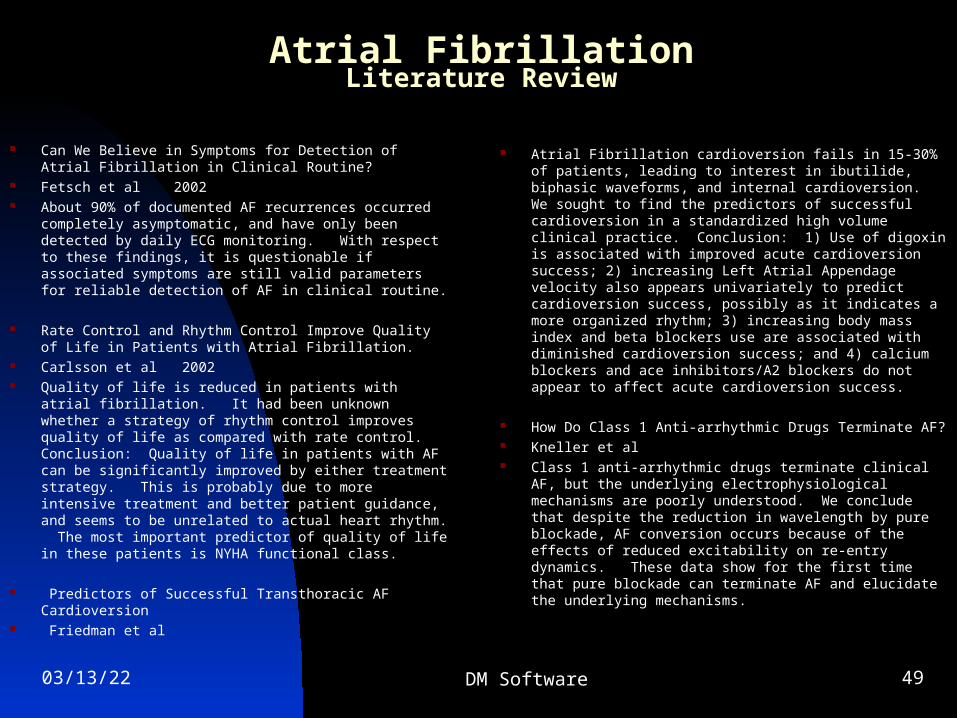
Can We Believe in Symptoms for Detection of Atrial Fibrillation in Clinical Routine?
Fetsch et al 2002 About 90% of documented AF recurrences occurred
completely asymptomatic, and have only been detected by daily ECG monitoring. With respect to these findings, it is questionable if associated symptoms are still valid parameters for reliable detection of AF in clinical routine.
Rate Control and Rhythm Control Improve Quality of Life in Patients with Atrial Fibrillation.
Carlsson et al 2002 Quality of life is reduced in patients with atrial fibrillation.
It had been unknown whether a strategy of rhythm control improves quality of life as compared with rate control. Conclusion: Quality of life in patients with AF can be significantly improved by either treatment strategy. This is probably due to more intensive treatment and better patient guidance, and seems to be unrelated to actual heart rhythm. The most important predictor of quality of life in these patients is NYHA functional class.
Predictors of Successful Transthoracic AF Cardioversion Friedman et al
Atrial Fibrillation cardioversion fails in 15-30% of patients, leading to interest in ibutilide, biphasic waveforms, and internal cardioversion. We sought to find the predictors of successful cardioversion in a standardized high volume clinical practice. Conclusion: 1) Use of digoxin is associated with improved acute cardioversion success; 2) increasing Left Atrial Appendage velocity also appears univariately to predict cardioversion success, possibly as it indicates a more organized rhythm; 3) increasing body mass index and beta blockers use are associated with diminished cardioversion success; and 4) calcium blockers and ace inhibitors/A2 blockers do not appear to affect acute cardioversion success.
How Do Class 1 Anti-arrhythmic Drugs Terminate AF? Kneller et al Class 1 anti-arrhythmic drugs terminate clinical AF, but
the underlying electrophysiological mechanisms are poorly understood. We conclude that despite the reduction in wavelength by pure blockade, AF conversion occurs because of the effects of reduced excitability on re-entry dynamics. These data show for the first time that pure blockade can terminate AF and elucidate the underlying mechanisms.
04/18/23 DM Software 50
FCG CADgramLiterature Review
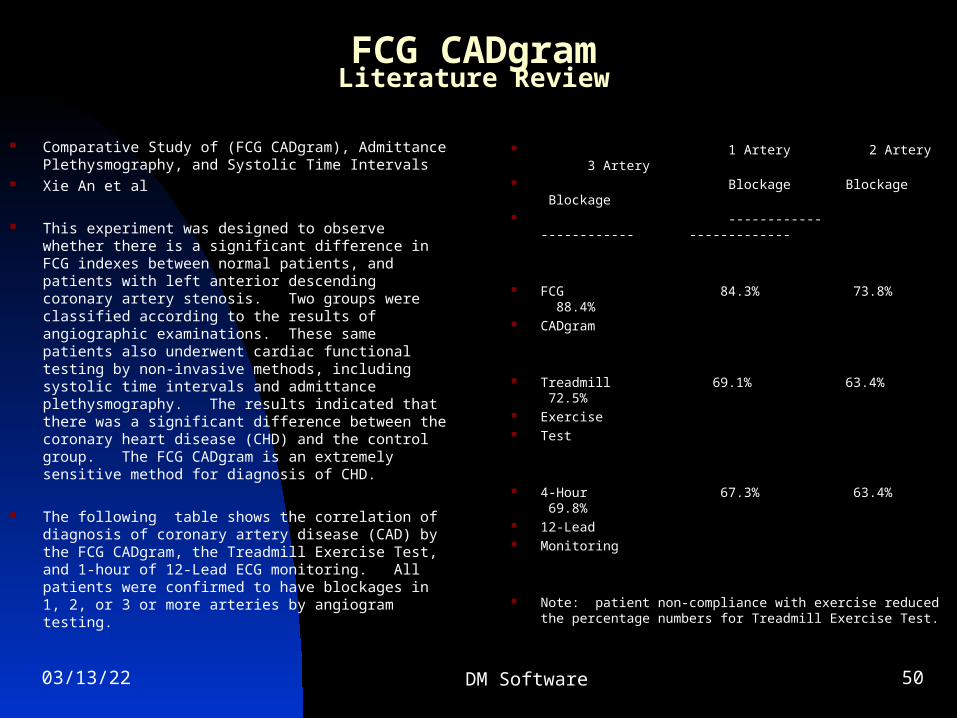
Comparative Study of (FCG CADgram), Admittance Plethysmography, and Systolic Time Intervals
Xie An et al
This experiment was designed to observe whether there is a significant difference in FCG indexes between normal patients, and patients with left anterior descending coronary artery stenosis. Two groups were classified according to the results of angiographic examinations. These same patients also underwent cardiac functional testing by non-invasive methods, including systolic time intervals and admittance plethysmography. The results indicated that there was a significant difference between the coronary heart disease (CHD) and the control group. The FCG CADgram is an extremely sensitive method for diagnosis of CHD.
The following table shows the correlation of diagnosis of coronary artery disease (CAD) by the FCG CADgram, the Treadmill Exercise Test, and 1-hour of 12-Lead ECG monitoring. All patients were confirmed to have blockages in 1, 2, or 3 or more arteries by angiogram testing.
1 Artery 2 Artery 3 Artery Blockage Blockage Blockage ------------ ------------ -------------
FCG 84.3% 73.8% 88.4% CADgram
Treadmill 69.1% 63.4% 72.5% Exercise Test
4-Hour 67.3% 63.4% 69.8% 12-Lead Monitoring
Note: patient non-compliance with exercise reduced the percentage numbers for Treadmill Exercise Test.