ecg holter system - meditech · ecg holter system preparations for using the holter system labtech...
TRANSCRIPT

LABTECH LTD. MADE IN HUNGARY
ECG Holter System
Cardiospy® User Manual
for EC-2H; EC-3H; EC-12H; EC-3H/ABP recorder
LABTECH LTD.
Address 4. Vág street Debrecen 4031 Hungary
E-mail [email protected]
Phone +36-52-310-128
Fax +36-52-412-023

INTRODUCTION ECG HOLTER SYSTEM
2 V5.03_2014_11 LABTECH LTD.
1 Introduction
Dear Customer!
Thank you for purchasing our Cardiospy ECG Holter System. We sincerely hope that
our product will help you with your diagnostic and therapeutic work. To be able to use
Holter System and computer programs appropriately, please read the manuals carefully.
A basic knowledge of computers and Windows based applications are required. We
appreciate any comment you might have on the use of the System. Please, turn to us
with confidence: our colleagues and representatives will be pleased to help you, even in
person if need be.
What is a Holter?
A Holter is a non-invasive, long-term ambulatory ECG device that is capable of
recording up to 24 (or even 48-72) hours of ECG signals.
How to use Holter monitoring?
The Holter recorder is worn by the patient for 24 hours, and records during normal daily
activities, including sleep periods. After 24 hours, the readings are downloaded to a
computer for analysis, where a qualified expert reviews and, if necessary, edits the data.
What is the main idea of Holter Monitoring?
Holter monitoring is a tool in the evaluation of patients with symptoms of various forms
of heart disease, or in situations where the physician suspects cardiac pathology in the
absence of symptoms. Holter monitoring is an ideal test because the patient assumes
normal daily activities, increasing the likelihood that he or she will experience the
precise situations that can trigger symptoms or cardiac events. This allows correlation of
any rhythm problems or abnormalities with activities and/or symptoms. In the opposite
sense, Holter monitoring can also be used to "rule out" cardiac causes of patients'
symptoms.

ECG HOLTER SYSTEM INTRODUCTION
LABTECH LTD. V5.03_2014_11 3
Does this system have any quality certifications?
The CE mark indicates that the product meets the essential
requirements of European Council Directive 93/42/EEC
concerning medical devices.
Labtech Ltd. also operates a quality system certified to ISO
9001:2008 and ISO 13485:2003. Made in Hungary by
Labtech Ltd.
We wish you success in using our ECG Holter Systems!
Should you have any questions, ideas, partnership suggestions please contact us:
LABTECH LTD.
Address 4. Vág street Debrecen 4031 Hungary
E-mail [email protected]
Phone +36-52-310-128
Fax +36-52-412-023

TABLE OF CONTENTS ECG HOLTER SYSTEM
4 V5.03_2014_11 LABTECH LTD.
2 Table of contents
1 INTRODUCTION ................................................................................................... 2
2 TABLE OF CONTENTS ........................................................................................ 4
3 PREPARATIONS FOR USING THE HOLTER SYSTEM .................................. 7
3.1 List of accessories for EC-2H; EC-3H; EC-12H * ......................................... 7
3.2 List of accessories for EC-3H/ABP .............................................................. 10
3.3 Principles of Operation ................................................................................. 13
3.4 Warnings and Contraindications of using Holter System ............................. 14
4 INSTRUCTIONS FOR STARTING HOLTER MONITORING ........................ 16
4.1 Recorder Components (EC-2H; EC-3H; EC-12H) ....................................... 16
4.2 Recorder components (EC-3H/ABP) ........................................................... 17
4.1.1 Signs and alarms of EC-3H/ABP ............................................................. 18
4.3 Database management interface ................................................................... 21
4.1.2 Toolbar ..................................................................................................... 21
4.1.3 List of patients .......................................................................................... 25
4.1.4 Records toolbar ........................................................................................ 26
4.1.5 List of records .......................................................................................... 27
4.1.6 Selected System ....................................................................................... 27
4.1.7 Filters ....................................................................................................... 28
4.1.8 Search ....................................................................................................... 28
4.1.9 Database information ............................................................................... 28
How to start a New Recording? ................................................................................. 29
4.1.10 Patient preparation ............................................................................... 29
4.1.11 New Recording .................................................................................... 40
4.1.12 Holter monitoring settings ................................................................... 41
4.1.13 Starting a recording from the computer ............................................... 41
4.1.14 Starting a recording without a computer .............................................. 43
4.1.15 Patient’s event log printing .................................................................. 44

ECG HOLTER SYSTEM TABLE OF CONTENTS
LABTECH LTD. V5.03_2014_11 5
Reading a Record........................................................................................................ 45
5 ANALYSIS WITH THE CARDIOSPY SOFTWARE .......................................... 46
Views .......................................................................................................................... 46
5.1.1 Main window ............................................................................................ 46
5.1.2 ECG window – large window ................................................................... 50
5.1.3 Templates window .................................................................................... 52
5.1.4 HRV window ............................................................................................ 54
5.1.5 QT Summary window ............................................................................... 58
5.1.6 3.1.6 Pacemaker window .......................................................................... 59
5.1.7 Ectopic Trends Window ........................................................................... 61
5.1.8 Summary window ..................................................................................... 62
5.1.9 Vectorcardiography: ................................................................................. 63
5.1.10 BP (EC-3H/ABP) ................................................................................. 63
Toolbars ...................................................................................................................... 67
5.1.11 Database ............................................................................................... 67
5.1.12 ECG leads ............................................................................................. 67
5.1.13 Report ................................................................................................... 68
5.1.14 Sequence of tasks ................................................................................. 68
5.1.15 Print ...................................................................................................... 68
5.1.16 Printing of screen section ..................................................................... 69
5.1.17 Export ................................................................................................... 69
5.1.18 Export Current Samples ....................................................................... 69
5.1.19 Settings ................................................................................................. 69
5.1.20 Automatic report .................................................................................. 73
5.1.21 Print and export settings ....................................................................... 74
Editing and measuring options ................................................................................... 75
5.1.22 Automatic and manual analysis ............................................................ 75
5.1.23 Sequence of tasks ................................................................................. 76

TABLE OF CONTENTS ECG HOLTER SYSTEM
6 V5.03_2014_11 LABTECH LTD.
5.1.24 Template window ................................................................................ 76
5.1.25 ECG window ....................................................................................... 80
5.1.26 Event window ...................................................................................... 81
5.1.27 HRV window ....................................................................................... 83
5.1.28 ST, QT, QTc graph .............................................................................. 86
5.1.29 AF graph .............................................................................................. 87
5.1.30 Deleting T alternans sections ............................................................... 88
5.1.31 Noise window ...................................................................................... 89
Calculation and Evaluation methods - EKG .............................................................. 90
Calculation and Evaluation methods - BP.................................................................. 96
6 TROUBLESHOOTING AND MAINTENANCE ................................................ 98
7 TECHNICAL SPECIFICATIONS ..................................................................... 109
Specification table of holter recorders (EC-2H; EC-3H; EC-12H) .......................... 109
Specification table of holter recorders (EC-3H/ABP) .............................................. 110
Recording time ......................................................................................................... 113
Basic functions of different holter systems .............................................................. 114
Additional functions of different holter systems ...................................................... 116
8 PATIENT DIARY ............................................................................................... 117
ECG HOLTER SYSTEM PREPARATIONS FOR USING THE HOLTER SYSTEM
LABTECH LTD. V5.03_2014_11 7
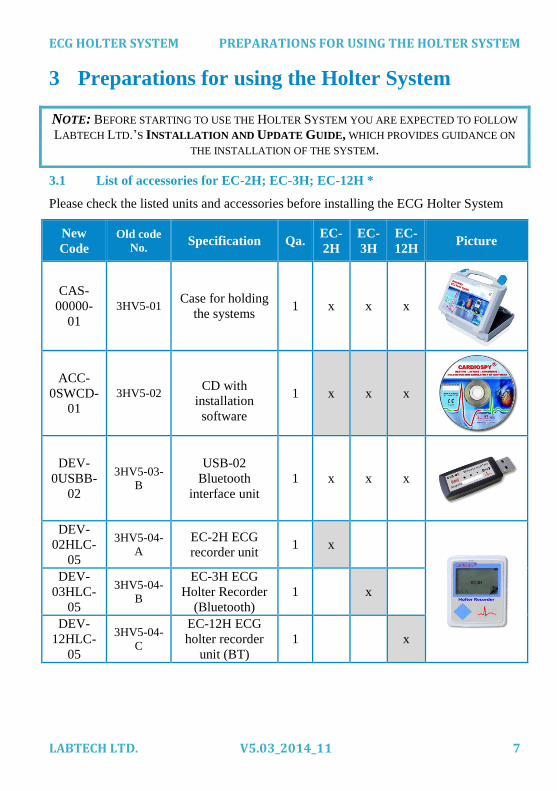
3 Preparations for using the Holter System
3.1 List of accessories for EC-2H; EC-3H; EC-12H *
Please check the listed units and accessories before installing the ECG Holter System
New
Code
Old code
No. Specification Qa.
EC-
2H
EC-
3H
EC-
12H Picture
CAS-
00000-
01
3HV5-01 Case for holding
the systems 1 x x x
ACC-
0SWCD-
01
3HV5-02
CD with
installation
software
1 x x x
DEV-
0USBB-
02
3HV5-03-
B
USB-02
Bluetooth
interface unit
1 x x x
DEV-
02HLC-
05
3HV5-04-
A
EC-2H ECG
recorder unit 1 x
DEV-
03HLC-
05
3HV5-04-
B
EC-3H ECG
Holter Recorder
(Bluetooth)
1 x
DEV-
12HLC-
05
3HV5-04-
C
EC-12H ECG
holter recorder
unit (BT)
1 x
NOTE: BEFORE STARTING TO USE THE HOLTER SYSTEM YOU ARE EXPECTED TO FOLLOW
LABTECH LTD.’S INSTALLATION AND UPDATE GUIDE, WHICH PROVIDES GUIDANCE ON
THE INSTALLATION OF THE SYSTEM.
PREPARATIONS FOR USING THE HOLTER SYSTEM ECG HOLTER SYSTEM
8 V5.03_2014_11 LABTECH LTD.
New
Code
Old code
No. Specification Qa.
EC-
2H
EC-
3H
EC-
12H Picture
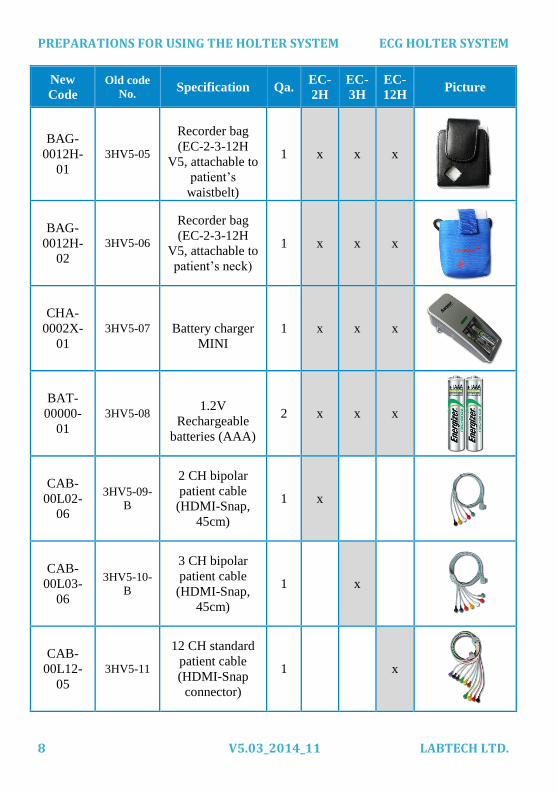
BAG-
0012H-
01
3HV5-05
Recorder bag
(EC-2-3-12H
V5, attachable to
patient’s
waistbelt)
1 x x x
BAG-
0012H-
02
3HV5-06
Recorder bag
(EC-2-3-12H
V5, attachable to
patient’s neck)
1 x x x
CHA-
0002X-
01
3HV5-07
Battery charger
MINI
1 x x x
BAT-
00000-
01
3HV5-08
1.2V
Rechargeable
batteries (AAA)
2 x x x
CAB-
00L02-
06
3HV5-09-
B
2 CH bipolar
patient cable
(HDMI-Snap,
45cm)
1 x
CAB-
00L03-
06
3HV5-10-
B
3 CH bipolar
patient cable
(HDMI-Snap,
45cm)
1 x
CAB-
00L12-
05
3HV5-11
12 CH standard
patient cable
(HDMI-Snap
connector)
1 x

ECG HOLTER SYSTEM PREPARATIONS FOR USING THE HOLTER SYSTEM
LABTECH LTD. V5.03_2014_11 9
New
Code
Old code
No. Specification Qa.
EC-
2H
EC-
3H
EC-
12H Picture
CAB-
00LNE-
06
3HV5-12-
B
NEHB patient
cable (HDMI-
Snap, 45cm)
1 x
CAB-
00USB-
01
3HV5-13
Extension cable
for USB-02
1 x x x
CAB-
00REC-
05
3HV5-14
Data transfer
cable (USB A -
HDMI)
1 x x x
USR-
00000-
01
3HV5-15-
A
Installation and
Update Guide
1 x x x
USR-
00000-
02
3HV5-15-
B
User manual for
holter recorders 1 x x x
ELE-
00000-
01
3HV5-16-
A
Single-use
electrodes (1
pack / 30 pcs)
1 x x x
PAD-
00000-
01
3HV5-18 Mouse pad 1 x x x

PREPARATIONS FOR USING THE HOLTER SYSTEM ECG HOLTER SYSTEM
10 V5.03_2014_11 LABTECH LTD.
NOTE: PLEASE REFER TO THE CODE NUMBER ABOVE WHEN PLACING AN ORDER.
*The manufacturer reserves the right to change prices at any time.
**The accessories highlighted in grey in the chart will be given as accessories for
the recorders as well.
3.2 List of accessories for EC-3H/ABP
New
Code
Old code
No. Specification Qa.
EC-
3H/ABP Picture
CAS-
00ABP-
01
3HA-V5-01 Case for holding the
recorder and accessories 1 x
ACC-
0SWCD-
01
3HA-V5-02
CD with installation
software
1 x
DEV-
0USBB-
02
3HA-V5-03-
B
USB-02/B
Bluetooth Interface Unit
(monitoring and
evaluation)
1 x
DEV-
3HABP-
05
3HA-V5-04
EC-3H/ABP ECG and
ABPM recorder unit
(BT)
1 x
BAG-
3HABP-
02
3HA-V5-05
Recorder bag (EC-ABP
V5, EC-3H/ABP V5,
attachable to patient’s
waistbelt)
1 x

ECG HOLTER SYSTEM PREPARATIONS FOR USING THE HOLTER SYSTEM
LABTECH LTD. V5.03_2014_11 11
New
Code
Old code
No. Specification Qa.
EC-
3H/ABP Picture
CHA-
0004X-
01
3HA-V5-06 Battery charger MAXI 1 x
BAT-
00000-
02
3HA-V5-07
1.2V Rechargeable
batteries (AA)
4 x
CAB-
00L03-
06
3HA-V5-08-
B
3 CH bipolar patient
cable (HDMI-Snap,
45cm)
1 x
CAB-
00USB-
01
3HA-V5-09
Extension cable for
USB-02
1 x
CAB-
00REC-
05
3HA-V5-10
Data transfer cable
(USB A - HDMI)
1 x
USR-
00000-
01
3HV5-15-A Installation and Update
Guide 1 x
USR-
00000-
02
3HV5-15-B User manual for holter
recorders 1 x
ELE-
00000-
01
3HV5-16-A Single-use electrodes (1
pack / 30 pcs) 1 x
ELE-
00000-
02
3HA-V5-12 Single-use electrodes
for cuff fixing 1 x

PREPARATIONS FOR USING THE HOLTER SYSTEM ECG HOLTER SYSTEM
12 V5.03_2014_11 LABTECH LTD.
New
Code
Old code
No. Specification Qa.
EC-
3H/ABP Picture
BEL-
00000-
01
3HA-V5-13 Waist belt 1 x
CUF-
00SUN-
02
3HA-V5-14-
B
ABPM cuff, Adult (23-
33cm) 1 x
PAD-
00000-
01
3HA-V5-15 Mouse pad 1 x
*The manufacturer reserves the right to change prices at any time.
**The accessories highlighted in grey in the chart will be given as accessories for
the recorders as well.

ECG HOLTER SYSTEM PREPARATIONS FOR USING THE HOLTER SYSTEM
LABTECH LTD. V5.03_2014_11 13
3.3 Principles of Operation
Holter monitoring is a tool in the evaluation of patients with symptoms of various forms
of heart disease, or in situations where the physician suspects cardiac pathology in the
absence of symptoms. Symptoms such as lightheadedness, palpitations, or fainting may
be caused by disturbances in the electrical signals that control the heart muscle
contractions. These disturbances can be random, spontaneous, sleep-related, emotion- or
stress-induced.
Holter monitoring is an ideal test because the patient assumes normal daily activities,
increasing the likelihood that he or she will experience the precise situations that can
trigger symptoms or cardiac events. This allows correlation of any rhythm problems or
abnormalities with activities and/or symptoms. In the opposite sense, Holter monitoring
can also be used to "rule out" cardiac causes of patients' symptoms.

PREPARATIONS FOR USING THE HOLTER SYSTEM ECG HOLTER SYSTEM
14 V5.03_2014_11 LABTECH LTD.
3.4 Warnings and Contraindications of using Holter System
Never use the recorder:
- in wet conditions (the recorder is not waterproof)
- in strong heat
- in explosive surroundings
- in strong electrostatic field
- in the presence of flammable anaesthetics
- Do NOT remove recorder covers
- Do NOT immerse the recorder in any fluid
- the Holter is not defibrillator-protected, do not use with not-implanted defibrillator
Usage with other devices:
Holters may be used safely in patients with pacemakers, Implanted Cardiac Defibrillator
(ICD) or other implanted devices. The implanted devices will not disrupt or be
influenced by the operation of the recorder, as well as the recorder will not be
influenced by the operation of the above devices.
The recorder may be used simultaneously with a high frequency surgical device, in this
case make sure that the ECG electrodes are placed as far as possible away from the
surgical field.
Environmental conditions of storage and operation:
Temperature-range: -10-50oC
Relative humidity: 10-95% non-condensing
Air pressure-range: 700-1060 hPa
To achieve good and safe connection, to take care of the patient’s skin and to avoid
infection use only good quality single-use electrodes that are marked with the CE sign.
Do not use electrodes with expired warranty or dry or used ones from old, previously
opened packages because it will result in bad recording quality.
As in all Holter systems, noise and artefact may produce false positive ECG events.
Therefore, patient data must be reviewed and edited by a qualified technician.
Opening the enclosure by unauthorized person may invalidate warranty. Modification
of the ME equipment can only be performed by the manufacturer. In case of problems
contact a professional repair shop.
NOTE: IF ANY ABNORMALITY OCCURS IN THE UNIT, SUSPEND THE OPERATION
IMMEDIATELY AND DISCONNECT THE UNIT FROM THE PATIENT.

ECG HOLTER SYSTEM PREPARATIONS FOR USING THE HOLTER SYSTEM
LABTECH LTD. V5.03_2014_11 15
Symbols:
This equipment meets the requirements of Directive 93/42/EEC Annex II
(excluding section 4).
Do not dispose of this product and batteries as unsorted municipal waste.
Prepare this product for reuse or separate collection as specified by
Directive 2002/96/EC of the European Parliament and the Council of the
European Union on Waste Electronic and ElectricalEquipment (WEEE).
MDD classification IIa. EMC class B. EMC group 1.
Bluetooth Wireless Communication Technology
Not ionizing radiation – Device including Bluetooth based RF transmitter.
Pay special attention to the part, marked with the exclamation mark.
CF type on patient’s side
Date of manufacturing
Manufacturer

INSTRUCTIONS FOR STARTING HOLTER MONITORING ECG HOLTER SYSTEM
16 V5.03_2014_11 LABTECH LTD.
4 Instructions for starting Holter Monitoring
4.1 Recorder Components (EC-2H; EC-3H; EC-12H)
FRONT VIEW
REAR VIEW
LCD Display
Patient cable
- Easy to replace -
Event Button
- Use this button
for patient events -
Battery
1 pc type AAA Battery Cover
Serial
Number
Symbols
Recorder
Configuration type
Patient Cable
Record reading
indicator lamp

ECG HOLTER SYSTEM INSTRUCTIONS FOR STARTING HOLTER MONITORING
LABTECH LTD. V5.03_2014_11 17
4.2 Recorder components (EC-3H/ABP)
FRONT VIEW
Patient cable
- Easy to replace -
Cuff
Pneumatic tube
Event Button
Event LED

INSTRUCTIONS FOR STARTING HOLTER MONITORING ECG HOLTER SYSTEM
18 V5.03_2014_11 LABTECH LTD.
4.1.1 Signs and alarms of EC-3H/ABP
The recorder contains a single RGB LED with which you can indicate several colours
and hues.
Light signal Description What should we do?
The LED light is
red.
Hardware error After detecting the hardware error it waits
a few seconds and restarts automatically.
If it’s not then you should restart the
recorder by removing the batteries and
taking them back. If the problem still
occurs it requires repair.
The LED is red
and flashing.
The battery has run
out.
Battery exchange required.
The LED light is
green.
The recorder connects
to the PC through the
USB data transfer
cable and it works
properly.
-
The green LED
light flashes
quickly.
The recorder connects
to the PC through the
USB data transfer
cable and and there is
data transfer between
the PC and the
recorder.
The rythm of the
flashing is
syncronized with the
rythm of data transfer.
-
The green LED
seldom flashes
The recorder is ready
to start recording
(doesn’t contain any
unread records, the
self-test and
-

ECG HOLTER SYSTEM INSTRUCTIONS FOR STARTING HOLTER MONITORING
LABTECH LTD. V5.03_2014_11 19
Light signal Description What should we do?
initialization was
successfully
completed).
The yellow LED
flashes.
The device is
recording.
-
A crimson LED
flashes
The recorder contains
unread record.
You should read the last record from the
recorder, otherwise you cannot start the
next record and the device won’t turn on
the Bluetooth modul.
Blue LED seldom
flashes
There is Bluetooth
connection between
the PC and recorder.
-
Blue LED flashes
quickly
There is data transfer
between the PC and
recorder.
-
The recorders include a zümmer which can operate in different frequencies. By this the
recorders are able to display the different statuses and errors.
Signal Rhythm,
tune Status description
One high-pitched short beep Push-button event on the recorder
or on the PC (Start/Stop BP).
One short beep in deep voice The device was removed from
the USB.
One high-pitched long beep Start of recording.
Stop of recording.
The recorder beeps for some
seconds on a high-pitched voice.
Hardware error.

INSTRUCTIONS FOR STARTING HOLTER MONITORING ECG HOLTER SYSTEM
20 V5.03_2014_11 LABTECH LTD.
Signal Rhythm,
tune Status description
Two high-pitched short beep Cannot start recording (no patient
data).
Push-button event, but there is no
function related to pushing the
Push-button in the current state of
the recorder (for example: the
recorder connects to the USB).
Two short beep in deep voice The device was connected to
USB.
Two short beep with rising melody Bluetooth connection was
created.
Two short beep with descending
melody
Bluetooth connection was
broken.
Three high-pitched short beep After the battery was put in the
initialization, selftest was
successfully completed.
Four high-pitched short beep Discharged battery.

ECG HOLTER SYSTEM INSTRUCTIONS FOR STARTING HOLTER MONITORING
LABTECH LTD. V5.03_2014_11 21
4.3 Database management interface
The database management interface enables us to add physicians and patients by name
and ID number (e.g., social security number), which can be sorted and filtered
according to different criteria. The interface also offers a search option by name or ID.
The database management interface displays the list of patients and the pertaining
number of records. Here we can view previous records and start new recordings as
well.
4.1.2 Toolbar
The toolbar contains buttons which provide access to the most often used functions in
the software.
New patient: Here you can add new patients to the list. Patient’s first and last names,
birth dates and patient IDs are fields which need to be filled in. The
software allows only unique patient IDs to be entered into the database,
which is the reason why it is recommended to use this field for entering the social
security number of each patient (or any other code which uniquely identifies a person).
Entering address and height is optional when registering a patient.
Modify: Patient data can be edited by clicking on the Modify button. The interface
allows every field to be edited except patient ID (social security number)
2.2.2
2.2.8
2.2.5
2.2.6
2.2.1
2.2.4
2.2.7 2.2.3
INSTRUCTIONS FOR STARTING HOLTER MONITORING ECG HOLTER SYSTEM
22 V5.03_2014_11 LABTECH LTD.
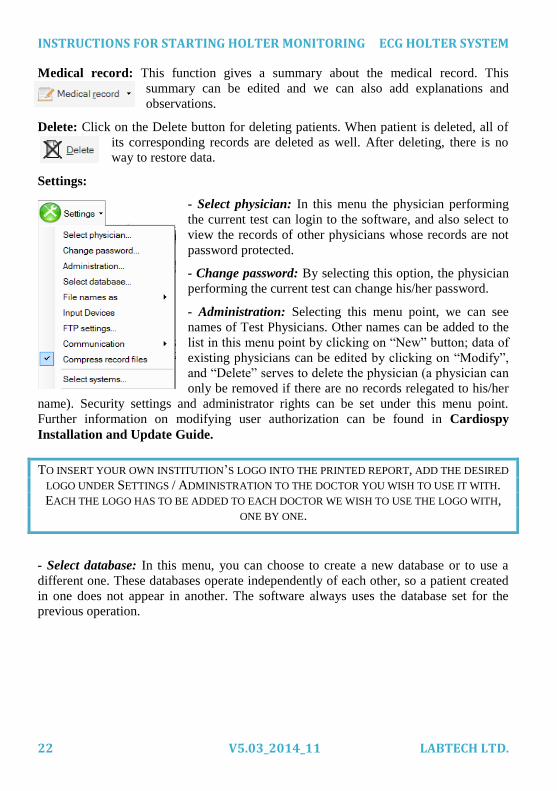
Medical record: This function gives a summary about the medical record. This
summary can be edited and we can also add explanations and
observations.
Delete: Click on the Delete button for deleting patients. When patient is deleted, all of
its corresponding records are deleted as well. After deleting, there is no
way to restore data.
Settings:
- Select physician: In this menu the physician performing
the current test can login to the software, and also select to
view the records of other physicians whose records are not
password protected.
- Change password: By selecting this option, the physician
performing the current test can change his/her password.
- Administration: Selecting this menu point, we can see
names of Test Physicians. Other names can be added to the
list in this menu point by clicking on “New” button; data of
existing physicians can be edited by clicking on “Modify”,
and “Delete” serves to delete the physician (a physician can
only be removed if there are no records relegated to his/her
name). Security settings and administrator rights can be set under this menu point.
Further information on modifying user authorization can be found in Cardiospy
Installation and Update Guide.
- Select database: In this menu, you can choose to create a new database or to use a
different one. These databases operate independently of each other, so a patient created
in one does not appear in another. The software always uses the database set for the
previous operation.
TO INSERT YOUR OWN INSTITUTION’S LOGO INTO THE PRINTED REPORT, ADD THE DESIRED
LOGO UNDER SETTINGS / ADMINISTRATION TO THE DOCTOR YOU WISH TO USE IT WITH.
EACH THE LOGO HAS TO BE ADDED TO EACH DOCTOR WE WISH TO USE THE LOGO WITH,
ONE BY ONE.

ECG HOLTER SYSTEM INSTRUCTIONS FOR STARTING HOLTER MONITORING
LABTECH LTD. V5.03_2014_11 23
Clicking on the Add button creates a new
database. If you need to work with a
different one, select it and click on OK.
There are three possible ways to create a
database:
Local database folder: The database is
stored in a local directory on your
computer. Network drives are not
supported. Optimal for single computer
usage. Select the directory for the
database and it is ready.
- Network mode- Microsoft SQL Server:
SEE DESCRIPTION IN INSTALLATION AND
UPDATE GUIDE’S CHAPTER 4.3.
SQLite database: SEE DESCRIPTION IN
INSTALLATION AND UPDATE GUIDE’S
CHAPTER 4.2.
- File names as: The order of first and last name can be set in this menu.
- Input devices: Barcode readers and magnetic card readers can be set here.
- FTP settings: SEE DESCRIPTION IN INSTALLATION AND UPDATE GUIDE’S CHAPTER 5.1.
- Communication: HL7 communication protocol can be started here.

INSTRUCTIONS FOR STARTING HOLTER MONITORING ECG HOLTER SYSTEM
24 V5.03_2014_11 LABTECH LTD.
- Select systems:
Here you can select the ECG systems you
wish to use. Inactive systems will not
appear in the field of Selected Systems. A
system is inactivated by removing the
green tick from the box to its left.
Help:
- User manual: Choose the system in the Select systems
panel (further description in point 2.2.5). Once you click on
User manual button, the user manual of the currently
selected system will appear.
- Installation and update guide: The guide on software
installation and system configuration also contains a
description of the software update process.
- What’s new: The novelties of the current software version can be found in this option.
- Languages: The software offers a choice of several languages, from which you can
select the one you wish to work in.
- Multilanguage translator: This function enables the user to translate each term
appearing in the software into the desired target language. A password is necessary to
enter this menu point. In case you would like to use this function, turn to your
distributor for a password.
- About: Information on software version, the operational system and copyrights can be
found here.

ECG HOLTER SYSTEM INSTRUCTIONS FOR STARTING HOLTER MONITORING
LABTECH LTD. V5.03_2014_11 25
ECG Device Connection Status Indicator: This indicator shows the current
connection status of the devices (the USB-02 interface, the ECG recorder, the blood
pressure monitor and the stress device).
The ECG Device Connection Status Indicator has three types: the first one is used with
the Holter, ABP and Resting Test systems. The second type is used with the Stress Test
systems, and the third type with the Continuous ECG systems.
1
2
1
2 3 4 5
1
2
.
3 5
1. Status of Bluetooth or direct connection
2. Status of connection with Holter ECG recorder /ABP recorder / Resting ECG
recorder / Test ECG recorder
3. Status of connection with blood pressure monitor
4. Status of connection with loading machine
5. Status of connection with Pulse Oximeter (this section is only available when Pulse
Oximeter is activated under System Configuration menu)
Colour codes for the ECG Devices Connection Status Window:
green - The device is properly connected
yellow - Manual operation, the device is not connected to the computer
red – No connection with the device
grey – No connection is needed for recording
4.1.3 List of patients
This menu point lists the patients in the database. Clicking on the appropriate tab of the
header sorts the available data by patient’s first or last name, date of birth, ID number,
or date of the last record.

INSTRUCTIONS FOR STARTING HOLTER MONITORING ECG HOLTER SYSTEM
26 V5.03_2014_11 LABTECH LTD.
4.1.4 Records toolbar
This is a toolbar for managing existing records.
Load record: Opens the selected record from the list. Once the record
is open we can edit, analyze or print it.
Import / export: In this menu point we can save the current record to the directory of
our choice. This directory can be on a network drive or on a
portable drive (e.g., USB stick). The name of the exported
record will include the first and last name of the patient, the
date of recording and patient ID, separated by low lines. We
can also import any previously saved (exported) record from
any directory. The imported record is automatically saved to
the current database.
- Import selected records: With this function we can import
records from a directory of our choice. Should you need to
import more records at a time, select records while holding
the CTRL key, then press Import selected records.
- Import records by date: Imports all the records of a selected directory which were
recorded in a given interval.
- Download from FTP: We can download records from the given FTP server. We can
see all the available directories and Cardiospy files in the appearing window, the left
side column is for navigation among folders, the right one is for Cardiospy files. The
files can be arranged according to their Names, IDs, Record dates and Upload dates, and
a search bar is also available to help find the necessary record. Holding the Ctrl button
enables highlighting and downloading multiple records at a time. Records can be
deleted by pressing the Delete button, and triggering the “Delete downloaded records”
automatically erases all records after downloading them.
ECG HOLTER SYSTEM INSTRUCTIONS FOR STARTING HOLTER MONITORING
LABTECH LTD. V5.03_2014_11 27
- Export selected records: With this function we can export records selected in the list
of records. Should you need to export more records at a time, select records while
holding the CTRL key, then press Export selected records.
- Export records by date: Exports all the records which were recorded in a given
interval.
- Export records of selected patients: Holding CTRL while clicking on several patients
enables the multiple selections of patients. This option saves all the records of the
selected patients.
- Upload to FTP: We can select multiple records from a single patient and upload them
to the given FTP server.
- Upload to FTP by date: Every record is uploaded which fits to all the criteria given
and was recorded within a given period.
- Upload to Labtech: In case you have any problem with the interpretation of a record,
or you face any difficulties you can upload the record to the Labtech server.
- Print rest records by date: Prints every rest record which was made with the given
conditions and recorded in a given interval.
- Import sample data: In case a CD was used for installing the Cardiospy software and
there are no sample records in the database, you can import them by pressing this
button.
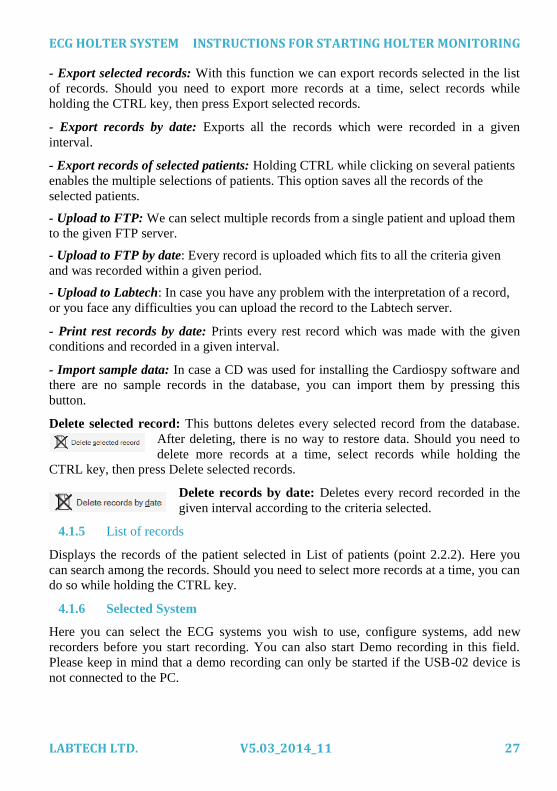
Delete selected record: This buttons deletes every selected record from the database.
After deleting, there is no way to restore data. Should you need to
delete more records at a time, select records while holding the
CTRL key, then press Delete selected records.
Delete records by date: Deletes every record recorded in the
given interval according to the criteria selected.
4.1.5 List of records
Displays the records of the patient selected in List of patients (point 2.2.2). Here you
can search among the records. Should you need to select more records at a time, you can
do so while holding the CTRL key.
4.1.6 Selected System
Here you can select the ECG systems you wish to use, configure systems, add new
recorders before you start recording. You can also start Demo recording in this field.
Please keep in mind that a demo recording can only be started if the USB-02 device is
not connected to the PC.
INSTRUCTIONS FOR STARTING HOLTER MONITORING ECG HOLTER SYSTEM
28 V5.03_2014_11 LABTECH LTD.
4.1.7 Filters
This field provides a number of filters which enable the filtering of records by different
criteria. Once the database is filtered, List of patients displays only those who fit the
criteria.
You can filter records by:
- Physician: When this filter is used, List of patients displays those patients whose
records have been made by the doctor selected.
- Date: When this filter is used, List of patients displays those patients who have
records made today / in the last 2 days / in the last 7 days / this month / this year.
- Status: When this filter is used, List of patients displays those patients who have
temporary / pre-evaluated / evaluated / approved records.
- Record type: When this filter is used, we can view all types of records or only those
pertaining to the system currently selected in Select system field.
- Pacemaker: When this filter is used, we can view patients who have and those who do
not have a pacemaker in separate lists.
4.1.8 Search
The Search (name or ID) field is used for narrowing down the list of patients
displayed. Once we enter a letter or a number in the field, List of patients will only
display patients whose first or last name, or the ID begins with the pertinent letter or
number. The more letters we type in the field, the more we narrow down the number of
patients appearing in the list. Clicking on the Reset button cancels the filtration and the
default List of patients will appear, where every patient and every record is displayed.
4.1.9 Database information
This field contains general information about the database, such as access path, number
and size of records contained, etc.

ECG HOLTER SYSTEM INSTRUCTIONS FOR STARTING HOLTER MONITORING
LABTECH LTD. V5.03_2014_11 29
How to start a New Recording?
4.1.10 Patient preparation
Step 1: Place the case of the recorder unit on the right side of the patient and fix it on
the belt on his/her waist. Although the case is washable, it is recommended to avoid
skin-contact.
Step 2: Clean the surface of the skin thoroughly using:
- razor /in case it is necessary/
- abrasive preparation pad and
- alcohol swab
The Holter System is designed for external skin-surface ECG recording. The electrodes
can be applied only on injury-free skin.
Step 3: Attach the single-use electrodes as it is indicated below and by keeping to the
instructions shown on the electrode’s package.
Step 4: Connect the patient cable to the attached electrodes.
Step 5: Secure the cables below the electrodes one by one by making a loop on each
of the cables and secure them to the skin by adhesive plaster.
NOTE: A NOISE-FREE RECORD CAN BE OBTAINED ONLY IF ALL THE STEPS OF PATIENT
PREPARATION HAVE BEEN FOLLOWED ACCORDING TO THE INSTRUCTIONS. DO NOT START
THE RECORDING IF ECG SIGN IS NOISY.
FOR MORE INSTRUCTIONS PLEASE CHECK THE PATIENT’S PREPARATION INSTRUCTIONS.
Yellow

INSTRUCTIONS FOR STARTING HOLTER MONITORING ECG HOLTER SYSTEM
30 V5.03_2014_11 LABTECH LTD.
3 lead placement (1 CH)
Standard 1
AHA Label IEC Label Electrode Placement
CH1+ CH1+ 6th intercostal space at the anterior axillary's line
CH1- CH1- Right clavicle, lateral to the mid-clavicle line
RL N Lowest rib on right side of chest

ECG HOLTER SYSTEM INSTRUCTIONS FOR STARTING HOLTER MONITORING
LABTECH LTD. V5.03_2014_11 31
5 lead placement (2 CH)
Standard 1
AHA Label IEC Label Electrode Placement
CH1+ CH1+ 6th intercostal space at the anterior axillary's line
CH1- CH1- Right clavicle, lateral to the mid-clavicle line
CH2+ CH2+ Approximately 1 inch right of Xiphoid Process on the
rib.
CH2- CH2- Left clavicle, lateral of sternum border
RL N Lowest rib on right side of chest

INSTRUCTIONS FOR STARTING HOLTER MONITORING ECG HOLTER SYSTEM
32 V5.03_2014_11 LABTECH LTD.
5 lead placement (2 CH)
Standard 2
AHA Label IEC Label Electrode Placement
CH1+ CH1+ 4th intercostal space at left border of sternum
CH1- CH1- Left clavicle, lateral of sternum border
CH2+ CH2+ 6th intercostal space at the anterior axillary's line
CH2- CH2- Right clavicle, lateral to the mid-clavicle line
RL N Lowest rib on right side of chest

ECG HOLTER SYSTEM INSTRUCTIONS FOR STARTING HOLTER MONITORING
LABTECH LTD. V5.03_2014_11 33
5 lead placement (2 CH)
Orthogonal
AHA Label IEC Label Electrode placement
CH1+ CH1+ 5th intercostal space at the mid line of left axillary
CH1- CH1- 5th intercostal space at the mid line of right axillary
CH2+ CH2+ Lowest rib on left side of chest
CH2- CH2- Left clavicle, lateral of sternum border
RL N Lowest rib on right side of chest

INSTRUCTIONS FOR STARTING HOLTER MONITORING ECG HOLTER SYSTEM
34 V5.03_2014_11 LABTECH LTD.
7 lead placement (3 CH)
Standard 1
AHA Label IEC Label Electrode Placement
CH1+ CH1+ 6th intercostal space at the anterior axillary's line
CH1- CH1- Right clavicle, lateral to the mid-clavicle line
CH2+ CH2+ Approximately 1 inch right of Xiphoid Process on the
rib.
CH2- CH2- Left clavicle, lateral of sternum border
CH3+ CH3+ 6th intercostal space on left midclavicular line
CH3- CH3- Manubrium sternum
RL N Lowest rib on right side of chest

ECG HOLTER SYSTEM INSTRUCTIONS FOR STARTING HOLTER MONITORING
LABTECH LTD. V5.03_2014_11 35
7 lead placement (3 CH)
Standard 2
AHA Label IEC Label Electrode Placement
CH1+ CH1+ 4th intercostal space at left border of sternum
CH1- CH1- Left clavicle, lateral of sternum border
CH2+ CH2+ 6th intercostal space at the anterior axillary's line
CH2- CH2- Right clavicle, lateral to the mid-clavicle line
CH3+ CH3+ 6th intercostal space on left midclavicular line
CH3- CH3- Manubrium sternum
RL N Lowest rib on right side of chest
INSTRUCTIONS FOR STARTING HOLTER MONITORING ECG HOLTER SYSTEM
36 V5.03_2014_11 LABTECH LTD.
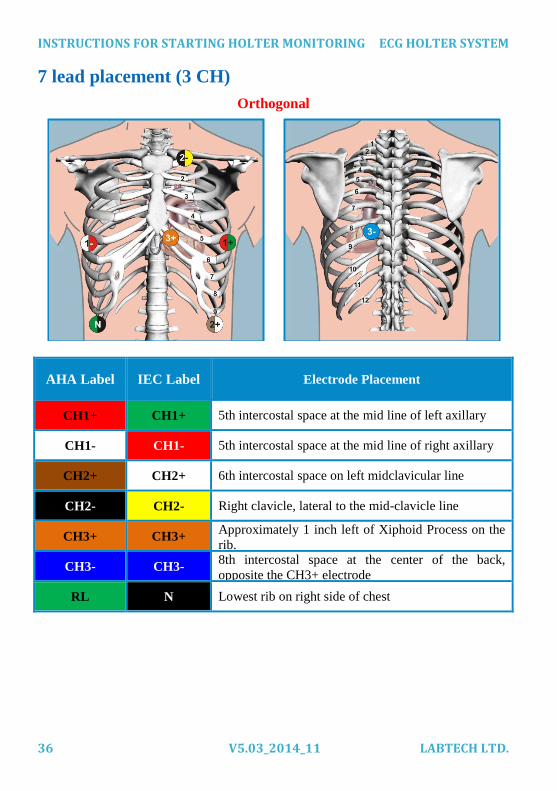
7 lead placement (3 CH)
Orthogonal
AHA Label IEC Label Electrode Placement
CH1+ CH1+ 5th intercostal space at the mid line of left axillary
CH1- CH1- 5th intercostal space at the mid line of right axillary
CH2+ CH2+ 6th intercostal space on left midclavicular line
CH2- CH2- Right clavicle, lateral to the mid-clavicle line
CH3+ CH3+ Approximately 1 inch left of Xiphoid Process on the
rib.
CH3- CH3- 8th intercostal space at the center of the back,
opposite the CH3+ electrode
RL N Lowest rib on right side of chest

ECG HOLTER SYSTEM INSTRUCTIONS FOR STARTING HOLTER MONITORING
LABTECH LTD. V5.03_2014_11 37
10 lead placement (12 CH)
Standard 1
AHA Label IEC Label Electrode Placement
V1 C1 Fourth intercostal space at the right sternal border.
V2 C2 Fourth intercostal space at the left sternal border.
V3 C3 Midway between C4 and C2.
V4 C4 Mid-clavicular line in the fifth intercostal space.
V5 C5 Anterior axillary line on the same horizontal level as C4.
V6 C6 Mid-axillary line on the same horizontal level as C4 and
C5. LA L Slightly below left clavicle.
RA R Slightly below the right clavicle
LL F Lower edge of the rib cage, or at the level of the
umbilicus at the left and right mid-clavicular lines. RL N
INSTRUCTIONS FOR STARTING HOLTER MONITORING ECG HOLTER SYSTEM
38 V5.03_2014_11 LABTECH LTD.
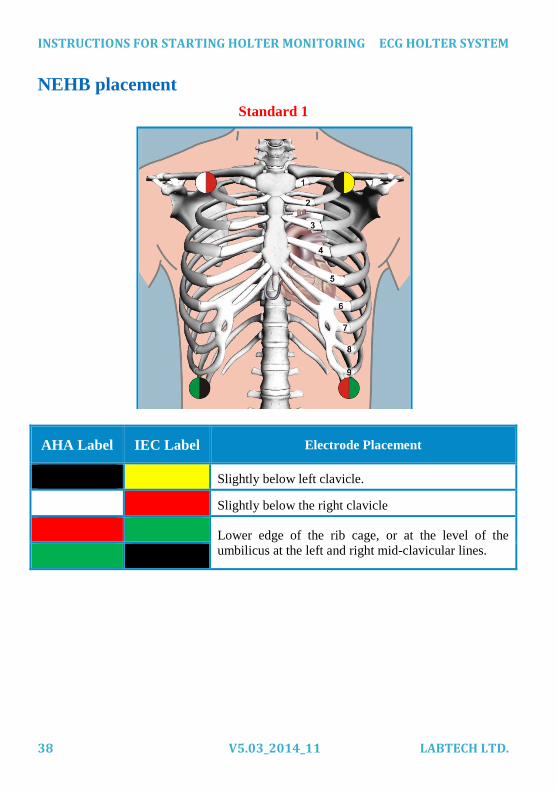
NEHB placement
Standard 1
AHA Label IEC Label Electrode Placement
Slightly below left clavicle.
Slightly below the right clavicle
Lower edge of the rib cage, or at the level of the
umbilicus at the left and right mid-clavicular lines.
ECG HOLTER SYSTEM INSTRUCTIONS FOR STARTING HOLTER MONITORING
LABTECH LTD. V5.03_2014_11 39
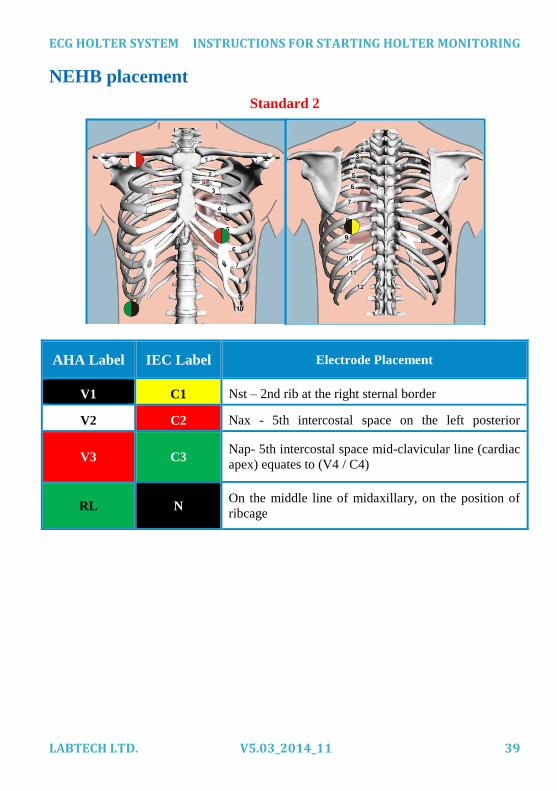
NEHB placement
Standard 2
AHA Label IEC Label Electrode Placement
V1 C1 Nst – 2nd rib at the right sternal border
V2 C2 Nax - 5th intercostal space on the left posterior
axillary line directly opposite (on the back,) from 3
(Nap) V3 C3
Nap- 5th intercostal space mid-clavicular line (cardiac
apex) equates to (V4 / C4)
RL N On the middle line of midaxillary, on the position of
ribcage

INSTRUCTIONS FOR STARTING HOLTER MONITORING ECG HOLTER SYSTEM
40 V5.03_2014_11 LABTECH LTD.
4.1.11 New Recording
Before starting a new recording, you have to add the recorder you wish to record with.
Please follow the steps below:
1/ Press the System configuration icon to add a new recorder. Press the Add new
recorder button.
2/ Connect the recorder via USB cable to your PC, if the connection is stable, you
will see the following window:
3/ Disconnect the recorder from your PC, connect a patient cable to the recorder,
choose from the list the serial number of the recorder you wish to use and press
Start monitoring with the selected recorder.
When you have added a new recorder or chosen a registered one, you may start the
recording in one of two ways:
- from the computer: when starting the recording from the computer, it is possible to
check the ECG signal before the start.

ECG HOLTER SYSTEM INSTRUCTIONS FOR STARTING HOLTER MONITORING
LABTECH LTD. V5.03_2014_11 41
- by pressing the button on the recorder: it is more convenient when the patient cannot
go to a computer, e.g., in case of a bed-ridden patient.
4.1.12 Holter monitoring settings
Patient tab: When start of ABP recording there is an opportunity in the program to
enter the name of the doctor who requested the examination and the medication and
symptoms of the patient. The information will be put in the record and will be available
if you scan it on another PC. If you import automatic report then the symptoms and
medication field’s content will be imported to the report, as well. The doctor’s name
will be imported to every report’s letterhead.
At the Measurement tab you can find the
setting of waking period you can modify
it after the record was read, as well. You
can also set the frequency of the BP
measurement the maximum pressure of
the cuff and right after the output of the
recorder it is able to measure.
Miscellaneous tab: Here you can find the
miscellaneous settings. Monitoring and
reading (Loading record after reading: If
you connect the recorder to the PC the
record will be imported to the database
and automatically loads in.) Length of
recording (Here you can set the length of
record). QRS signal: the program sign the
QRS beat arrival with sound signal during
the monitoring process. Recording (setup
of the length of the record, frequency of
sampling, see detailed in Chapter 7.2)
Filters (base line and muscle contraction filtering are switched on during the monitoring
process).
4.1.13 Starting a recording from the computer
Please follow the steps below:
a) Select the patient from the database whom you wish to
make a record of.
b) Click on the Holter ECG icon in the Selected System
menu point.
c) Click on Start Recording button to start monitoring.

INSTRUCTIONS FOR STARTING HOLTER MONITORING ECG HOLTER SYSTEM
42 V5.03_2014_11 LABTECH LTD.
- The USB-02 Bluetooth interface unit should be connected to your PC.
d) Check the quality of the ECG signal.
e) Start a test record with the Start BP command in the right bottom corner
f) If you find it acceptable, start monitoring by clicking on YES, START Recording
indicated on the screen.
You will see a confirmation that the recording has been started succesfully:

ECG HOLTER SYSTEM INSTRUCTIONS FOR STARTING HOLTER MONITORING
LABTECH LTD. V5.03_2014_11 43
4.1.14 Starting a recording without a computer
Use this method only in situations when patient is limited in his/her movement (e.g.,
due to his/her illness).
a) Select the patient from the database whom you wish to make a record of.
b) In case you have not done so yet, disconnect the USB-02 interface device from PC.
c) Connect the recorder to theh USB reader cable.
d) Click the Start without PC button to start recording. As soon as it starts, the recorder
saves the patient’s data and the parameters of the recorder. If the procedure is successful
you will see the following window.
d) Take the recorder to the patient place the electrodes as it was shown before.
Push the event button until you hear a long beep signal (approximately 3 sec.) to start
recording.
The program saves the starting and ending times as well as the duration of the
monitoring.

INSTRUCTIONS FOR STARTING HOLTER MONITORING ECG HOLTER SYSTEM
44 V5.03_2014_11 LABTECH LTD.
4.1.15 Patient’s event log printing
After pressing ‘start record’ button the pop up window offer the printing of the patient’s
event log. The verification of Personal data is possible or making modification if needs.
The printed out event log can be hand out to the patient for making notes about his/her
complaint, uncommon activities and medication.

ECG HOLTER SYSTEM INSTRUCTIONS FOR STARTING HOLTER MONITORING
LABTECH LTD. V5.03_2014_11 45
Reading a Record
The recording stops automatically after 8-24-48-72-168 hours or when the batteries go
flat or when they are removed.
Continuous record: During recording it is possible to replace flat batteries so longer
recording can be made (IN CHAPTER 6 IN SPECIFICATIONS TABLE it is shown how many
batteries are needed for one recording) , the patient cable can be detached as well during
recording; when reattached recording continues automatically.
It is advisable to remove the batteries first and then the cables from the electrodes.
Otherwise the end of the recording cannot be analyzed because of lead-off error. For
reading a record, please follow the steps below:
a) Remove the batteries from the recorder unit (this ends the recording, if the preset time
has not expired yet, otherwise the recording automatically stops at the preset time
b) Take off the recorder-case from the patient and remove the electrodes from him/her.
c) Start the Cardiospy program on the computer. Then select the holter system.
d) Attach the recorder to the USB reader cable. Then reading starts automatically.
BEFORE READING THE RECORDING YOU HAVE THE OPTION TO SET THE AUTOMATIC
SENDING OF RECORDING TO THE FTP SERVER IN THE SYSTEM CONFIGURATON WINDOW
UNDER THE SETTINGS TAB. THIS WAY, AFTER READING THE RECORD IS AUTOMATICALLY
UPLOADED TO THE PRESET FTP SERVER.

ANALYSIS WITH THE CARDIOSPY SOFTWARE ECG HOLTER SYSTEM
46 V5.03_2014_11 LABTECH LTD.
5 Analysis with the Cardiospy Software
Views
We can view the recorded ECG curve and its calculated parameters in several forms.
The following chapter is dedicated to listing these views in the order they appear in the
software interface.
5.1.1 Main window
The Main window has three fields, all of which vary according to the tab selected at the
left side. The graphs are colour-coded, which means that areas suspected to be
pathological are highlighted in different colours.
HR, BP, ACL
The uppermost section of the Main window displays the heart rate graph, which shows
us heart rate calculated from the ECG signal (for the definition of Avg Hr, go to chapter
3.4), motion intensity, and in case the recorder comes with an integrated ABPM
component, this graph shows blood pressure values as well. With the two arrows below
the tabs this component can be removed, giving more space to the middle part. The
heart rate graph is able to display the time distribution of events selected in Events
menu. The temporal occurrence of individual events is indicated by small vertical lines.
Customisation of the upper HR graph is possible at the Holter record investigation

ECG HOLTER SYSTEM ANALYSIS WITH THE CARDIOSPY SOFTWARE
LABTECH LTD. V5.03_2014_11 47
which makes more visible of the HR graph:
- Default (0-200) ordinary enlargement
- Optimized: enlarging the range between the minimum and maximum value
- 50-150 range display
- 50-200 range display
QT/ST
The algorithm calculates ST and QT values from normal beats and right- or left bundle
branch blocks. The displayed value is calculated from the averages of beats within a
ten-second range of the given ruler position. In case a section of ECG does not contain
any right- or left bundle branch blocks, then ST is not calculated or displayed. The ST
level is calculated from the J+ point (see Settings/Parameters/ECG-ST). We can also
edit QT, QTc and ST values in the software (see chapter 3.3).
The scaling of the ST chart (the ST levels) can be changed with the zoom
button found in the upper menu, if the ST level does not fit into the 1X
range then you can set it to 0,5X range, and if the ST levels are too small
you can set it to 2X range to zoom in.
Events
By selecting Events from the tabs on the left side, we can see a summary containing
events of the entire record. The graph has three columns: the left column contains Event
types; the second column displays their time distribution and the third one, on the right
side, shows the aggregate number of each event. Each type of event can be selected by a
single left-click of the mouse, which changes background color and broadens the
selected line.
You can edit the list of events (e.g. delete a single or a group of events. See also chapter
3.3). Under the menu of Settings / Events it can be configurated. You can set the order
of events, can place events into and out of the view.

ANALYSIS WITH THE CARDIOSPY SOFTWARE ECG HOLTER SYSTEM
48 V5.03_2014_11 LABTECH LTD.
Full View
In this menu we can overview a longer section of the ECG curve. The window displays
the number of ECG channels selected in the ECG field. Depending on the ECG paper
speed, ECG intervals of either 30 seconds or 60 seconds can be displayed here. The
ECG field in the lower section displays the sub-section which we select in the middle
section by left-clicking the mouse. If you turn off the channels and set the amplitude in
the upper menu, and remove the HR chart with the two arrows then you will see a
longer section of ECG on your screen.
Atrial Fibrillation
This tab displays the graph of NN Intervals, which helps us check the correct detection
of Atrial Fibrillation. You can edit the AF intervals (e.g., insert AF intervals, delete a
single or a group of AF intervals. See also chapter 3.3)
Noise
The significance of this function is that it enables us to mark any section as noise, either
from the HR or ECG field. Conversely, sections of noise can also be marked as normal
in this function. (See chapter 3.3) Apart from this, the intervals marked as noise by the
software’s automatic noise detector are indicated by a different background colour.
ECG – normal window
The ECG field displays the selected channels in the desired degree of magnification.
Clicking on Median button in the lower left corner displays the median pertaining to the

ECG HOLTER SYSTEM ANALYSIS WITH THE CARDIOSPY SOFTWARE
LABTECH LTD. V5.03_2014_11 49
selected ECG section. Both the median and the ECG curve can be measured in terms of
time and amplitude. Editing is enabled in the ECG field (e.g., insert, delete or classify
QRS. SEE ALSO CHAPTER EDITING AND MEASURING OPTIONS)
Service
The Service field illustrates the technical details of the recording. It displays the lead-on
and lead-off intervals of each electrode, and the state of battery. You can see here what
version of recorder was used for the loaded recording.

ANALYSIS WITH THE CARDIOSPY SOFTWARE ECG HOLTER SYSTEM
50 V5.03_2014_11 LABTECH LTD.
5.1.2 ECG window – large window
The ECG window displays the ECG curve in a larger screen-space. You can view the
ECGs in two columns.
You can edit in the ECG field (e.g., insert, delete or classify QRS. SEE ALSO CHAPTER
EDITING AND MEASURING OPTIONS)
T alternans

ECG HOLTER SYSTEM ANALYSIS WITH THE CARDIOSPY SOFTWARE
LABTECH LTD. V5.03_2014_11 51
In the HR field the time interval is marked with red lined, where the SW detected T
alternans. The detection is completed for each holter channel, that is why the event line
belongs to that channel, which was chosen in the ECG field.
To T alternans events the amplitude belongs as well, which shows the alternans’s
amplitude size in the uV.
The SW offers the editing possibility as well: deleting of T alternans intervals (SEE
ALSO CHAPTER EDITING AND MEASURING OPTIONS)
The meaning of alternans’s amplitude:
X [uV]
𝐴 = 𝑋
2.
On the picture the QRS with
even indexes are marked with
blue, the odd ones are marked
with red.

ANALYSIS WITH THE CARDIOSPY SOFTWARE ECG HOLTER SYSTEM
52 V5.03_2014_11 LABTECH LTD.
5.1.3 Templates window
The analysis software classifies each heartbeat (N, S, V) and clusters similar formations.
Filter templates by function in the upper right corner serves to display QRS complexes
of different types altogether or individually.

ECG HOLTER SYSTEM ANALYSIS WITH THE CARDIOSPY SOFTWARE
LABTECH LTD. V5.03_2014_11 53
Meaning of the information on cluster pictures:
Cluster cleanness measuring circle (homogeneity)
Clean cluster
Somewhat mixed cluster
Extremely mixed cluster
If a cluster is marked with green circle, it means that the QRS complexes belonging to
the cluster show very similar forms to the cluster QRS shape. The red area in a circle
signifies the percentage of non-similar QRS shapes.
The validation of a type of cluster means the affirmation of the type. If you click on a
template the program automatically puts a yellow check mark as a default setting. This
is good to see in which template you have already been. You can switch off the
automatic check mark under the menu of Settings (Automatic check mark, choosing
form). If you want to confirm the automatic checking you can click on the yellow check
mark which will turn green as proof of that the template has been searched thoroughly.
Not validated type.
Automatic marking
Validated type by user
SEE ALSO CHAPTER EDITING AND MEASURING OPTIONS
Number of
beats Beat type
Cluster
cleanness Cluster
validation

ANALYSIS WITH THE CARDIOSPY SOFTWARE ECG HOLTER SYSTEM
54 V5.03_2014_11 LABTECH LTD.
5.1.4 HRV window
The HRV window provides detailed information on time and frequency parameters of
RR variability.
Time Distribution
Three graphs are displayed in this section: RR Intervals, RR Differences and Lorenz
plots. We can also edit data in the RR Intervals graph, for example we can validate or
revalidate the intervals (see chapter 3.2).Data edition is convenient, because the ECG
pertaining to each selected interval is displayed immediately in a lower section. Next to
the ECG-display we can see the Patient Risk graph, which is calculated from the HRV
parameters. To check the exact meaning of each parameter, CALCULATION AND
EVALUATION METHODS
To check data edition possibilities, SEE ALSO CHAPTER EDITING AND MEASURING
OPTIONS

ECG HOLTER SYSTEM ANALYSIS WITH THE CARDIOSPY SOFTWARE
LABTECH LTD. V5.03_2014_11 55
Histogram and Table
The first row of this graph displays SDNN values by a 5-minute division, the second
one contains SDNN calculated for 1 hour, the last two rows contain rMSSD and
PNN50% values. In the lower part of the screen we can see these values in table format.
To check the exact meaning of each parameter, see CALCULATION AND EVALUATION
METHODS

ANALYSIS WITH THE CARDIOSPY SOFTWARE ECG HOLTER SYSTEM
56 V5.03_2014_11 LABTECH LTD.
NN Intervals hourly: This graph displays NN intervals in an hourly division in 3d.
Frequency: In the representation of frequency range, three graphs are displayed: one
showing the period when the patient is awake, one when s/he is asleep, one for the total
period of the measurement time, represented in a 3D HRV frequency graph. The latter
can be represented in a 2D format as well. To check the exact meaning of each
parameter, SEE ALSO CHAPTER EDITING AND MEASURING OPTIONS

ECG HOLTER SYSTEM ANALYSIS WITH THE CARDIOSPY SOFTWARE
LABTECH LTD. V5.03_2014_11 57
RR Graphs: Here you can see the RR Max and Min ECG views and the diagram shows
the distribution of the RR intervals.
HR Turbulence: This menu point displays the HR turbulence both in graph and table
formats. To check the exact method for calculating HRV turbulence SEE ALSO CHAPTER
EDITING AND MEASURING OPTIONS.

ANALYSIS WITH THE CARDIOSPY SOFTWARE ECG HOLTER SYSTEM
58 V5.03_2014_11 LABTECH LTD.
5.1.5 QT Summary window
The values of the QT analysis are shown in the form of a distribution graph and a table.
We can choose to display QT or QTc values by selecting one of them at the left side of
the distribution graph, while the table displays both values.
ECG HOLTER SYSTEM ANALYSIS WITH THE CARDIOSPY SOFTWARE
LABTECH LTD. V5.03_2014_11 59
5.1.6 3.1.6 Pacemaker window
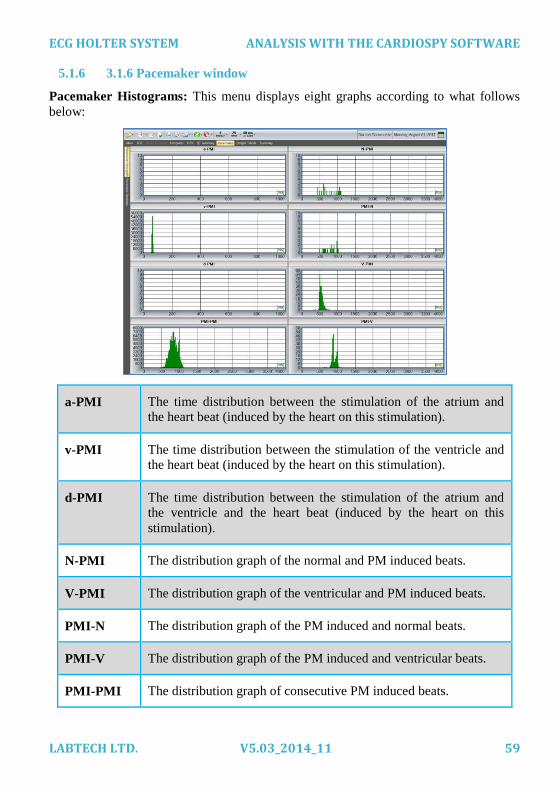
Pacemaker Histograms: This menu displays eight graphs according to what follows
below:
a-PMI The time distribution between the stimulation of the atrium and
the heart beat (induced by the heart on this stimulation).
v-PMI The time distribution between the stimulation of the ventricle and
the heart beat (induced by the heart on this stimulation).
d-PMI The time distribution between the stimulation of the atrium and
the ventricle and the heart beat (induced by the heart on this
stimulation).
N-PMI The distribution graph of the normal and PM induced beats.
V-PMI The distribution graph of the ventricular and PM induced beats.
PMI-N The distribution graph of the PM induced and normal beats.
PMI-V The distribution graph of the PM induced and ventricular beats.
PMI-PMI The distribution graph of consecutive PM induced beats.

ANALYSIS WITH THE CARDIOSPY SOFTWARE ECG HOLTER SYSTEM
60 V5.03_2014_11 LABTECH LTD.
Pacemaker Summary
Here you can view a table summary of the pacemaker analysis. The number of beats
induced by the PM is presented in the table in groups based on the type of the induction
in an hourly division. The table shows the failure of electric capture and failure to sense
events detected by the program as well.
The failure to capture (FTC) means that the pacemaker spike appears at the right time,
but it is not followed by QRS. The failure to sense (FTS) refers to premature pacemaker
stimulation, in which case the pacemaker produces a stimulus, without being stimulated
by the patient’s heart.

ECG HOLTER SYSTEM ANALYSIS WITH THE CARDIOSPY SOFTWARE
LABTECH LTD. V5.03_2014_11 61
5.1.7 Ectopic Trends Window
Ventricular: Represents the frequency of events related to V beats on the time axis.
The last graph shows the frequency of V episodes (consecutive V beats by length).
SupraVentricular: Represents the frequency of events related to S beats on the time
axis. The last graph shows the frequency of S episodes (consecutive S beats by length).

ANALYSIS WITH THE CARDIOSPY SOFTWARE ECG HOLTER SYSTEM
62 V5.03_2014_11 LABTECH LTD.
5.1.8 Summary window
This menu displays the most important findings in the automatic summary of the
monitoring in two formats.

ECG HOLTER SYSTEM ANALYSIS WITH THE CARDIOSPY SOFTWARE
LABTECH LTD. V5.03_2014_11 63
5.1.9 Vectorcardiography:
Vectorcardiographic display mode is available with records made with EC12H
recorders using 3-channel patient cables in orthogonal electrode placement. The
medians of the ECGs are displayed in 2D and 3D coordinate systems. Their display is
colour-coded which makes it easy to keep track of the QRS in the vectorcardiogram.
The assigning of ECG channels to axes is displayed by the software.
5.1.10 BP (EC-3H/ABP)
HR, BP graph
The graph presents Heart Rate and Blood Pressure measured by the ABPM device.

ANALYSIS WITH THE CARDIOSPY SOFTWARE ECG HOLTER SYSTEM
64 V5.03_2014_11 LABTECH LTD.
Table
The table displays all the BP results in a chronological order. We can validate /
invalidate each result by ticking / un-ticking the relevant checkbox in the column
marked “Valid”.
We can add short remarks to each measurement in the Comment column (double click).
Charts
The software represents systole and diastole values in the form of pie-charts.

ECG HOLTER SYSTEM ANALYSIS WITH THE CARDIOSPY SOFTWARE
LABTECH LTD. V5.03_2014_11 65
Graphs
The software shows BP burdens in the upper graph, while in the second graph Systole,
Diastole, MAP and HR values are displayed.
Histograms
In this part Systole, Diastole and Map values are represented in the form of histograms.

ANALYSIS WITH THE CARDIOSPY SOFTWARE ECG HOLTER SYSTEM
66 V5.03_2014_11 LABTECH LTD.
Statistics
Statistical parameters calculated from the validated Blood Pressure and Heart Rate
values are shown in a table format.
Scatter
In this function, the cohesive systole-HR, diastole-HR and Systole-Diastole points are
displayed.

ECG HOLTER SYSTEM ANALYSIS WITH THE CARDIOSPY SOFTWARE
LABTECH LTD. V5.03_2014_11 67
Toolbars
5.1.11 Database
This function gives you the possibility to go back to database or to
complete some operations in the database.
5.1.12 ECG leads
It is recommended to use this function in the case of 12-channel
recordings, when only three channels can be displayed in the ECG field.
Here we can select the channels to be displayed.
Millimeter paper setting
This window is active in stress and holter system, by clicking view menu, Millimetre
paper menu. Adjustment of millimetre paper size correlating to the monitor is possible.
It is possible to setup real, 1:1 scale appearance of the millimetre paper on screen.
Manual setting: setting
manually how many pixels
match for 1 mm.
Automatic setting: the cube
underneath is symbolising the
monitor, showing the resolution
and display size. The resolution of
the monitor is defined by the
system setup, but the display size
must be set by rolling the cursor
above the cube. Finalise the new
setting by pressing "Set to
recommended" button. Then press
the set button, and the program
sets the size on 1:1 scale, if the
monitor shows 10mm it will be the
same size in reality too.

ANALYSIS WITH THE CARDIOSPY SOFTWARE ECG HOLTER SYSTEM
68 V5.03_2014_11 LABTECH LTD.
Contrast modification of ECG curves
The modification of waves on the monitor is possible. Modify separately the line
stickiness of VES, SVES, normal beat curves. The program enables default settings to
distinguish each event. Modify the settings in Setting menu, ECG contrast tab.
5.1.13 Report
When selecting this menu, a movable text-box appears where the
physician can enter his/her comments. The patient data and the automatic
report generated by the program can be copied into this window by
clicking on the Import Automatic Report button.
You can display any window from the View menu, while the Report text-window is
still displayed, which is convenient as you can see your remarks and the necessary
information simultaneously. The text written in this window can be printed on a
separate page.
5.1.14 Sequence of tasks
The status of the record also appears in the database interface, which can
be used as a filtering option. See chapter 3.3.1.
5.1.15 Print
We can select to print the pages generated by the program in black-and-
white or in colour mode. We can also choose from the print settings.
More information in chapter 3.2.11.

ECG HOLTER SYSTEM ANALYSIS WITH THE CARDIOSPY SOFTWARE
LABTECH LTD. V5.03_2014_11 69
5.1.16 Printing of screen section
This function gives you the possibility to print the ECG section, which
can be seen on the screen.
5.1.17 Export
In this menu you can go through the pages completed by the program and
export separately (JPG, BMP, PDF). We can choose from the print
settings as well. More information in chapter 3.2.11.
5.1.18 Export Current Samples
There is an opportunity to directly export the selected ECG section on the
screen.
5.1.19 Settings
In this menu it is possible to set the various parameters of the program,
such as parameters relevant to the analysis, colours of the screen, graphs
to be displayed in the Main/Events menu.
In case we run a new analysis of the record, default settings will be restored, so all
previous editing will be lost.
Meaning of parameters
Time
Here we can set asleep and awake periods (related to the ECG and to blood pressure
measurement) and add special time intervals (only related to blood pressure
measurement).
ECG-Rhythm
Here we can find the settings of the ECG rhythm analysis. For the meaning of each
parameter go to chapter 3.3.
ECG-ST
Here we can set the limits of ischemic burden.
ECG-HR turbulence
Here we can set the parameters used for calculating turbulence and classifying patient
risk. For the meaning of each parameter go to chapter 3.3.

ANALYSIS WITH THE CARDIOSPY SOFTWARE ECG HOLTER SYSTEM
70 V5.03_2014_11 LABTECH LTD.
ECG-Misc
Here we can turn ECG filters on and off. A modification triggers the automatic analysis,
after which all previous editing will be lost.
We can also select each channel to be viewed in an inverted position. A modification
triggers the automatic analysis, after which all previous editing will be lost.
Blood Pressure
Here we can set parameters used for statistical calculations and measurement ranges
used for automatic pre-filtering. Here you can set the parameters for the analysis of
blood pressure measurement. Limits for children and adults can be adjusted separately.
Statistical limit: You can set the normal systole and diastole limits in every interval
separately. If the patient’s result exceeds this limit the program indicates that it is in a
high range (with red colour). Valid measurement range: The program’s analysis accepts
BP values within these ranges. If the results of certain measurements are outside of this
range the program takes the measurements out of the evaluation.
ECG contrast: In this menu you can set the ECG curve’s thickness displayed on the
screen, Normal, VES, SVES beats separately
Refreshing / method of analysing: You can choose from two methods, if you use an
older computer (low memory, weak processor) choose the:
Use of refresh button method. In this case the analysis does not run again and again
after every editing step, just when changing screens and if you click on the Refresh
button displayed on the screen.
The other method is ’validation of changes immediately’ which means that after each
completed editing operation the analysis runs. This is recommended for faster
computers.
ECG HOLTER SYSTEM ANALYSIS WITH THE CARDIOSPY SOFTWARE
LABTECH LTD. V5.03_2014_11 71
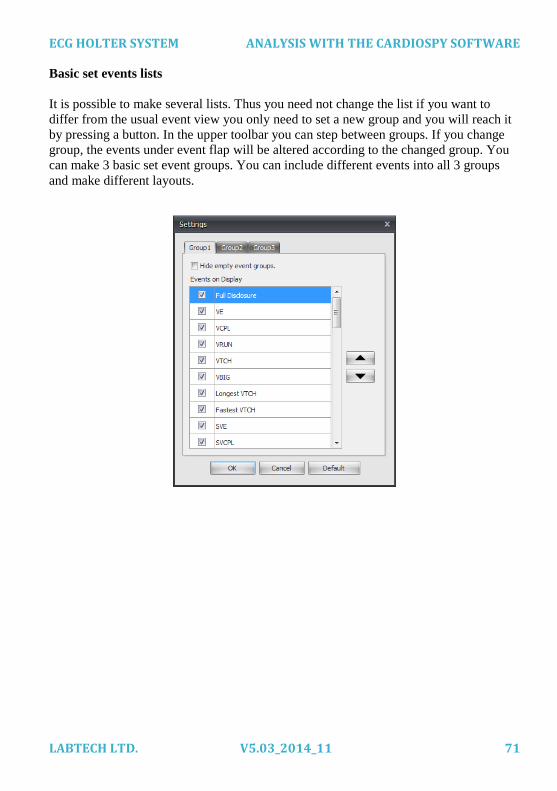
Basic set events lists
It is possible to make several lists. Thus you need not change the list if you want to
differ from the usual event view you only need to set a new group and you will reach it
by pressing a button. In the upper toolbar you can step between groups. If you change
group, the events under event flap will be altered according to the changed group. You
can make 3 basic set event groups. You can include different events into all 3 groups
and make different layouts.
ANALYSIS WITH THE CARDIOSPY SOFTWARE ECG HOLTER SYSTEM
72 V5.03_2014_11 LABTECH LTD.
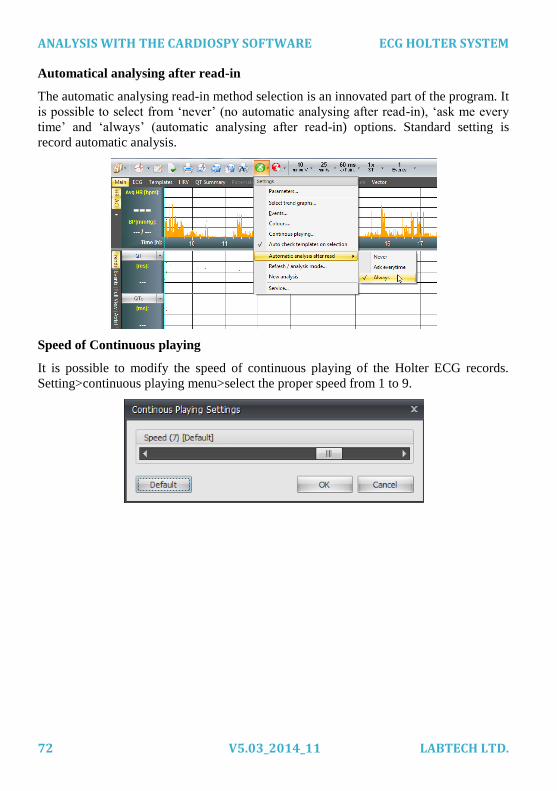
Automatical analysing after read-in
The automatic analysing read-in method selection is an innovated part of the program. It
is possible to select from ‘never’ (no automatic analysing after read-in), ‘ask me every
time’ and ‘always’ (automatic analysing after read-in) options. Standard setting is
record automatic analysis.
Speed of Continuous playing
It is possible to modify the speed of continuous playing of the Holter ECG records.
Setting>continuous playing menu>select the proper speed from 1 to 9.

ECG HOLTER SYSTEM ANALYSIS WITH THE CARDIOSPY SOFTWARE
LABTECH LTD. V5.03_2014_11 73
5.1.20 Automatic report
The selected reports automatic printout/export is possible in Printing/Export Setting
menu by clicking Automatic printing button.
This function is inactive until activating any of automatic modes in Print
preview/Settings menu.
Please activate this function in Printing Review>Setting menu>select an automatic
mode.
Possibilities for printing are: automatic printout, PDF, picture and DICOM export.

TOOLBARS ECG HOLTER SYSTEM
74 V5.03_2014_11 LABTECH LTD.
5.1.21 Print and export settings
ECG drawing: Here we can set the graph paper, the
EKG curve, the VES and the SVES curve’s
thickness on the print findings.
Cutting of noisy ECG: In the whole ECG view the
program completely cuts the noisy sections and they
do not appear on the finding.
Page layout: It is allowed to put a logo in the
finding’s headpiece; you can attach the expert’s
report to the Summary II finding or you can display
it as a separate finding. You can take off the
automatic expert’s report from the finding Summary
I.
Quality: Printer-specific settings. You can select
high-resolution or low resolution quality. You can send the findings to the printer in
vector graphic or raster graphic modes. The colouring method can be set as black and
white or coloured. Furthermore you can change the line smoothing and the contrast here
as well for the print findings.

ECG HOLTER SYSTEM ANALYSIS WITH THE CARDIOSPY SOFTWARE
LABTECH LTD. V5.03_2014_11 75
Editing and measuring options
5.1.22 Automatic and manual analysis
This function can be found in Settings menu / Refresh/analysis mode.
Apply changes immediately: The software runs the automatic analysis every time we
edit the record, this way we’ll see the results on the screen immediately. This function is
only recommended for modern and fast computers.
Use refresh button: The software does not run the automatic analysis each time the
record is edited, the analysis only runs when the user presses the refresh
button or change the screen. It is recommended for computers with slow CPU
or insufficient RAM. Refresh button can be found in the middle of the screen,
next to the horizontal slide.

EDITING AND MEASURING OPTIONS ECG HOLTER SYSTEM
76 V5.03_2014_11 LABTECH LTD.
The results of the automatic analysis can be edited and checked by means of the
program’s editing and measuring options.
The program contains all the options with the help of which a record can be quickly and
precisely evaluated.
5.1.23 Sequence of tasks
The current status of the record also appears in the database
interface, which can be used as a filtering option.
The status of each record can be as follows:
Temporary: the recording has been read from the recorder, but
no automatic analysis has been performed yet.
Pre-evaluated: the recording has been automatically analyzed at
least once, and Evaluated by physician still has at least one un-
ticked box.
Evaluated: automatic analysis has been performed and all boxes
in Evaluated by physician are ticked.
Closed: a record can only be closed when status of record has
been evaluated.
5.1.24 Template window
Using the Highlight function
If this function is on, QRS complex displayed in the ECG window will be marked by a
continuous line in the Demix window.
The function is off The function is on

ECG HOLTER SYSTEM ANALYSIS WITH THE CARDIOSPY SOFTWARE
LABTECH LTD. V5.03_2014_11 77
Manual demix
The purpose of this function is to clear the cluster of the inappropriate QRS complexes
and artefacts.
This function enables us to select one or more QRS complexes in order for them to be
moved to a new cluster.
Select cluster (it is going to be a parent cluster)
Mark a rectangle in Demix window in any channel by pressing left mouse button.
All QRS complexes can be moved to a new cluster (it is going to be a child cluster),
which has at least one point within the rectangle.
The program automatically modifies and creates the QRS image characteristic of the
given cluster.
The created child cluster is marked in red.
The marking remains on the parent cluster until a new cluster is marked.

EDITING AND MEASURING OPTIONS ECG HOLTER SYSTEM
78 V5.03_2014_11 LABTECH LTD.
Auto demix
In the Auto Demix function we can “clean” the marked clusters of each channel. If a
new cluster is created, the focus moves to the new cluster. The original cluster is
marked with a red frame.
Edition of Cluster’s type
The type of a cluster can be changed by right-clicking the template. The chosen type
will automatically appear next to each heartbeat of a cluster.
Contraction of Clusters
All the similar cluster types can be contracted manually or by the drag-and-drop method
familiar from Windows. This means that with the left mouse button we mark the cluster
and while holding this button just move the marked cluster to the one with which we

ECG HOLTER SYSTEM ANALYSIS WITH THE CARDIOSPY SOFTWARE
LABTECH LTD. V5.03_2014_11 79
wish to contract it, then release the button. The program allows contracting only similar
types of clusters, e.g. N can be contacted with N, V with V etc.
Before completing the contraction, it is advisable to display only one particular type of
group in the “Filter templates by” drop-down menu.
Cluster group operations
We can select all the clusters for group operations by holding the right mouse button,
then choosing Select all.
We can select the specified multiple clusters for group operations by pressing and
holding the Shift button while clicking the left mouse button at one point and pulling the
cursor the desired clusters.
The selected clusters can be contracted, or their types can be modified together.
The function of the Fix button
By clicking on the Fix button, a certain type of QRS can be fixed in the marked cluster.
Marking a new cluster invalidates all the previously set cluster types.
It is advisable to use this button, if we would like to modify the type of a complex
cluster, with the exception of some QRS complexes.
Determination of QRS clusters
After selecting the desired QRS by right-clicking in the ECG window and clicking on
the ’Forms’ tab, the focus will go to the cluster in which there is the appropriate QRS.

EDITING AND MEASURING OPTIONS ECG HOLTER SYSTEM
80 V5.03_2014_11 LABTECH LTD.
5.1.25 ECG window
Modification of unique QRS types
Right-click the relevant QRS and choose the appropriate QRS type from the list offered
by the program.
Modification of group QRS types
Moving the mouse by holding the left mouse button mark all those QRS, which are
found next to each other and the type of which you would like to modify.
Then by pressing right mouse button on any of the QRS you can modify the type of all
the marked QRS. The marking can be terminated if we click using right mouse button
on any of non-marked QRS or if navigate to another time.

ECG HOLTER SYSTEM ANALYSIS WITH THE CARDIOSPY SOFTWARE
LABTECH LTD. V5.03_2014_11 81
Using the ECG ruler - measurement
We can measure time and amplitude by holding the left mouse button while moving the
cursor, this way you select a certain section of the ECG curve. Time: Represents the
elapsed time of the record. Selected intervall: Represents the intervall since the mouse
was pressed in the blue box provided in ms. Indicated RR intervall: Here we can see
the number of beats, the length of the section between the first and last QRS and the
average HR measured in the intervall from the selected section. Amplitude is measured
by calculating the difference of the two points where the first and second ruler intersects
the ECG curve.
Insertion of QRS
Move the cursor to the point at which you intend to insert the selected QRS. While
holding the left mouse button press the “I” or the “Insert” key. Choose the appropriate
QRS type from the list offered by the program.
Removal of QRS
Choose the relevant QRS by the right mouse button, then choose Removal of the QRS
from the list offered by the program.
Remove the QRS or mark the QRS as noise
As a result of QRS removal, the relevant QRS disappears from the QRS list, while it
remains when marked as noise. We should remove QRS, if there is an artefact between
the two QRS complexes of a real pause, which hinders pause detection. When the
artefact has been removed, the pause becomes detectable. If several artefacts follow
each other, it is advisable to rename them as noise, because their removal can create a
pause.
5.1.26 Event window
The events can be displayed in one of two menu points: one is Main/Events, the other is
the ECG window next to Main menu point. In this window we can delete the individual
events or event groups.

EDITING AND MEASURING OPTIONS ECG HOLTER SYSTEM
82 V5.03_2014_11 LABTECH LTD.
Delete an individual event
In the selected event type, we can delete the currently displayed event by pressing the
button. When the event has been deleted, all the QRS complexes belonging to this
event type will automatically be renamed as noise.
Delete a group of events
In the selected event type, we can delete all events by pressing the button. When the
event has been deleted, all the QRS complexes belonging to the pertinent event will
automatically be renamed as noise.
Using the Fix button
Using the Fix button is used when deleting a group of events. By pressing the Fix
button, you can fix the selected events, that is, by pressing the button we delete all
events which have not been fixed.
After fixing the events, depending on their occurrence/number we can choose to delete
the fixed or the unfixed events. So in the events list we can fix events with the help of
the Fix button (X).
Keeping the obtained group, the other events get deleted from the event group.
The group obtained this way will be deleted from the event list and the other
unfixed events will remain.
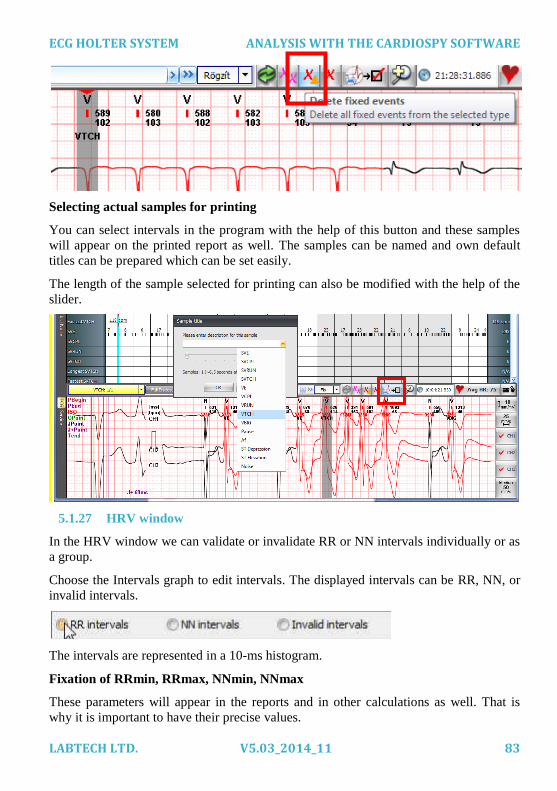
ECG HOLTER SYSTEM ANALYSIS WITH THE CARDIOSPY SOFTWARE
LABTECH LTD. V5.03_2014_11 83
Selecting actual samples for printing
You can select intervals in the program with the help of this button and these samples
will appear on the printed report as well. The samples can be named and own default
titles can be prepared which can be set easily.
The length of the sample selected for printing can also be modified with the help of the
slider.
5.1.27 HRV window
In the HRV window we can validate or invalidate RR or NN intervals individually or as
a group.
Choose the Intervals graph to edit intervals. The displayed intervals can be RR, NN, or
invalid intervals.
The intervals are represented in a 10-ms histogram.
Fixation of RRmin, RRmax, NNmin, NNmax
These parameters will appear in the reports and in other calculations as well. That is
why it is important to have their precise values.

EDITING AND MEASURING OPTIONS ECG HOLTER SYSTEM
84 V5.03_2014_11 LABTECH LTD.
The HRV window enables a fast editing of these values. To edit the MinRR, choose
“RR intervals”. With the left mouse button move the cursor above the ruler in the graph
of HRV intervals, then move the ruler to the left side of the graph. Then moving right
by pressing the button or with the help of the ruler, choose the interval which can
be accepted as RRmin. When pressing the button, the interval becomes a valid
RRmin interval. The intervals shorter than this one will automatically be invalidated by
the program.
The same procedure must be followed for editing the RRmax, NNmin, NNmax.
Invalidation of individual intervals
The currently displayed interval can be invalidated by clicking on the button.
Invalidation means that intervals of the given types are ignored by all algorithms during
the evaluation. The QRS complexes belonging to the given interval retain their original
type.
Invalidation of groups of intervals
By continuously pressing the ’Shift’ button you can select a wider interval if you left-
click.

ECG HOLTER SYSTEM ANALYSIS WITH THE CARDIOSPY SOFTWARE
LABTECH LTD. V5.03_2014_11 85
Use of Fix button
The Fix button’s use has a role in
collective cancellations. It can fix the Min
and Max intervals. Search for the
appropriate place and click on the Fix
Min or Max button.
Recovery of invalid intervals
The invalid intervals can be displayed by selecting ’Invalid intervals’. There are
opportunities to validate individually or collectively as well by pressing the and
Shift+ left mouse button we can restore more units.

EDITING AND MEASURING OPTIONS ECG HOLTER SYSTEM
86 V5.03_2014_11 LABTECH LTD.
5.1.28 ST, QT, QTc graph
Invalidate selected interval
We can select an interval in the QT, QTc and AT graphs by pressing and holding the
Shift button while clicking the left mouse button at one point of the ECG curve and
dragging the cursor to the desired point. When the selection has been made, these
intervals can be invalidated. This action has no effect on intervals which have already
been invalidated.
Result of the invalidation:
Restoring invalidated intervals
We can select an interval in the QT, QTc and AT graphs by pressing and holding the
Shift button while clicking the left mouse button at one point of the ECG curve and
dragging the cursor to the desired point. When the selection has been made, these
invalidated intervals can be restored. This action has no effect on valid intervals.
Deleting Min, Max values
We can select the desired parameter in the Event menu point, then click on the
button in case the selected value is not acceptable. Deleting can be repeated until an
acceptable result is received.

ECG HOLTER SYSTEM ANALYSIS WITH THE CARDIOSPY SOFTWARE
LABTECH LTD. V5.03_2014_11 87
5.1.29 AF graph
Deleting AF sections
There are multiple options to delete AF sections.
One option is to delete by using the and the buttons. Clicking on the button
deletes the AF section on which the ruler is placed at the moment, while clicking on the
button deletes all AF sections.
Another option is to select a desired interval by pressing and holding the Shift button
while clicking the left mouse button at one point of the ECG curve and dragging the
cursor to the desired point. When the selection has been made, the software prompts us
to answer a question concerning what to do with the selected section next. In case we
decide to mark the selected section not as fibrillation, all the corresponding AF sections
will be deleted. The automatic analysis stops indicating AF on manually deleted AF
sections, but we can rename any section as AF manually.
Rename section as AF
Select a desired interval by pressing and holding the Shift button while clicking the left
mouse button at one point of the ECG curve and dragging the cursor to the desired
point. When the selection has been made, the software prompts us to answer a question
concerning what to do with the selected section next. All manually selected AF sections
can be deleted.

EDITING AND MEASURING OPTIONS ECG HOLTER SYSTEM
88 V5.03_2014_11 LABTECH LTD.
5.1.30 Deleting T alternans sections
There are multiple options to delete T alternans sections.
One option is to delete by using the and the buttons. Clicking on the button
deletes the T alternans section on which the ruler is placed at the moment, while
clicking on the button deletes all T alternans sections.
Another option is to select a desired interval by pressing and holding the Shift button
while clicking the left mouse button at one point of the ECG curve and dragging the
cursor to the desired point. When the selection has been made, the software prompts us
to answer a question concerning what to do with the selected section next. In case we
decide to mark the selected section not as T alternans section, all the corresponding T
alternans sections will be deleted. On the manually deleted T alternans sections the
automata analyses does not show more T alternans, but manually the T alternans may be
marked to any place.
Insert the T alternans sections
Select a desired interval by pressing and holding the Shift button while clicking the left
mouse button at one point of the ECG curve and dragging the cursor to the desired
point. When the selection has been made, the software prompts us to answer a question
concerning what to do with the selected section next. If we choose this section, as T
alternans section, the T alternans mark will appear on it. Manually marked T alternans
section may be deleted according to ones demand.

ECG HOLTER SYSTEM ANALYSIS WITH THE CARDIOSPY SOFTWARE
LABTECH LTD. V5.03_2014_11 89
5.1.31 Noise window
Invalidate selected interval
We can select an interval by pressing and holding the Shift button while clicking the left
mouse button at one point of the ECG curve and dragging the cursor to the desired
point. When the selection has been made, the software prompts us to answer a question
concerning what to do with the selected section next. In case we decide to mark the
selected section as noise the software marks all pertaining QRS complexes as noise,
which means they will be excluded from further analysis.
Result:

CALCULATION AND EVALUATION METHODS - EKG ECG HOLTER SYSTEM
90 V5.03_2014_11 LABTECH LTD.
Restoring invalidated intervals
We can select an interval by pressing and holding the Shift button while clicking the left
mouse button at one point of the ECG curve and dragging the cursor to the desired
point. When the selection has been made, the software prompts us to answer a question
concerning what to do with the selected section next. In case we decide to mark the
selected section as not noise the software restores all pertaining QRS complexes, which
means that they will be included in further analysis.
Calculation and Evaluation methods - EKG
Heart rate (HR graph, Avg HR min, Avg HR max, ECG widow)
𝐴𝑣𝑔 𝐻𝑅 =1000 ∗ 60
∑ 𝑅𝑅𝑖10𝑠
AvgHR is computed from RR intervals in every 10s interval.
𝐴𝑐𝑡 𝐻𝑅 =1000 ∗ 60
∑ 𝑅𝑅𝑖𝑤𝑖𝑛𝑑𝑜𝑤
ActHR is computed from the ECG stream on display.
Corrected QT (Bazett formula)
𝑄𝑇𝑐 =𝑄𝑇
√𝑅𝑅
ST level
ST = ECG[J+] - ECG[Izo]
Turbulence calculation
Determining valid VES beats
There are at least 3 sinus beats before the VES
There are at least 20 sinus beats after the VES
RR0 <= 0.8 * RR-1,
RR1 >= 1.2 * RR-1,

ECG HOLTER SYSTEM ANALYSIS WITH THE CARDIOSPY SOFTWARE
LABTECH LTD. V5.03_2014_11 91
The heart rate in the pertinent section falls into the HR range which can be set
in the Settings menu
Calculation of Reference RR: RRref = ∑ 𝑅𝑅𝑖
20𝑖=15
5
VES is omitted when any RR interval (except RR0 and RR1) is
< 300ms,
2000ms,
RRi-RRi-1 > 300ms,
RRi / RRref > 1.2 or RRi / RRref < 0.8
Averaging RR intervals
Average RR intervals are computed from RR intervals before and after the valid VES
beats in every hour.
Calculating Turbulence onset
𝑇𝑢𝑟𝑏𝑢𝑙𝑒𝑛𝑐𝑒 𝑜𝑛𝑠𝑒𝑡 = (𝑅𝑅1 + 𝑅𝑅2) − (𝑅𝑅−2 + 𝑅𝑅−1)
(𝑅𝑅−2 + 𝑅𝑅−1)
RR-2 RR-1 RR0 RR1 RR2
N N N V N N
Calculating Turbulence slope
The maximal positive slope of an average of 5 sinus beats occurring after RR1
(compensatory pause) applied to one beat.
Mathematical methods applied for calculating multiple parameters
Calculation criteria for VES and SVES events
VE – Ventricular Beat (V)
One ventricular beat.
VCPL – Ventricular Couplet
Two successive ventricular beats where the heart rate is bigger than or equal to the
ventricular tachycardia parameter set in the Settings / Parameters / ECG-Rhythm menu.
VRUN – Ventricular Run
Three successive ventricular beats where the heart rate is bigger than or equal to the
ventricular tachycardia parameter set in the Settings / Parameters / ECG-Rhythm menu.
VBIG – Ventricular Bigeminy

CALCULATION AND EVALUATION METHODS - EKG ECG HOLTER SYSTEM
92 V5.03_2014_11 LABTECH LTD.
A series of subsequently alternating ventricular and dominant beats.
VTCH – Ventricular Tachycardia
Four or more successive ventricular beats where the heart rate is bigger than or equal to
the ventricular tachycardia parameter set in the Settings / Parameters / ECG-Rhythm
menu.
RonT
The ventricular beat is closer to the preceding non-ventricular beat than the parameter
set in the Settings / Parameters / ECG-Rhythm menu.
SVE – Supraventricular beat (S)
Premature heartbeat which occurs earlier than the average RR interval calculated from
the five preceding dominant beats. (The limit can be set in Settings / Parameters / ECG-
Rhythm menu’s SVPB limit parameter. The bigger the value, the fewer SVE events we
get.)
SVCPL – Supraventricular Couplet
The heart rate calculated from the interval of two consecutive heartbeats is bigger than
or equal to the Paroxismal Tachycardia parameter set in the Settings / Parameters /
ECG-Rhythm menu and it has increased by the value of Paroxismal Tachycardia
Increase set in the Settings / Parameters / ECG-Rhythm menu .
SVRUN – Supraventricular Run
The heart rate calculated from the interval of three consecutive heartbeats is bigger than
or equal to the Paroxismal Tachycardia parameter set in the Settings / Parameters /
ECG-Rhythm menu and it has increased by the value of Paroxismal Tachycardia
Increase set in the Settings / Parameters / ECG-Rhythm menu .
SVTCH – Paroxismal Supraventricular Tachycardia
The heart rate calculated from the interval of four or more consecutive heartbeats is
bigger than or equal to the Paroxismal Tachycardia parameter set in the Settings /
Parameters / ECG-Rhythm menu and it has increased by the value of Paroxismal
Tachycardia Increase set in the Settings / Parameters / ECG-Rhythm menu .
PAUSE
The time between two heartbeats reaches or exceeds the Pause limit set in the Settings /
Parameters / ECG-Rhythm menu.

ECG HOLTER SYSTEM ANALYSIS WITH THE CARDIOSPY SOFTWARE
LABTECH LTD. V5.03_2014_11 93
Interpretation of HRV time domain parameters
(Reference: Circulation 1996, 93:1043-1065, 1996 American Heart Association Inc.)
NN interval
The interval between two consecutive normal beats. The dominant QRS complexes are
interpreted as Normal-N beats.
NN min
The shortest NN interval measured in the record.
NN max
The longest NN interval measured in the record.
NN avg
The sum of NN intervals divided by the number of normal beats.
N-Normal beats
The number of normal beats during in the record.
SDNN
The standard deviation of NN intervals in relation to the total recording time. The
individual NN intervals must be counted during measurement time. The NN
distribution function is obtained by representing these values, by calculating the
standard deviation of which the SDNN values measured in ms are obtained. As the
SDNN value greatly depends on measurement time, it is recommended to calculate it
for 24 hours every time. In addition, it is the only way to interpret properly the
comparison of the data with normal values represented in the reference, because these
values refer to 24-hour recordings. (Normal range for 24 hours is: 102 – 180 ms)
SDANN
Standard deviation of the averages of NN intervals in every 5-minute segment of the
entire recording. The NN intervals are averaged for every five minutes, and the
distribution function is obtained by representing the frequency of the averages. The
SDANN parameter is obtained by calculating the standard deviation. (Normal range for
24 hours: 92 - 162 msec)
RMSSD
The squares of the differences between consecutive NN intervals are added up, divided
by the number of the intervals, and taken the square root of.
This value is the RMSSD calculated for the total measurement time. (Normal range for
24 hours: 15 - 39 msec)

CALCULATION AND EVALUATION METHODS - EKG ECG HOLTER SYSTEM
94 V5.03_2014_11 LABTECH LTD.
SDNNi
The standard distribution of NN represented is calculated for every five minutes; the
values are added up and averaged for the total measurement time.
SDSD
Standard distribution of differences between consecutive NN intervals.
The distribution of the difference between consecutive NN intervals is represented, the
SDSD parameter is obtained by calculating the standard deviation, which is interpreted
for the total measurement time.
pNN50
The value of pNN50 parameter in percentage is obtained by counting the consecutive
NN interval couplets having a difference greater than 50 msec, dividing it with the total
count of NN intervals, and multiplying by 100.
HRVTi
Approaching the RR distribution linearly represented with a triangle that covers the
given distribution as fully as possible. The HRVTi parameter is obtained by calculating
the differences between the intersections of the given triangle and the time axis.
Interpretation of HRV frequency range parameters
(Reference: Circulation 1996, 93:1043-1065, 1996 American Heart Association Inc.)
Total power [ms2]:
Efficiency spectrum 0.03125 – 0.40625 Hz
LF [ms2]:
Efficiency spectrum in the low frequency range 0.03125 – 0.15625 Hz
HF [ms2]:
Efficiency spectrum in the high frequency range 0.15625 – 0.40625 Hz
Normalized values
𝐿𝐹𝑛[%] =100 ∗ 𝐿𝐹
𝐿𝐹 + 𝐻𝐹
𝐻𝐹𝑛[%] =100 ∗ 𝐻𝐹
𝐿𝐹 + 𝐻𝐹
The parameters are calculated according to the Wavelet Packets method.

ECG HOLTER SYSTEM ANALYSIS WITH THE CARDIOSPY SOFTWARE
LABTECH LTD. V5.03_2014_11 95
Mathematical methods applied for calculating parameters
Standard deviation
𝑆𝐷 = √∑ (𝑋𝑖 − 𝑀)2𝑁
𝑖=1
𝑁
Root Mean Square
𝑅𝑀𝑆 = √∑ (𝑋𝑖)2𝑁
𝑖=1
𝑁
Pacemaker report automatic detection
The program automatically detect s pacemaker record, it is detects the pacemaker pins
even if the type of the pacemaker was not set in the database. The user can accept this or
revise the report as not pacemaker record.
The program detects that if the record does not contain pacemaker data but the
pacemaker device has selected in patient data. In this case the program offering setting
modification
If the modification has been accepted, the settings of pacemaker device changes and a
new analyzing will be performed.

CALCULATION AND EVALUATION METHODS - BP ECG HOLTER SYSTEM
96 V5.03_2014_11 LABTECH LTD.
P-curve analyse
The Cardiospy is able to detect the P-curve ave hence new functions became available.
Calculation and Evaluation methods - BP
Pulse Pressure
〖PPi= Sys〗_i- 〖Dia〗_i
Medium Arterial Pressure
〖〖MAP〗_i=Dia〗_i+(〖Sys〗_i- 〖Dia〗_i)/3
Diurnal Index
Diurnal Index= (〖Data〗_(Awake,mean)-〖Data〗_(Asleep,mean))/〖Data〗_(Awake,mean)
where Data: Sys, Dia.
Hyperbaric Impact
Hyperbaic Impact=24* (∑_(i=1)^N▒〖〖(Data〗_i- 〖Norm〗_i)* 〖Time〗_i
〗)/(∑_(i=1)^N▒〖Time〗_i )
where Datai: Sysi, Diai
Normi the normal value related to the measurement (set in Settings)
Timei the represented time of the measurement

ECG HOLTER SYSTEM ANALYSIS WITH THE CARDIOSPY SOFTWARE
LABTECH LTD. V5.03_2014_11 97
〖Time〗_i= (〖(T〗_i-T_(i-1))+ 〖(T〗_(i+1)-T_i))/2
where Ti = the time of the measurement
Double Product
Double Product=Sys*HR
Dipper Status
Dipper[%]= 100*(1-〖Sys〗_(Asleep,mean))/〖Sys〗_(Awake,mean)
Meaning:
Dipper Dipper Status
< 0 Reverse Dipper
0-10% Non-Dipper
10-20% Dipper
>20% Extreme Dipper
Morning Surge
Morning Surge is medically defined as the difference in systolic blood pressure during
the first two hours after awakening and the lowest level recorded during the day. The
greater the difference the more likely is the risk of stroke.
(Article Source: http://EzineArticles.com/3086388)
AASI (Ambulatory Arterial Stiffness Index)
AASI=1-Slope
where Slope = Diastole – Systole graph (Scatter) steepness of the regressive line.

CALCULATION AND EVALUATION METHODS - BP ECG HOLTER SYSTEM
98 V5.03_2014_11 LABTECH LTD.
6 Troubleshooting and Maintenance
Error / Event What to do?
BATTERY ERROR Batteries are not properly charged in the
recording unit. Please use well-charged
batteries.
LEAD OFF ERROR
Please place the lead back properly.
COMMUNICATION ERROR Please check if the connection between the
recorder unit and computer is working
properly.
NOISE ARTIFACTS ON ECG
SIGNAL
Please check if all the electrodes are
securely attached to the patient. The
electrodes must be applied with sufficient
care and expertise in order to make good
quality recording.
SELECTED PAGE CAN NOT BE
PRINTED
Check if the printer selected is turned on. If
you have selected a local printer, check if it
is connected to the computer.
RECORDER DOES NOT RECORD
FOR 24 HOURS
Please make sure that you use well-charged
batteries. Recharge the batteries only with
the supplied battery charger according to the
enclosed instructions. Please use batteries
only of the same type and capacity.
Please connect the patient cable to the
Recorder.
Please Read the latest record.
Please connect the appropriate patient cable
to the recorder unit.
Please check if the batteries are charged
properly.

ECG HOLTER SYSTEM TROUBLESHOOTING AND MAINTENANCE
LABTECH LTD. V5.03_2014_11 99
Error / Event What to do?
Please connect the appropriate patient cable
to the recorder unit. The compatibility of
cables depends on the type of recorder being
used.
The recorder is connected to the USB port.
Recording has started successfully.
Recording has stopped.
Please read the latest record.
You cannot start new recording unless you
have read the latest record.
It is the start-up screen of the recorder,
indicating the recorder configuration type.
ECG sign, which appears on the recorder’s
display during the monitoring process.
The recorder starts.

CALCULATION AND EVALUATION METHODS - BP ECG HOLTER SYSTEM
100 V5.03_2014_11 LABTECH LTD.
Error / Event What to do?
A message which appears in the upper part
of LCD in case of informing.
A message which appears in the upper part
of LCD in case of warning.
You may see this screen when the recording
is in progress.
This error appears when the recorder is
connected to the PC with flat or no batteries.
Please disconnect the recorder from PC,
place well-charged batteries in the recorder.
After clicking on the Scan and fix line, the
program will automatically fixes this
problem and the message will not appear
any more.
In cases of reading failure, card error,
message of invalid record please put full-
charged battery into the device and wait till
the recorder fixes the card. then, repeat the
reading process.

ECG HOLTER SYSTEM TROUBLESHOOTING AND MAINTENANCE
LABTECH LTD. V5.03_2014_11 101
Further steps
If the above description does not solve the problem, please send an e-mail with the
following
PLEASE DESCRIBE THE FAULT:what has happened.
- SEND A BLACKBOX: Cardiospy Blackbox: after the installation you can find a
Generate black box shortcut under the Start Menu / Labtech / Cardiospy/ . Please send
the blackbox file to our e-mail address.
- SEND A REPORT ABOUT THE FAULT: Export the report from Cardiospy program
(Patient menu – Import Export – export record), and send us the record. If the record is
too big (more than 2-4mb) ask for our ftp details via our e-mail address
-SEND SCREENSHOT ABOUT THE FAULT: You can make it with Print Screen
button, then import it to Paint with CTRL+Vand save the file.
Maintenance and Calibration
If the ECG device is used according to the preset parameters as prescribed, there is no
need for calibration or maintenance.
The case of the recorder unit may be cleaned, if necessary.
The accuracy of controls is assured by using long lasting parts and techniques that are
able to preserve their accuracy during the life cycle of the product.
Calibration of the ABPM (blood pressure) has to be carried out from time to time as
prescribed by the relevant standards. To ensure calibration is performed according to the
relevant standards, please return the device to Labtech Ltd. where we will perform
calibration free of charge.
The accuracy of controls is assured by using long lasting parts and techniques that are
able to preserve their accuracy during the life cycle of the product.
Suggestions to preparing a measuring set and carrying out calibration:
Place well-charged batteries into the device.
Place the cuff on an artificial arm (for example on a plastic pipe with a
diameter of 6-12 cm).
Connect a manometer as a reference device to the recorder according to the
figure below. It is essential that the manometer should be calibrated and able to
take measurements within the range of 0-300 mmHg (used at blood pressure
measuring)

CALCULATION AND EVALUATION METHODS - BP ECG HOLTER SYSTEM
102 V5.03_2014_11 LABTECH LTD.
Select a patient in the Holter program (Database / Patients), then press New
Record button
Place the INFRA window of the recorder in front of the USB INFRA interface
unit then press BP START button
Wait until the device inflates the cuff
During deflation, please read and write down the pressure values shown by the
Holter program and the reference device. Since the ABPM deflates gradually
you can read the values of the same step from both displays.
By comparing the pressure values you can determine whether the accuracy of
the ABPM is satisfactory or not.
If non-accurate the calibration has to be done by the manufacturer.
ECG HOLTER SYSTEM TROUBLESHOOTING AND MAINTENANCE
LABTECH LTD. V5.03_2014_11 103
The device inflates the cuff normally to 160 mmHg. If you would like to calibrate at a
higher pressure, you have to knock the cuff continuously by hand during the inflation
process so as to cheat on the device as if the systolic value were high. This way the
device will inflate the cuff with higher pressure.
The case of the recorder unit may be cleaned or washed if necessary.
Cleaning of device and patient cable
Do not dip the device in liquid, for device-cleaning use moistened wipes with a
moderate acting (not agressive) disinfectant or cleaning agent. Liquid getting inside of
the device can cause electric failures! All cleaning agents are suitable for cleaning
which are also suitable for cleaing human skin. Length of patient cable: 65-85 cm.

CALCULATION AND EVALUATION METHODS - BP ECG HOLTER SYSTEM
104 V5.03_2014_11 LABTECH LTD.
Directive and manufacturer declaration on electromagnetic disturbance emission
EC-1H, EC-2H, EC-3H, EC-12H devices were produced to be used under the enlisted
electro-magnetic. The buyer or user of EC-1H, EC-2H, EC-3H, EC-12H devices
should assure that it should operate under such condition
Disturbance emission test Conformity Electromagnetic environment
directive
RF emissions
CISPR 11
2. group EC-1H, EC-2H, EC-3H,
EC-12H devices intentionally
emit electromagnetic energy
during operation. It can disturb
the electronic
RF emission
CISPR 11
B class EC-1H, EC-2H, EC-3H,
EC-12H is suitable to be used
in all kind of environment,
including houses and facilities
supplying housings, directly
related to public low voltage.
harmonic emission
IEC 61000-3-2
Not applicable
Voltage changes/flicker
emission
IEC 61000-3-3
Not applicable

ECG HOLTER SYSTEM TROUBLESHOOTING AND MAINTENANCE
LABTECH LTD. V5.03_2014_11 105
Directive and manufacturer declaration on electromagnetic disturbance emission
EC-1H, EC-2H, EC-3H, EC-12H devices were produced to be used under the enlisted
electro-magnetic. The buyer or user of EC-1H, EC-2H, EC-3H, EC-12H devices
should assure that it should operate under such condition
Disturbance
emission test
IEC 60601
test level
Conformity
level
Electromagnetic
environment directive
Electrostatic
discharge (ESD)
IEC 61000-4-2
± 6 kV contact
± 8 kV
breakdown
± 6 kV contact
± 8 kV
breakdown
The floor must be wooden,
concrete or ceramic. If the
floor is covered with
synthetic material, the
relative humidity must be
minimum
Network
frequency (50/60
Hz) magnetic field
IEC 61000-4-8
3 A/m 3 A/m The network frequency
magnetic field level should
be equal with the
commercial or hospital
level

CALCULATION AND EVALUATION METHODS - BP ECG HOLTER SYSTEM
106 V5.03_2014_11 LABTECH LTD.
Directive and manufacturer declaration on electromagnetic disturbance emission
EC-1H, EC-2H, EC-3H, EC-12H devices were produced to be used under the enlisted
electro-magnetic. The buyer or user of EC-1H, EC-2H, EC-3H, EC-12H devices
should assure that it should operate under such condition
Disturb
ance
emissio
n test
IEC 60601
test level
Confor
mity
level
Electromagnetic environment directive
Transmi
tted RF
IEC
61000-
4-3
3 V/m
80 MHz –
2,5 GHz
3 V/m Portable and mobile RF devices must not be
used in the defined in the protective distance
depending on the formula based on EC-1H,
EC-2H, EC-3H, EC-12H, their cabling and the
transmitter.
Recommended protective
d = 1,17 . P
0,5 80 MHz – 800 MHz,
d = 2,33 . P
0,5 800 MHz – 2,5 GHz,
P is the largest transmitting performance given
by the manufacturer in Watt (W), and is the
recommended protective distance in meter (m).
The field strength defined by site measurement
and emerging from installed RF should be lower
than the conformity level defined for the
frequency range. The below marking indicates
eventual disturbance.
1. NOTE: IN CASE OF 80 MHz AND 800 MHz the higher frequency range should be
applied

ECG HOLTER SYSTEM TROUBLESHOOTING AND MAINTENANCE
LABTECH LTD. V5.03_2014_11 107
2. NOT These directives cannot be applied in all cases. Electromagnetic expansion is
influenced by the absorption and reflexion caused by buildings, objects and people.
a Fixed, installed transmitters (cell/wireless) mobile phones and land mobile radio base
stations, amateur radios, AM and FM radio and TV broadcast field strength cannot be
forecasted exactly in a theoretical. In order to know the electromagnetic environment
of installed RF transmitters you need measurement on the spot. In case the measured
field strength of EC-1H, EC-2H, EC-3H, EC-12H exceeds the relevant RF conformity
you should control whether the system operates. In case disturbance can be
experienced, you should take measures, like turning the EC-1H, EC-2H, EC-3H, EC-
or installing it on another location.
b In the range above 80 MHz the field strength should be lower than V/m.

CALCULATION AND EVALUATION METHODS - BP ECG HOLTER SYSTEM
108 V5.03_2014_11 LABTECH LTD.
Recommended protective distances between portable and mobile RF
telecommunication devices and EC-1H, EC-2H, EC-3H, EC-12H
EC-1H, EC-2H, EC-3H, EC-12H were made to be used in such electromagnet
environment, in which the RF disturbances are under control The user or customer of
EC-1H, EC-2H, EC-3H, EC-12H can help to avoid electromagnetic disturbance by
defining the smallest protective distance between portable, mobile and RF transmitters
and EC-1H, EC-2H, EC-3H, EC-12H depending on the largest output
the largest output
performance of
the transmitter
W
Protective distance depending on transmitter
m
150 kHz – 80
MHz
d = 1,17 . P
0,5
80 MHz – 800
MHz
d = 1,17 . P
0,5
800 MHz – 2,5
GHz
d = 2,33 . P
0,5
0,01 0,12 0,12 0,23
0,1 0,37 0,37 0,74
1 1,17 1,17 2,33
10 3,70 3,70 7,37
100 11,70 11,70 23,30
In case of transmitters that are not included in the table with given output frequency the
recommended protective distance (m) “d” be defined by an equation where P is the
largest given output transmitter performance in Watt (W).
1. NOTE: In case of 80 MHz and 800 MHz the higher (upper) frequency range should
be applied
2. NOTE: These directives cannot be applied in all cases. Electromagnetic expansion
can be influenced by absorption and reflexion caused by buildings, objects and people.

ECG HOLTER SYSTEM TECHNICAL SPECIFICATIONS
LABTECH LTD. V5.03_2014_11 109
7 Technical Specifications
Specification table of holter recorders (EC-2H; EC-3H; EC-12H)
Type of Holter Recorders EC-1H EC-2H EC-3H EC-12H
Bipolar ECG Channels 1 1, 2 1, 2, 3 1, 2, 3
Other ECG Channels - - +PM,
NEHB
+PM
Classic 12
CH,
NEHB,
Frank
Number of snap type Leads 3 3,5 3, 4, 5, 7 3, 4, 5, 7, 10
Recording Period (hours) 24,48, 72 h
1 week
24, 48, 72
h
24, 48, 72 h 24, 48 h
The accumulator can be
changed during recording
Yes
Dynamic Bandwidth (min) ±20 mV
DC Offset Range (min) ±800 mV
Frequency Response (max) 0.05 Hz … 150Hz
Sampling Rate 256 Hz … 2048 Hz
Recording Rate 128 Hz … 1024 Hz
Common Mode Rejection
Ratio (min)
120dB
A/D Resolution 16 bit
Input impedance (min) 100 M
Power Source 1x1.2 V AAA NiMH accumulator
(or 1x1.5 V AAA alkaline battery)
Battery Life (min) 24 hours
Storage Card Capacity 2GB (uSD)

SPECIFICATION TABLE OF HOLTER RECORDERS (EC-3H/ABP) ECG HOLTER SYSTEM
110 V5.03_2014_11 LABTECH LTD.
Type of Holter Recorders EC-1H EC-2H EC-3H EC-12H
Internal Voltage (max) 3.3 V
Display LCD (Grey Scale 160x100 pixels) or LED
Movement detection-3D Yes
Monitoring ECG On PC via Bluetooth and if available, on LCD as well
Reading Record via USB 2.0
International Protection
Rating Against Water: IPX4
Yes
Size 53 mm * 67.5 mm * 18.5 mm
Weight ~ 50 g
Specification table of holter recorders (EC-3H/ABP)
Technical specification I.
Bipolar ECG Channels 1, 2, 3
Other ECG Channels NEHB +PM
Number of snap type Leads 3, 4, 5, 7
Recording Period (hours) 24, 48, 72 h
The battery can be changed
during recording Yes
Dynamic Bandwidth (min) ±20 mV
DC Offset Range (min) ±800 mV
Frequency Response (max) 0.05 Hz … 150Hz
Sampling Rate 256 Hz … 2048 Hz
Recording Rate 128 Hz … 1024 Hz
Common Mode Rejection
Ratio (min) 120dB

ECG HOLTER SYSTEM TECHNICAL SPECIFICATIONS
LABTECH LTD. V5.03_2014_11 111
Technical specification I.
A/D Resolution 16 bit
Input impedance (min) 100 M
Power Source
2 x 1.2 V AA rechargeable batteries of minimum
2500 mAh capacity or 2 x 1.5V AA high quality
alkaline batteries
Battery Life (min) 24 hours
Storage Card Capacity 2GB (uSD)
Internal Voltage (max) 3.3 V
Movement detection-3D Yes
Monitoring ECG On PC via Bluetooth
Reading Record via USB 2.0 ( USB A – HDMI )
International Protection
Rating Against Water: IPX4 Yes
Size Approx. 125 x 70 x 33 mm
Weight Approx. 250 g (incl. Batteries)
Technical specification II.
BP measurement
method:
Oscillometric with step deflation, Diastolic values correspond to
Phase 5 Korotkoff Sounds
BP measurement
range: 25 – 260 mmHg (max inflate 300 mmHg)
Pressure
Transducer
Accuracy:
± 3 mmHg
Pulse Rate
Range: 30 – 220 BPM (Beats Per Minute)

SPECIFICATION TABLE OF HOLTER RECORDERS (EC-3H/ABP) ECG HOLTER SYSTEM
112 V5.03_2014_11 LABTECH LTD.
Pulse Rate
Accuracy: ± 2% or ±3 BPM, whichever is greater
Calibration: The device should be verified on a yearly interval.
Safety Systems:
Max. inflation pressure is limited to 300 mmHg;
Auto safety release valve for power failure.
Maximum cuff inflation time is limited to 75 seconds.
Duration of blood pressure reading is limited to 130 seconds.
Clinical
Accuracy:
Meets accuracy requirements of ANSI/AAMI
SP10:2002(R)2008, EN1060-4:2004 and ISO
81060-2:2009.

ECG HOLTER SYSTEM TECHNICAL SPECIFICATIONS
LABTECH LTD. V5.03_2014_11 113
Recording time T
yp
e o
f E
CG
ca
ble
Sample rate frequency
128Hz 256Hz 512Hz 1024Hz M
ax
imu
m
len
gth
of
reco
rdin
g
Req
uir
ed
ba
tter
ies
Ma
xim
um
len
gth
of
reco
rdin
g
Req
uir
ed
ba
tter
ies
Ma
xim
um
len
gth
of
reco
rdin
g
Req
uir
ed
ba
tter
ies
Ma
xim
um
len
gth
of
reco
rdin
g
Req
uir
ed
ba
tter
ies
1CH 168 h 4 pc 24 h 1 pc 24 h 2 pc 8 h 1 pc
2CH 72 h 2 pc 24 h 1 pc 24 h 2 pc 8 h 1 pc
NEHB 72 h 2 pc 24 h 1 pc 24 h 2 pc 8 h 1 pc
3CH 72 h 2 pc 24 h 1 pc 24 h 2 pc 8 h 1 pc
12CH 48 h 2 pc 24 h 2 pc 24 h 2 pc 8 h 1 pc
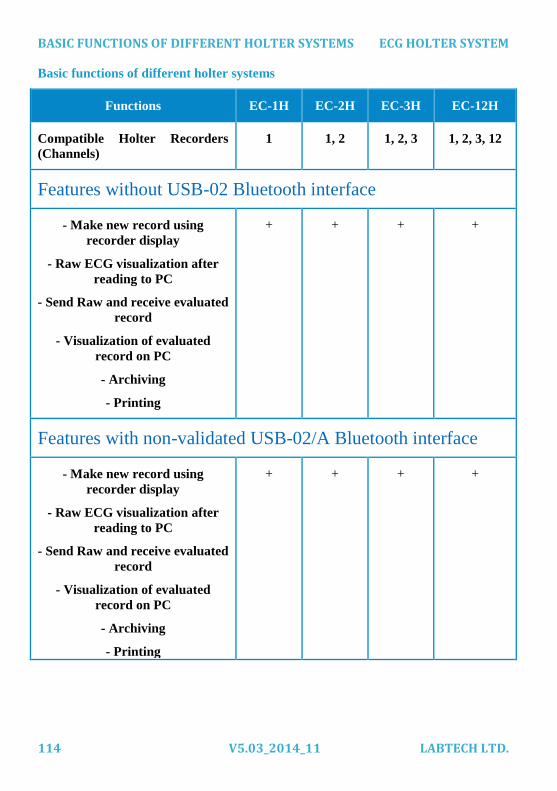
BASIC FUNCTIONS OF DIFFERENT HOLTER SYSTEMS ECG HOLTER SYSTEM
114 V5.03_2014_11 LABTECH LTD.
Basic functions of different holter systems
Functions EC-1H EC-2H EC-3H EC-12H
Compatible Holter Recorders
(Channels)
1 1, 2 1, 2, 3 1, 2, 3, 12
Features without USB-02 Bluetooth interface
- Make new record using
recorder display
- Raw ECG visualization after
reading to PC
- Send Raw and receive evaluated
record
- Visualization of evaluated
record on PC
- Archiving
- Printing
+ + + +
Features with non-validated USB-02/A Bluetooth interface
- Make new record using
recorder display
- Raw ECG visualization after
reading to PC
- Send Raw and receive evaluated
record
- Visualization of evaluated
record on PC
- Archiving
- Printing
+ + + +

ECG HOLTER SYSTEM TECHNICAL SPECIFICATIONS
LABTECH LTD. V5.03_2014_11 115
Features with validated USB-02/B Bluetooth interface
- Make new record and read
record to PC
- ECG Filtering
- QRS Detection
- HR and ST Graphs
- Arrhythmia Analysis (N,S,V)
- Full ECG Visualization
- Event Viewer
- Colour-coded event marking
- Detailed ECG Visualization
- Adjustable parameters for
analysis
- Report Edition
- Archiving
- Printing
- Database
- Interfaces – GDT, DICOM, HL-
7
- Editing Options:
measuring possibility on the
ECG
insert and delete QRS
rename QRS
mark noisy intervals
delete single/group events
+ + + +
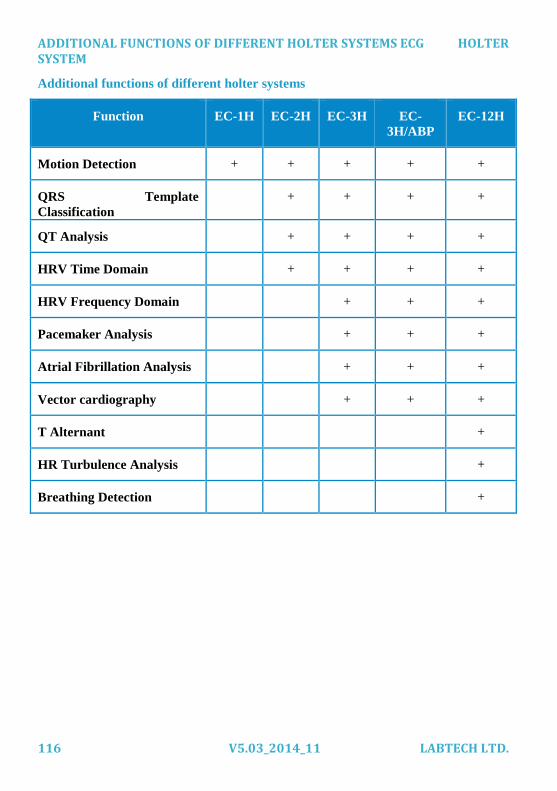
ADDITIONAL FUNCTIONS OF DIFFERENT HOLTER SYSTEMS ECG HOLTER SYSTEM
116 V5.03_2014_11 LABTECH LTD.
Additional functions of different holter systems
Function EC-1H EC-2H EC-3H EC-
3H/ABP
EC-12H
Motion Detection + + + + +
QRS Template
Classification
+ + + +
QT Analysis + + + +
HRV Time Domain + + + +
HRV Frequency Domain + + +
Pacemaker Analysis + + +
Atrial Fibrillation Analysis + + +
Vector cardiography + + +
T Alternant +
HR Turbulence Analysis +
Breathing Detection +

ECG HOLTER SYSTEM PATIENT DIARY
LABTECH LTD. V5.03_2014_11 117
8 Patient Diary
Institution (name, address):
Consultant:
Patient’s Name:
Date of Birth: Day: Month: Year:
Please keep the following rules during holter monitoring:
- Do not take off the device during the recording.
- Avoid any work causing intensive perspiration.
- Keep away the electrodes and the recording unit from water and intensive heat.
- Do not take the device in explosive surrounding.
- Do not use the device in strong electric field.
- In case of dizziness or any other complaint, push the event button and make a note in
the diary.
- Please diarize the events as detailed as possible! Please write into the appropriate row
the number of activity at that time and if you had complaints, then write that number,
too. If the activity or complaint is not listed under the table, then please write it into the
table in legible form.
- The time of taking drugs, the name and quantity should be written in the following
table as well.
HOW TO FILL IN THE DIARY: In case you feel any complaint, please put a number
from the Activity and from the Complaint column in the table below. The chosen
numbers should reflect your current activity and complaint. Put them in the line which
shows the current time. The time should be obtained from the digital clock on the
monitor and not the patient’s watch or any other clock.

ADDITIONAL FUNCTIONS OF DIFFERENT HOLTER SYSTEMS ECG HOLTER SYSTEM
Page: 118 / 118 2011-v5.01
CHOOSE
Activities
and
Complaints
Activity Complaint
1. Work at workplace 1. Breathlessness
2. Housework 2. Quick heartbeats (Tachycardia)
3. Walking 3. Irregular heartbeats
4. Sleeping 4. Dizziness
5. Travelling 5. Nausea
6. Rest 6. Chest pain
7. Other (please, name it) 7. Other (please, name it)
Time Daily Activity Complaints
800
-900
900
-1000
1000
-1100
1100
-1200
1200
-1300
1300
-1400
1400
-1500
1500
-1600
1600
-1700
1700
-1800
1800
-1900
1900
-2000
2000
-2100
2100
-2200
2200
-2300
2300
-000
000
-100
100
-200
200
-300
300
-400
400
-500
500
-600
600
-700
700
-800