5g action plan review for europe: final report
TRANSCRIPT

698248493-260
5G action plan review for Europe: final report24 September 2020
analysysmason.com

698248493-260
Contents Executive summary
Aims and scope of the study
Methodology
Results

698248493-260
Contents Executive summary
Aims and scope of the study
Methodology
Results
698248493-260
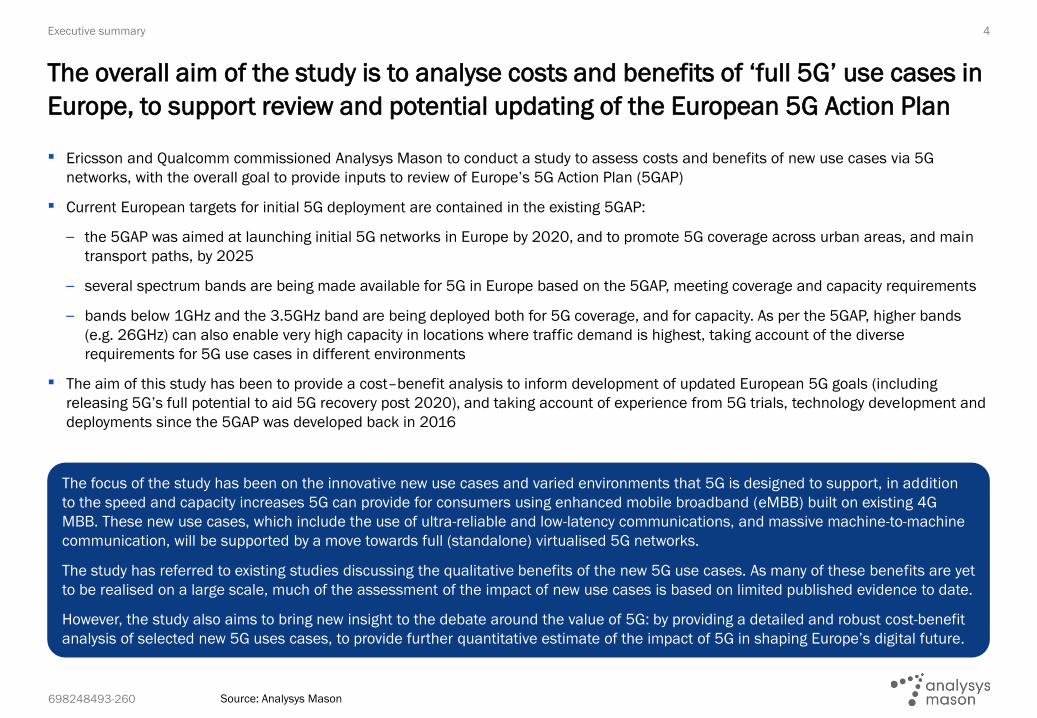
▪ Ericsson and Qualcomm commissioned Analysys Mason to conduct a study to assess costs and benefits of new use cases via 5G
networks, with the overall goal to provide inputs to review of Europe’s 5G Action Plan (5GAP)
▪ Current European targets for initial 5G deployment are contained in the existing 5GAP:
– the 5GAP was aimed at launching initial 5G networks in Europe by 2020, and to promote 5G coverage across urban areas, and main
transport paths, by 2025
– several spectrum bands are being made available for 5G in Europe based on the 5GAP, meeting coverage and capacity requirements
– bands below 1GHz and the 3.5GHz band are being deployed both for 5G coverage, and for capacity. As per the 5GAP, higher bands
(e.g. 26GHz) can also enable very high capacity in locations where traffic demand is highest, taking account of the diverse
requirements for 5G use cases in different environments
▪ The aim of this study has been to provide a cost–benefit analysis to inform development of updated European 5G goals (including
releasing 5G’s full potential to aid 5G recovery post 2020), and taking account of experience from 5G trials, technology development and
deployments since the 5GAP was developed back in 2016
4
The overall aim of the study is to analyse costs and benefits of ‘full 5G’ use cases in
Europe, to support review and potential updating of the European 5G Action Plan
Executive summary
Source: Analysys Mason
The focus of the study has been on the innovative new use cases and varied environments that 5G is designed to support, in addition
to the speed and capacity increases 5G can provide for consumers using enhanced mobile broadband (eMBB) built on existing 4G
MBB. These new use cases, which include the use of ultra-reliable and low-latency communications, and massive machine-to-machine
communication, will be supported by a move towards full (standalone) virtualised 5G networks.
The study has referred to existing studies discussing the qualitative benefits of the new 5G use cases. As many of these benefits are yet
to be realised on a large scale, much of the assessment of the impact of new use cases is based on limited published evidence to date.
However, the study also aims to bring new insight to the debate around the value of 5G: by providing a detailed and robust cost-benefit
analysis of selected new 5G uses cases, to provide further quantitative estimate of the impact of 5G in shaping Europe’s digital future.

698248493-260
5G coverage progress in Europe, Q2 2020, © GSMA Intelligence 2019/20
5
In European countries where 5G has been launched, Finland has the highest
population coverage (over 50%) whereas most countries are at 15–40%
Executive summary
Source: Analysys Mason, Eurostat, GSMA Intelligence
0%
10%
20%
30%
40%
50%
60%
70%
80%
90%
100%
Sw
ed
en
EU
27
Ro
ma
nia
Po
pu
lati
on
co
vera
ge
Cro
ati
a
Ge
rma
ny
Fin
lan
d
Slo
ven
ia
Au
str
ia
Ita
ly
Lu
xem
bo
urg
Ne
the
rla
nd
s
Cze
ch
ia
Ire
lan
d
Sp
ain
Be
lgiu
m
Hu
nga
ry
Po
lan
d
Fra
nce
La
tvia
Bu
lga
ria
Ma
lta
De
nm
ark
Po
rtu
ga
l
Esto
nia
Gre
ece
Cyp
rus
Lit
hu
an
ia
Slo
vak
ia
Cities 5G coverageTowns and suburbs Rural
In countries to the right of the dashed line, 5G commercial
networks had not been launched at the time of producing this
chart (although some launches are imminent e.g. in Denmark)
The chart above shows total 5G population coverage (pink line), overlaid on a classification of the population into three geotypes: urban, suburban, and rural.
The chart does not indicate the split of 5G coverage across these geotypes (e.g. there may be some 5G coverage of rural areas); for this estimate, we have
assumed network deployments generally roll out coverage in more densely populated areas first (i.e. in urban, then moving to suburban and then rural areas).
698248493-260
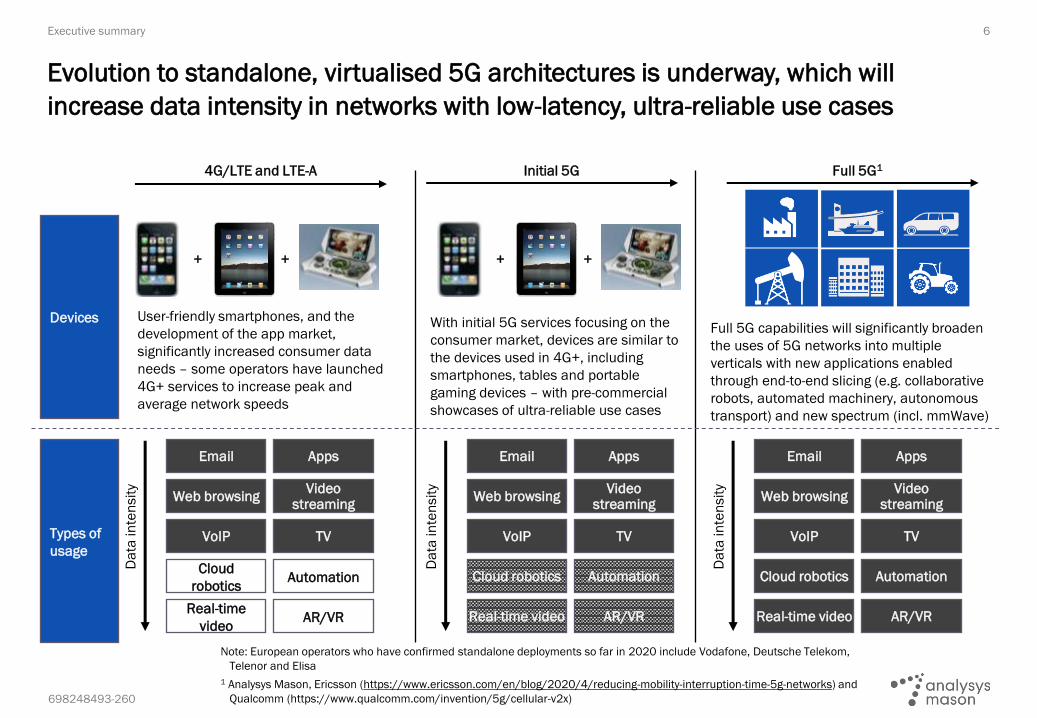
6
Evolution to standalone, virtualised 5G architectures is underway, which will
increase data intensity in networks with low-latency, ultra-reliable use cases
Executive summary
Note: European operators who have confirmed standalone deployments so far in 2020 include Vodafone, Deutsche Telekom,
Telenor and Elisa
1 Analysys Mason, Ericsson (https://www.ericsson.com/en/blog/2020/4/reducing-mobility-interruption-time-5g-networks) and
Qualcomm (https://www.qualcomm.com/invention/5g/cellular-v2x)
4G/LTE and LTE-A Initial 5G Full 5G1
With initial 5G services focusing on the
consumer market, devices are similar to
the devices used in 4G+, including
smartphones, tables and portable
gaming devices – with pre-commercial
showcases of ultra-reliable use cases
Full 5G capabilities will significantly broaden
the uses of 5G networks into multiple
verticals with new applications enabled
through end-to-end slicing (e.g. collaborative
robots, automated machinery, autonomous
transport) and new spectrum (incl. mmWave)
Devices
Types of
usage
+
Email Apps
Web browsingVideo
streaming
VoIP TV
Cloud
roboticsAutomation
Real-time
videoAR/VR
Da
ta in
ten
sit
y
Email Apps
Web browsingVideo
streaming
VoIP TV
Cloud robotics Automation
Real-time video AR/VR
Da
ta in
ten
sit
y
Email Apps
Web browsingVideo
streaming
VoIP TV
Cloud robotics Automation
Real-time video AR/VR
Da
ta in
ten
sit
y
User-friendly smartphones, and the
development of the app market,
significantly increased consumer data
needs – some operators have launched
4G+ services to increase peak and
average network speeds
++ +

698248493-260
7
To identify potential benefits from full 5G deployment in Europe, we have considered
published evidence including benefits indicated by several European trials
Executive summary
Source: Analysys Mason, Ericsson (https://www.ericsson.com/en/news/3/2020/ericsson-and-o2-partner-with-northumbrian-water-to-harness-the-power-of-5g and
https://www.ericsson.com/en/blog/2020/7/5g-port-of-the-future-jul-14-20202), Qualcomm (https://www.qualcomm.com/news/releases/2018/07/04/convex-
consortium-hosts-europes-first-live-c-v2x-direct-communication and https://www.qualcomm.com/products/smart-cities) and Vodafone
(https://www.vodafone.com/content/dam/vodcom/files/public-policy/gigabit-society-5g-04042017.pdf). See also 5G manufacturing trials conducted by Qualcomm
in partnership with Siemens (https://www.qualcomm.com/news/releases/2019/11/26/qualcomm-technologies-and-siemens-set-first-5g-private-standalone-
network) and Bosch (https://www.qualcomm.com/news/releases/2019/11/25/qualcomm-technologies-bosch-rexroth-showcase-time-synchronized-industrial)
▪ Qualcomm and Ericsson, together with Audi, have tested and demonstrated use cases of C-V2X, including vehicle-to-vehicle and vehicle-to-infrastructure direct communication operating in the 5.9GHz ITS spectrum and vehicle-to-network services leveraging 5G (e.g. network slicing and geo-casting)
▪ Trials have included communication across trans-European borders (France, Luxembourg and Germany)
▪ Ericsson’s 5G Port of the Future project pilots 5G virtual reality (VR), AR and AI to improve port operations and efficiency and lower environmental impact
▪ 5G technology has been used for real-time information exchange leading to reduction in movements during cargo handling, resulting in lower fuel consumption and associated CO2 emissions
▪ Qualcomm is deploying stand-alone 5G networks in industrial environments in Germany, using the 3.7–3.8GHz band, demonstrating 5G applications in industrial settings
▪ Ericsson, UK water utility provider Northumbria Water and UK mobile network operator (MNO) O2 are partnering in trials of 5G-augmented reality (AR) technology to remotely inspect assets and enable remote guidance of on-the-ground teams through relaying real-time data and instructions
▪ The trial also demonstrates use of 5G AR technology to provide 3G representation of buried assets, helping utility teams manage hazards and risks in real time
Improved maintenance, production
and logistics using industrial 5G
Productivity, eff iciency and safety
in the uti l i ty sector
Safer and eff icient driving via
network-based and direct C-V2X
▪ The data capacity, speed and low latency that 5G technology delivers will benefit smart city infrastructure in Europe, enabling better data analytics, more efficient public transport operation and new forms of mobile, on-demand services
▪ Together with edge processing solutions, infrastructure in urban environments can be made safer, more efficient and more innovative
Enhanced IoT in a smart city
environment
Benefits delivered by 5G trials Description of the objective of the trial

698248493-260
Overview of the 5G open innovation landscape considered in the study
8
5G can be viewed as a flexible ‘open innovation platform’ supporting cross-sector
use cases and environments, which we have grouped into ‘clusters’
Executive summary
Clu
ste
rU
se
ca
se
s
Smart
RuralSmart Public ServicesSmart Production and Logistics Smart Urban
5G ‘open innovation platform’
To
tal
Full 5G networks can support a
wide range of possible innovations
in different market and industrial
sectors, which collectively can be
considered as an overall ‘open
innovation platform’
It is useful to aggregate similar use
cases into ‘clusters’ to align with
different policy themes and
provide results which can be more
easily interpreted
The individual use cases form the
foundations of the cost–benefit
analysis, and provide structure for
the various input assumptions and
data sources.
Mu
nic
ipa
l b
uild
ings
He
alt
hca
re a
nd
ho
sp
ita
ls
To
uri
sm
Ed
uca
tio
n
En
erg
y a
nd
uti
liti
es
Fre
igh
t a
nd
lo
gis
tics
Air
po
rts
Po
rts
Min
ing
Sm
art
fa
cto
rie
s
Agri
cu
ltu
re
FW
A1
in r
ura
l/su
bu
rbs
Sm
art
au
tom
oti
ve
Sta
diu
ms
Urb
an
‘h
ot
sp
ots
’ in
clu
din
g
pu
blic t
ran
sp
ort
Co
nstr
ucti
on
The study considers the social, environmental and economic benefits of these use cases, with quantified estimates of economic benefits
1 Fixed-wireless access
Source: Analysys Mason
698248493-260
Use case Features of the use case Social benefits Environmental benefits Economic benefits
Smart
factories
Machinery monitoring for predictive maintenance and
remote-control,-reduced downtime
Real-time supply chain visibility
X-reality guided procedures and repairs
Ultra-high definition (UHD) surveillance
Increased
security/safety;
technologically
skilled workforce
Real-time monitoring of processes to reduce energy and materials consumption
Reduced equipment replacement
GDP contribution uplift due to
increased productivity
Mining Drone-based video inspections
Autonomous vehicles
Predictive maintenance; UHD surveillance
Increased security;
technologically
skilled workforce
Better air quality monitoring/
reduced risk of hazards
(monitoring within mines)
GDP contribution uplift due to
increased productivity
Ports Real-time inventory and asset tracking
UHD surveillance; reliable robotic control of
machinery; AR guided repairs
Increased security;
technologically
skilled workforce
Reduced carbon emissions
through greater logistic
efficiency
GDP contribution uplift due to
increased productivity
Airports Autonomous airside vehicles and collision avoidance
AR guided repairs and maintenance
Edge computing and AI for passenger ID and security
Augmented shopping experience
Increased security/safety; less time spent waiting in airports
Reduced congestion GDP contribution uplift due to
increased productivity
Freight
and
logistics
Non-line-of-sight accident sensing
Autonomous freight vehicles
Sensor data sharing for smart fleet management
Increased safety Efficient just-in-time supply
chains, reduces unnecessary
journeys and transportation of
goods
Improved work processes and
productivity (not modelled here)
Possibility of new business
models (not modelled here)
Energy and
utilities
Smart load balancing and detection of peaks/surges
Smart fault sensors
Management of sending energy back to the grid
Predictive maintenance of assets (e.g. wind turbines)
AR-guided maintenance/repairs
Encouraging good
energy behaviour
Better energy consumption
management by more closely
matching supply and demand
Lower GHG emissions (e.g. due
to remote monitoring)
Improved work processes (not
modelled here)
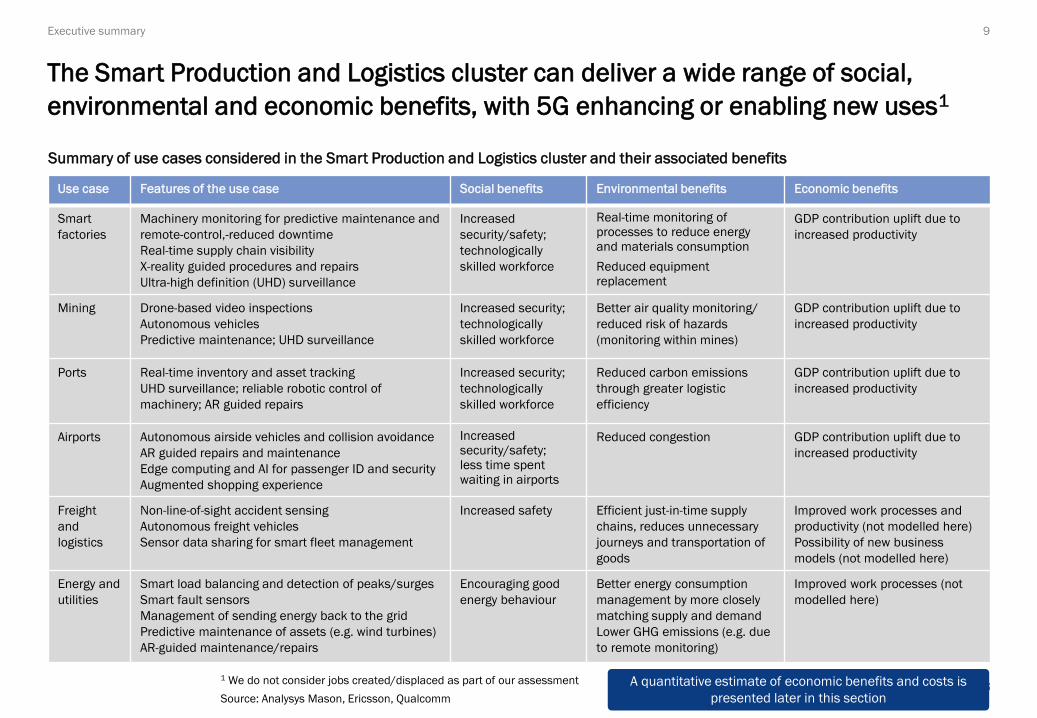
Summary of use cases considered in the Smart Production and Logistics cluster and their associated benefits
9
The Smart Production and Logistics cluster can deliver a wide range of social,
environmental and economic benefits, with 5G enhancing or enabling new uses1
Executive summary
A quantitative estimate of economic benefits and costs is
presented later in this section
1 We do not consider jobs created/displaced as part of our assessment
Source: Analysys Mason, Ericsson, Qualcomm
698248493-260
Use case Features of the use case Social benefits Environmental benefits Economic benefits
FWA in
suburban
and rural
areas
High-speed broadband connectivity for
consumers and business in areas not
reached by full-fibre networks
Could also support implementation of other
5G use cases, such as remote
monitoring/remote healthcare
Increased social inclusion; reduced
digital divide
Could slow or reverse decline in
populations living in rural areas/
contribute to maintaining rural
communities. Ability for local
businesses to access wider markets
for their products via e-commerce,
supporting rural sustainability
Ability to work from home/create a
better work–life balance
Alternative to fixed broadband (FBB)
and/or resilience (e.g. use of a
mobile device when FBB is not
available)
Reduced journeys (e.g. from
being able to work remotely)
GDP contribution uplift
due to increased
productivity for remote
workers1
Agriculture Massive sensor network for crops (pest
detection and moisture levels) and livestock
Untethered surveillance drones
Autonomous machinery
Rural sustainability (support for local
industries including fishing, tourism
and farming in remote areas)
Ability of rural producers to market
products beyond local area (e.g.
using e-commerce platforms)
Increased efficiency (e.g.
lower carbon farming)
Potential for reduced
waste/reducing unnecessary
use of products (e.g.
fertiliser)
Reduction in land
requirements for livestock
GDP contribution uplift
due to increased
productivity1
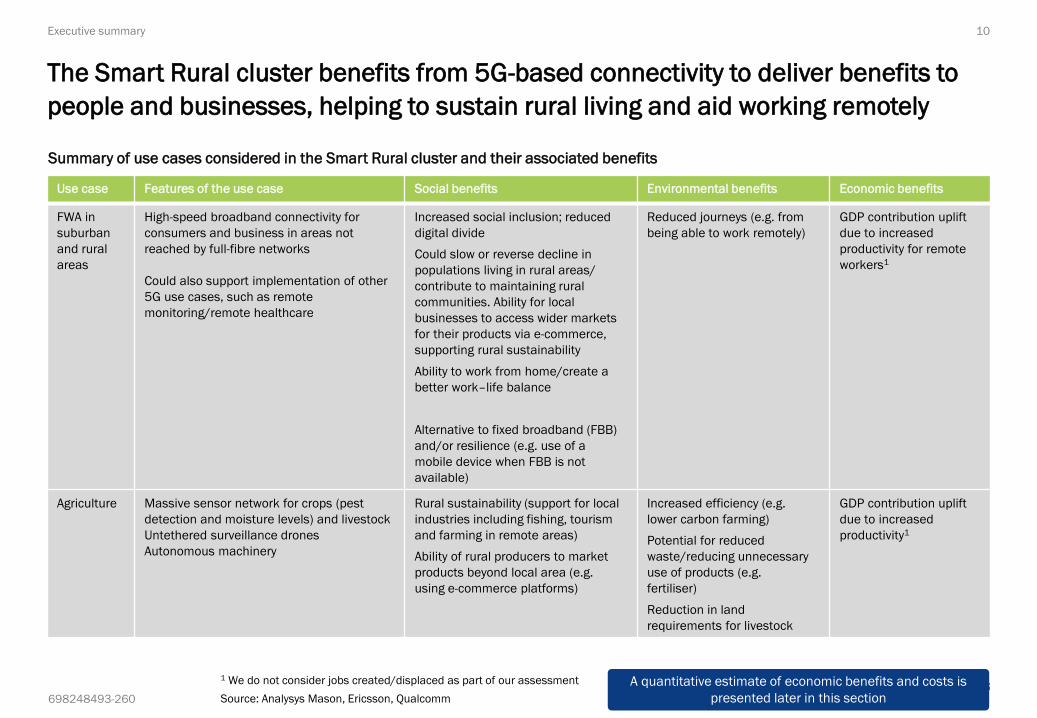
Summary of use cases considered in the Smart Rural cluster and their associated benefits
10
The Smart Rural cluster benefits from 5G-based connectivity to deliver benefits to
people and businesses, helping to sustain rural living and aid working remotely
Executive summary
A quantitative estimate of economic benefits and costs is
presented later in this section
1 We do not consider jobs created/displaced as part of our assessment
Source: Analysys Mason, Ericsson, Qualcomm
698248493-260
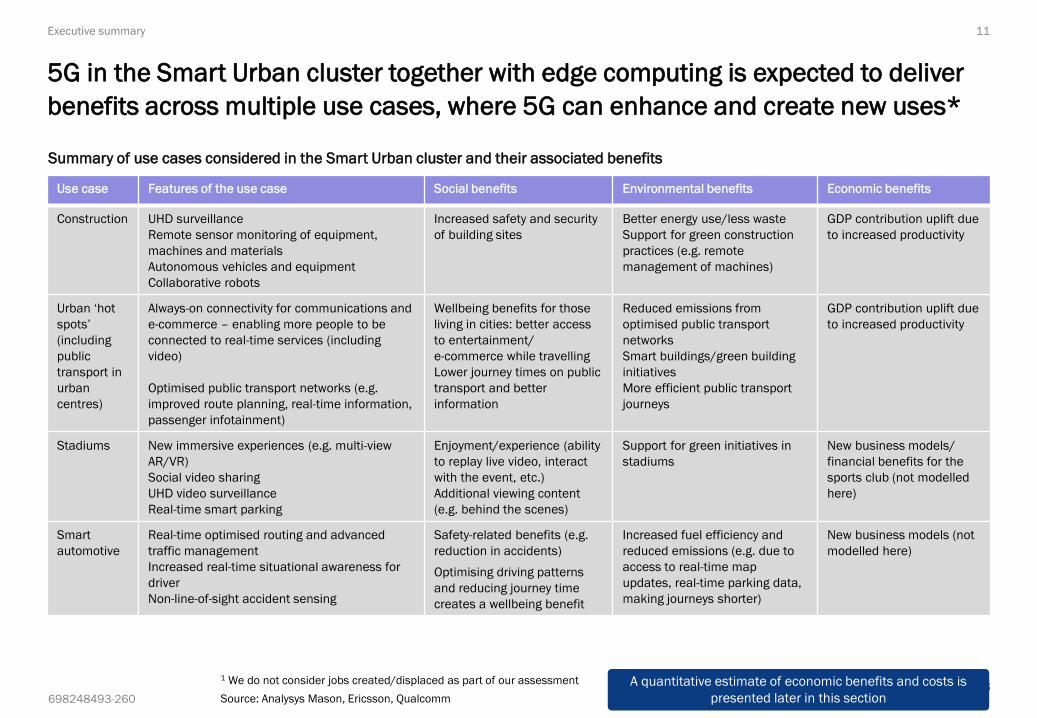
Use case Features of the use case Social benefits Environmental benefits Economic benefits
Construction UHD surveillance
Remote sensor monitoring of equipment,
machines and materials
Autonomous vehicles and equipment
Collaborative robots
Increased safety and security
of building sites
Better energy use/less waste
Support for green construction
practices (e.g. remote
management of machines)
GDP contribution uplift due
to increased productivity
Urban ‘hot
spots’
(including
public
transport in
urban
centres)
Always-on connectivity for communications and
e-commerce – enabling more people to be
connected to real-time services (including
video)
Optimised public transport networks (e.g.
improved route planning, real-time information,
passenger infotainment)
Wellbeing benefits for those
living in cities: better access
to entertainment/
e-commerce while travelling
Lower journey times on public
transport and better
information
Reduced emissions from
optimised public transport
networks
Smart buildings/green building
initiatives
More efficient public transport
journeys
GDP contribution uplift due
to increased productivity
Stadiums New immersive experiences (e.g. multi-view
AR/VR)
Social video sharing
UHD video surveillance
Real-time smart parking
Enjoyment/experience (ability
to replay live video, interact
with the event, etc.)
Additional viewing content
(e.g. behind the scenes)
Support for green initiatives in
stadiums
New business models/
financial benefits for the
sports club (not modelled
here)
Smart
automotive
Real-time optimised routing and advanced
traffic management
Increased real-time situational awareness for
driver
Non-line-of-sight accident sensing
Safety-related benefits (e.g.
reduction in accidents)
Optimising driving patterns
and reducing journey time
creates a wellbeing benefit
Increased fuel efficiency and
reduced emissions (e.g. due to
access to real-time map
updates, real-time parking data,
making journeys shorter)
New business models (not
modelled here)
Summary of use cases considered in the Smart Urban cluster and their associated benefits
11
5G in the Smart Urban cluster together with edge computing is expected to deliver
benefits across multiple use cases, where 5G can enhance and create new uses*
Executive summary
A quantitative estimate of economic benefits and costs is
presented later in this section
1 We do not consider jobs created/displaced as part of our assessment
Source: Analysys Mason, Ericsson, Qualcomm

698248493-260
Use case Features of the use case Social benefits Environmental benefits Economic benefits
Healthcare and
hospitals
Remote monitoring of patients/early
warning of changes in vital signs
Video, medicine and ‘tactile internet’1
Smart objects (e.g. real-time
management of medical resources)
High reliability remote
consultation and triage
Increase in social inclusion and
wellbeing; improved care
Reduced journeys (e.g.
ambulances to hospitals or
journeys to GP surgeries)
More preventative care/less
pressure on hospitals and
healthcare providers
Reduced expenditure
(e.g. time or money) due
to preventative
healthcare, leading to
lower healthcare costs/
increased capacity (not
modelled here)
Municipal
buildings
Highly available and low-latency
connections providing capacity to
support more users with higher-speed
services (including real-time video)
Better energy use/less waste
Collaboration/interaction (e.g.
social or business hubs)
Possible reduction in journeys
(e.g. fewer journeys for monitoring
and resolving social problems)
GDP contribution uplift
due to increased
productivity2
Education Remote/home-based teaching via
interactive platforms
Immersive XR-based learning
Remote native-language speakers/
additional remote expert education
Increased availability and access
to education, including remote
learning in schools and
universities
Remote access to experts
Green school initiatives (e.g. high-
speed, low-latency connectivity to
support energy saving or
environmental projects in schools
or universities)
-
Tourism Enhancement of tourism experiences
through virtual reality / augmented
reality
Virtual walk-throughs of tourist
sites/quality of experience
Educational benefits
Conservation benefits (e.g.
enabling tourists to better
understand environmental
challenges via VR/AR)
New business models
from immersive tours
Summary of use cases in the Smart Public Services cluster and their associated benefits
12
The Smart Public Services cluster is expected to enable enhancements in
communication for a range of public services, plus new capabilities and tools
Executive summary
A quantitative estimate of economic benefits and costs is
presented later in this section
1 Remote monitoring also requires connectivity at home – we have not modelled the benefit of remote monitoring of patients
although we note this could be part of the benefit of 5G FWA provided in suburban/rural areas indicated on slide 10
2 We do not consider jobs created/displaced as part of our assessment
Source: Analysys Mason, Ericsson, Qualcomm
698248493-260
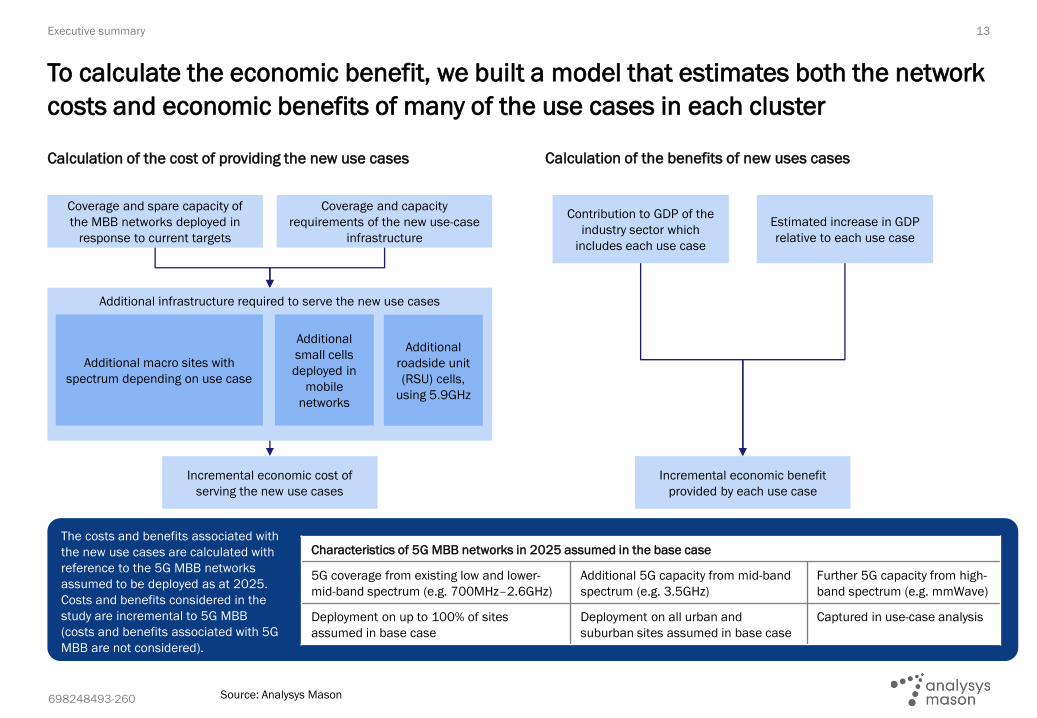
Calculation of the cost of providing the new use cases Calculation of the benefits of new uses cases
13
To calculate the economic benefit, we built a model that estimates both the network
costs and economic benefits of many of the use cases in each cluster
Executive summary
Source: Analysys Mason
Contribution to GDP of the
industry sector which
includes each use case
Estimated increase in GDP
relative to each use case
Incremental economic benefit
provided by each use case
The costs and benefits associated with
the new use cases are calculated with
reference to the 5G MBB networks
assumed to be deployed as at 2025.
Costs and benefits considered in the
study are incremental to 5G MBB
(costs and benefits associated with 5G
MBB are not considered).
Characteristics of 5G MBB networks in 2025 assumed in the base case
5G coverage from existing low and lower-
mid-band spectrum (e.g. 700MHz–2.6GHz)
Additional 5G capacity from mid-band
spectrum (e.g. 3.5GHz)
Further 5G capacity from high-
band spectrum (e.g. mmWave)
Deployment on up to 100% of sites
assumed in base case
Deployment on all urban and
suburban sites assumed in base case
Captured in use-case analysis
Coverage and spare capacity of
the MBB networks deployed in
response to current targets
Coverage and capacity
requirements of the new use-case
infrastructure
Incremental economic cost of
serving the new use cases
Additional infrastructure required to serve the new use cases
Additional macro sites with
spectrum depending on use case
Additional
small cells
deployed in
mobile
networks
Additional
roadside unit
(RSU) cells,
using 5.9GHz
698248493-260
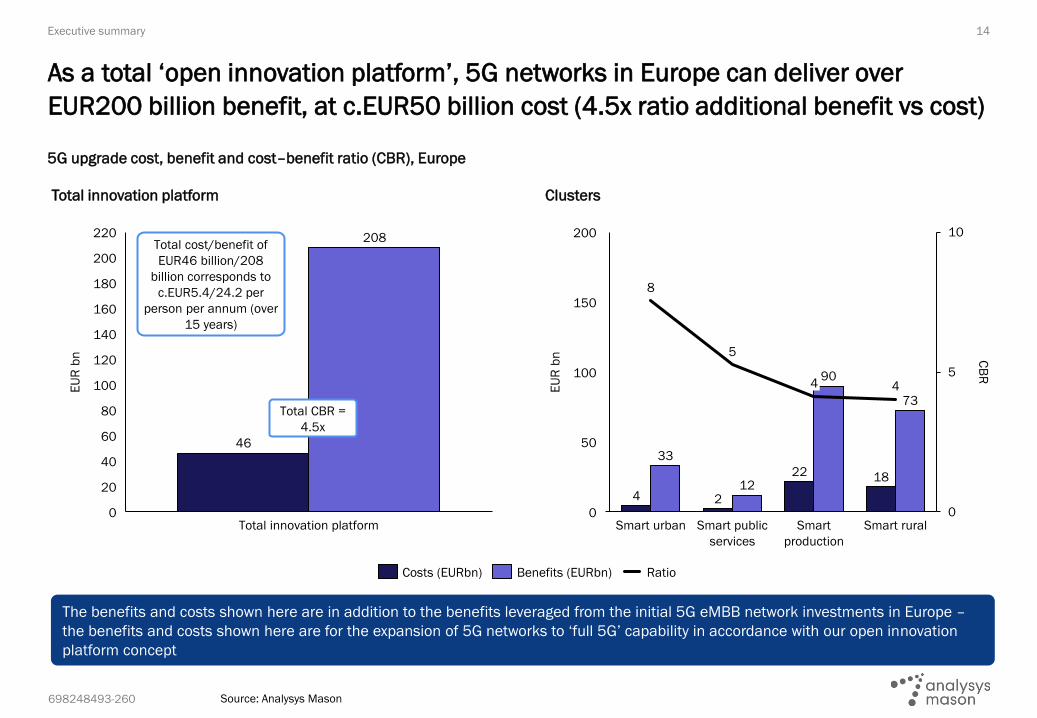
14
5G upgrade cost, benefit and cost–benefit ratio (CBR), Europe
Clusters
As a total ‘open innovation platform’, 5G networks in Europe can deliver over
EUR200 billion benefit, at c.EUR50 billion cost (4.5x ratio additional benefit vs cost)
Source: Analysys Mason
220
120
80
60
20
0
100
40
140
160
180
200
208
EU
R b
n
Total innovation platform
46
8
5
4
0
5
10
0
200
150
50
100
CB
R
4
22
EU
R b
n
Smart urban Smart public
services
2
4
Smart
production
Smart rural
33
12
90
18
73
Total cost/benefit of
EUR46 billion/208
billion corresponds to
c.EUR5.4/24.2 per
person per annum (over
15 years)
Costs (EURbn) Benefits (EURbn) Ratio
The benefits and costs shown here are in addition to the benefits leveraged from the initial 5G eMBB network investments in Europe –
the benefits and costs shown here are for the expansion of 5G networks to ‘full 5G’ capability in accordance with our open innovation
platform concept
Executive summary
Total innovation platform
Total CBR =
4.5x

698248493-260
Use cases: 5G upgrade cost, benefit and CBR, Europe
▪ The costs and benefits shown are incremental to costs and benefits gained from initial 5G deployment (i.e. costs and benefits associated
with our base case are not shown). “Total” benefit may be (significantly) larger than that shown when also including 5G benefits up to
2025 e.g. Analysys Mason modelling1 for the 5GAA suggests c.EUR3–4 billion of European benefit from C-V2X (i.e. smart automotive) by
2025, rising to c.EUR20 billion by 2030, not shown here
15
At the use case level, the largest economic benefits in terms of European GDP
impact are from smart factory, agriculture and 5G FWA (suburban/rural broadband)
Note: FWA is assumed to serve 5–20% of broadband market in each country (guided by current propensity to use FWA
services)
1 https://5gaa.org/wp-content/uploads/2018/06/2.-Presentation-on-cellular-V2X-socio-economic-benefit-study-08022018.pdf
109
98
7
30
10
70
0
40
50
0
10
60
20
3
Ports
25
0
EU
R b
n CB
R
Urban
hotspots
Construction
sites
Municipal
buildings
2
Smart
factories
Airport
65
Agriculture
3
FWA
45
2
Mines
12
0
31
1 1
12
70
8 10
28
9
14
Benefits (EURbn)Costs (EURbn) Ratio
Executive summary
We have assumed limited synergies between use cases due to localised demand and have not included any common cost from the MBB
network (as we assume the MNOs will make 5G MBB available in any event, due to competitive pressure)
There are several use cases
not shown here that our
study has considered and
we have captured in our
network costs, but have not
modelled a GDP benefit. We
have considered the
benefits of 5G to these use
cases qualitatively in terms
of the potential
environmental and societal
benefits (these include
healthcare and hospitals,
smart automotive and
stadiums). We note
consumer benefit will be
generated from these use
cases, which we have not
modelled, but which several
other published studies
refer to.
698248493-260
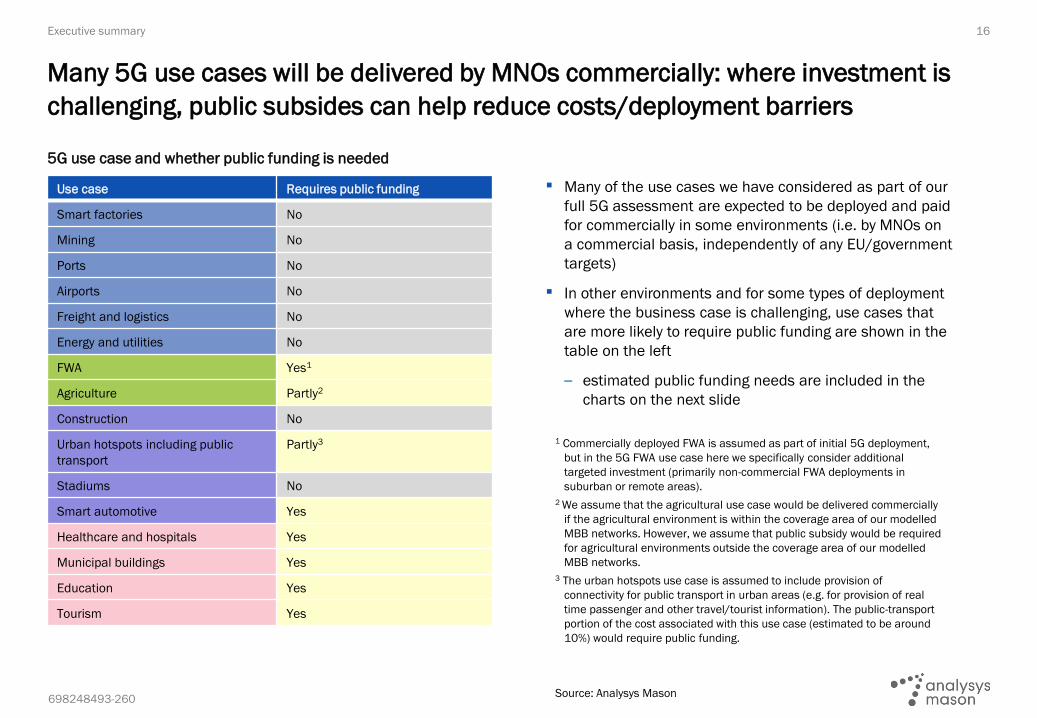
▪ Many of the use cases we have considered as part of our
full 5G assessment are expected to be deployed and paid
for commercially in some environments (i.e. by MNOs on
a commercial basis, independently of any EU/government
targets)
▪ In other environments and for some types of deployment
where the business case is challenging, use cases that
are more likely to require public funding are shown in the
table on the left
– estimated public funding needs are included in the
charts on the next slide
5G use case and whether public funding is needed
16
Many 5G use cases will be delivered by MNOs commercially: where investment is
challenging, public subsides can help reduce costs/deployment barriers
Executive summary
1 Commercially deployed FWA is assumed as part of initial 5G deployment,
but in the 5G FWA use case here we specifically consider additional
targeted investment (primarily non-commercial FWA deployments in
suburban or remote areas).
2 We assume that the agricultural use case would be delivered commercially
if the agricultural environment is within the coverage area of our modelled
MBB networks. However, we assume that public subsidy would be required
for agricultural environments outside the coverage area of our modelled
MBB networks.
3 The urban hotspots use case is assumed to include provision of
connectivity for public transport in urban areas (e.g. for provision of real
time passenger and other travel/tourist information). The public-transport
portion of the cost associated with this use case (estimated to be around
10%) would require public funding.
Source: Analysys Mason
Use case Requires public funding
Smart factories No
Mining No
Ports No
Airports No
Freight and logistics No
Energy and utilities No
FWA Yes1
Agriculture Partly2
Construction No
Urban hotspots including public
transport
Partly3
Stadiums No
Smart automotive Yes
Healthcare and hospitals Yes
Municipal buildings Yes
Education Yes
Tourism Yes

698248493-260
17
5G upgrade cost, benefit and CBR, Europe – including only those use cases likely to require public funding
Use cases
For the use cases where we identify public subsidy will be needed, we estimate that
over EUR50 billion of benefit can be delivered for less than EUR20 billion funding
Source: Analysys Mason
Executive summary
Clusters
5
0
10
5
0
15
20
25
45
30
35
40
4
0
2
6
CB
R
Smart rural
EU
R b
n
15
Smart public
services
3
Smart urban
2
12
40
1 0
10
9
15
5
0
10
20
25
1030
0
2
4
6
8
0
EU
R b
n
Municipal
buildings
Agriculture
28
CB
R
Urban
hotspots
3
FWA
12
2
5
01
10
13
Costs (EURbn) RatioBenefits (EURbn)
▪ Use cases requiring public funding for which we have modelled cost but not economic benefit (i.e. healthcare and hospitals and smart
automotive) are not included in the right-hand chart above
▪ it is noted, however, that government funding for 5G infrastructure to support healthcare and hospitals, and autonomous vehicles, will
be highly beneficial, based on previous studies
698248493-260
18
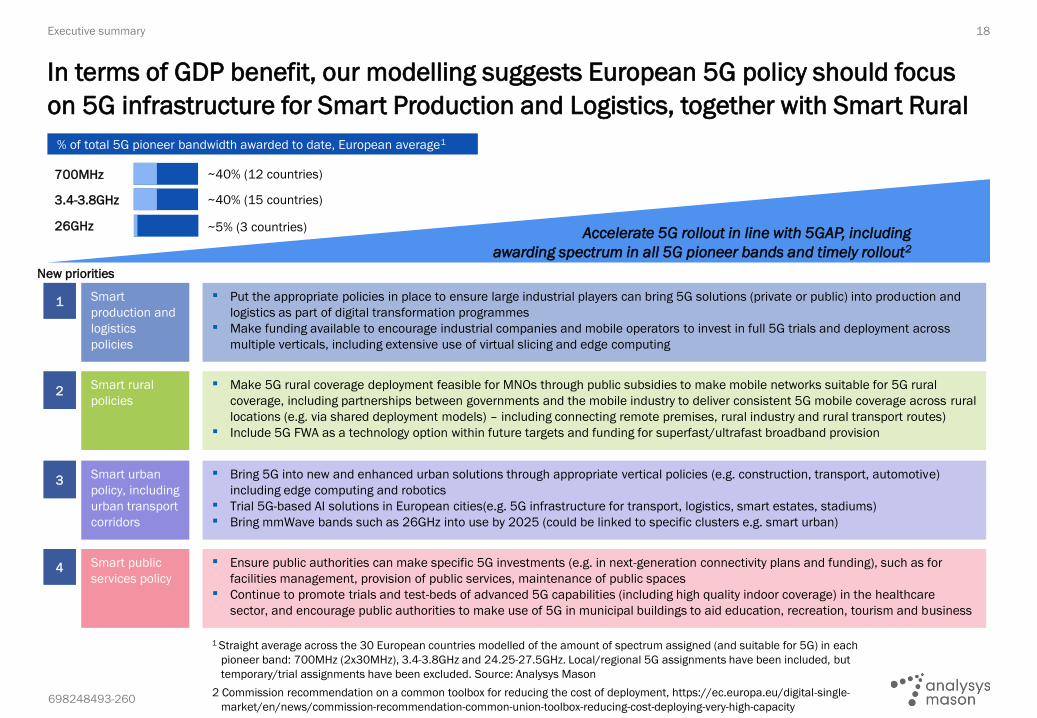
In terms of GDP benefit, our modelling suggests European 5G policy should focus
on 5G infrastructure for Smart Production and Logistics, together with Smart Rural
Executive summary
Smart
production and
logistics
policies
Smart rural
policies
Smart urban
policy, including
urban transport
corridors
Smart public
services policy
▪ Put the appropriate policies in place to ensure large industrial players can bring 5G solutions (private or public) into production and
logistics as part of digital transformation programmes
▪ Make funding available to encourage industrial companies and mobile operators to invest in full 5G trials and deployment across
multiple verticals, including extensive use of virtual slicing and edge computing
▪ Make 5G rural coverage deployment feasible for MNOs through public subsidies to make mobile networks suitable for 5G rural
coverage, including partnerships between governments and the mobile industry to deliver consistent 5G mobile coverage across rural
locations (e.g. via shared deployment models) – including connecting remote premises, rural industry and rural transport routes)
▪ Include 5G FWA as a technology option within future targets and funding for superfast/ultrafast broadband provision
▪ Bring 5G into new and enhanced urban solutions through appropriate vertical policies (e.g. construction, transport, automotive)
including edge computing and robotics
▪ Trial 5G-based AI solutions in European cities(e.g. 5G infrastructure for transport, logistics, smart estates, stadiums)
▪ Bring mmWave bands such as 26GHz into use by 2025 (could be linked to specific clusters e.g. smart urban)
▪ Ensure public authorities can make specific 5G investments (e.g. in next-generation connectivity plans and funding), such as for
facilities management, provision of public services, maintenance of public spaces
▪ Continue to promote trials and test-beds of advanced 5G capabilities (including high quality indoor coverage) in the healthcare
sector, and encourage public authorities to make use of 5G in municipal buildings to aid education, recreation, tourism and business
1
2
3
4
1 Straight average across the 30 European countries modelled of the amount of spectrum assigned (and suitable for 5G) in each
pioneer band: 700MHz (2x30MHz), 3.4-3.8GHz and 24.25-27.5GHz. Local/regional 5G assignments have been included, but
temporary/trial assignments have been excluded. Source: Analysys Mason
2 Commission recommendation on a common toolbox for reducing the cost of deployment, https://ec.europa.eu/digital-single-
market/en/news/commission-recommendation-common-union-toolbox-reducing-cost-deploying-very-high-capacity
Accelerate 5G rollout in line with 5GAP, including
awarding spectrum in all 5G pioneer bands and timely rollout2
% of total 5G pioneer bandwidth awarded to date, European average1
700MHz ~40% (12 countries)
3.4-3.8GHz
26GHz
~40% (15 countries)
~5% (3 countries)
New priorities

698248493-260
19
From an environmental and societal benefits perspective, high priorities are
improving 5G coverage in the Smart Rural cluster, and factories, freight and logistics
Executive summary
Clusters Smart Rural Smart Production and Logistics
Use cases Agriculture 5G FWA Ports Airports MinesSmart
factories
Freight and
logistics
Energy and
utilities
Environmental benefit
from 5G connectivity
Increased
efficiency/
lower carbon
farming
Reduced
journeys (e.g.
working
remotely plus
connectivity in
rural transport
corridors)
Logistics
efficiency ->
carbon
emission
reduction
Reduced
congestion
Real-time
monitoring in
mines e.g. air
quality, risk of
hazards
Better use of
time and
materials ->
reduced
energy use
Industrial
process and
equipment
monitoring ->
improved
equipment
lifetimes
Facilitate ‘just-
in-time’ supply
chains,
efficient
transport of
goods
Remote
monitoring/
remote
inspection ->
better control
of energy use
Societal benefit from 5G
connectivity
Sustained
rural
industries
Ability to
market
products
beyond local
area
Social
inclusion/
reducing the
digital divide
Slow or
reverse rural
population
declines
Support for
rural
businesses to
operate
digitally
Increased
security,
safety and
technology-
skilled
workforces
Increased
security,
safety
Less time
waiting in
airports/
enhanced
passenger
experience
Increased
security,
safety
technology-
skilled
workforces
Increased
security,
technology-
skilled
workforces
Increased
safety/
reduction or
prevention of
accidents
Encourage
good energy
use through
real-time
awareness of
energy being
used
Highest benefit Medium benefit Lower benefit
Highest priority Highest priority
698248493-260
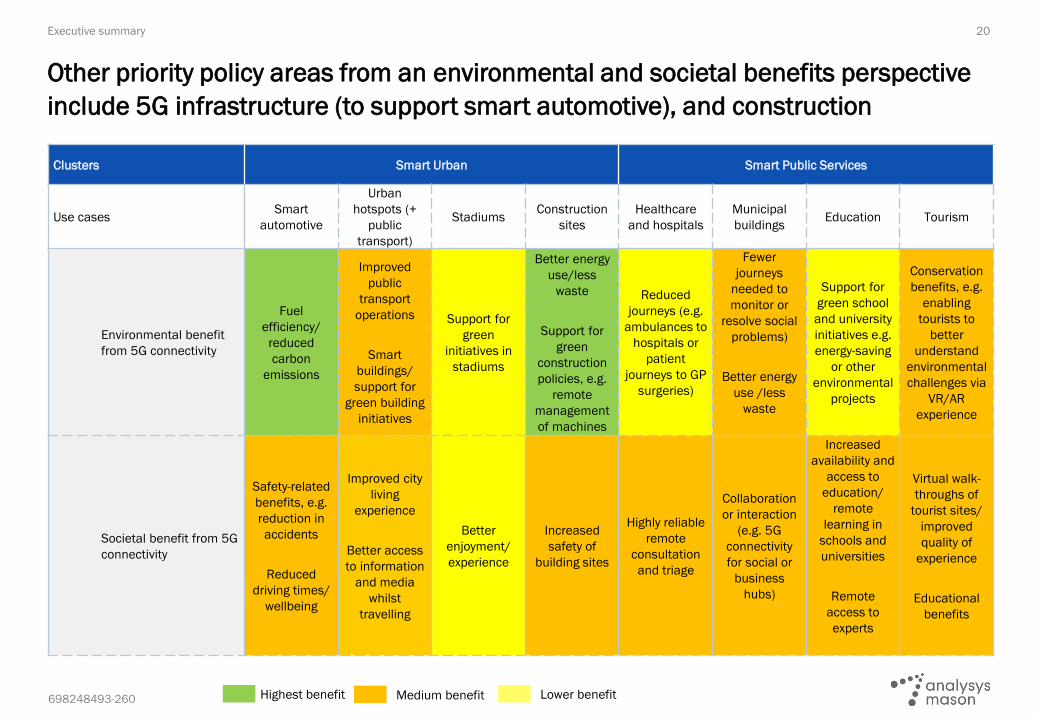
20
Other priority policy areas from an environmental and societal benefits perspective
include 5G infrastructure (to support smart automotive), and construction
Executive summary
Highest benefit Medium benefit Lower benefit
Clusters Smart Urban Smart Public Services
Use casesSmart
automotive
Urban
hotspots (+
public
transport)
StadiumsConstruction
sites
Healthcare
and hospitals
Municipal
buildingsEducation Tourism
Environmental benefit
from 5G connectivity
Fuel
efficiency/
reduced
carbon
emissions
Improved
public
transport
operations
Smart
buildings/
support for
green building
initiatives
Support for
green
initiatives in
stadiums
Better energy
use/less
waste
Support for
green
construction
policies, e.g.
remote
management
of machines
Reduced
journeys (e.g.
ambulances to
hospitals or
patient
journeys to GP
surgeries)
Fewer
journeys
needed to
monitor or
resolve social
problems)
Better energy
use /less
waste
Support for
green school
and university
initiatives e.g.
energy-saving
or other
environmental
projects
Conservation
benefits, e.g.
enabling
tourists to
better
understand
environmental
challenges via
VR/AR
experience
Societal benefit from 5G
connectivity
Safety-related
benefits, e.g.
reduction in
accidents
Reduced
driving times/
wellbeing
Improved city
living
experience
Better access
to information
and media
whilst
travelling
Better
enjoyment/
experience
Increased
safety of
building sites
Highly reliable
remote
consultation
and triage
Collaboration
or interaction
(e.g. 5G
connectivity
for social or
business
hubs)
Increased
availability and
access to
education/
remote
learning in
schools and
universities
Remote
access to
experts
Virtual walk-
throughs of
tourist sites/
improved
quality of
experience
Educational
benefits

698248493-260
Contents Executive summary
Aims and scope of the study
Methodology
Results
698248493-260
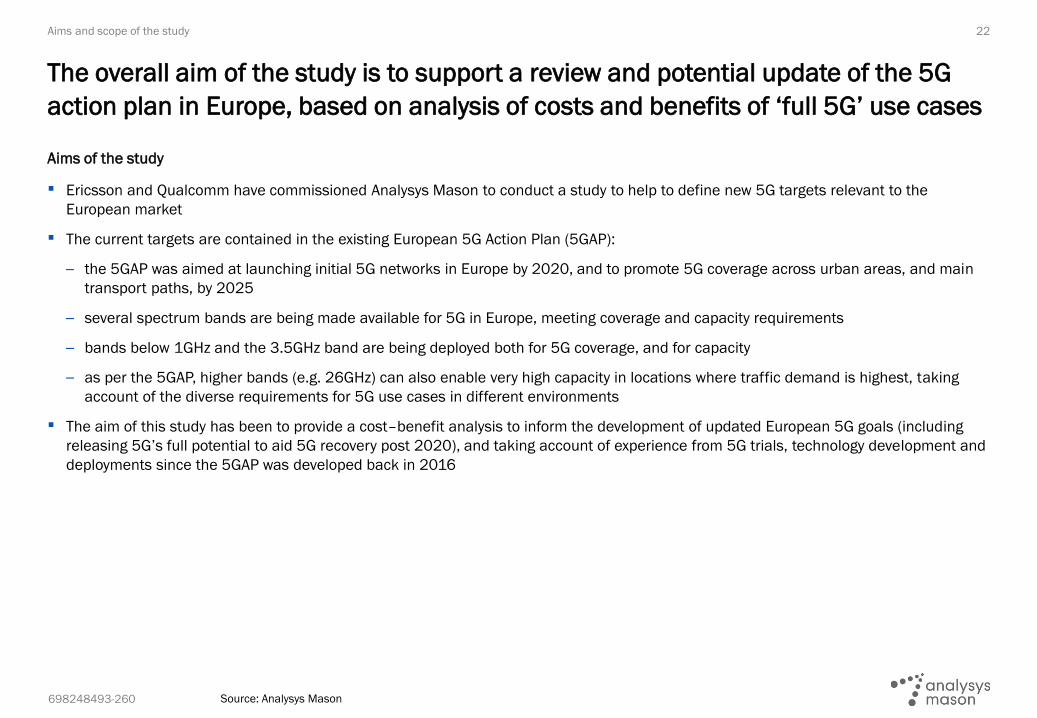
▪ Ericsson and Qualcomm have commissioned Analysys Mason to conduct a study to help to define new 5G targets relevant to the
European market
▪ The current targets are contained in the existing European 5G Action Plan (5GAP):
– the 5GAP was aimed at launching initial 5G networks in Europe by 2020, and to promote 5G coverage across urban areas, and main
transport paths, by 2025
– several spectrum bands are being made available for 5G in Europe, meeting coverage and capacity requirements
– bands below 1GHz and the 3.5GHz band are being deployed both for 5G coverage, and for capacity
– as per the 5GAP, higher bands (e.g. 26GHz) can also enable very high capacity in locations where traffic demand is highest, taking
account of the diverse requirements for 5G use cases in different environments
▪ The aim of this study has been to provide a cost–benefit analysis to inform the development of updated European 5G goals (including
releasing 5G’s full potential to aid 5G recovery post 2020), and taking account of experience from 5G trials, technology development and
deployments since the 5GAP was developed back in 2016
Aims of the study
22
The overall aim of the study is to support a review and potential update of the 5G
action plan in Europe, based on analysis of costs and benefits of ‘full 5G’ use cases
Aims and scope of the study
Source: Analysys Mason
698248493-260
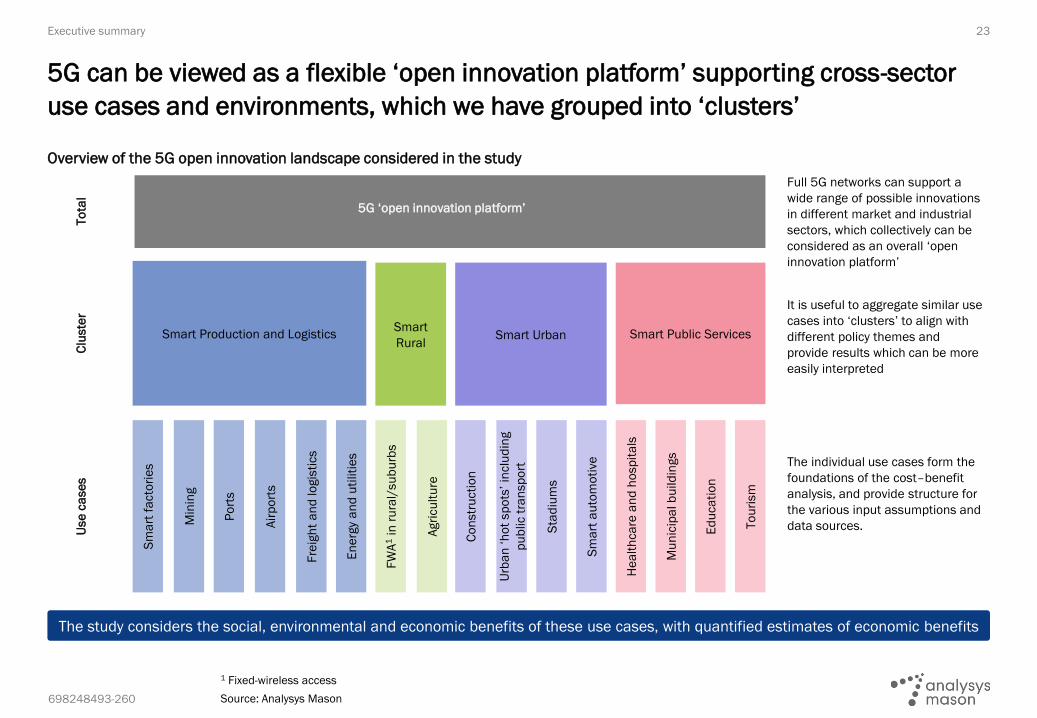
Overview of the 5G open innovation landscape considered in the study
23
5G can be viewed as a flexible ‘open innovation platform’ supporting cross-sector
use cases and environments, which we have grouped into ‘clusters’
Executive summary
Clu
ste
rU
se
ca
se
s
Smart
RuralSmart Public ServicesSmart Production and Logistics Smart Urban
5G ‘open innovation platform’
To
tal
Full 5G networks can support a
wide range of possible innovations
in different market and industrial
sectors, which collectively can be
considered as an overall ‘open
innovation platform’
It is useful to aggregate similar use
cases into ‘clusters’ to align with
different policy themes and
provide results which can be more
easily interpreted
The individual use cases form the
foundations of the cost–benefit
analysis, and provide structure for
the various input assumptions and
data sources.
Mu
nic
ipa
l b
uild
ings
He
alt
hca
re a
nd
ho
sp
ita
ls
To
uri
sm
Ed
uca
tio
n
En
erg
y a
nd
uti
liti
es
Fre
igh
t a
nd
lo
gis
tics
Air
po
rts
Po
rts
Min
ing
Sm
art
fa
cto
rie
s
Agri
cu
ltu
re
FW
A1
in r
ura
l/su
bu
rbs
Sm
art
au
tom
oti
ve
Sta
diu
ms
Urb
an
‘h
ot
sp
ots
’ in
clu
din
g
pu
blic t
ran
sp
ort
Co
nstr
ucti
on
The study considers the social, environmental and economic benefits of these use cases, with quantified estimates of economic benefits
1 Fixed-wireless access
Source: Analysys Mason

698248493-260
Summary of key network architectures modelled
24
Our model considers three key network architectures, which capture a range of
alternatives around the different deployments possible for new 5G use cases
Aims and scope of the study
5G macro cells
(3.5GHz DL and low-frequency UL)
5G small cells
(3.5GHz or 26GHz)
Outdoor coverage Local and wide area
Capacity High downlink capacityHigh-capacity and low-latency
(both UL and downlink)
Typical uses MBB, FWA, lower bandwidth new use casesVery high traffic concentrations and/or
specific coverage requirements
Indoor coverage Possible within certain distance Can be installed inside buildings
Characteristics
Selected use cases
Smart factories
Agriculture
Smart automotive
Healthcare and
hospitals
Coverage of factories with large site areas Localised coverage for smaller factories
Wide area coverage of agricultural land
Coverage of major road transport routesLocalised transport coverage in urban
areas e.g. intersections
High-bandwidth, low-latency localised
coverage
Many of the use cases will make uses of the characteristics of different architectures
LocalisedLocal and wide area
UL = uplink; DL = downlink; DSS = dynamic spectrum sharing; SA = standalone; RSU = roadside unit
1 https://www.ericsson.com/en/blog/2019/7/standalone-and-non-standalone-5g-nr-two-5g-tracks,
https://www.qualcomm.com/news/onq/2019/08/19/key-breakthroughs-drive-fast-and-smooth-transition-5g-standalone
5G macro cells
(3.5GHz DL and 3.5GHz UL)
Possible within certain distance
High uplink and downlink capacity
New use cases with requirement for
reasonable coverage and high bandwidth
Ports and airports High capacity coverage of large site area
We have assumed DSS
allows an SA architecture
using mixed-frequency
deployment1
5G RSUs
(5.9GHz)

698248493-260
Contents Executive summary
Aims and scope of the study
Methodology
Results
698248493-260
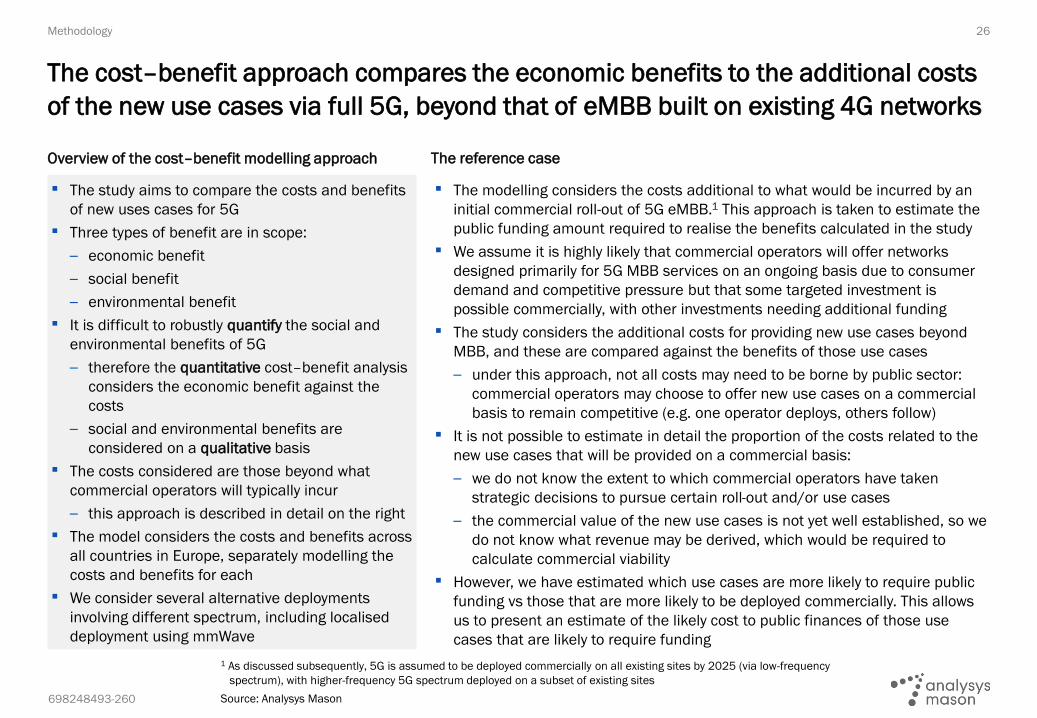
▪ The study aims to compare the costs and benefits
of new uses cases for 5G
▪ Three types of benefit are in scope:
– economic benefit
– social benefit
– environmental benefit
▪ It is difficult to robustly quantify the social and
environmental benefits of 5G
– therefore the quantitative cost–benefit analysis
considers the economic benefit against the
costs
– social and environmental benefits are
considered on a qualitative basis
▪ The costs considered are those beyond what
commercial operators will typically incur
– this approach is described in detail on the right
▪ The model considers the costs and benefits across
all countries in Europe, separately modelling the
costs and benefits for each
▪ We consider several alternative deployments
involving different spectrum, including localised
deployment using mmWave
▪ The modelling considers the costs additional to what would be incurred by an
initial commercial roll-out of 5G eMBB.1 This approach is taken to estimate the
public funding amount required to realise the benefits calculated in the study
▪ We assume it is highly likely that commercial operators will offer networks
designed primarily for 5G MBB services on an ongoing basis due to consumer
demand and competitive pressure but that some targeted investment is
possible commercially, with other investments needing additional funding
▪ The study considers the additional costs for providing new use cases beyond
MBB, and these are compared against the benefits of those use cases
– under this approach, not all costs may need to be borne by public sector:
commercial operators may choose to offer new use cases on a commercial
basis to remain competitive (e.g. one operator deploys, others follow)
▪ It is not possible to estimate in detail the proportion of the costs related to the
new use cases that will be provided on a commercial basis:
– we do not know the extent to which commercial operators have taken
strategic decisions to pursue certain roll-out and/or use cases
– the commercial value of the new use cases is not yet well established, so we
do not know what revenue may be derived, which would be required to
calculate commercial viability
▪ However, we have estimated which use cases are more likely to require public
funding vs those that are more likely to be deployed commercially. This allows
us to present an estimate of the likely cost to public finances of those use
cases that are likely to require funding
Overview of the cost–benefit modelling approach The reference case
26
The cost–benefit approach compares the economic benefits to the additional costs
of the new use cases via full 5G, beyond that of eMBB built on existing 4G networks
Methodology
1 As discussed subsequently, 5G is assumed to be deployed commercially on all existing sites by 2025 (via low-frequency
spectrum), with higher-frequency 5G spectrum deployed on a subset of existing sites
Source: Analysys Mason
698248493-260 1 In current MBB coverage areas. Source: Analysys Mason
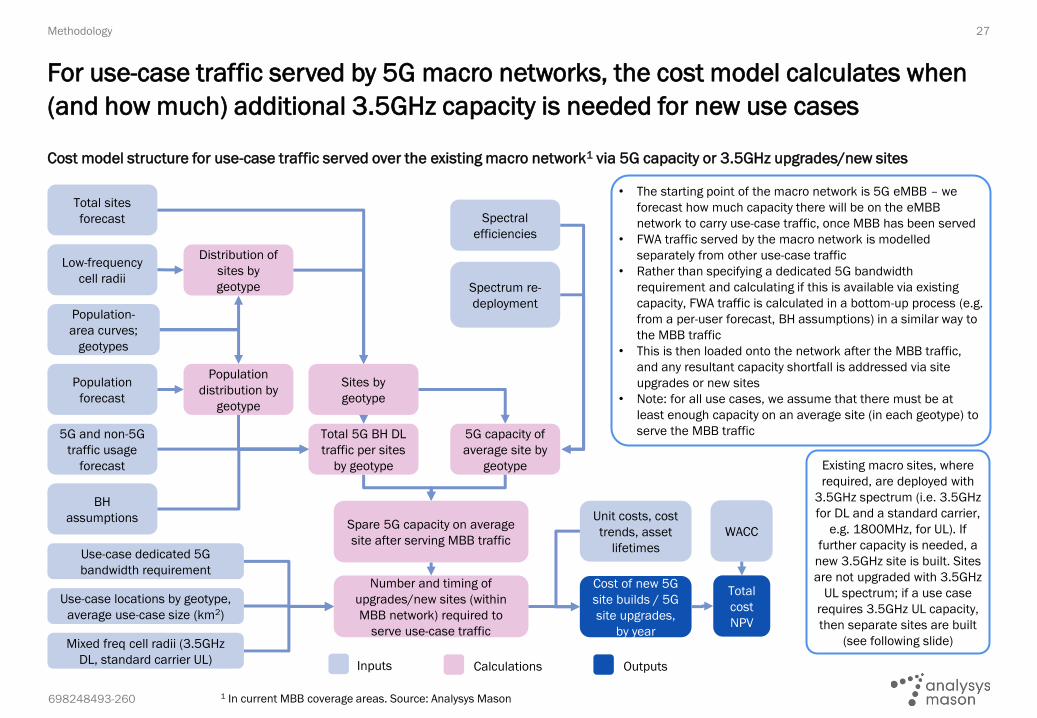
Cost model structure for use-case traffic served over the existing macro network1 via 5G capacity or 3.5GHz upgrades/new sites
27
For use-case traffic served by 5G macro networks, the cost model calculates when
(and how much) additional 3.5GHz capacity is needed for new use cases
Methodology
• The starting point of the macro network is 5G eMBB – we
forecast how much capacity there will be on the eMBB
network to carry use-case traffic, once MBB has been served
• FWA traffic served by the macro network is modelled
separately from other use-case traffic
• Rather than specifying a dedicated 5G bandwidth
requirement and calculating if this is available via existing
capacity, FWA traffic is calculated in a bottom-up process (e.g.
from a per-user forecast, BH assumptions) in a similar way to
the MBB traffic
• This is then loaded onto the network after the MBB traffic,
and any resultant capacity shortfall is addressed via site
upgrades or new sites
• Note: for all use cases, we assume that there must be at
least enough capacity on an average site (in each geotype) to
serve the MBB traffic
Existing macro sites, where
required, are deployed with
3.5GHz spectrum (i.e. 3.5GHz
for DL and a standard carrier,
e.g. 1800MHz, for UL). If
further capacity is needed, a
new 3.5GHz site is built. Sites
are not upgraded with 3.5GHz
UL spectrum; if a use case
requires 3.5GHz UL capacity,
then separate sites are built
(see following slide)
Inputs Calculations Outputs
Population-
area curves;
geotypes
Low-frequency
cell radii
Distribution of
sites by
geotype
Total sites
forecast
Spare 5G capacity on average
site after serving MBB traffic
Sites by
geotype
Cost of new 5G
site builds / 5G
site upgrades,
by year
5G and non-5G
traffic usage
forecast
Total 5G BH DL
traffic per sites
by geotype
Population
forecast
Spectral
efficiencies
Spectrum re-
deployment
Population
distribution by
geotype
BH
assumptions
5G capacity of
average site by
geotype
Use-case dedicated 5G
bandwidth requirementNumber and timing of
upgrades/new sites (within
MBB network) required to
serve use-case traffic
Use-case locations by geotype,
average use-case size (km2)
Unit costs, cost
trends, asset
lifetimes
Total
cost
NPV
WACC
Mixed freq cell radii (3.5GHz
DL, standard carrier UL)
698248493-260
28
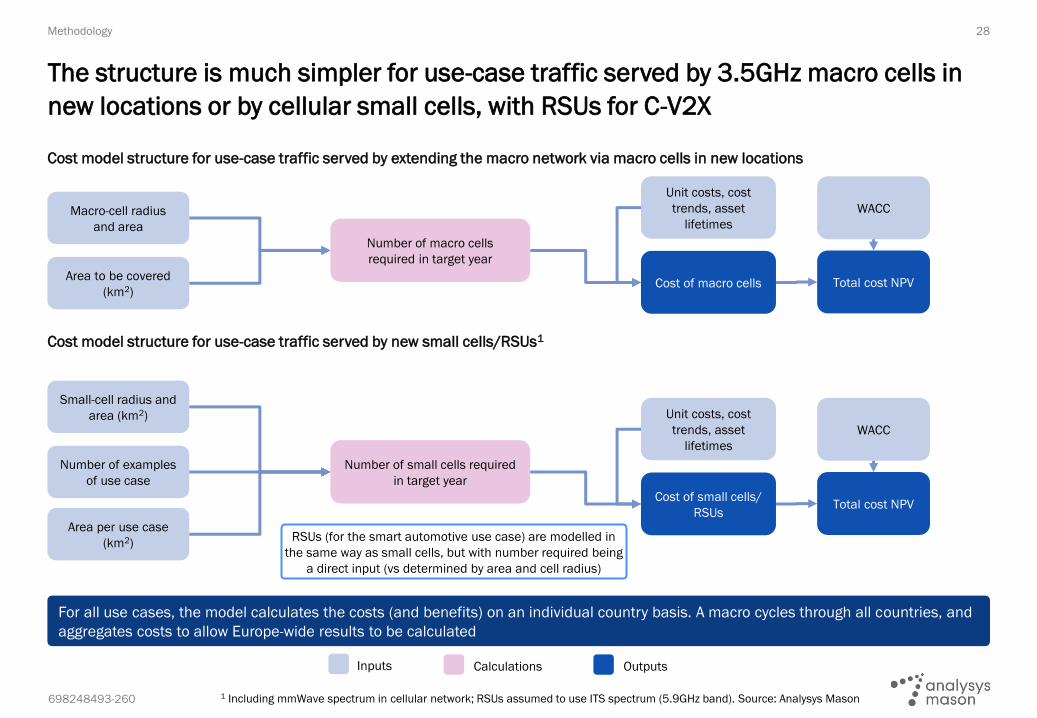
Cost model structure for use-case traffic served by extending the macro network via macro cells in new locations
Cost model structure for use-case traffic served by new small cells/RSUs1
The structure is much simpler for use-case traffic served by 3.5GHz macro cells in
new locations or by cellular small cells, with RSUs for C-V2X
Methodology
Cost of small cells/
RSUs
Small-cell radius and
area (km2)
Number of examples
of use case
Number of small cells required
in target year
Area per use case
(km2)
Unit costs, cost
trends, asset
lifetimes
Total cost NPV
WACC
Cost of macro cells
Macro-cell radius
and area
Area to be covered
(km2)
Number of macro cells
required in target year
Unit costs, cost
trends, asset
lifetimes
Total cost NPV
WACC
RSUs (for the smart automotive use case) are modelled in
the same way as small cells, but with number required being
a direct input (vs determined by area and cell radius)
For all use cases, the model calculates the costs (and benefits) on an individual country basis. A macro cycles through all countries, and
aggregates costs to allow Europe-wide results to be calculated
Inputs Calculations Outputs
1 Including mmWave spectrum in cellular network; RSUs assumed to use ITS spectrum (5.9GHz band). Source: Analysys Mason
698248493-260
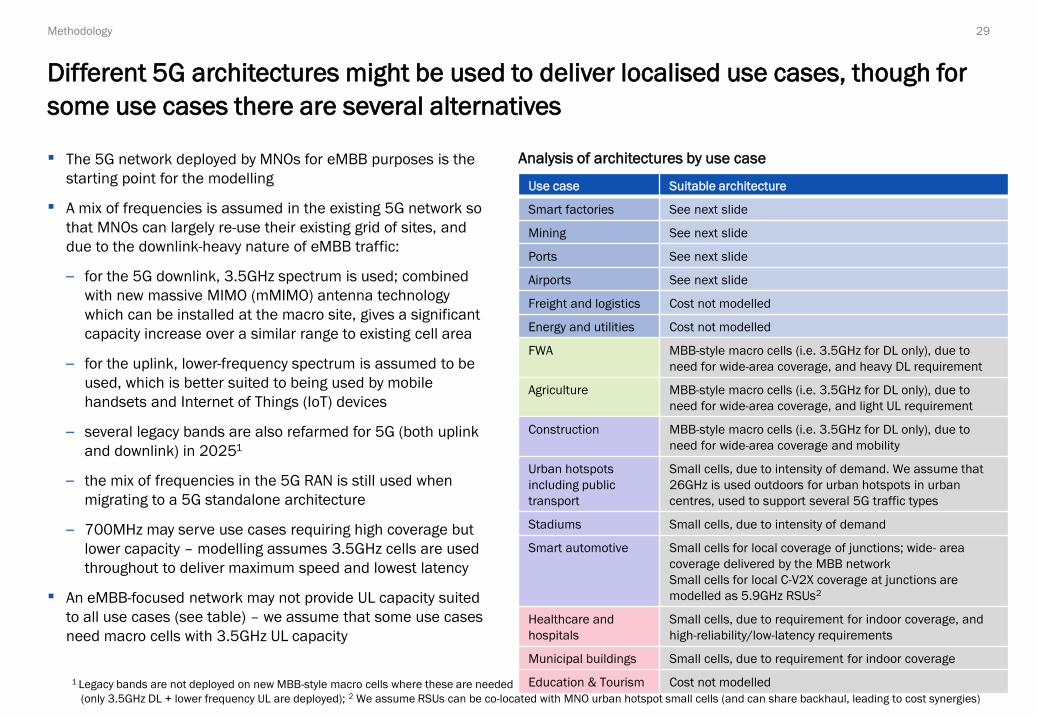
▪ The 5G network deployed by MNOs for eMBB purposes is the
starting point for the modelling
▪ A mix of frequencies is assumed in the existing 5G network so
that MNOs can largely re-use their existing grid of sites, and
due to the downlink-heavy nature of eMBB traffic:
– for the 5G downlink, 3.5GHz spectrum is used; combined
with new massive MIMO (mMIMO) antenna technology
which can be installed at the macro site, gives a significant
capacity increase over a similar range to existing cell area
– for the uplink, lower-frequency spectrum is assumed to be
used, which is better suited to being used by mobile
handsets and Internet of Things (IoT) devices
– several legacy bands are also refarmed for 5G (both uplink
and downlink) in 20251
– the mix of frequencies in the 5G RAN is still used when
migrating to a 5G standalone architecture
– 700MHz may serve use cases requiring high coverage but
lower capacity – modelling assumes 3.5GHz cells are used
throughout to deliver maximum speed and lowest latency
▪ An eMBB-focused network may not provide UL capacity suited
to all use cases (see table) – we assume that some use cases
need macro cells with 3.5GHz UL capacity
Analysis of architectures by use case
29
Different 5G architectures might be used to deliver localised use cases, though for
some use cases there are several alternatives
Methodology
Use case Suitable architecture
Smart factories See next slide
Mining See next slide
Ports See next slide
Airports See next slide
Freight and logistics Cost not modelled
Energy and utilities Cost not modelled
FWA MBB-style macro cells (i.e. 3.5GHz for DL only), due to
need for wide-area coverage, and heavy DL requirement
Agriculture MBB-style macro cells (i.e. 3.5GHz for DL only), due to
need for wide-area coverage, and light UL requirement
Construction MBB-style macro cells (i.e. 3.5GHz for DL only), due to
need for wide-area coverage and mobility
Urban hotspots
including public
transport
Small cells, due to intensity of demand. We assume that
26GHz is used outdoors for urban hotspots in urban
centres, used to support several 5G traffic types
Stadiums Small cells, due to intensity of demand
Smart automotive Small cells for local coverage of junctions; wide- area
coverage delivered by the MBB network
Small cells for local C-V2X coverage at junctions are
modelled as 5.9GHz RSUs2
Healthcare and
hospitals
Small cells, due to requirement for indoor coverage, and
high-reliability/low-latency requirements
Municipal buildings Small cells, due to requirement for indoor coverage
Education & Tourism Cost not modelled1 Legacy bands are not deployed on new MBB-style macro cells where these are needed
(only 3.5GHz DL + lower frequency UL are deployed); 2 We assume RSUs can be co-located with MNO urban hotspot small cells (and can share backhaul, leading to cost synergies)
698248493-260
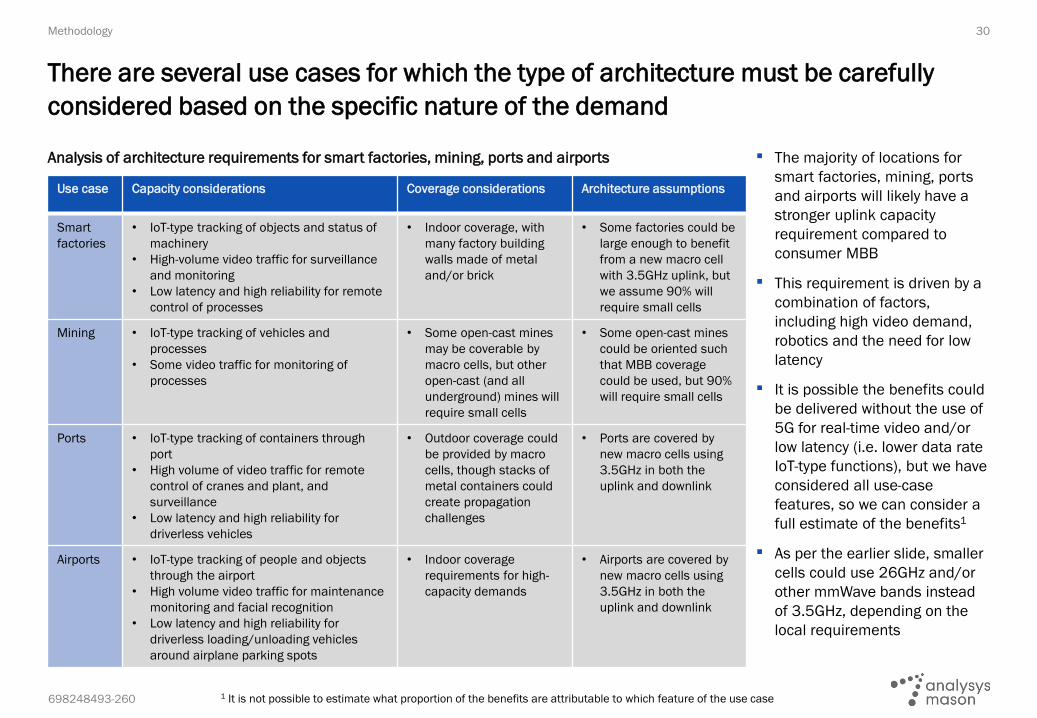
▪ The majority of locations for
smart factories, mining, ports
and airports will likely have a
stronger uplink capacity
requirement compared to
consumer MBB
▪ This requirement is driven by a
combination of factors,
including high video demand,
robotics and the need for low
latency
▪ It is possible the benefits could
be delivered without the use of
5G for real-time video and/or
low latency (i.e. lower data rate
IoT-type functions), but we have
considered all use-case
features, so we can consider a
full estimate of the benefits1
▪ As per the earlier slide, smaller
cells could use 26GHz and/or
other mmWave bands instead
of 3.5GHz, depending on the
local requirements
Analysis of architecture requirements for smart factories, mining, ports and airports
Use case Capacity considerations Coverage considerations Architecture assumptions
Smart
factories
• IoT-type tracking of objects and status of
machinery
• High-volume video traffic for surveillance
and monitoring
• Low latency and high reliability for remote
control of processes
• Indoor coverage, with
many factory building
walls made of metal
and/or brick
• Some factories could be
large enough to benefit
from a new macro cell
with 3.5GHz uplink, but
we assume 90% will
require small cells
Mining • IoT-type tracking of vehicles and
processes
• Some video traffic for monitoring of
processes
• Some open-cast mines
may be coverable by
macro cells, but other
open-cast (and all
underground) mines will
require small cells
• Some open-cast mines
could be oriented such
that MBB coverage
could be used, but 90%
will require small cells
Ports • IoT-type tracking of containers through
port
• High volume of video traffic for remote
control of cranes and plant, and
surveillance
• Low latency and high reliability for
driverless vehicles
• Outdoor coverage could
be provided by macro
cells, though stacks of
metal containers could
create propagation
challenges
• Ports are covered by
new macro cells using
3.5GHz in both the
uplink and downlink
Airports • IoT-type tracking of people and objects
through the airport
• High volume video traffic for maintenance
monitoring and facial recognition
• Low latency and high reliability for
driverless loading/unloading vehicles
around airplane parking spots
• Indoor coverage
requirements for high-
capacity demands
• Airports are covered by
new macro cells using
3.5GHz in both the
uplink and downlink
30
There are several use cases for which the type of architecture must be carefully
considered based on the specific nature of the demand
Methodology
1 It is not possible to estimate what proportion of the benefits are attributable to which feature of the use case
698248493-260
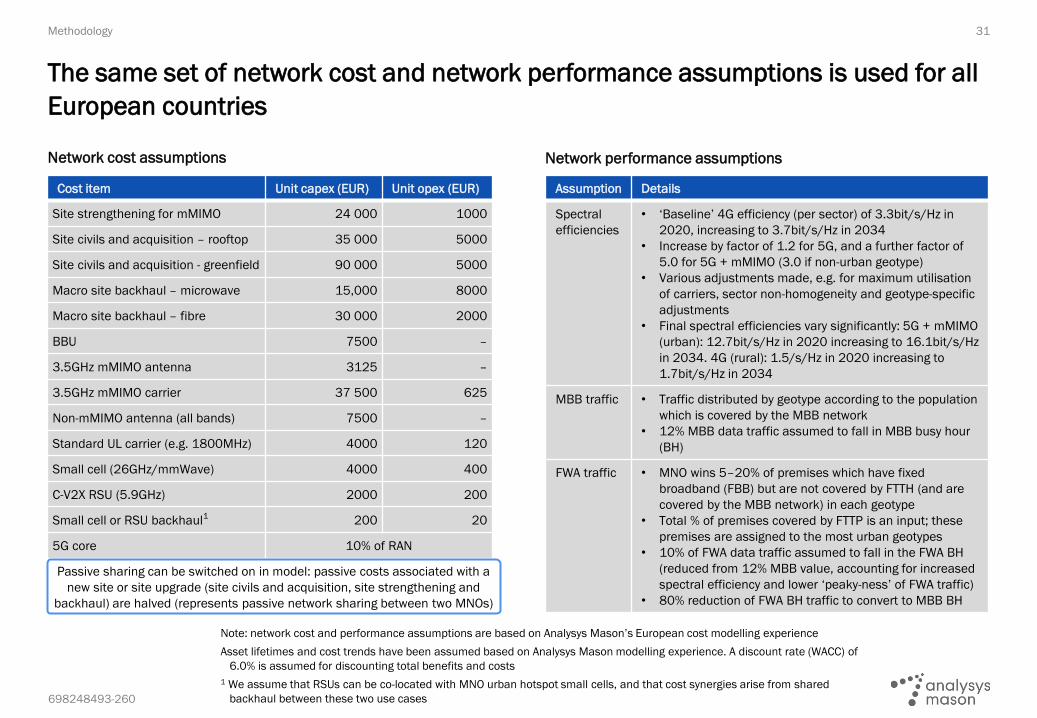
Network cost assumptions
Cost item Unit capex (EUR) Unit opex (EUR)
Site strengthening for mMIMO 24 000 1000
Site civils and acquisition – rooftop 35 000 5000
Site civils and acquisition - greenfield 90 000 5000
Macro site backhaul – microwave 15,000 8000
Macro site backhaul – fibre 30 000 2000
BBU 7500 –
3.5GHz mMIMO antenna 3125 –
3.5GHz mMIMO carrier 37 500 625
Non-mMIMO antenna (all bands) 7500 –
Standard UL carrier (e.g. 1800MHz) 4000 120
Small cell (26GHz/mmWave) 4000 400
C-V2X RSU (5.9GHz) 2000 200
Small cell or RSU backhaul1 200 20
5G core 10% of RAN
31
The same set of network cost and network performance assumptions is used for all
European countries
Methodology
Note: network cost and performance assumptions are based on Analysys Mason’s European cost modelling experience
Asset lifetimes and cost trends have been assumed based on Analysys Mason modelling experience. A discount rate (WACC) of
6.0% is assumed for discounting total benefits and costs
1 We assume that RSUs can be co-located with MNO urban hotspot small cells, and that cost synergies arise from shared
backhaul between these two use cases
Network performance assumptions
Assumption Details
Spectral
efficiencies
• ‘Baseline’ 4G efficiency (per sector) of 3.3bit/s/Hz in
2020, increasing to 3.7bit/s/Hz in 2034
• Increase by factor of 1.2 for 5G, and a further factor of
5.0 for 5G + mMIMO (3.0 if non-urban geotype)
• Various adjustments made, e.g. for maximum utilisation
of carriers, sector non-homogeneity and geotype-specific
adjustments
• Final spectral efficiencies vary significantly: 5G + mMIMO
(urban): 12.7bit/s/Hz in 2020 increasing to 16.1bit/s/Hz
in 2034. 4G (rural): 1.5/s/Hz in 2020 increasing to
1.7bit/s/Hz in 2034
MBB traffic • Traffic distributed by geotype according to the population
which is covered by the MBB network
• 12% MBB data traffic assumed to fall in MBB busy hour
(BH)
FWA traffic • MNO wins 5–20% of premises which have fixed
broadband (FBB) but are not covered by FTTH (and are
covered by the MBB network) in each geotype
• Total % of premises covered by FTTP is an input; these
premises are assigned to the most urban geotypes
• 10% of FWA data traffic assumed to fall in the FWA BH
(reduced from 12% MBB value, accounting for increased
spectral efficiency and lower ‘peaky-ness’ of FWA traffic)
• 80% reduction of FWA BH traffic to convert to MBB BH
Passive sharing can be switched on in model: passive costs associated with a
new site or site upgrade (site civils and acquisition, site strengthening and
backhaul) are halved (represents passive network sharing between two MNOs)

698248493-260
Spectrum
32
We use the same set of cell-radii assumptions for all markets, but we account for
market-specific variations such as the amount of 3.5GHz spectrum available
Methodology
Cell radii (km)1
• MNO spectrum holdings are calculated by dividing total spectrum in the
market by the number of MNOs
• We do not assume that any new spectrum bands (e.g. 6GHz) are made
available for serving MBB traffic during the modelling period. The resultant
(potential) under estimate of available capacity is offset by tempering our
long-term mobile traffic forecast
• An incremental roll-out of certain spectrum bands is assumed in the early
years of the model, but it is the long-term level of deployment (beyond the
target year of 2025) which is important for the cost
Band Total in
market
Long-term
deployment
Deployment technology
700MHz 2x30MHz All sites 5G
800MHz 2x30MHz All sites 4G
900MHz 2x30MHz All sites 3G, refarmed to 5G in 2025
1400MHz 80MHz 60% of sites 4G
1800MHz 2x75MHz All sites 4G, refarmed to 5G in 2025
2100MHz 2x60MHz All sites 3G, refarmed to 5G in 2025
2300MHz 80MHz 60% of sites 4G, refarmed to 5G in 2025
2600MHz FDD 2x70MHz 60% of sites 4G, refarmed to 5G in 2025
2600MHz TDD 50MHz 60% of sites 4G, refarmed to 5G in 2025
3500MHz Country
dependent
All urban and
suburban sites1
5G + mMIMO
Technology Geotype Mixed freq
with mMIMO
3.5GHz UL
and DL with
mMIMO
Small cell
(3.5GHz or
26GHz)
MBB Urban 0.4 0.6 0.1
Suburban 0.9 0.6 0.1
Rural 3.6 0.6 0.1
FWA Urban 1.6 N/A N/A
Suburban 3.6 N/A N/A
Rural 14.4 N/A N/A
• Our cell radii assumptions are designed to provide a coverage layer and
do not include the impact of subsequent additional infill cells for capacity
• FWA cell radii are assumed to be a factor of 4 greater than MBB cell radii
• Cell areas are calculated from cell radius using a ‘cell pi’ of 1.95. This is
the area of three tessellated regular hexagons inscribed by a circle of
radius 1 (i.e. the cell pi models a tri-sector cell)
• New macro cells with 3.5GHz UL and DL are used in specific locations
(large factories, ports, airports) have the same cell radius across geotypes
• Small cells are also used in specific locations and thus also have the
same call radius across geotypes
1 The resulting population coverage varies by country (with an average of c.50%). 2 Low-frequency MBB cell radii (1.2/2.3/7.0km
for urban/suburban/rural geotypes respectively) are also used, but only to calculate the distribution of sites by geotype. The
number of sites required to provide services outside of the existing MBB network is driven by the 3.5GHz cell radii

698248493-260
Assumption Source
Population-area curves Eurostat1 (see chart on the left)
Resulting geotypes Calculated from population-area
curves and geotype definitions
Population forecast
Premises forecast
Analysys Mason Research division
Number of MNOs
Mobile population penetration
Mobile data traffic per connection
% of connections that are 5G
5G-to-4G traffic usage ratio
Analysys Mason Research division
% of premises passed by FTTP
FWA data traffic per connection
FBB household penetration2
Analysys Mason Research division
Area of country (km2)
Household mobile coverage
European Commission,
Broadband Coverage in Europe 20193
3.5GHz spectrum forecast NRAs
Number of sites NRA site databases, Analysys Mason
project work. Sites per population of
known countries calculated and used
where data is not available
Population-area curves for European countries Assumptions/inputs for cost calculations
33
We vary a number of parameters by country: population-area curves, geotypes,
population/traffic forecasts, amount of 3.5GHz spectrum, number of existing sites
Methodology
0
5
10
15
20
25
30
35
40
45
50
55
60
65
70
75
80
85
90
95
100
0% 10% 20% 30% 40% 50% 60% 70% 80% 90% 100%
• Ten geotypes are defined in a consistent way
for all countries by travelling along the
population-area curve in ten steps of equal
length
• The first geotype typically has c.15% of the
population in less than 1% of the area, while
the last geotype typically has less than 2% of
the population in c.15% of the area
• The first (highest population-density) geotype
is defined as urban; subsequent geotypes are
classified according to population density
thresholds –urban (>1000 pop. per km2),
suburban (>300 pop. per km2) or rural
1 See https://ec.europa.eu/eurostat/web/nuts/local-administrative-units.
2 FWA connections as % of FBB connections based on data from Analysys Mason Research division
3 See https://digital-agenda-data.eu/
Model forecasts have been extended to 2040, where required. Where data is
not available for an individual country, the Central and Eastern Europe (CEE)
or Western Europe (WE) average has been used
698248493-260
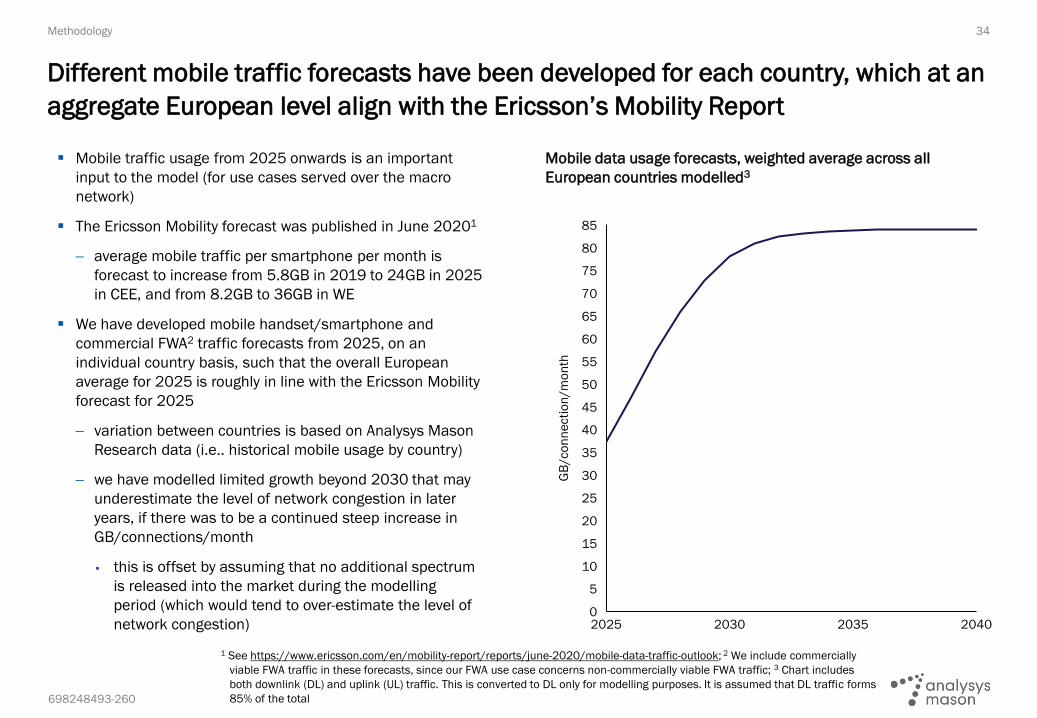
Mobile data usage forecasts, weighted average across all
European countries modelled3
34
Different mobile traffic forecasts have been developed for each country, which at an
aggregate European level align with the Ericsson’s Mobility Report
Methodology
35
2025 2030
10
30
2035
15
2040
5
0
20
25
40
45
50
55
60
65
70
75
80
85
GB
/co
nn
ecti
on
/m
on
th
▪ Mobile traffic usage from 2025 onwards is an important
input to the model (for use cases served over the macro
network)
▪ The Ericsson Mobility forecast was published in June 20201
− average mobile traffic per smartphone per month is
forecast to increase from 5.8GB in 2019 to 24GB in 2025
in CEE, and from 8.2GB to 36GB in WE
▪ We have developed mobile handset/smartphone and
commercial FWA2 traffic forecasts from 2025, on an
individual country basis, such that the overall European
average for 2025 is roughly in line with the Ericsson Mobility
forecast for 2025
− variation between countries is based on Analysys Mason
Research data (i.e.. historical mobile usage by country)
− we have modelled limited growth beyond 2030 that may
underestimate the level of network congestion in later
years, if there was to be a continued steep increase in
GB/connections/month
▪ this is offset by assuming that no additional spectrum
is released into the market during the modelling
period (which would tend to over-estimate the level of
network congestion)
1 See https://www.ericsson.com/en/mobility-report/reports/june-2020/mobile-data-traffic-outlook; 2 We include commercially
viable FWA traffic in these forecasts, since our FWA use case concerns non-commercially viable FWA traffic; 3 Chart includes
both downlink (DL) and uplink (UL) traffic. This is converted to DL only for modelling purposes. It is assumed that DL traffic forms
85% of the total
698248493-260
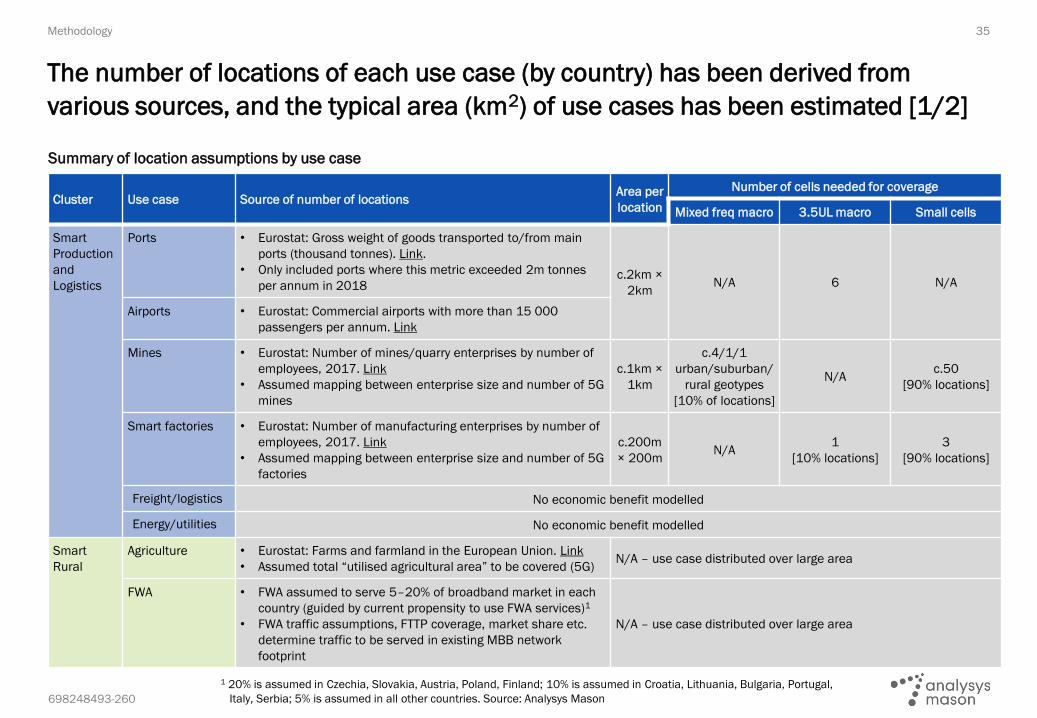
Cluster Use case Source of number of locationsArea per
location
Number of cells needed for coverage
Mixed freq macro 3.5UL macro Small cells
Smart
Production
and
Logistics
Ports • Eurostat: Gross weight of goods transported to/from main
ports (thousand tonnes). Link.
• Only included ports where this metric exceeded 2m tonnes
per annum in 2018c.2km ×
2kmN/A 6 N/A
Airports • Eurostat: Commercial airports with more than 15 000
passengers per annum. Link
Mines • Eurostat: Number of mines/quarry enterprises by number of
employees, 2017. Link
• Assumed mapping between enterprise size and number of 5G
mines
c.1km ×
1km
c.4/1/1
urban/suburban/
rural geotypes
[10% of locations]
N/Ac.50
[90% locations]
Smart factories • Eurostat: Number of manufacturing enterprises by number of
employees, 2017. Link
• Assumed mapping between enterprise size and number of 5G
factories
c.200m
× 200mN/A
1
[10% locations]
3
[90% locations]
Freight/logistics No economic benefit modelled
Energy/utilities No economic benefit modelled
Smart
Rural
Agriculture • Eurostat: Farms and farmland in the European Union. Link
• Assumed total “utilised agricultural area” to be covered (5G)N/A – use case distributed over large area
FWA • FWA assumed to serve 5–20% of broadband market in each
country (guided by current propensity to use FWA services)1
• FWA traffic assumptions, FTTP coverage, market share etc.
determine traffic to be served in existing MBB network
footprint
N/A – use case distributed over large area
Summary of location assumptions by use case
35
The number of locations of each use case (by country) has been derived from
various sources, and the typical area (km2) of use cases has been estimated [1/2]
Methodology
1 20% is assumed in Czechia, Slovakia, Austria, Poland, Finland; 10% is assumed in Croatia, Lithuania, Bulgaria, Portugal,
Italy, Serbia; 5% is assumed in all other countries. Source: Analysys Mason

698248493-260
Cluster Use case Source of number of locationsArea per
location
Number of cells needed for coverage
Mixed freq macro 3.5UL macro Small cells
Smart
Urban
Smart automotive • Number of traffic lights in cities >200 000 population
calculated for France, Germany and the UK (based on
previous Analysys Mason project work)
• This is used to estimate a value for RSUs per pop. (then
used for all countries)
N/A – RSU is a direct input (see left)
Urban hotspots
including public
transport
• All cities >200 000 population qualify for urban hotspots (1
per 20 000 population)
• Cities by population taken from Link
c.300m ×
300mN/A N/A 5
Stadiums • All stadiums with capacity over 10 000
• Data from worldstadiums.com. Link
c.200m ×
200mN/A N/A 3
Construction sites • Eurostat: Number of construction enterprises by number of
employees, 2017. Link
• Assumed mapping between enterprise size and number of
5G construction sites
c.200m ×
200m1 N/A N/A
Smart
Public
Services
Healthcare and
hospitals
• World Health Organisation (WHO). Link
• Total number of hospitals for most recent year available (up
to 2014)
c.400m ×
400mN/A N/A 9
Municipal
buildings
• Estimates based on previous Analysys Mason project work
(data extrapolated from data points for UK/France/Spain/
Italy)
c.50m ×
50mN/A N/A 1
Education No economic benefit modelled
Tourism No economic benefit modelled
Summary of location assumptions by use case
36
The number of locations of each use case (by country) has been derived from
various sources, and the typical area (km2) of use cases has been estimated [2/2]
Methodology
Source: Analysys Mason

698248493-260
GDP forecast: two-step process for calculating economic benefit of deploying 5G in a particular use case
37
Economic benefit is calculated by estimating (1) the GDP of the sector which is
connected to a particular use case, and (2) the uplift to sector GDP if 5G is deployed
Methodology
Note: GDP forecasts up to 2024 are from the IMF’s World Economic Outlook Database. As of June 2020, this GDP data takes
account of the impact of the COVID-19 pandemic on an individual country level. Beyond 2024, a growth rate has been
applied that is equal to the pre-COVID forecast CAGR between 2019 and 2024).
2020 2025 2030 2035 2040
EU
R m
n
GDP attributable to sector which would be affected
if 5G deployed in use case
Total GDP forecast, assuming 5G not deployed for use case
Uplifted GDP sector, if 5G is deployedCalculate the GDP
attributable to
sector which is
connected to a
particular use case
Uplift the relevant GDP sector
to reflect impact of 5G. Uplift
is phased in from target year,
and applies fully from 2030
2
1
In some cases an alternative process is used (FWA and urban hotspots), or no economic benefit is modelled (healthcare and hospitals,
smart automotive, and stadiums). See the following slide for details of each use case
A fixed uplift percentage is
assumed for 2030 onwards;
the uplift is phased in from the
target year (2025) to 2030.
The total benefit is calculated
as the NPV of the additional
GDP generated each year

698248493-260
Cluster Use case GDP of sector (as % of total GDP) Uplift of relevant GDP sector
Smart
Production
and
Logistics
Ports • Assumed to be 0.1% of GDP in all countries
• Informed by 2016 EC Report “Maritime transport in the EU”.
Link
3.0%
Airports • Assumed to be 0.2% of GDP in all countries
• Informed by statistic published by aviationbenefits.org. Link
3.0%
Mines • World Bank: coal + mineral rents as % of GDP. Link. Link.
• Varies by country; typically very small (<0.1%)
1.8%
Smart
factories
• Eurostat: GVA by sector (used as proxy for share of GDP). Link
• ‘Manufacturing’ sector, reduced by the estimated proportion of
manufacturing enterprises that are large enough and in an
appropriate sub-sector to be able to benefit from 5G
1.0%
Freight and
logistics
• N/A – No economic benefit modelled* No economic benefit modelled
Energy and
utilities
• N/A – No economic benefit modelled* No economic benefit modelled
Smart
Rural
Agriculture • Eurostat: GVA by sector (used as proxy for share of GDP). Link
• 80% of “Agriculture, forestry and fishing” sector; varies by
country
2.6%
FWA • N/A – Economic benefit modelled as overall GDP uplift • Modelled as overall GDP uplift of 1%, multiplied by % of total
premises with 5G FWA
• Informed by “Superfast Broadband Programme Evaluation.
Annex B: Economic Impacts”, Ipsos MORI technical paper
(2018). Link
Summary of economic benefits assumptions by use case
38
Our assumptions for GDP share and 5G-induced uplift have been developed based
on range of public sources [1 of 2]
Methodology
* Economic benefits are not modelled if there is limited 5G-specific economic benefit/the benefits are captured by existing targets. 1 As part of our analysis, we have read several other reports regarding the economic impact of 5G: “5G economic impact study
2019” (HIS Markit), “Mobile Economy 2020 APAC” (GSMA) and “Identification and quantification of key socio-economic data to
support strategic planning for the introduction of 5G in Europe” (EC)
Based on published reports which provide estimates
of sectoral GDP uplifts as a result of 5G in 2030.
We have drawn particularly on two reports: “5G
socio-economic impact in Switzerland” (Tech4i2,
2019 - Link) and “$1.4tn of benefits in 2030: 5G’s
impact on industry verticals” (STL Partners, 2019 -
Link). We have generally adopted values from the
first of these two reports, which has more
conservative estimates of GDP impact1
1 2
As above

698248493-260
Cluster Use case GDP of sector (as % of total GDP) Uplift of relevant GDP sector
Smart
Urban
Smart
automotive
• N/A – No economic benefit modelled*
• Economic benefit is not quantified for the smart automotive use case,
as we understand the benefit of NR C-V2X over LTE C-V2X to be
primarily related to additional safety. This benefit is captured as a
social benefit (see subsequent slide)
No economic benefit modelled
Urban hotspot
including
public
transport
• N/A – Economic benefit modelled as overall GDP uplift, including
impact of connected urban public transport
Modelled as overall GDP uplift of 1% × a reduction factor to
adjust for the number of people and time spent in hotspots
Stadiums • N/A – No economic benefit modelled*
• Economic benefit is not quantified for the stadiums use case, as we
understand the benefit of NR over LTE to be primarily related to
improved consumer experience. This benefit is captured as a social
benefit (see subsequent slide)
No economic benefit modelled
Construction
sites
• Eurostat: GVA by sector (used as proxy for share of GDP). Link
• “Construction” sector, reduced in accordance with 5G site mapping;
varies by country
2.4%
Smart
Public
Services
Healthcare
and hospitals
• N/A - No economic benefit modelled
• Economic benefit is not quantified for the healthcare and hospitals
use-case, as we understand the benefit of NR over LTE to be primarily
environmental and social (see later slides)
No economic benefit modelled
Municipal
buildings
• Eurostat: GVA by sector (used as proxy for share of GDP). Link
• 5% of “Public administration, defense, education, human health and
social work activities” sector; varies by country
1.0%
Education • N/A – No economic benefit modelled No economic benefit modelled
Tourism • N/A – No economic benefit modelled No economic benefit modelled
Summary of economic benefits assumptions by use case
39
Our assumptions for GDP share and 5G-induced uplift have been developed based
on range of public sources [2 of 2]
Methodology
* Economic benefits are not modelled if there is limited 5G-specific economic benefit/the benefits are captured by existing targets.
Source: Analysys Mason
Based on published reports which
provide estimates of sectoral GDP
uplifts as a result of 5G in 2030; see
previous slide for details
Conservative estimate, informed by
other similar sectors
1 2

698248493-260
▪ Nearly 80% of GHG emissions in Europe arise from fuel combustion
▪ The energy sector (generation of public electricity) and the transport sector are the largest contributors (c.27% and c.22% respectively)
Share of total GHG emissions in Europe, by sector Share of total GHG emissions in Europe, transport sector
40
Our environmental benefit assessment has been informed by data on greenhouse
gas (GHG) emissions in Europe by sector
1 Includes fuel combustion associated with fuel manufacture (e.g. petrol refinery); 2 Ozone depleting substances
Source: EEA GHG data viewer; see https://www.eea.europa.eu/data-and-maps/data/data-viewers/greenhouse-gases-viewer
Methodology
Public electricity generation
(fuel combustion) 1
Transport
(fuel combustion)
Agriculture
Manufacturing Industries and Construction
(fuel combustion)
Residential/Commercial/Agricultural
(fuel combustion)
Metal Industry
Product Uses as
Substitutes for ODS2
Mineral Industry
Chemical Industry 1.5%
Other
27.3%
21.9%
10.2%
15.0%
11.6%
2.6%
2.4%
1.7%
6.0%
Domestic Navigation 0.5%
Light duty trucks
Cars
International Aviation
Heavy duty trucks and buses
0.2%
Domestic Aviation
International Navigation
Railways
Motorcycles
12.6%
5.4%
3.7%
3.4%
2.5%
0.4%
0.2%

698248493-260
Studies relating to environmental and social impact of 5G used to inform our analysis
41
Our environmental and societal benefit assessments have also been informed by a
number of publicly available studies
Source
(date published)
Title Link
Huawei
(August 2020)
Green 5G: Building a
sustainable world
https://www.huawei.com/en/public-policy/green-5g-building-a-sustainable-world
World Economic
Forum
(January 2020)
The Impact of 5G: Creating
New Value across Industries
and Society
https://www.weforum.org/whitepapers/the-impact-of-5g-creating-new-value-across-industries-and-society
GSMA
(December 2018)
Study on Socio-economic
benefits of 5G services
provided in mmWave bands
https://www.gsma.com/spectrum/wp-content/uploads/2019/10/mmwave-5G-benefits.pdf
Vodafone
(February 2018)
Creating a Gigabit Society –
The Role of 5G
https://www.vodafone.com/content/dam/vodcom/files/public-policy/gigabit-society-5g-04042017.pdf
Centre for
Technology
Innovation
(December 2016)
Achieving sustainability in a 5G
world
https://www.brookings.edu/research/achieving-sustainability-in-a-5g-world/
European
Commission
(August 2016)
Identification and
quantification of key socio-
economic data to support
strategic planning for the
introduction of 5G in Europe
https://connectcentre.ie/wp-content/uploads/2016/10/EC-Study_5G-in-Europe.pdf
Source: Analysys Mason
Methodology
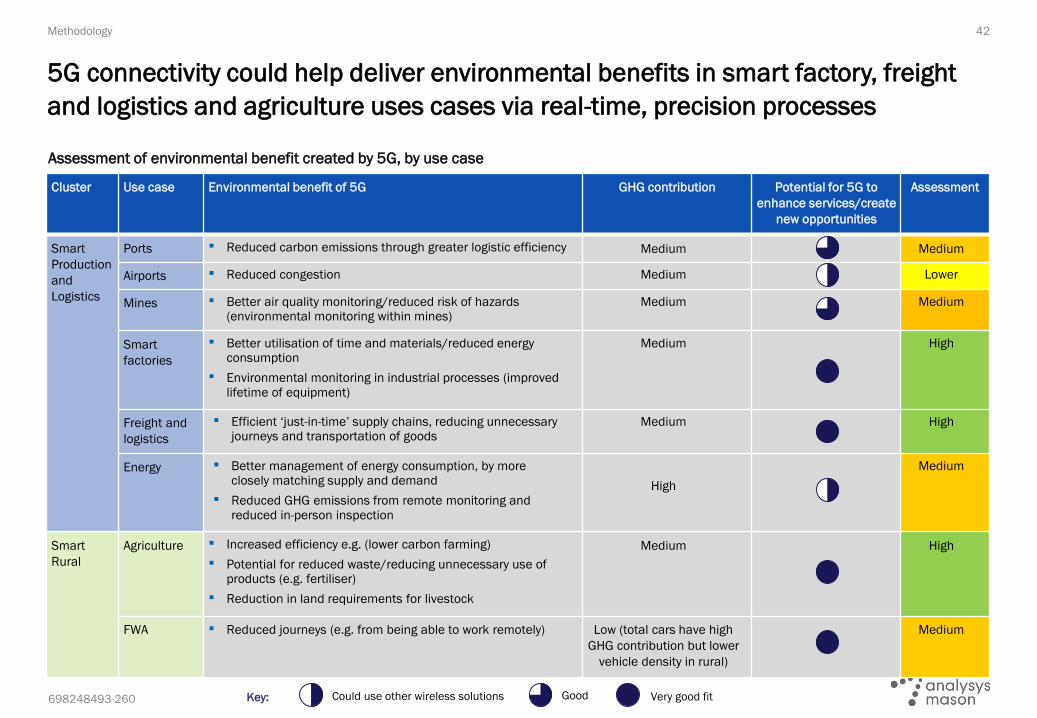
698248493-260
42
5G connectivity could help deliver environmental benefits in smart factory, freight
and logistics and agriculture uses cases via real-time, precision processes
Methodology
Cluster Use case Environmental benefit of 5G GHG contribution Potential for 5G to
enhance services/create
new opportunities
Assessment
Smart
Production
and
Logistics
Ports ▪ Reduced carbon emissions through greater logistic efficiency Medium Medium
Airports ▪ Reduced congestion Medium Lower
Mines ▪ Better air quality monitoring/reduced risk of hazards (environmental monitoring within mines)
Medium Medium
Smart
factories
▪ Better utilisation of time and materials/reduced energy consumption
▪ Environmental monitoring in industrial processes (improved lifetime of equipment)
Medium High
Freight and
logistics
▪ Efficient ‘just-in-time’ supply chains, reducing unnecessary journeys and transportation of goods
Medium High
Energy ▪ Better management of energy consumption, by more closely matching supply and demand
▪ Reduced GHG emissions from remote monitoring and reduced in-person inspection
High
Medium
Smart
Rural
Agriculture ▪ Increased efficiency e.g. (lower carbon farming)
▪ Potential for reduced waste/reducing unnecessary use of products (e.g. fertiliser)
▪ Reduction in land requirements for livestock
Medium High
FWA ▪ Reduced journeys (e.g. from being able to work remotely) Low (total cars have high
GHG contribution but lower
vehicle density in rural)
Medium
Assessment of environmental benefit created by 5G, by use case
GoodKey: Very good fitCould use other wireless solutions
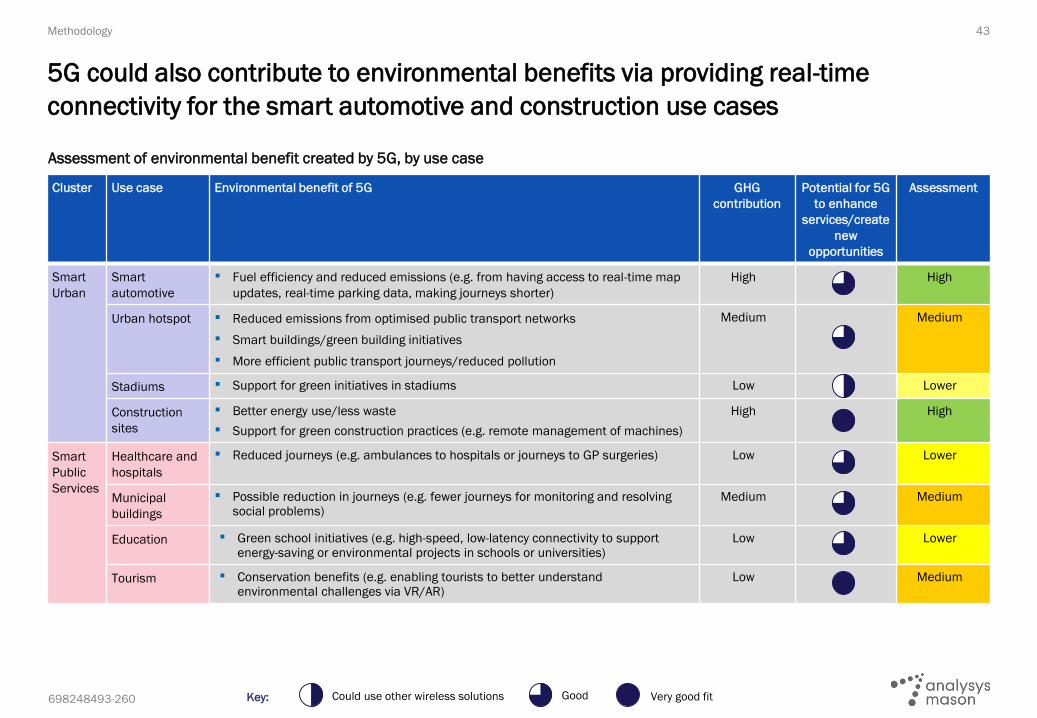
698248493-260
43
5G could also contribute to environmental benefits via providing real-time
connectivity for the smart automotive and construction use cases
Methodology
Cluster Use case Environmental benefit of 5G GHG
contribution
Potential for 5G
to enhance
services/create
new
opportunities
Assessment
Smart
Urban
Smart
automotive
▪ Fuel efficiency and reduced emissions (e.g. from having access to real-time map
updates, real-time parking data, making journeys shorter)
High High
Urban hotspot ▪ Reduced emissions from optimised public transport networks
▪ Smart buildings/green building initiatives
▪ More efficient public transport journeys/reduced pollution
Medium Medium
Stadiums ▪ Support for green initiatives in stadiums Low Lower
Construction
sites
▪ Better energy use/less waste
▪ Support for green construction practices (e.g. remote management of machines)
High High
Smart
Public
Services
Healthcare and
hospitals
▪ Reduced journeys (e.g. ambulances to hospitals or journeys to GP surgeries) Low Lower
Municipal
buildings
▪ Possible reduction in journeys (e.g. fewer journeys for monitoring and resolving social problems)
Medium Medium
Education ▪ Green school initiatives (e.g. high-speed, low-latency connectivity to support energy-saving or environmental projects in schools or universities)
Low Lower
Tourism ▪ Conservation benefits (e.g. enabling tourists to better understand environmental challenges via VR/AR)
Low Medium
Assessment of environmental benefit created by 5G, by use case
GoodKey: Very good fitCould use other wireless solutions

698248493-260
44
Our assessment is the highest societal benefit from 5G is potentially in the smart
production and logistics, and smart rural clusters
Methodology
Cluster Use case Social benefit Aligned
with EU
policy
goals
Potential for 5G to
enhance
services/create new
opportunities
Impact
assessment
Smart
Production
and
Logistics
Ports ▪ Increased security; technologically skilled workforce High
Airports ▪ Increased security/safety; less time spent waiting in airports
▪ Wellbeing (from increased security and enhanced passenger experience)
Lower
Mines ▪ Increased security; technologically skilled workforce Medium
Smart factories ▪ Increased security/safety; technologically skilled workforce High
Freight and logistics ▪ Increased safety Medium
Energy ▪ Encouraging good energy behaviour Medium
Smart
Rural
Agriculture ▪ Rural sustainability (support for local farmers in remote areas)
▪ Ability of farmers to market products beyond local area (e.g. using
e-commerce platforms)
High
FWA ▪ Increased social inclusion; reduced digital divide
▪ Could slow or even reverse the decline in populations living in rural
areas/contribute to maintaining rural communities. Ability for local
businesses to access wider markets for their products via e-commerce,
supporting rural sustainability
High
Social benefit assessment, by use case
GoodKey: Very good fitCould use other wireless solutions
Strong alignment with EU policy goals Good alignment Not highest EU priority

698248493-260
45
The smart urban and smart public service clusters will also benefit from 5G to
deliver societal benefits including safety, wellbeing, inclusion and education
Methodology
Cluster Use case Social benefit Aligned with
EU policy
goals
Potential for 5G
to enhance
services/create
new
opportunities
Impact
assessment
Smart
Urban
Smart automotive ▪ Safety related (e.g. reduction in accidents)
▪ Optimising driving patterns/reducing journey time (wellbeing benefit)
Medium
Urban hotspot,
including public
transport
▪ Wellbeing benefits for those living in cities: better access to e.g.
entertainment/e-commerce while travelling
▪ Lower journey times on public transport/increased safety/better information
Medium
Stadiums ▪ Enjoyment/experience (ability to replay live video, interact with the event, etc.)
▪ Additional viewing content (e.g. behind the scenes)
Lower
Construction sites ▪ Increased safety of building sites Medium
Smart
Public
Services
Healthcare and
hospitals
▪ High reliability remote consultation and triage
▪ Increase social inclusion and wellbeing; improved care
Medium
Municipal buildings ▪ Collaboration/interaction (e.g. social or business hubs) Medium
Education ▪ Increased availability and access to education, including remote learning in schools and universities
▪ Remote access to experts
Medium
Tourism ▪ Virtual walk-throughs of tourist sites/quality of experience
▪ Educational benefits
Medium
Social benefit assessment, by use case
GoodKey: Very good fitCould use other wireless solutions
Strong alignment with EU policy goals Good alignment Not highest EU priority
698248493-260
Contents Executive summary
Aims and scope of the study
Methodology
Results

698248493-260
47
5G upgrade cost, benefit and cost–benefit ratio (CBR), Europe
Clusters
As a total ‘open innovation platform’, full 5G networks in Europe can deliver over
EUR200 billion benefit, at c.EUR50 billion cost (4.5x ratio additional benefit vs cost)
20
0
40
200
60
140
80
100
120
160
180
220
EU
R b
n
Total innovation platform
46
208
8
5
4
0
5
10
100
0
50
150
200
Smart public
servicesE
UR
bn C
BR
Smart urban
4
Smart
production
33
Smart rural
4
22
212
90
18
73
Total cost/benefit of
EUR46 billion/208
billion corresponds to
c.EUR5.4/24.2 per
person per annum (over
15 years)
Costs (EURbn) RatioBenefits (EURbn)
The benefits and costs shown here are in addition to the benefits leveraged from the initial 5G eMBB network investments in Europe –
the benefits and costs shown here are for the expansion of 5G networks to ‘full 5G’ capability in accordance with our open innovation
platform concept
Results
Total innovation platform
Total CBR =
4.5x
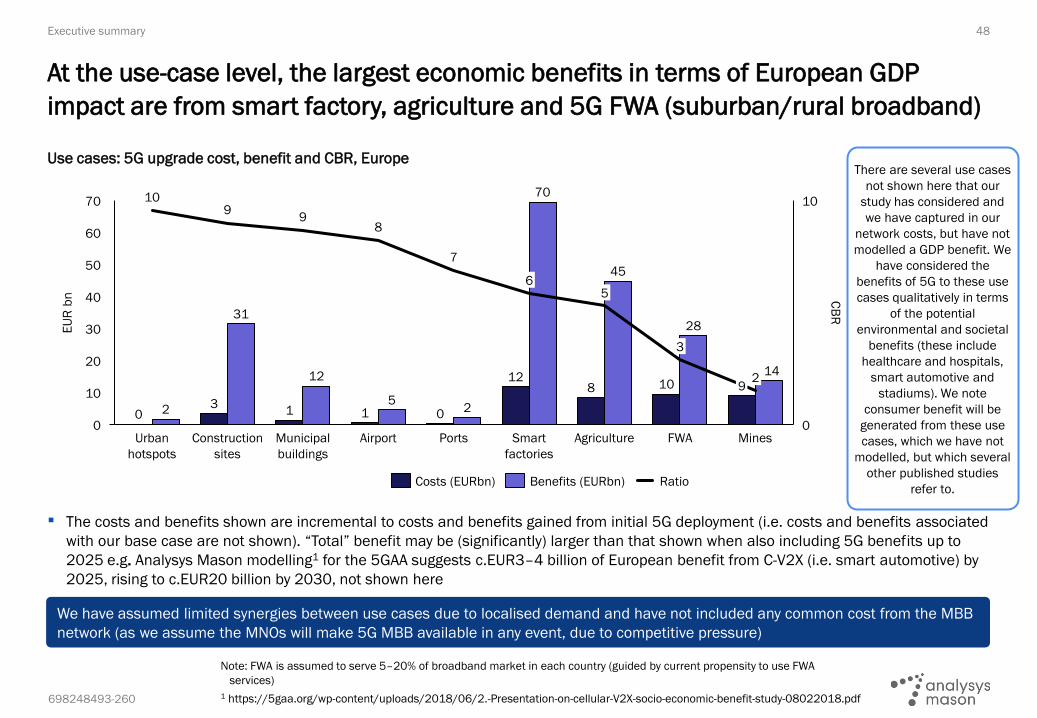
698248493-260
Use cases: 5G upgrade cost, benefit and CBR, Europe
▪ The costs and benefits shown are incremental to costs and benefits gained from initial 5G deployment (i.e. costs and benefits associated
with our base case are not shown). “Total” benefit may be (significantly) larger than that shown when also including 5G benefits up to
2025 e.g. Analysys Mason modelling1 for the 5GAA suggests c.EUR3–4 billion of European benefit from C-V2X (i.e. smart automotive) by
2025, rising to c.EUR20 billion by 2030, not shown here
48
At the use-case level, the largest economic benefits in terms of European GDP
impact are from smart factory, agriculture and 5G FWA (suburban/rural broadband)
Note: FWA is assumed to serve 5–20% of broadband market in each country (guided by current propensity to use FWA
services)
1 https://5gaa.org/wp-content/uploads/2018/06/2.-Presentation-on-cellular-V2X-socio-economic-benefit-study-08022018.pdf
109
98
7
10
0
50
60
70
0
40
10
30
20
8
2
Construction
sites
FWA
EU
R b
n
3
CB
R31
Urban
hotspots
Municipal
buildings
1
Airport Ports
10
6
Smart
factories
Mines
5
Agriculture
3
2
28
0 2 1
12
50
12
70
45
9
14
Costs (EURbn) Benefits (EURbn) Ratio
Executive summary
We have assumed limited synergies between use cases due to localised demand and have not included any common cost from the MBB
network (as we assume the MNOs will make 5G MBB available in any event, due to competitive pressure)
There are several use cases
not shown here that our
study has considered and
we have captured in our
network costs, but have not
modelled a GDP benefit. We
have considered the
benefits of 5G to these use
cases qualitatively in terms
of the potential
environmental and societal
benefits (these include
healthcare and hospitals,
smart automotive and
stadiums). We note
consumer benefit will be
generated from these use
cases, which we have not
modelled, but which several
other published studies
refer to.

698248493-260
▪ Many of the use cases we have considered as part of our
full 5G assessment are expected to be deployed and paid
for commercially in some environments (i.e. by MNOs on
a commercial basis, independently of any EU/government
targets)
▪ In other environments and for some types of deployment
where the business case is challenging, use cases that
are more likely to require public funding are shown in the
table on the left
– Estimated public funding needs are included in the
charts on the next slide
5G use case and whether public funding is needed
49
Many 5G use cases will be delivered by MNOs commercially: where investment is
challenging, public subsides can help reduce costs/deployment barriers
Executive summary
1 Commercially deployed FWA is assumed as part of initial 5G deployment,
but in the 5G FWA use case here we specifically consider additional
targeted investment (primarily non-commercial FWA deployments in
suburban or remote areas).
2 We assume that the agricultural use case would be delivered commercially
if the agricultural environment is within the coverage area of our modelled
MBB networks. However, we assume that public subsidy would be required
for agricultural environments outside the coverage area of our modelled
MBB networks.
3 The urban hotspots use case is assumed to include provision of
connectivity for public transport in urban areas (e.g. for provision of real
time passenger and other travel/tourist information). The public-transport
portion of the cost associated with this use case (estimated to be around
10%) would require public funding.
Source: Analysys Mason
Use case Requires public funding
Smart factories No
Mining No
Ports No
Airports No
Freight and logistics No
Energy and utilities No
FWA Yes1
Agriculture Partly2
Construction No
Urban hotspots including public
transport
Partly3
Stadiums No
Smart automotive Yes
Healthcare and hospitals Yes
Municipal buildings Yes
Education Yes
Tourism Yes

698248493-260
50
5G upgrade cost, benefit and CBR, Europe – including only those use cases likely to require public funding
Use cases requiring public funding
For the use cases where we identify public subsidy will be needed, we estimate that
over EUR50 billion of benefit can be delivered for less than EUR20 billion funding
Source: Analysys Mason
Executive summary
Clusters
5
0
10
0
35
20
15
5
25
430
40
45
0
2
6
EU
R b
n CB
R
Smart public
services
3
Smart rural Smart urban
2
15
12
40
1 0
10
9
30
15
0
5
10
0
20
25
2
4
6
8
10
3
EU
R b
n
2
CB
R
10
Urban
hotspots
Municipal
buildings
FWA Agriculture
28
0 01
12
5
13
Costs (EURbn) RatioBenefits (EURbn)
▪ Use cases requiring public funding for which we have modelled economic benefit (healthcare and hospitals, smart automotive) are not
included in the right-hand chart above
▪ it is noted, however, that government funding for 5G infrastructure to support healthcare and hospitals, and autonomous vehicles, will
be highly beneficial, based on previous studies
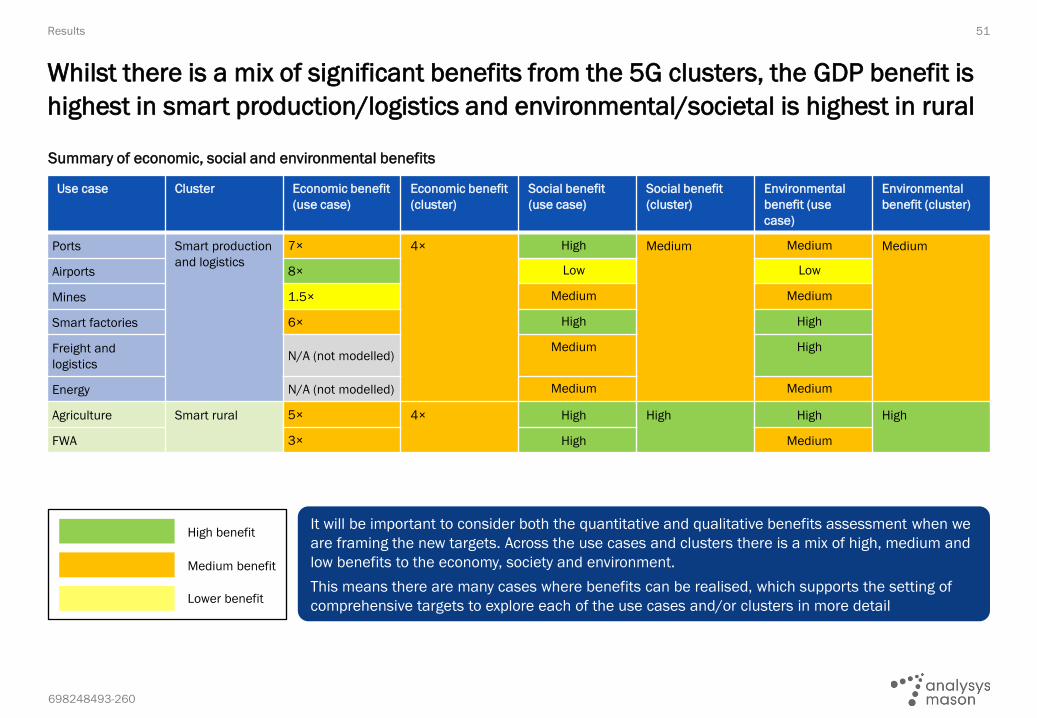
698248493-260
Use case Cluster Economic benefit
(use case)
Economic benefit
(cluster)
Social benefit
(use case)
Social benefit
(cluster)
Environmental
benefit (use
case)
Environmental
benefit (cluster)
Ports Smart production
and logistics
7× 4× High Medium Medium Medium
Airports 8× Low Low
Mines 1.5× Medium Medium
Smart factories 6× High High
Freight and
logisticsN/A (not modelled)
Medium High
Energy N/A (not modelled) Medium Medium
Agriculture Smart rural 5× 4× High High High High
FWA 3× High Medium
Summary of economic, social and environmental benefits
51
Whilst there is a mix of significant benefits from the 5G clusters, the GDP benefit is
highest in smart production/logistics and environmental/societal is highest in rural
Results
High benefit
Medium benefit
Lower benefit
It will be important to consider both the quantitative and qualitative benefits assessment when we
are framing the new targets. Across the use cases and clusters there is a mix of high, medium and
low benefits to the economy, society and environment.
This means there are many cases where benefits can be realised, which supports the setting of
comprehensive targets to explore each of the use cases and/or clusters in more detail

698248493-260
Use case Cluster Economic benefit
(use case)
Economic benefit
(cluster)
Social benefit
(use case)
Social benefit
(cluster)
Environmental
benefit (use
case)
Environmental
benefit (cluster)
Smart automotive Smart urban N/A (not modelled) 8× Medium Medium High High
Urban hotspot
including public
transport
10×
Medium Medium
Stadiums N/A (not modelled) Low Low
Construction sites 9× Medium High
Healthcare and
hospitals
Smart public
servicesN/A (not modelled)
5× Medium Medium Low Medium
Municipal buildings 8× Medium Medium
Education N/A (not modelled) Medium Low
Tourism N/A (not modelled) Medium Medium
Summary of economic, social and environmental benefits
52
There will also be significant environmental (carbon reduction) benefits from 5G
used for real-time connectivity for smart automotive, and in construction sites
Results
High benefit
Medium benefit
Lower benefit
It will be important to consider both the quantitative and qualitative benefits assessment when we
are framing the new targets. Across the use cases and clusters there is a mix of high, medium and
low benefits to the economy, society and environment.
This means there are many cases where benefits can be realised, which supports the setting of
comprehensive targets to explore each of the use cases and/or clusters in more detail

698248493-260
All countries ranked by benefit ratio: Smart Production
53
In the Smart Production cluster, smart factories are often the largest component of
the total benefit (e.g. in Ireland), though in some cases the mining sector is bigger
Results
Source: Analysys Mason
Country Costs (EUR mn) Benefits (EUR mn) Ratio
Bulgaria 473 1,363 2.9
Hungary 428 1,157 2.7
Romania 996 2,531 2.5
Slovenia 126 309 2.4
Spain 1,811 4,357 2.4
Italy 2,405 5,489 2.3
Greece 408 847 2.1
Slovakia 243 455 1.9
Malta 26 49 1.8
Lithuania 191 305 1.6
Norway 708 1,098 1.6
Estonia 141 188 1.3
Croatia 228 285 1.2
Portugal 832 840 1.0
Latvia 192 171 0.9
The cost of coverage for mines
and smart factories is much
higher than that for ports and
airports.
Smart factories are nearly
always the largest component
of the total benefit in the
Smart Production cluster
(although in a few cases the
mining sector is bigger).
Countries with a high CBR in
this cluster therefore generally
have a large manufacturing
sectoral GDP per smart factory
(as in the case of Ireland).
While we can account for country-specific differences using high-level modelling inputs (GDP per capita, sectoral GDP, sites, traffic, number of use-case location
etc.), specific dynamics in individual countries (e.g. level of digitisation in certain sectors of the economy) have not been captured. Modelling inputs have not been
available for all countries (in which case European averages have been used). Individual country results should therefore be treated with caution
Country Costs (EUR mn) Benefits (EUR mn) Ratio
Ireland 260 3,130 12.0
Switzerland 437 4,887 11.2
Germany 3,519 25,608 7.3
Denmark 256 1,782 7.0
Belgium 287 1,798 6.3
Austria 441 2,418 5.5
Netherlands 513 2,631 5.1
France 1,403 7,012 5.0
Finland 519 2,552 4.9
Sweden 529 2,516 4.8
UK 1,671 6,609 4.0
Poland 1,926 7,299 3.8
Czechia 707 2,284 3.2
Luxembourg 23 68 3.0
Cyprus 20 57 2.9
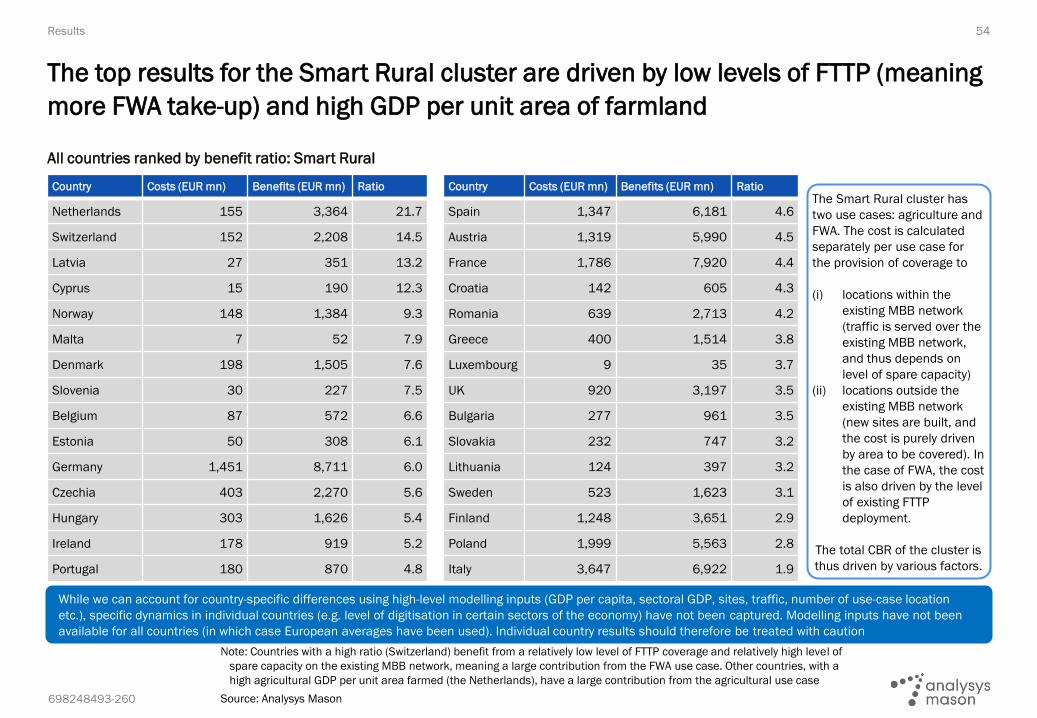
698248493-260
All countries ranked by benefit ratio: Smart Rural
54
The top results for the Smart Rural cluster are driven by low levels of FTTP (meaning
more FWA take-up) and high GDP per unit area of farmland
Results
Note: Countries with a high ratio (Switzerland) benefit from a relatively low level of FTTP coverage and relatively high level of
spare capacity on the existing MBB network, meaning a large contribution from the FWA use case. Other countries, with a
high agricultural GDP per unit area farmed (the Netherlands), have a large contribution from the agricultural use case
Source: Analysys Mason
Country Costs (EUR mn) Benefits (EUR mn) Ratio
Netherlands 155 3,364 21.7
Switzerland 152 2,208 14.5
Latvia 27 351 13.2
Cyprus 15 190 12.3
Norway 148 1,384 9.3
Malta 7 52 7.9
Denmark 198 1,505 7.6
Slovenia 30 227 7.5
Belgium 87 572 6.6
Estonia 50 308 6.1
Germany 1,451 8,711 6.0
Czechia 403 2,270 5.6
Hungary 303 1,626 5.4
Ireland 178 919 5.2
Portugal 180 870 4.8
Country Costs (EUR mn) Benefits (EUR mn) Ratio
Spain 1,347 6,181 4.6
Austria 1,319 5,990 4.5
France 1,786 7,920 4.4
Croatia 142 605 4.3
Romania 639 2,713 4.2
Greece 400 1,514 3.8
Luxembourg 9 35 3.7
UK 920 3,197 3.5
Bulgaria 277 961 3.5
Slovakia 232 747 3.2
Lithuania 124 397 3.2
Sweden 523 1,623 3.1
Finland 1,248 3,651 2.9
Poland 1,999 5,563 2.8
Italy 3,647 6,922 1.9
The Smart Rural cluster has
two use cases: agriculture and
FWA. The cost is calculated
separately per use case for
the provision of coverage to
(i) locations within the
existing MBB network
(traffic is served over the
existing MBB network,
and thus depends on
level of spare capacity)
(ii) locations outside the
existing MBB network
(new sites are built, and
the cost is purely driven
by area to be covered). In
the case of FWA, the cost
is also driven by the level
of existing FTTP
deployment.
The total CBR of the cluster is
thus driven by various factors.
While we can account for country-specific differences using high-level modelling inputs (GDP per capita, sectoral GDP, sites, traffic, number of use-case location
etc.), specific dynamics in individual countries (e.g. level of digitisation in certain sectors of the economy) have not been captured. Modelling inputs have not been
available for all countries (in which case European averages have been used). Individual country results should therefore be treated with caution

698248493-260
All countries ranked by benefit ratio: Smart Urban
55
In the Smart Urban cluster, construction sites form the largest cost and benefits
component: the cost of coverage is c.4× higher than that for smart automotive
Results
Source: Analysys Mason
Country Costs (EUR mn) Benefits (EUR mn) Ratio
Switzerland 74 2,751 37.4
UK 303 4,804 15.9
Denmark 80 978 12.2
Austria 133 1,594 12.0
Germany 668 7,821 11.7
Belgium 53 608 11.4
Netherlands 105 1,108 10.6
Norway 90 868 9.6
France 387 2,833 7.3
Cyprus 12 82 6.9
Latvia 22 152 6.9
Romania 208 1,400 6.7
Estonia 12 79 6.6
Luxembourg 31 180 5.7
Poland 305 1,507 4.9
Country Costs (EUR mn) Benefits (EUR mn) Ratio
Spain 340 1,584 4.7
Ireland 48 214 4.5
Finland 166 738 4.4
Portugal 72 298 4.1
Sweden 294 1,126 3.8
Hungary 70 254 3.6
Czechia 85 292 3.4
Malta 1 2 3.3
Slovenia 27 86 3.2
Greece 31 87 2.8
Croatia 65 178 2.7
Lithuania 77 187 2.4
Italy 409 951 2.3
Bulgaria 132 284 2.1
Slovakia 89 114 1.3
The aggregate benefit within the
Smart Urban cluster for a given
country is overwhelmingly derived
from construction sites (with no
economic benefit modelled for
smart automotive or stadiums,
and the benefit from urban
hotspots being much lower).
The construction use case
generally has the biggest impact
on the CBR of the Smart Urban
cluster.
Countries with a high ratio tend
to have a large construction
sectoral GDP (per construction
site), and spare capacity on the
MBB network (used to provide
coverage for construction sites).
While we can account for country-specific differences using high-level modelling inputs (GDP per capita, sectoral GDP, sites, traffic, number of use-case location
etc.), specific dynamics in individual countries (e.g. level of digitisation in certain sectors of the economy) have not been captured. Modelling inputs have not been
available for all countries (in which case European averages have been used). Individual country results should therefore be treated with caution
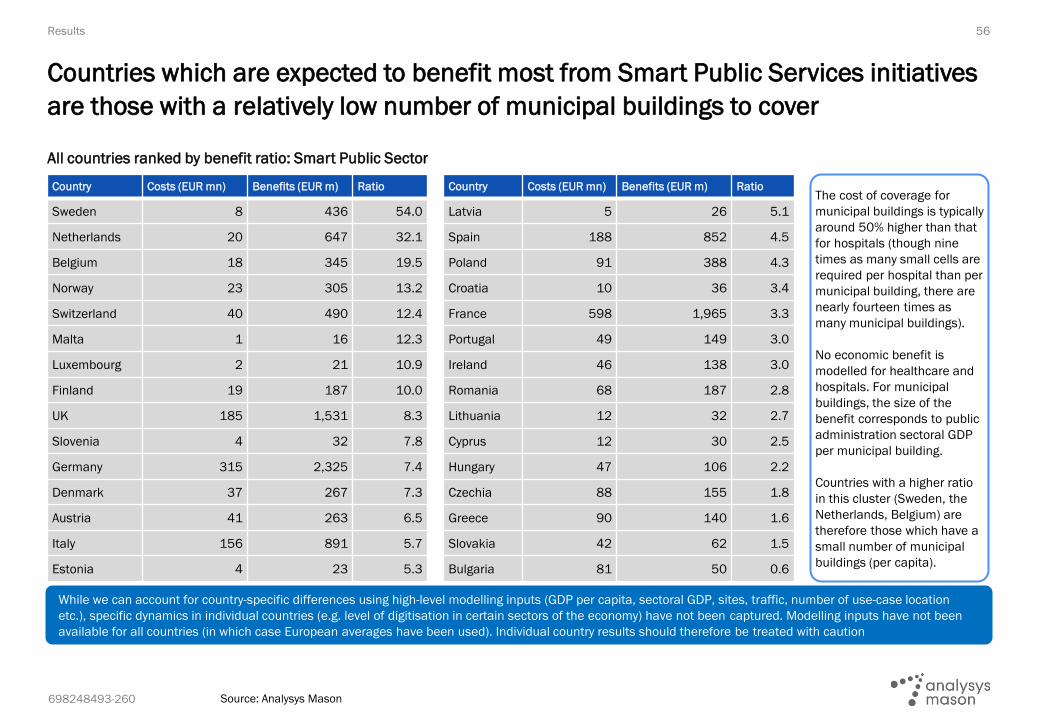
698248493-260
All countries ranked by benefit ratio: Smart Public Sector
56
Countries which are expected to benefit most from Smart Public Services initiatives
are those with a relatively low number of municipal buildings to cover
Results
Source: Analysys Mason
Country Costs (EUR mn) Benefits (EUR m) Ratio
Sweden 8 436 54.0
Netherlands 20 647 32.1
Belgium 18 345 19.5
Norway 23 305 13.2
Switzerland 40 490 12.4
Malta 1 16 12.3
Luxembourg 2 21 10.9
Finland 19 187 10.0
UK 185 1,531 8.3
Slovenia 4 32 7.8
Germany 315 2,325 7.4
Denmark 37 267 7.3
Austria 41 263 6.5
Italy 156 891 5.7
Estonia 4 23 5.3
Country Costs (EUR mn) Benefits (EUR m) Ratio
Latvia 5 26 5.1
Spain 188 852 4.5
Poland 91 388 4.3
Croatia 10 36 3.4
France 598 1,965 3.3
Portugal 49 149 3.0
Ireland 46 138 3.0
Romania 68 187 2.8
Lithuania 12 32 2.7
Cyprus 12 30 2.5
Hungary 47 106 2.2
Czechia 88 155 1.8
Greece 90 140 1.6
Slovakia 42 62 1.5
Bulgaria 81 50 0.6
The cost of coverage for
municipal buildings is typically
around 50% higher than that
for hospitals (though nine
times as many small cells are
required per hospital than per
municipal building, there are
nearly fourteen times as
many municipal buildings).
No economic benefit is
modelled for healthcare and
hospitals. For municipal
buildings, the size of the
benefit corresponds to public
administration sectoral GDP
per municipal building.
Countries with a higher ratio
in this cluster (Sweden, the
Netherlands, Belgium) are
therefore those which have a
small number of municipal
buildings (per capita).
While we can account for country-specific differences using high-level modelling inputs (GDP per capita, sectoral GDP, sites, traffic, number of use-case location
etc.), specific dynamics in individual countries (e.g. level of digitisation in certain sectors of the economy) have not been captured. Modelling inputs have not been
available for all countries (in which case European averages have been used). Individual country results should therefore be treated with caution
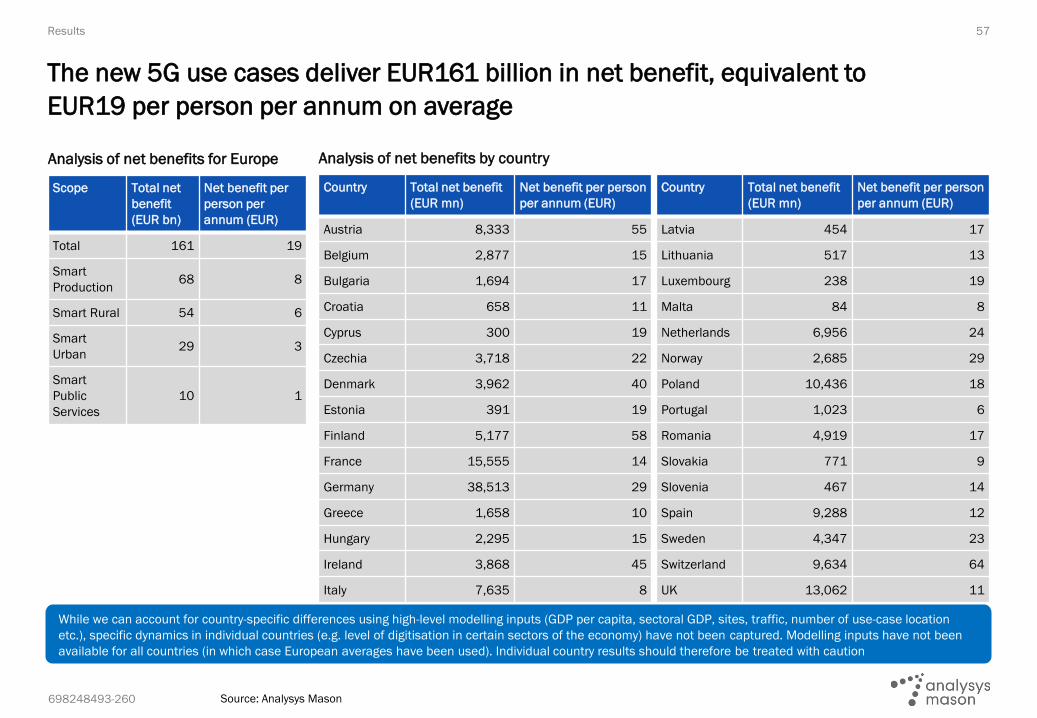
698248493-260
Analysis of net benefits by country
57
The new 5G use cases deliver EUR161 billion in net benefit, equivalent to
EUR19 per person per annum on average
Results
Source: Analysys Mason
While we can account for country-specific differences using high-level modelling inputs (GDP per capita, sectoral GDP, sites, traffic, number of use-case location
etc.), specific dynamics in individual countries (e.g. level of digitisation in certain sectors of the economy) have not been captured. Modelling inputs have not been
available for all countries (in which case European averages have been used). Individual country results should therefore be treated with caution
Country Total net benefit
(EUR mn)
Net benefit per person
per annum (EUR)
Austria 8,333 55
Belgium 2,877 15
Bulgaria 1,694 17
Croatia 658 11
Cyprus 300 19
Czechia 3,718 22
Denmark 3,962 40
Estonia 391 19
Finland 5,177 58
France 15,555 14
Germany 38,513 29
Greece 1,658 10
Hungary 2,295 15
Ireland 3,868 45
Italy 7,635 8
Country Total net benefit
(EUR mn)
Net benefit per person
per annum (EUR)
Latvia 454 17
Lithuania 517 13
Luxembourg 238 19
Malta 84 8
Netherlands 6,956 24
Norway 2,685 29
Poland 10,436 18
Portugal 1,023 6
Romania 4,919 17
Slovakia 771 9
Slovenia 467 14
Spain 9,288 12
Sweden 4,347 23
Switzerland 9,634 64
UK 13,062 11
Analysis of net benefits for Europe
Scope Total net
benefit
(EUR bn)
Net benefit per
person per
annum (EUR)
Total 161 19
Smart
Production68 8
Smart Rural 54 6
Smart
Urban29 3
Smart
Public
Services
10 1

698248493-260
▪ This document and the information contained herein are strictly private and confidential, and are solely for the use of
Ericsson and Qualcomm
▪ Copyright © 2020. Analysys Mason has produced the information contained herein for Ericsson and Qualcomm. The
ownership, use and disclosure of this information are subject to the Commercial Terms contained in the contract between
the respective parties
Confidentiality notice

Contact details
Janette Stewart
Principal
St Giles Court
24 Castle Street
Cambridge, CB3 0AJ
United Kingdom
Andrew Daly
Principal
Floor 3, 8 Exchange Quay
Manchester, M5 3EJ
United Kingdom
0)1223 460866
@AnalysysMason linkedin.com/company/analysys-mason youtube.com/AnalysysMason analysysmason.com/RSS
New Delhi
Tel: +91 124 4501860
Milan
Tel: +39 02 76 31 88 34
Manchester
Tel: +44 (0)161 877 7808
Cambridge
Tel: +44 (0)1223 460600
Dubai
Tel: +971 (0)4 446 7473
Dublin
Tel: +353 (0)1 602 4755
Lund
Tel: +46 73 614 15 97
Paris
Tel: +33 (0)1 72 71 96 96
Singapore
Tel: +65 6493 6038
Hong Kong
+852 9313 7552
London
Tel: +44 (0)20 7395 9000
Oslo
Tel: +47 920 49 000
Stockholm
Tel: +46 8 587 120 00
Kolkata
Tel: +91 33 4084 5700
New York
Tel: +1 212 944 5100
Madrid
Tel: +34 91 399 5016
Bonn