6. orr environmental monitoring program
TRANSCRIPT

ORR Environmental Monitoring Program 6-1
6. ORR Environmental Monitoring Program
In addition to environmental monitoring conducted at the three major Oak Ridge DOE installations,
reservation-wide environmental monitoring is performed to measure radiological and nonradiological parameters directly in environmental media adjacent to the facilities. Data from the ORR-wide environmental monitoring program are analyzed to assess the environmental impact of DOE operations on the entire reservation and the surrounding area. Dose assessment information based on data from this program is presented in Chapter 7.
6.1 Meteorological Monitoring Eight meteorological towers provide data on meteorological conditions and on the transport and
diffusion qualities of the atmosphere on the ORR. Data collected at the towers are used in routine dispersion modeling to predict impacts from facility operations and as input to emergency-response atmospheric models, which would be used in the event of accidental releases from a facility. Data from the towers are also used to support various research and engineering projects.
6.1.1 Description
The eight meteorological towers on the ORR are described in Table 6.1 and depicted in Fig. 6.1. The “MT” name format for the meteorological towers is used in this document; however, other commonly used names for the sites are provided in Table 6.1. Meteorological data are collected at different levels (2, 10, 15, 30, 33, 60, and 100 m above the ground) to assess the vertical structure of the atmosphere, particularly with respect to wind shear and stability. Stable boundary layers and significant wind shear zones (associated with the local ridge-and-valley terrain as well as the Great Valley; see Appendix C) can significantly affect the movement of a plume after a facility release (Bowen et al. 2000). Data are collected at the 10-m level at all towers except Towers MT3 and MT9, where data are collected at 15 and 33 m. Additionally, at selected towers, data are collected at the 30-, 33-, 60-, and 100-m levels. At each measurement level, temperature, wind speed, and wind direction are measured. Data needed to determine atmospheric stability (a measure of vertical mixing properties of the atmosphere) are measured at most towers. Barometric pressure is measured at one or more of the towers at each facility (MT1, MT2, MT7, and MT9). Precipitation is measured at MT6 and MT9 at the Y-12 Complex, at MT1 and MT7 at the East Tennessee Technology Park (ETTP), and at MT2 and MT4 (as of 2010) at Oak Ridge National Laboratory (ORNL). Solar radiation is measured at MT6 and MT9 at the Y-12 Complex, at MT1 and MT7 at the ETTP, and at MT2 at ORNL. Data are collected at 1-, 15-, and 60- min intervals. General quarterly calibrations of the instruments are managed by UT-Battelle and B&W Y-12.
In addition to the meteorological towers, sonic detection and ranging (SoDAR) devices are located at the east end of Y-12 and at Tower MT2 at ORNL. These devices use acoustic waves to estimate wind direction, wind speed, and turbulence at altitudes higher than the meteorological towers can measure (generally 100 to 500 m above ground level). Although the SODAR measurements are less accurate than the meteorological tower measurements, the SODARs provide useful information regarding stability, upper air wind conditions, and mixing height. (Mixing height is the height of the layer adjacent to the ground over which an emitted or entrained inert non-buoyant tracer will be mixed (by turbulence) within a time scale of about 1 h or less.)
Data are collected in real time at 15-min and hourly intervals for emergency-response purposes, such as for input to dispersion models. Data from the eight ORR meteorological towers are distributed to dispersion models at the ORNL and Y-12 Emergency Operations Centers.

Oak Ridge Reservation
6-2 ORR Environmental Monitoring Program
Annual dose estimates are calculated using the archived hourly data. Data quality is checked continuously against predetermined data constraints, and out-of-range parameters are marked invalid and are excluded from compliance modeling. Quality assurance records of data problems and errors are routinely kept for all eight tower sites.
Table 6.1. Oak Ridge Reservation meteorological towers
Tower Alternate
tower names Location lat., long.
Altitude (m MSL)a
Measurement heights
(m)
ETTP
MT1 “K,” 1208 35.93317N, 84.38833W 253 10, 60 MT7 “L,” 1209 35.92522N, 84.39414W 233 10, 30
ORNL
MT2 “C,” 1057 35.92559N, 84.32379W 261 10, 30, 100 MT3 “B,” 6555 35.93273N, 84.30254W 256 15, 30 MT4 “A,” 7571 35.92185N, 84.30470W 263 10, 30 MT10 “M,” 208A 35.90947N, 84.38796W 237 10
Y-12 Complex
MT6 “W,” West 35.98467N, 84.26550W 326 2, 10, 30, 60 MT9 “Y,” PSS Tower 35.98745N, 84.25363W 290 15, 33
aMean sea level.
Fig. 6.1. The ORR meteorological monitoring network (SoDAR: sonic detection and ranging wind profiler).

Annual Site Environmental Report
ORR Environmental Monitoring Program 6-3
6.1.2 Meteorological Impacts on Modeling Results
Prevailing winds are generally up-valley from the southwest and west-southwest or down-valley from the northeast and east-northeast. This pattern is the result of the channeling effect of the ridges flanking the ORR sites. Winds in the valleys tend to follow the ridge axes, with limited cross-ridge flow within local valley bottoms. These conditions are dominant over most of the ORR, with the exception of the ETTP, which is located in a relatively open valley bottom (resulting in slightly more varied flow).
On the ORR, low-speed winds dominate near the surface. This characteristic is typical of most near-surface measurements (as influenced by nearby ridges and mountains). Winds sometimes accelerate at ridgetop level, particularly when winds are not exactly parallel to the ridges (see Appendix C).
The atmosphere over the ORR is dominated by stable conditions on most nights and for a few hours just after sunrise. These conditions, when coupled with the low wind speeds and channeling effects of the valleys, result in poor dilution of material emitted from the facilities. However, high roughness values (caused by terrain and obstructions such as trees and buildings) may partially mitigate these factors through increased turbulence (atmospheric mixing). These features are captured in the data input to the dispersion models and are reflected in the modeling studies conducted for each facility.
Precipitation data from Tower MT2 are used in stream-flow modeling and in certain research efforts. The data indicate the variability of regional precipitation: the high winter rainfall resulting from frontal systems and the uneven, but occasionally intense, summer rainfall associated with thunderstorms. The total precipitation at Oak Ridge (town site) during 2009 (1,544 mm or 60.79 in.) was 17.6% above the long-term average of 1,313 mm (51.69 in.). This marks the first year of above-average precipitation since 2004.
The average data recovery rates (a measure of acceptable data) across locations used for modeling during 2009 were greater than 96.3% for ORNL sites (Towers MT2, MT3, MT4, and MT10); greater than 97.9% for ETTP sites (Towers MT1 and MT7); and 99.7% for Y-12 sites (Towers MT6 and MT9). Nearly all data recovery exceeded the required 90% per quarter recovery rate. Those that did not exceed the requirement (Tower A 10-m temperature for 2009 Quarters 1 and 2 and Tower C 100-m wind speed during 2009 Quarter 4) were corrected with accepted substitution data from nearby sites.
6.2 External Gamma Radiation Monitoring
6.2.1 Data Collection and Analysis
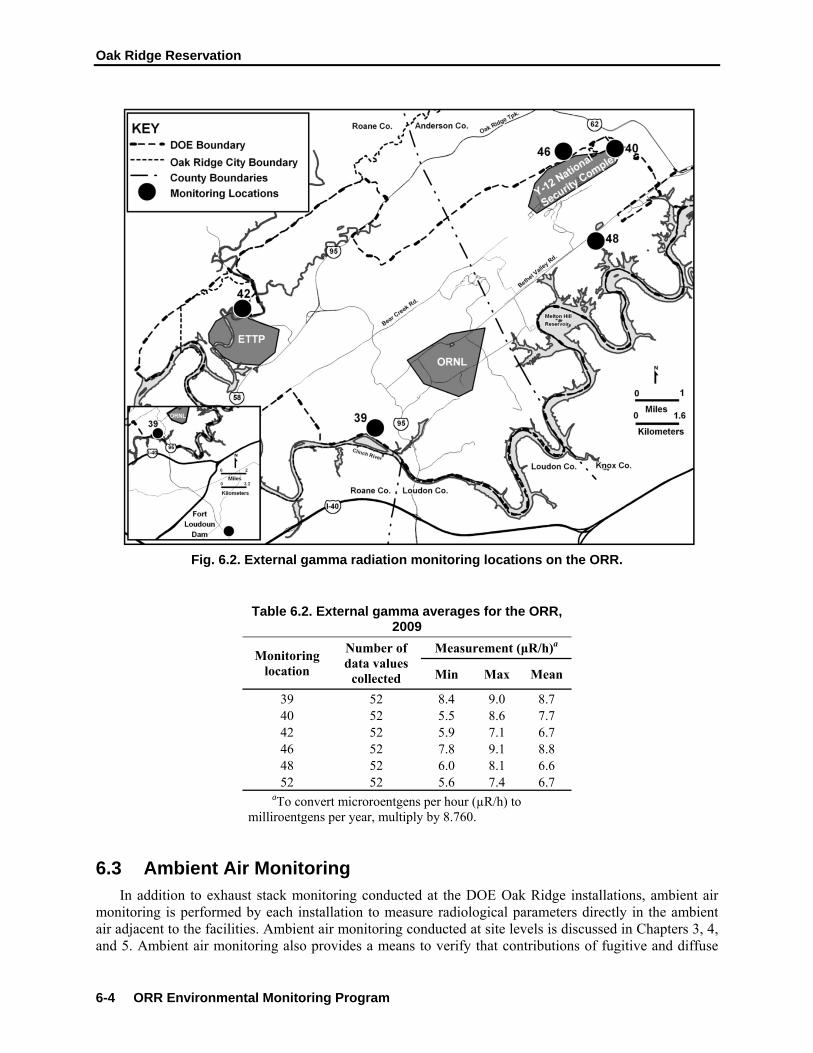
External gamma measurements (exposure rates) are recorded weekly at six ambient air stations from resident external gross gamma monitors (Fig. 6.2). Each consists of a dual-range, high-pressure ion chamber sensor and digital electronic count-rate meter and a totalizer. Totalizing consists of multiplying the count rate by the time of exposure to obtain total exposure.
6.2.2 Results
Table 6.2 summarizes the data collected at each station during the year. Values in this table have previously been presented as dose rates but this year are reported as exposure rates, in μR/h, to more accurately present actual measured values. The mean observed exposure rate for the reservation network for 2009 was 7.7 μR/h, and the average at the reference location was 6.7 μR/h. Exposure rates from background sources in Tennessee range from 2.9 to 11 μR/h. The average ORR exposure rate was within the range of normal background levels in Tennessee, indicating that activities on the ORR do not increase external gamma levels in the area above normal background levels.
Oak Ridge Reservation
6-4 ORR Environmental Monitoring Program
Fig. 6.2. External gamma radiation monitoring locations on the ORR.
Table 6.2. External gamma averages for the ORR, 2009
Monitoring location
Number of data values
collected
Measurement (μR/h)a
Min Max Mean
39 52 8.4 9.0 8.7 40 52 5.5 8.6 7.7 42 52 5.9 7.1 6.7 46 52 7.8 9.1 8.8 48 52 6.0 8.1 6.6 52 52 5.6 7.4 6.7
aTo convert microroentgens per hour (µR/h) to milliroentgens per year, multiply by 8.760.
6.3 Ambient Air Monitoring In addition to exhaust stack monitoring conducted at the DOE Oak Ridge installations, ambient air
monitoring is performed by each installation to measure radiological parameters directly in the ambient air adjacent to the facilities. Ambient air monitoring conducted at site levels is discussed in Chapters 3, 4, and 5. Ambient air monitoring also provides a means to verify that contributions of fugitive and diffuse

Annual Site Environmental Report
ORR Environmental Monitoring Program 6-5
sources are insignificant, serves as a check on dose-modeling calculations, and would allow determination of contaminant levels at monitoring locations in the event of an emergency.
An ORR ambient air monitoring program is also conducted as a complement to the individual site programs and for purposes of assessing the impacts of ORR operations on an integrated basis. This program is discussed in detail in the following sections.
6.3.1 ORR Ambient Air Monitoring
The objectives of the ORR ambient air monitoring program are to perform surveillance of airborne radionuclides at the reservation perimeter and to collect reference data from a location not affected by activities on the ORR. The ORR perimeter air monitoring network includes stations 35, 37, 38, 39, 40, 42, 46, and 48 (Fig. 6.3). Reference samples are collected from Station 52 (Fort Loudoun Dam). Sampling was conducted at each ORR station during 2009 to quantify levels of alpha-, beta-, and gamma-emitting radionuclides.
Fig. 6.3. Locations of ORR perimeter air monitoring stations. Atmospheric dispersion modeling was used to select appropriate sampling locations. The locations
selected are those likely to be affected most by releases from the Oak Ridge facilities. Therefore, in the event of a release, no residence or business in the vicinity of the ORR should receive a radiation dose greater than doses calculated at the sampled locations.
The sampling system consists of two separate instruments. Particulates are captured on glass-fiber filters using high-volume air samplers. The filters are collected weekly, composited quarterly, and then submitted to an analytical laboratory to quantify gross alpha and beta activity and to determine concentrations of specific isotope of interest on the ORR. The second system is designed to collect tritiated water vapor. The sampler consists of a prefilter followed by an adsorbent trap consisting of

Oak Ridge Reservation
6-6 ORR Environmental Monitoring Program
indicating silica gel. The samples are collected weekly or biweekly, composited quarterly, and then submitted to an analytical laboratory for 3H analysis.
6.3.2 Results
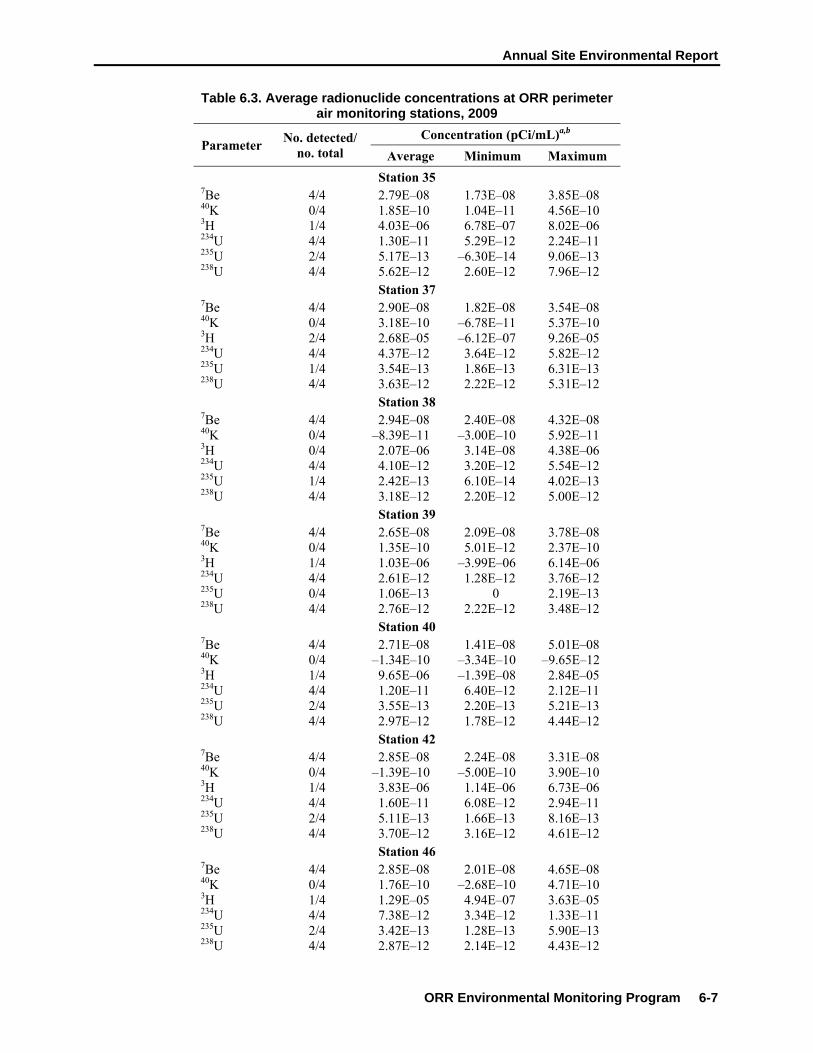
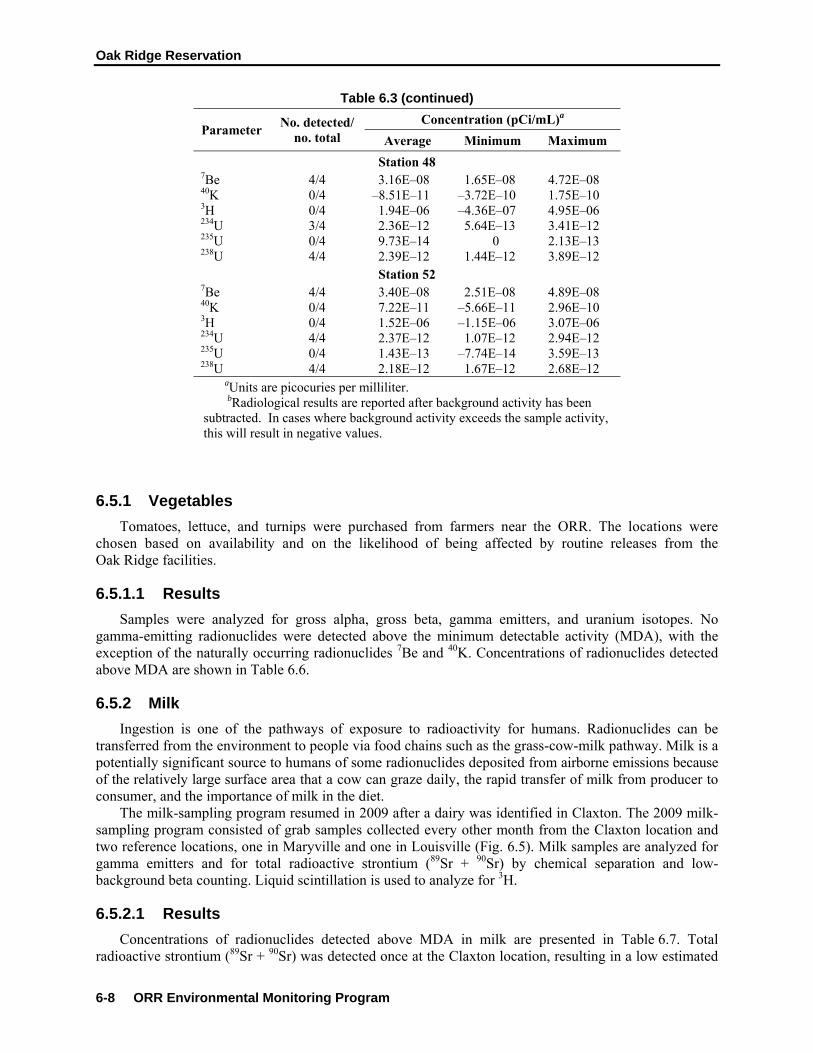
Data from the ORR ambient air stations are analyzed to assess the impact of DOE operations on the local air quality. Each measured radionuclide concentration is compared with the appropriate derived concentration guide (DCG). DCGs serve as standard reference values for conducting environmental protection programs at DOE sites. All radionuclide concentrations measured at the ORR ambient air stations during 2009 were less than 1% of applicable DCGs, indicating that activities on the reservation are not adversely affecting local air quality. Statistical significance testing is also performed to compare average radionuclide concentrations measured at ORR ambient air stations with concentrations measured at the reference location. This test reflects the mathematical probability of certain outcomes but is not an indication of environmental significance. There were no calculated statistical differences in average concentrations of 7Be or 40K. The concentrations of 3H, 234U, 235U, and 238U at the ORR ambient air stations were slightly higher than those observed at the background location at the 95% confidence level. A summary of radionuclide concentrations measured at the ambient air stations is presented in Table 6.3. Table 6.4 represents the average concentration of three isotopes of uranium at each station for the sampling years 2005 through 2009.
6.4 Surface Water Monitoring
6.4.1 ORR Surface Water Monitoring
The ORR surface water monitoring program consists of sample collection and analysis from five locations on the Clinch River, including public water intakes (Fig. 6.4). This program is conducted in conjunction with site-specific surface water monitoring activities to enable an assessment of the impacts of past and current DOE operations on the quality of local surface water.
Grab samples are collected quarterly at all five locations and are analyzed for general water quality parameters, screened for radioactivity, and analyzed for mercury and specific radionuclides when appropriate. Table 6.5 lists the specific locations and associated sampling frequencies and parameters.
The sampling locations are classified by the state of Tennessee for recreation and domestic use. Tennessee water quality criteria associated with these classifications are used as references where applicable (TDEC 2008). The Tennessee water quality criteria do not include criteria for radionuclides. Four percent of the DOE DCG is used for radionuclide comparison because this value is roughly equivalent to the 4-mrem dose limit from ingestion of drinking water on which the U.S. Environmental Protection Agency radionuclide drinking water standards are based.
6.4.2 Results
Comparison of 2009 surface water sample results from locations upstream of DOE inputs with results from surface water samples obtained downstream of DOE inputs shows no statistically significant difference for any of the radionuclides; none of the radionuclides at any location were detected above 4% of the respective DCG or the 4-mrem dose limit, which is the maximum contaminant limit (MCL) for beta and photon emitters in community drinking water systems (Code of Federal Regulations: Title 40: Protection of the Environment, 40 CFR 141.66, December 2005).
6.5 Food Vegetation samples are collected from areas that could be affected by activities on the reservation.
Analysis of the samples enables the evaluation of potential radiation doses received by people who consume local food crops. Food crop monitoring data are also used to monitor trends in environmental contamination and possible long-term accumulation of radionuclides.
Annual Site Environmental Report
ORR Environmental Monitoring Program 6-7
Table 6.3. Average radionuclide concentrations at ORR perimeter air monitoring stations, 2009
Parameter No. detected/
no. total Concentration (pCi/mL)a,b
Average Minimum Maximum
Station 35 7Be 4/4 2.79E–08 1.73E–08 3.85E–08 40K 0/4 1.85E–10 1.04E–11 4.56E–10 3H 1/4 4.03E–06 6.78E–07 8.02E–06 234U 4/4 1.30E–11 5.29E–12 2.24E–11 235U 2/4 5.17E–13 –6.30E–14 9.06E–13 238U 4/4 5.62E–12 2.60E–12 7.96E–12
Station 37 7Be 4/4 2.90E–08 1.82E–08 3.54E–08 40K 0/4 3.18E–10 –6.78E–11 5.37E–10 3H 2/4 2.68E–05 –6.12E–07 9.26E–05 234U 4/4 4.37E–12 3.64E–12 5.82E–12 235U 1/4 3.54E–13 1.86E–13 6.31E–13 238U 4/4 3.63E–12 2.22E–12 5.31E–12
Station 38 7Be 4/4 2.94E–08 2.40E–08 4.32E–08 40K 0/4 –8.39E–11 –3.00E–10 5.92E–11 3H 0/4 2.07E–06 3.14E–08 4.38E–06 234U 4/4 4.10E–12 3.20E–12 5.54E–12 235U 1/4 2.42E–13 6.10E–14 4.02E–13 238U 4/4 3.18E–12 2.20E–12 5.00E–12
Station 39 7Be 4/4 2.65E–08 2.09E–08 3.78E–08 40K 0/4 1.35E–10 5.01E–12 2.37E–10 3H 1/4 1.03E–06 –3.99E–06 6.14E–06 234U 4/4 2.61E–12 1.28E–12 3.76E–12 235U 0/4 1.06E–13 0 2.19E–13 238U 4/4 2.76E–12 2.22E–12 3.48E–12
Station 40 7Be 4/4 2.71E–08 1.41E–08 5.01E–08 40K 0/4 –1.34E–10 –3.34E–10 –9.65E–12 3H 1/4 9.65E–06 –1.39E–08 2.84E–05 234U 4/4 1.20E–11 6.40E–12 2.12E–11 235U 2/4 3.55E–13 2.20E–13 5.21E–13 238U 4/4 2.97E–12 1.78E–12 4.44E–12
Station 42 7Be 4/4 2.85E–08 2.24E–08 3.31E–08 40K 0/4 –1.39E–10 –5.00E–10 3.90E–10 3H 1/4 3.83E–06 1.14E–06 6.73E–06 234U 4/4 1.60E–11 6.08E–12 2.94E–11 235U 2/4 5.11E–13 1.66E–13 8.16E–13 238U 4/4 3.70E–12 3.16E–12 4.61E–12
Station 46 7Be 4/4 2.85E–08 2.01E–08 4.65E–08 40K 0/4 1.76E–10 –2.68E–10 4.71E–10 3H 1/4 1.29E–05 4.94E–07 3.63E–05 234U 4/4 7.38E–12 3.34E–12 1.33E–11 235U 2/4 3.42E–13 1.28E–13 5.90E–13 238U 4/4 2.87E–12 2.14E–12 4.43E–12
Oak Ridge Reservation
6-8 ORR Environmental Monitoring Program
Table 6.3 (continued)
Parameter No. detected/
no. total Concentration (pCi/mL)a
Average Minimum Maximum
Station 48 7Be 4/4 3.16E–08 1.65E–08 4.72E–08 40K 0/4 –8.51E–11 –3.72E–10 1.75E–10 3H 0/4 1.94E–06 –4.36E–07 4.95E–06 234U 3/4 2.36E–12 5.64E–13 3.41E–12 235U 0/4 9.73E–14 0 2.13E–13 238U 4/4 2.39E–12 1.44E–12 3.89E–12
Station 52 7Be 4/4 3.40E–08 2.51E–08 4.89E–08 40K 0/4 7.22E–11 –5.66E–11 2.96E–10 3H 0/4 1.52E–06 –1.15E–06 3.07E–06 234U 4/4 2.37E–12 1.07E–12 2.94E–12 235U 0/4 1.43E–13 –7.74E–14 3.59E–13 238U 4/4 2.18E–12 1.67E–12 2.68E–12
aUnits are picocuries per milliliter. bRadiological results are reported after background activity has been
subtracted. In cases where background activity exceeds the sample activity, this will result in negative values.
6.5.1 Vegetables
Tomatoes, lettuce, and turnips were purchased from farmers near the ORR. The locations were chosen based on availability and on the likelihood of being affected by routine releases from the Oak Ridge facilities.
6.5.1.1 Results
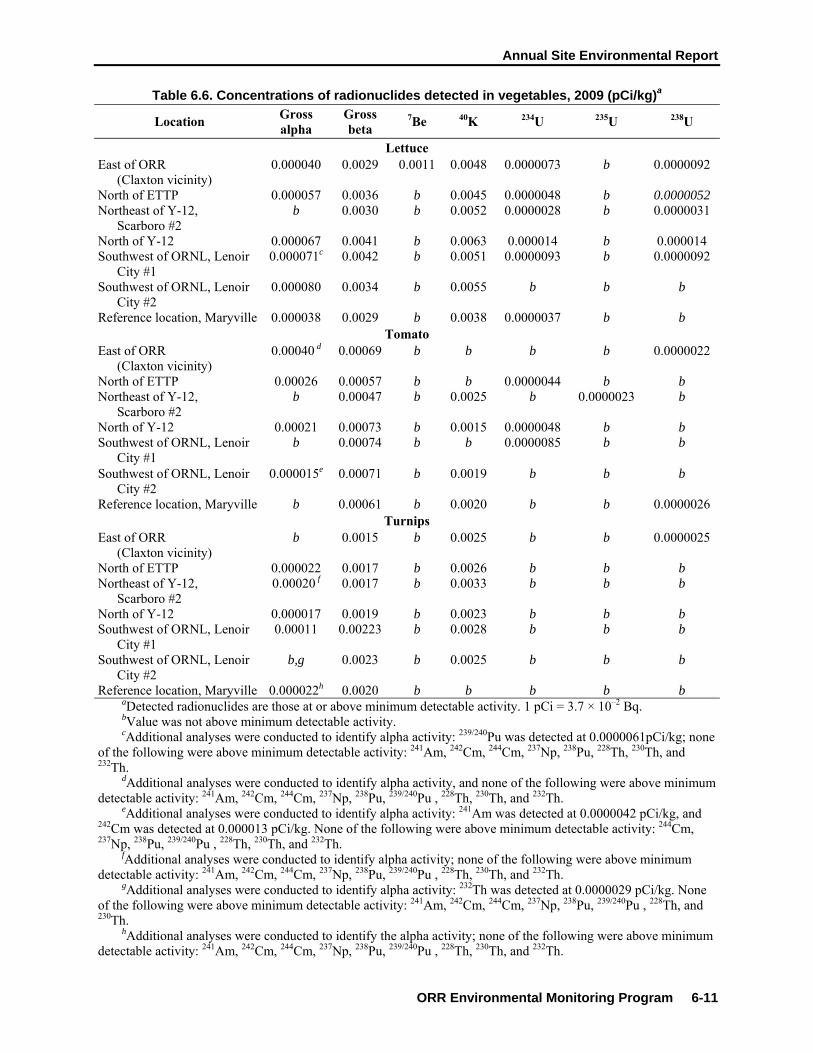
Samples were analyzed for gross alpha, gross beta, gamma emitters, and uranium isotopes. No gamma-emitting radionuclides were detected above the minimum detectable activity (MDA), with the exception of the naturally occurring radionuclides 7Be and 40K. Concentrations of radionuclides detected above MDA are shown in Table 6.6.
6.5.2 Milk
Ingestion is one of the pathways of exposure to radioactivity for humans. Radionuclides can be transferred from the environment to people via food chains such as the grass-cow-milk pathway. Milk is a potentially significant source to humans of some radionuclides deposited from airborne emissions because of the relatively large surface area that a cow can graze daily, the rapid transfer of milk from producer to consumer, and the importance of milk in the diet.
The milk-sampling program resumed in 2009 after a dairy was identified in Claxton. The 2009 milk-sampling program consisted of grab samples collected every other month from the Claxton location and two reference locations, one in Maryville and one in Louisville (Fig. 6.5). Milk samples are analyzed for gamma emitters and for total radioactive strontium (89Sr + 90Sr) by chemical separation and low-background beta counting. Liquid scintillation is used to analyze for 3H.
6.5.2.1 Results
Concentrations of radionuclides detected above MDA in milk are presented in Table 6.7. Total radioactive strontium (89Sr + 90Sr) was detected once at the Claxton location, resulting in a low estimated

Annual Site Environmental Report
ORR Environmental Monitoring Program 6-9
dose. Each of the sampled locations is remote from the DOE facilities and very unlikely to be impacted by DOE activities.
Table 6.4. Uranium concentrations in ambient air on the ORR
Isotope Concentration (pCi/mL)a
2005 2006 2007 2008 2009
Station 35 234U 1.24E–11 1.43E–11 1.28E–11 6.58E–12 1.30E–11 235U 1.10E–12 1.09E–12 6.88E–13 3.85E–13 5.17E–13 238U 2.16E–11 1.94E–11 1.87E–11 8.29E–12 5.62E–12
Station 37 234U 8.01E–12 4.52E–12 6.02E–12 3.81E–12 4.37E–12 235U 9.22E–13 5.83E–13 5.09E–13 3.37E–13 3.54E–13 238U 1.01E–11 6.84E–12 1.28E–11 4.34E–12 3.63E–12
Station 38 234U 6.21E–12 5.69E–12 6.93E–12 3.5E–12 4.10E–12 235U 5.72E–13 4.72E–13 4.74E–13 4.38E–13 2.42E–13 238U 7.50E–12 8.28E–12 1.41E–11 3.57E–12 3.18E–12
Station 39 234U 4.58E–12 4.46E–12 4.05E–12 2.76E–12 2.61E–12 235U 5.74E–13 4.08E–13 3.86E–13 1.66E–13 1.06E–13 238U 4.40E–12 4.51E–12 4.44E–12 2.88E–12 2.76E–12
Station 40 234U 2.85E–11 2.07E–11 2.25E–11 1.68E–11 1.20E–11 235U 1.43E–12 1.22E–12 1.01E–12 9.24E–13 3.55E–13 238U 8.73E–12 6.65E–12 1.15E–11 5.79E–12 2.97E–12
Station 42 234U 7.51E–12 1.01E–11 6.57E–12 4.25E–12 1.60E–11 235U 4.58E–13 3.55E–13 4.66E–13 4.13E–13 5.11E–13 238U 1.03E–11 9.68E–12 1.18E–11 3.72E–12 3.70E–12
Station 46 234U 1.82E–11 1.07E–11 1.12E–11 9.39E–12 7.38E–12 235U 1.10E–12 4.14E–13 7.18E–13 5.68E–13 3.42E–13 238U 1.04E–11 7.01E–12 1.24E–11 6.35E–12 2.87E–12
Station 48 234U 7.63E–12 5.50E–12 7.84E–12 4.08E–12 2.36E–12 235U 5.01E–13 2.49E–13 5.53E–13 2.7E–13 9.73E–14 238U 6.60E–12 4.15E–12 9.84E–12 3.6E–12 2.39E–12
Station 52 234U 5.03E–12 3.52E–12 3.74E–12 2.86E–12 2.37E–12 235U 5.31E–12 –6.54E–14 7.20E–14 3.2E–13 1.43E–13 238U 3.95E–12 3.69E–12 3.94E–12 2.4E–12 2.18E–12 a1 pCi = 3.7 × 10⁻² Bq.

Oak Ridge Reservation
6-10 ORR Environmental Monitoring Program
Fig. 6.4. ORR surface water surveillance sampling locations.
Table 6.5. ORR surface water sampling locations, frequencies, and parameters, 2009
Locationa Description Frequency Parameters
CRK 16 Clinch River downstream from all DOE ORR inputs
Quarterly Mercury, gross alpha, gross beta, gamma scan, 3H, field measurementsb
CRK 23 Water supply intake for the ETTP Quarterly Mercury, gross alpha, gross beta, gamma scan, 3H, field measurementsb
CRK 32 Clinch River downstream from ORNL Quarterly Gross alpha, gross beta, gamma scan, total radioactive strontium, 3H, field measurementsb
CRK 58 Water supply intake for Knox County Quarterly Gross alpha, gross beta, gamma scan, 3H, field measurementsb
CRK 66 Melton Hill Reservoir above city of Oak Ridge water intake
Quarterly Mercury, gross alpha, gross beta, gamma scan, total radioactive strontium, 3H, field measurementsb
aLocations indicate bodies of water and distances (e.g., Clinch River kilometer [CRK] 16 = 16 km upstream from the confluence of the Clinch River with the Tennessee River, Watts Bar Reservoir).
bField measurements consist of dissolved oxygen, pH, and temperature.
Annual Site Environmental Report
ORR Environmental Monitoring Program 6-11
Table 6.6. Concentrations of radionuclides detected in vegetables, 2009 (pCi/kg)a
Location Gross alpha
Gross beta
7Be 40K 234U 235U 238U
Lettuce East of ORR
(Claxton vicinity) 0.000040 0.0029 0.0011 0.0048 0.0000073 b 0.0000092
North of ETTP 0.000057 0.0036 b 0.0045 0.0000048 b 0.0000052 Northeast of Y-12,
Scarboro #2 b 0.0030 b 0.0052 0.0000028 b 0.0000031
North of Y-12 0.000067 0.0041 b 0.0063 0.000014 b 0.000014 Southwest of ORNL, Lenoir
City #1 0.000071c 0.0042 b 0.0051 0.0000093 b 0.0000092
Southwest of ORNL, Lenoir City #2
0.000080 0.0034 b 0.0055 b b b
Reference location, Maryville 0.000038 0.0029 b 0.0038 0.0000037 b b Tomato
East of ORR (Claxton vicinity)
0.00040 d 0.00069 b b b b 0.0000022
North of ETTP 0.00026 0.00057 b b 0.0000044 b b Northeast of Y-12,
Scarboro #2 b 0.00047 b 0.0025 b 0.0000023 b
North of Y-12 0.00021 0.00073 b 0.0015 0.0000048 b b Southwest of ORNL, Lenoir
City #1 b 0.00074 b b 0.0000085 b b
Southwest of ORNL, Lenoir City #2
0.000015e 0.00071 b 0.0019 b b b
Reference location, Maryville b 0.00061 b 0.0020 b b 0.0000026 Turnips
East of ORR (Claxton vicinity)
b 0.0015 b 0.0025 b b 0.0000025
North of ETTP 0.000022 0.0017 b 0.0026 b b b Northeast of Y-12,
Scarboro #2 0.00020 f 0.0017 b 0.0033 b b b
North of Y-12 0.000017 0.0019 b 0.0023 b b b Southwest of ORNL, Lenoir
City #1 0.00011 0.00223 b 0.0028 b b b
Southwest of ORNL, Lenoir City #2
b,g 0.0023 b 0.0025 b b b
Reference location, Maryville 0.000022h 0.0020 b b b b b aDetected radionuclides are those at or above minimum detectable activity. 1 pCi = 3.7 × 10⁻² Bq. bValue was not above minimum detectable activity. cAdditional analyses were conducted to identify alpha activity: 239/240Pu was detected at 0.0000061pCi/kg; none
of the following were above minimum detectable activity: 241Am, 242Cm, 244Cm, 237Np, 238Pu, 228Th, 230Th, and 232Th.
dAdditional analyses were conducted to identify alpha activity, and none of the following were above minimum detectable activity: 241Am, 242Cm, 244Cm, 237Np, 238Pu, 239/240Pu , 228Th, 230Th, and 232Th.
eAdditional analyses were conducted to identify alpha activity: 241Am was detected at 0.0000042 pCi/kg, and 242Cm was detected at 0.000013 pCi/kg. None of the following were above minimum detectable activity: 244Cm, 237Np, 238Pu, 239/240Pu , 228Th, 230Th, and 232Th.
fAdditional analyses were conducted to identify alpha activity; none of the following were above minimum detectable activity: 241Am, 242Cm, 244Cm, 237Np, 238Pu, 239/240Pu , 228Th, 230Th, and 232Th.
gAdditional analyses were conducted to identify alpha activity: 232Th was detected at 0.0000029 pCi/kg. None of the following were above minimum detectable activity: 241Am, 242Cm, 244Cm, 237Np, 238Pu, 239/240Pu , 228Th, and 230Th.
hAdditional analyses were conducted to identify the alpha activity; none of the following were above minimum detectable activity: 241Am, 242Cm, 244Cm, 237Np, 238Pu, 239/240Pu , 228Th, 230Th, and 232Th.

Oak Ridge Reservation
6-12 ORR Environmental Monitoring Program
Fig. 6.5. Milk sampling locations in the vicinity of the ORR.
Table 6.7. Concentration of radionuclides detected in raw milk, 2009
Analysis No. detected/
no. total
Detected concentration (pCi/L)a Standard error of
mean Max Min Avg
Claxton
Potassium-40 6/6 1400 b 1000 b 1200 b 51 Total rad Sr 1/6 2.4 b 0.26 1.2 b 0.3
Combined reference locations
Potassium-40 12/12 1400 b 1200 b 1300 b 18 aDetected radionuclides are those above minimum detectable activity.
1 pCi = 3.7 H 10!2 Bq. bIndividual and average concentrations significantly greater than zero at the 95%
confidence level..
6.6 Fish Members of the public could be exposed to contaminants originating from DOE-ORO activities
through consumption of fish caught in area waters. This potential exposure pathway is monitored by collecting fish from three locations on the Clinch River annually and analyzing edible fish flesh for specific contaminants. The locations are as follows (Fig. 6.6):
• Clinch River upstream from all DOE ORR inputs [Clinch River kilometer (CRK) 70], • Clinch River downstream from ORNL (CRK 32), and • Clinch River downstream from all DOE ORR inputs (CRK 16).

Annual Site Environmental Report
ORR Environmental Monitoring Program 6-13
Fig. 6.6. Fish sampling locations for the ORR. Sunfish (Lepomis macrochirus, L. auritus, and Ambloplites rupestris) and catfish (Ictalurus
punctatus) are collected from each of the three locations to represent both top-feeding and bottom-feeding-predator species. In 2009, a composite sample for each of these species at each location was analyzed for selected metals, polychlorinated biphenyls (PCBs), 3H, gross alpha, gross beta, gamma-emitting radionuclides, and total radioactive strontium. In order to accurately estimate exposure levels to consumers, only edible portions of the fish were submitted for analyses.
It should be noted that TDEC issues advisories for consumption of certain species of fish caught in specified Tennessee waters. These advisories apply to fish that could contain potentially hazardous contaminants. A “do not consume” advisory has been issued by TDEC for catfish in the Melton Hill Reservoir in its entirety, and not just in those areas that could be impacted by ORR activities, because of PCB contamination. Similarly, a precautionary advisory for catfish in the Clinch River arm of Watts Bar Reservoir has been issued because of PCB contamination (TDEC 2008).
6.6.1 Results
Detected PCBs, mercury, and radionuclides are shown in Table 6.8. PCBs and mercury were detected in both sunfish and catfish at all three locations in 2009. Aroclor-1260 was detected in both species at all locations while Aroclor-1254 was observed in the catfish samples from each location (Aroclor-1260 and -1254 are PCBs). These results are consistent with the TDEC advisories discussed above.
Radiological analyses for fish tissues sampled in 2009 showed only two instances of statistical differences (at the 95% confidence level) in radionuclide levels when comparing results from the two areas that could potentially be affected by ORR activities with those from the upstream, non-DOE-impacted location. While no significant differences were observed in gross alpha levels in sunfish at any location, the alpha activity in catfish was slightly higher at the upstream reference location (unaffected by DOE activities) than at either of the two downstream locations. Gross beta activity detected in sunfish at CRK 16, downstream of all reservation sources, was slightly higher than levels

Oak Ridge Reservation
6-14 ORR Environmental Monitoring Program
observed at either of the other two locations, but no statistical differences were observed in beta results for catfish. There were no other statistical differences in radionuclide concentrations in upstream and downstream locations, indicating that DOE activities on the ORR are not significant contributors to public radiological dose from fish consumption.
Table 6.8. 2009 tissue concentrations in catfish and sunfish for
mercury, detected PCBs, and detected radionuclidesa
Parameter Catfishb Sunfishb
Clinch River downstream from all DOE ORR inputs (CRK 16)
Metals (mg/kg) Mercury 0.073 0.097
Pesticides and PCBs (μg/kg) PCB-1254 69 U13 PCB-1260 95 29
Radionuclides (pCi/g)c Alpha activity 0.0097 0.026* Beta activity 1.4* 1.5* Potassium-40 3.3* 2.9*
Clinch River downstream from ORNL (CRK 32)
Metals (mg/kg) Mercury 0.084 0.022
Pesticides and PCBs (μg/kg) PCB-1254 130 U11 PCB-1260 270 18
Radionuclides (pCi/g)c Alpha activity 0.1* 0.0088 Beta activity 1.4* 0.97* Potassium-40 4.0* 2.8*
Clinch River (Solway Bridge) upstream from all DOE ORR inputs (CRK 70)
Metals (mg/kg) Mercury 0.038 0.021
Pesticides and PCBs (μg/kg) PCB-1254 15 U9.7 PCB-1260 62 40
Radionuclides (pCi/g)c Alpha activity 0.18* –0.0037d Beta activity 2.3* 1.0* Potassium-40 3.2* 4.0* Strontium-90 0.2* 0.01*
aOnly parameters that were detected for at least one species are listed in the table. The sampling and analysis plan contains a complete list of analyses performed.
bPrefix “U” indicates that the value was undetected at the analytical detection limit. cRadionuclide concentrations significantly greater than zero are identified by an asterisk
(*). Detected radionuclides are those at or above MDA. d Radiological results are reported after background activity has been subtracted. Where
background activity exceeds sample activity, this will result in negative values.
Abbreviations CRK = Clinch River kilometer MDA = minimum detectable activity PCB = polychlorinated biphenyl

Annual Site Environmental Report
ORR Environmental Monitoring Program 6-15
6.7 White-Tailed Deer Three deer hunts were held on the ORR during the final quarter of 2009. ORNL staff, Tennessee
Wildlife Resources Agency (TWRA) personnel, and student members of the Wildlife Society (University of Tennessee chapter) performed most of the necessary operations at the checking station.
The 2009 hunts were held on three weekends. Shotgun/muzzleloader and archery hunts were held October 24–25, November 14–15, and December 5–6. In 2009, there were about 500 shotgun/ muzzleloader–permitted hunters and 600 archery-permitted hunters. The Tower Shielding area, Park City Road/Chestnut Ridge area, and Poplar Creek Road area were opened for an archery-only hunt on all three weekends. There was a two-deer limit for the November and December hunts; one could be an antlered buck.
The year’s total harvest was 354 deer. From the total deer harvest, 214 (60.5%) were bucks and 140 (39.5%) were does. The heaviest buck had ten antler points and weighed 189 lb. The greatest number of antler points found on one buck was 28. The heaviest doe weighed 117 lb.
Since 1985 10,699 deer have been harvested. Of these only 197 (1.84%) have been retained as a result of potential radiological contamination. The heaviest buck was 218 lb (harvested in 1998); the average weight is 85.9 lb. The eldest deer harvested was 12 years old; the average age is 1.9 years. For more information, see the ORNL wildlife webpage: http://www.ornl.gov/sci/rmal/huntinfo.htm.
6.7.1 Results
The wildlife administrative release limits associated with deer, turkey, and geese harvested on the ORR are conservative and were established based on as-low-as-reasonably-achievable (ALARA) principles to ensure that doses to consumers of wildlife harvested on the reservation are managed and controlled to levels well below regulatory dose thresholds. The ALARA concept is not a dose limit but rather a philosophy that has the objective of maintaining exposures to workers, members of the public, and the environment below regulatory limits. The administrative release limit of 5 pCi/g for 137Cs is based on the assumption that one person consumes all of the meat from a maximum-weight deer, goose or turkey. This limit ensures that members of the public who harvest wildlife on the reservation will not receive significant radionuclide doses from this consumption pathway. Similarly, the gross beta count administrative limit of 2.5 times background is near the detection limit for field measurements.
During the 2009 hunts, 354 deer were harvested on the ORR, and 2 (0.56%) were retained for exceeding the administrative release limits [1.5 times the background for beta activity in bone (~20 pCi/g) or 5 pCi/g of 137Cs in edible tissue]. The two retained deer exceeded the limit for beta-particle activity in bone. The average weight of the released deer was 86.8 lb; the maximum weight was 189 lb. The average 137Cs concentration in the released deer was 0.6 pCi/g, and the maximum 137Cs concentration in the released deer was 1.2 pCi/g.
Total field-dressed weight of the released deer was 30,557 lb. It is assumed that 55% of the field weight is edible meat; therefore, the total harvest of edible meat (352 released deer) is estimated to be 16,806 lb.
6.8 Fowl
6.8.1 Waterfowl Surveys—Canada Geese
The consumption of Canada geese is a potential pathway for exposure of members of the public to radionuclides released from ORR operations because open hunts for Canada geese are held on the ORR and in counties adjacent to the reservation each year. To determine concentrations of gamma-emitting radionuclides accumulated by waterfowl that feed and live on the ORR, Canada geese are rounded up each summer for noninvasive gross radiological surveys.
From the roundup, 63 geese were subjected to live whole-body gamma scans. The geese were collected from ORNL (19), Y-12 (24), and Clark Center Park (20). None exceeded the administrative release limits.

Oak Ridge Reservation
6-16 ORR Environmental Monitoring Program
The same 137Cs release administrative limit as applied to deer is also applied to geese. For 137Cs , the administrative release limit of 5 pCi/g assumes one person consumes all of the meat from a maximum-weight goose. The administrative limits were established to keep doses ALARA and to be consistent among harvested wildlife.
6.8.1.1 Results
The average 137Cs concentration in the released geese was about 0.25 pCi/g. However, most of the 137Cs concentrations were less than the minimum detection level. The maximum 137Cs concentration in the released geese was about 0.93 pCi/g. The average weight of the geese screened during the roundup was 7.9 lb, and the maximum goose weight was 11.5 lb. No geese were sacrificed for radiological analyses in 2009.
6.8.2 Turkey Monitoring
Two wild turkey hunts managed by DOE and TWRA were held on the reservation (April 4 and 5 and April 18 and 19, 2009). Hunting was open for both shotguns and archery. Thirty-six turkeys were harvested, of which 7 (19.4%) were juveniles and 29 (80.6%) were adults. The average turkey weight was about 19.3 lb. The largest tom weighed 25.7 lb. The longest beard was 11.9 inches, and the average was 9.0 inches. The longest spur was 1.5 in. and the average was 0.8 in.
Since 1997, 546 turkeys have been harvested. Of these, only three (0.55%) have been retained because of potential radiological contamination. The heaviest turkey was 25.7 lb; the average weight is 18.7 lb. The longest spur on turkey harvested on the ORR was 1.5 in. (average 0.8 in.) and the longest beard was 13.5 in. (average 9.2 in.). For additional information, see the ORNL wildlife webpage: http://www.ornl.gov/rmal/huntinfo.htm.
The same 137Cs release administrative limits as applied to deer and geese are also applied to turkey. For 137Cs, the administrative release limit of 5 pCi/g assumes one person consumes all of the meat from a maximum-weight turkey. The administrative limits were established to keep doses ALARA and to be consistent between harvested wildlife.
6.8.2.1 Results
In 2009, none of the 36 turkeys harvested exceeded the administrative release limits established for radiological contamination. The average 137Cs concentration in the released turkeys was 0.1 pCi/g, and the maximum 137Cs concentration in the released turkeys was 0.14 pCi/g. Most of the 137Cs concentrations were less than the minimum detection level. It is assumed that about 50% of the field weight is edible meat; therefore, the average turkey would yield about 9.7 lb of meat. Based on the individual weights, the total harvest of edible meat (36 released turkeys) is estimated to be about 347.2 lb. No turkeys were sacrificed for radiological analyses in 2009.
6.9 Quality Assurance The activities associated with administration, sampling, data management, and reporting for the ORR
environmental surveillance programs are performed by the UT-Battelle Environmental Protection and Waste Services Division. Project scope is established by a task team whose members represent DOE, UT-Battelle, B&W Y-12, and BJC. UT-Battelle integrates quality assurance, environmental, and safety considerations into every aspect of ORR environmental monitoring. See Sect. 5.8 for a discussion of UT-Battelle quality assurance program elements for environmental monitoring and surveillance activities.
Annual Site Environmental Report
ORR Environmental Monitoring Program 6-17
6.10 References
Bowen, B. M., J. A. Baars, and G. L. Stone. 2000. “Nocturnal Wind Shear and its Potential Impact on Pollutant Transport.” Journal of Applied Meteorology 39(3), 437–45.
TDEC. 2008. The Status of Water Quality in Tennessee. 305b Report. Tennessee Department of Environment and Conservation, Division of Water Pollution Control, Nashville, Tennessee. April.
