6hfwru - ccc.itb.ac.id
TRANSCRIPT
Marine and Fishery Sector

i | I C C S R
AUTHORS
Indonesia Climate Change Sectoral Roadmap – ICCSR Marine and Fishery Sector Report Adviser Prof. Armida S. Alisjahbana, Minister of National Development Planning/Head of Bappenas Editor in Chief U. Hayati Triastuti, Deputy Minister for Natural Resources and Environment, Bappenas ICCSR Coordinator Edi Effendi Tedjakusuma, Director of Environmental Affairs, Bappenas Editors Irving Mintzer, Syamsidar Thamrin, Heiner von Luepke, Tilman Hertz Synthesis Report Coordinating Author for Adaptation: Djoko Santoso Abi Suroso Marine and Fishery Sector Report Authors: Hamzah Latief, M. Suhardjono Fitrianto Technical Supporting Team Chandra Panjiwibowo, Edi Riawan, Hendra Julianto, Leyla Stender, Tom Harrison, Ursula Flossmann-Krauss Administrative Team Altamy Chrysan Arasty, Risnawati, Rinanda Ratna Putri, Siwi Handinah, Wahyu Hidayat, Eko Supriyatno, Rama Ruchyama, Arlette Naomi, Maika Nurhayati, Rachman

ii | I C C S R
ACKNOWLEDGMENTS The Indonesia Climate Change Sectoral Roadmap (ICCSR) is meant to provide inputs for the next five year Medium-term Development Plan (RPJM) 2010-2014, and also for the subsequent RPJMN until 2030, laying particular emphasis on the challenges emerging in the forestry, energy, industry, agriculture, transportation, coastal area, water, waste and health sectors. It is Bappenas’ policy to address these challenges and opportunities through effective development planning and coordination of the work of all line ministries, departments and agencies of the Government of Indonesia (GoI). It is a dynamic document and it will be improved based on the needs and challenges to cope with climate change in the future. Changes and adjustments to this document would be carried out through participative consultation among stakeholders. High appreciation goes to Mrs. Armida S. Alisyahbana as Minister of National Development Planning /Head of the National Development Planning Agency (Bappenas) for the support and encouragement. Besides, Mr. Paskah Suzetta as the Previous Minister of National Development Planning/ Head of Bappenas who initiated and supported the development of the ICCSR, and Deputy Minister for Natural Resources and Environment, Ministry of National Development Planning /Bappenas, who initiates and coordinates the development of the ICCSR. The following steering committee, working groups, and stakeholders have provided valuable comments and inputs for the development of the ICCSR Marine and Fishery Sector document. Their contributions are highly appreciated and acknowledged: Steering Committee (SC) Deputy of International Cooperation, Coordinating Ministry for Economy; Secretary of Minister, Coordinating Ministry for Public Welfare; Secretary General, Ministry of Marine and Fisheries; Executive Secretary, Agency for Meteorology, Climatology; Deputy of Economy, Deputy of Infrastructures, Deputy of Development Funding, Deputy of Human Resources and Culture, Deputy of Regional Development and Local Autonomy, National Development Planning Agency; and Chief of Secretariat of the National Council for Climate Change. Working Group Ministry of Marine and Fisheries Gellwyn Yusuf, Subandono Diposaptono, Ida Kusuma Wardhaningsih, Budi Sugianti, M. Eko Rudianto, Sunaryanto, Toni Ruchima, Umi Windriani, Agus Supangat, Budiasih Erich, Wany Sasmito, Firman. I, T. Bambang Adi, M Yusron, Setiawan

iii | I C C S R
National Development Planning Agency Sriyanti, Yahya R. Hidayat, Bambang Prihartono, Mesdin Kornelis Simarmata, Arum Atmawikarta, Montty Girianna, Wahyuningsih Darajati, Basah Hernowo, M. Donny Azdan, Budi Hidayat, Anwar Sunari, Hanan Nugroho, Jadhie Ardajat, Hadiat, Arif Haryana, Tommy Hermawan, Suwarno, Erik Amundito, Rizal Primana, Nur H. Rahayu, Pungki Widiaryanto, Maraita, Wijaya Wardhana, Rachmat Mulyanda, Andiyanto Haryoko, Petrus Sumarsono, Maliki Agency for Meteorology, Climatology and Geophysics Edvin Aldrian, Dodo Gunawan, Nurhayati, Soetamto, Yunus S, Sunaryo Universities and Professionals ITB: Safwan Hadi; Dishidros, TNI-AL: Letkol Ir. Trismadi, MSi. Grateful thanks to all staff of the Deputy Minister for Natural Resources and Environment, Ministry of National Development Planning/ Bappenas, who were always ready to assist the technical facilitation as well as in administrative matters for the finalization process of this document. The development of the ICCSR document was supported by the Deutsche Gesellschaft fuer Technische Zusammenarbeit (GTZ) through its Study and Expert Fund for Advisory Services in Climate Protection and its support is gratefully acknowledged.

iv | I C C S R
Remarks from Minister of National Development Planning/
Head of Bappenas
We have seen that with its far reaching impact on the world’s ecosystems as well as human security and development, climate change has emerged as one of the most intensely critical issues that deserve the attention of the world’s policy makers. The main theme is to avoid an increase in global average temperature that exceeds 2̊ C , i.e. to reduce annual worldwide emissions by more than half from the present level in 2050. We believe that this effort of course requires concerted international response – collective
actions to address potential conflicting national and international policy initiatives. As the world economy is now facing a recovery and developing countries are struggling to fulfill basic needs for their population, climate change exposes the world population to exacerbated life???. It is necessary, therefore, to incorporate measures to address climate change as a core concern and mainstream in sustainable development policy agenda. We are aware that climate change has been researched and discussed the world over. Solutions have been proffered, programs funded and partnerships embraced. Despite this, carbon emissions continue to increase in both developed and developing countries. Due to its geographical location, Indonesia’s vulnerability to climate change cannot be underplayed. We stand to experience significant losses. We will face – indeed we are seeing the impact of some these issues right now- prolonged droughts, flooding and increased frequency of extreme weather events. Our rich biodiversity is at risk as well. Those who would seek to silence debate on this issue or delay in engagement to solve it are now marginalized to the edges of what science would tell us. Decades of research, analysis and emerging environmental evidence tell us that far from being merely just an environmental issue, climate change will touch every aspect of our life as a nation and as individuals. Regrettably, we cannot prevent or escape some negative impacts of climate change. We and in particular the developed world have been warming the world for too long. We have to prepare therefore to adapt to the changes we will face and also ready, with our full energy, to mitigate against further change. We have ratified the Kyoto Protocol early and guided and contributed to the world debate through hosting the 13th Convention of the Parties to the United Nations Framework Convention on Climate Change (UNFCCC), which generated the Bali Action Plan in 2007. Most recently, we have turned our attention to our biggest challenge yet, that of delivering on our President’s promise to reduce carbon emissions by 26% by 2020. Real action is urgent.

v | I C C S R
But before action, we need to come up with careful analysis, strategic planning and priority setting. I am delighted therefore to deliver the “Indonesia Climate Change Sectoral Roadmap”, or I call it ICCSR, with the aim to mainstream climate change into our national medium-term development plan. The ICCSR outlines our strategic vision that places particular emphasis on the challenges emerging in the forestry, energy, industry, transport, agriculture, coastal areas, water, waste and health sectors. The content of the roadmap has been formulated through a rigorius analysis. We have undertaken vulnerability assessments, prioritized actions including capacity-building and response strategies, completed by associated financial assessments and sought to develop a coherent plan that could be supported by line Ministries and relevant strategic partners and donors. The ICCSR is launched now and I invite for your commitment, support and partnership in joining us in realising priorities for climate-resilient sustainable development while protecting our population from further vulnerability.
Minister for National Development Planning/ Head of National Development Planning Agency
Prof. Armida S. Alisjahbana
vi | I C C S R
Remarks from Deputy Minister for Natural Resources and
Environment, Bappenas
To be a part of the solution to global climate change, the government of Indonesia has endorsed a commitment to reduce the country’s GHG emission by 26%, within ten years, benchmarked to the emission level from a business as usual and, up to 41% emission reductions can be achieved with international support to our mitigation efforts. The top two sectors that contribute to the country’s emissions are the forestry and energy sectors, mainly emissions from deforestation and from power
plants. With a unique set of geographical location among the countries on Earth we are at most vulnerable to the negative impacts of climate change. Measures are needed to protect our people from the adverse effect of sea level rise, flood, greater variability of rainfall, and other predicted impacts. Unless adaptive measures are taken, prediction tells us that a large fraction of Indonesia could experience freshwater scarcity, declining crop yields, and vanishing habitats for coastal communities and ecosystems. National actions are needed both to mitigate the global climate change and to identify climate change adaptation measures. This is the ultimate objective of the Indonesia Climate Change Sectoral Roadmap, ICCSR. A set of highest priority actions are to be integrated into our system of national development planning. We have therefore been working to build national concensus and understanding of climate change response options. The Indonesia Climate Change Sectoral Roadmap (ICCSR) represents our long-term commitment to emission reduction and adaptation measures and it shows our ongoing, inovative climate mitigation and adaptation programs for the decades to come.
Deputy Minister for Natural Resources and Environment National Development Planning Agency
U. Hayati Triastuti

vii | I C C S R
Table of Contents
AUTHORS i
ACKNOWLEDGMENTS ii
Remarks from Minister of National Development Planning/Head of Bappenas iv
Remarks from Deputy Minister for Natural Resources and Environment, Bappenasvi
Table of Contents vii
List of Figures x
List of Tables xiv
List of Abbreviations xvi
CHAPTER 1 INTRODUCTION 1
1.1 Background .......................................................................................................................... 1 1.2. Objectives and Targets ...................................................................................................... 5 1.3. Approaches ......................................................................................................................... 6
1.3.1. Framework............................................................................................................. 6 1.3.2. Scientific Analysis ............................................................................................... 10 1.3.3 Stakeholder Participation Process .................................................................... 11
CHAPTER 2 CONDITIONS, PROBLEMS, AND CHALLENGES FOR THE
MARINE AND FISHERIES SECTOR 12
2.1. Indonesian Water Areas, Interactions and Their Functions .................................... 12 2.2. Potential of the Fisheries and Marine Sector ............................................................... 14
2.2.1. The Potential of Fisheries ............................................................................... 15 2.3. Current Conditions and Problems of the Marine and Fisheries Sector ................... 20
2.3.1. Conditions of the Marine and Fisheries Sector ............................................ 20 2.3.2. Problems of the Marine and Fisheries Sector ................................................ 21
2.4. Current Capacities in Responses to Climate Changes ................................................ 22 2.4.1. Current Institutional Responses ....................................................................... 22 2.4.2. Current National Regulation and Policy Framework .................................... 25
2.5. Climate Change Hazards and the Marine and Fisheries Sector ............................... 27 2.5.1. Increase of Air and Sea Surface Temperatures ............................................. 29 2.5.2. Increase in Frequency and Intensity of Extreme Weather Events ........... 33 2.5.3. Changes in Rainfall Pattern and Freshwater Runoff Induced by Changes
of the Climate Variability Pattern ................................................................... 37 2.5.4. Changes in the current Ocean Circulation Induced by Changes of the
Climate Variability Pattern ............................................................................... 41 2.5.5. Sea Level Rise..................................................................................................... 47 2.5.6. Notes and Summary of the Hazard Analysis ............................................... 52

viii | I C C S R
2.5.7. Summary of Hazards induced by Climate Change in Each Region ........... 56 2.5.7.1. Region I Sumatra Island and Its Surroundings ............................... 56 2.5.7.2. Region II Java-Madura-Bali Islands and Its Surroundings ............ 58 2.5.7.3. Region III Nusa Tenggara Islands .................................................... 61 2.5.7.4. Region IV Kalimantan Island and Its Surroundings ...................... 63 2.5.7.5. Region V Sulawesi Island and Its Surroundings ............................. 65 2.5.7.6. Region VI Maluku Islands .................................................................. 66 2.5.7.7. Region VII Western Part of Papua Island and Its Surroundings . 67
2.6. Strategic Issues of the Marine and Fisheries Sector Related to Climate Change ... 69 CHAPTER 3 VULNERABILITY OF THE MARINE AND FISHERIES
SECTOR TOWARDS CLIMATE CHANGE 74
3.1. Vulnerability Elements and Parameters of the Marine and Fisheries Sector .......... 75 3.2. Quantitative and Qualitative Vulnerability Description for the Marine and
Fisheries Sector In Each Region ................................................................................. 81 3.2.1. Region I Sumatra Island ................................................................................... 83 3.2.2. Region II Java-Madura-Bali Islands and Its Surroundings .......................... 84 3.2.3. Region III Nusa Tenggara Islands .................................................................. 85 3.2.4. Region IV Kalimantan Island and Its Surroundings .................................... 86 3.2.5. Region V Sulawesi Island and Its Surroundings ........................................... 87 3.2.6. Region VI Maluku Islands ............................................................................... 88 3.2.7. Region VII Western Part of Papua Island and Its Surroundings ............... 89
CHAPTER 4 POTENTIAL IMPACTS AND RISKS OF CLIMATE CHANGE 91
FOR THE MARINE AND FISHERY SECTOR 91
4.1. Potential Impacts ............................................................................................................. 91 4.2. Risk Analysis (Quantitative Potential Impacts) in Each Region ............................... 95
4.2.1. Region I Sumatra Island and Its Surroundings ............................................. 97 4.2.2. Region II Java-Madura-Bali Islands and Its Surroundings .......................... 97 4.2.3. Region III Nusa Tenggara Islands .................................................................. 97 4.2.4. Region 4 Kalimantan Island and Its Surroundings ...................................... 97 4.2.5. Region V Sulawesi Island and Its Surroundings ........................................... 97 4.2.6. Region VI Maluku Islands ............................................................................... 98 4.2.7. Region VII Western Part of Papua Island and Its Surroundings ............... 98
CHAPTER 5 FUTURE DIRECTIONS AND STEPS? FOR THE
INTEGRATION OF CLIMATE CHANGE ADAPTATION IN THE MARINE
AND FISHERIES SECTOR 99
5.1. Future Directions for the Marine and Fisheries Sector 2010 - 2030 ...................... 101 5.2. Future Steps for the Marine and Fisheries Sector in 2010-2030 ........................... 102
5.2.1. Priority Activities for Adaptation .................................................................. 102 5.2.2. Champion Activities for Adaptation ............................................................ 110 5.2.3. Steps to follow for the Priority Activities ................................................... 111
CHAPTER 6 CONCLUSIONS 120

ix | I C C S R
References 121
Appendix I. Execution of Focus Group Discussion (FGD) with Associated Stakeholders124
Appendix II. Missions of the Ministry of Marine and Fisheries Directly Related to Climate
Change Adaptation Strategies 125
Appendix III. Vulnerability Description 126
Appendix IV. Interrelation between Potential Impacts and Adaptation Strategies, Hazards
and Vulnerabilities Related to Climate Change 129
Appendix V. Priority Activities and Its Steps to follow 134

x | I C C S R
List of Figures
Figure 1. 1 Trends in global sea level rise for the last 125 Years .............................................. 2
Figure 1. 2 Position of Indonesia Climate Change Sectoral Roadmap (ICCSR) in the
system of development planning of the marine and fisheries sector at the
national and regional levels. ........................................................................................ 5
Figure 1. 3 Conceptual framework of adaptation accompanied by climate change
mitigation (Diposaptono et.al. 2009) ........................................................................ 7
Figure 2. 1 Map of the Indonesian Waters under the Law No. 6 Year 1996 ........................ 13
Figure 2. 2 Coastal water areas and its surroundings ................................................................ 13
Figure 2. 3 Interactions in coastal water areas (Latief and Hadi, 2001) ................................. 14
Figure 2. 4 Economic potential of activities related to the coastal, marine, and fishery
sector ............................................................................................................................ 15
Figure 2. 5 Distribution of upwelling areas in Indonesian waters (Nontji, 1993) ................ 19
Figure 2. 6 Interrelation between hazards triggered by climate change upon the marine and
fisheries sector (adopted from Australian Greenhouse Office, 2005) ............... 29
Figure 2. 7 Trend of increasing air temperature in Jakarta and Semarang ............................ 30
Figure 2. 8 Mooring point position of sea temperature measurement, b) sea surface
temperature measurement results and (c) Temperature increase rate for every
station (modified from source: Aldrin and Arifian, 2008) ................................... 31
Figure 2. 9 The trend of sea level rise according to NOAA OI data, with the highest
increase to be expected in the Pacific Ocean, at the north of Papua, while the
lowest one is expected to occur at the southern coast of Java Island ................ 32
Figure 2. 10 Trend of SST rise based on IPCC SRESa1b (IPCC, 2007) using
MRI_CGCM3.2 model (Sofian, 2009) .................................................................... 32
Figure 2. 11 SST seasonal variations (black line) and SST increase trend (blue line) and the
threshold temperature of the coral bleaching (red line) ....................................... 33
Figure 2. 12 Area of tropical cyclones (red shade). These cyclone do not occur in Indonesia,
but the impacts of hurricane and strong wind are still ecxperienced . ............... 34
Figure 2. 13 Tropical cyclone track in Indian Ocean (BOM Australia, 2006) ........................ 34
Figure 2. 14 Storm wave height distribution from model simulation results in the southern
coast of Java Island (N.S. Ningsih, 2009) ............................................................... 36
xi | I C C S R
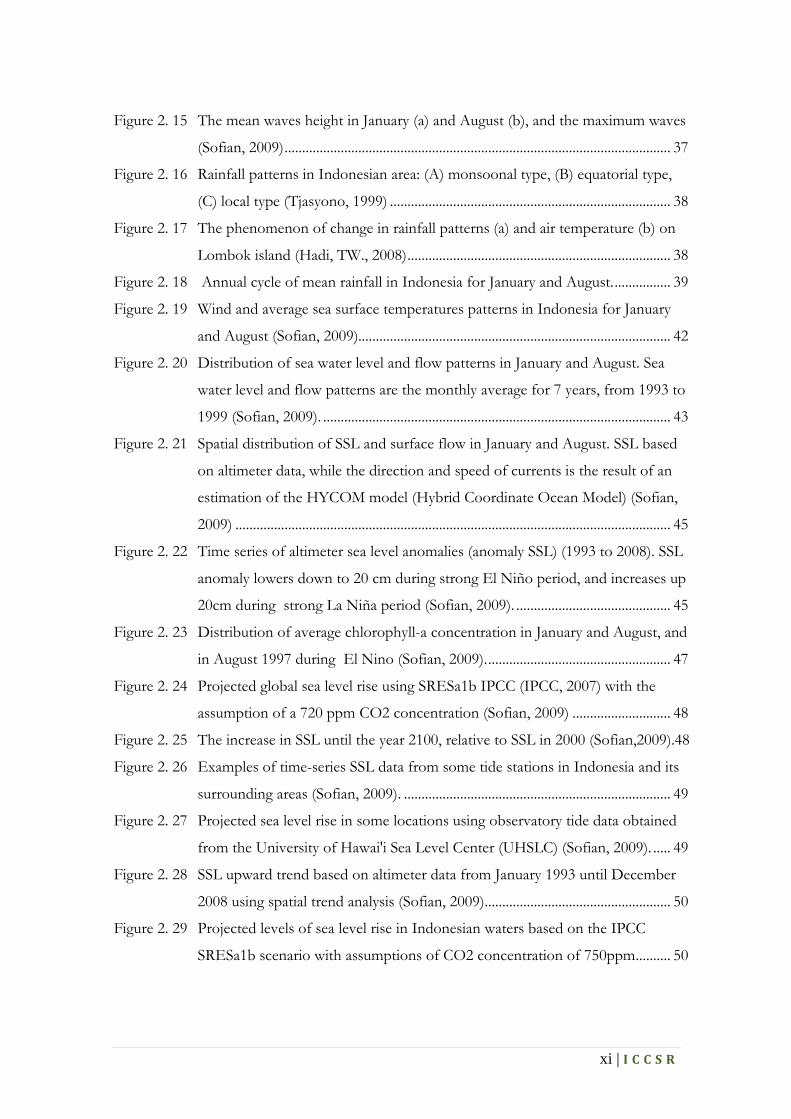
Figure 2. 15 The mean waves height in January (a) and August (b), and the maximum waves
(Sofian, 2009) .............................................................................................................. 37
Figure 2. 16 Rainfall patterns in Indonesian area: (A) monsoonal type, (B) equatorial type,
(C) local type (Tjasyono, 1999) ................................................................................ 38
Figure 2. 17 The phenomenon of change in rainfall patterns (a) and air temperature (b) on
Lombok island (Hadi, TW., 2008) ........................................................................... 38
Figure 2. 18 Annual cycle of mean rainfall in Indonesia for January and August. ................ 39
Figure 2. 19 Wind and average sea surface temperatures patterns in Indonesia for January
and August (Sofian, 2009)......................................................................................... 42
Figure 2. 20 Distribution of sea water level and flow patterns in January and August. Sea
water level and flow patterns are the monthly average for 7 years, from 1993 to
1999 (Sofian, 2009). ................................................................................................... 43
Figure 2. 21 Spatial distribution of SSL and surface flow in January and August. SSL based
on altimeter data, while the direction and speed of currents is the result of an
estimation of the HYCOM model (Hybrid Coordinate Ocean Model) (Sofian,
2009) ............................................................................................................................ 45
Figure 2. 22 Time series of altimeter sea level anomalies (anomaly SSL) (1993 to 2008). SSL
anomaly lowers down to 20 cm during strong El Niño period, and increases up
20cm during strong La Niña period (Sofian, 2009). ............................................ 45
Figure 2. 23 Distribution of average chlorophyll-a concentration in January and August, and
in August 1997 during El Nino (Sofian, 2009). .................................................... 47
Figure 2. 24 Projected global sea level rise using SRESa1b IPCC (IPCC, 2007) with the
assumption of a 720 ppm CO2 concentration (Sofian, 2009) ............................ 48
Figure 2. 25 The increase in SSL until the year 2100, relative to SSL in 2000 (Sofian,2009).48
Figure 2. 26 Examples of time-series SSL data from some tide stations in Indonesia and its
surrounding areas (Sofian, 2009). ............................................................................ 49
Figure 2. 27 Projected sea level rise in some locations using observatory tide data obtained
from the University of Hawai'i Sea Level Center (UHSLC) (Sofian, 2009). ..... 49
Figure 2. 28 SSL upward trend based on altimeter data from January 1993 until December
2008 using spatial trend analysis (Sofian, 2009) ..................................................... 50
Figure 2. 29 Projected levels of sea level rise in Indonesian waters based on the IPCC
SRESa1b scenario with assumptions of CO2 concentration of 750ppm .......... 50

xii | I C C S R
Figure 2. 30 Estimates of the rate of SSL increase in Indonesian waters based on the
dynamic model with the addition of ice melting after IPCC AR4 (Sofian, 2009)51
Figure 2. 31 Examples of subsidence due to earthquake Nias in 2005 .................................... 51
Figure 2. 32 Examples of uplift due to Nias earthquake in 2005 ............................................. 51
Figure 2. 33 Scheme of the hazards associated with sea level rise (in this case a tsunami is
not included) ............................................................................................................... 53
Figure 2. 34 Tidal Range Distribution in Indonesia.................................................................... 54
Figure 2. 35 Three scenarios of inundation of seawater in coastal areas, due to sea level rise,
climate variability La-Nina, and a storm surge. Each event is accompanied by
the highest tides perigee ............................................................................................ 56
Figure 2. 36 Simulation of a coastal inundation in Sumatra Region ......................................... 58
Figure 2. 37 Simulation of coastal inundation in the area of Java-Madura-Bali. .................... 59
Figure 2. 38 Simulation of sea water inundation in (a) the north coast of West Java and (b)
the south coast of West Java (Regional Environmental Management Agency of
West Java Province, 2008) ........................................................................................ 60
Figure 2. 39 Simulation of sea water inundation in north coastal of Jakarta .......................... 61
Figure 2. 40 Simulation of coastal inundation in Nusa Tenggara Islands ............................... 62
Figure 2. 41 Simulation of coastal inundation on Lombok Island .......................................... 63
Figure 2. 42 Simulation of coastal pools in Borneo and the surrounding areas ..................... 64
Figure 2. 43 Simulation of inundation in the area of Sulawesi and its surroundings ............. 66
Figure 2. 44 Simulation of coastal flooding in the Maluku Islands region .............................. 67
Figure 2. 45 Simulation of coastal inundation in West Papua Island ....................................... 69
Figure 3. 1 Elevation map (altitude, topography) of land surface .......................................... 76
Figure 3. 2 Map of the slope of Land Surface ........................................................................... 77
Figure 3. 3 Map of the distribution of population .................................................................... 77
Figure 3. 4 Population data from Indonesia in 2005 (a) and projections for the year 2025
(b) (processed from BPS data) ................................................................................. 78
Figure 3. 5 Map of the distribution of Population Density ..................................................... 78
Figure 3. 6 Map of important infrastructure vulnerability to sea level rise hazard .............. 79
Figure 3. 7 Map of land cover ...................................................................................................... 79
Figure 3. 8 Fishery Management Areas as a proxy for the potential to capture fish in
Indonesia (Marine and Fisheries Ministerial Regulation No. 01-MEN-2009) .. 80
Figure 3. 9 Map of coral reef distribution in the world ............................................................ 80

xiii | I C C S R
Figure 3. 10 Map of mangrove forest distribution (red) in Indonesia (Departement of
Marine and Fishery Affairs, 2005) ........................................................................... 81
Figure 3. 11 Map of seagrass distribution (pink) in Indonesia (Departement of Marine and
Fishery Affairs, 2005) ................................................................................................ 81
Figure 3. 12 Map of vulnerability to sea level rise hazards ........................................................ 82
Figure 4. 1 Vulnerability framework (USAID, 2009; Daw, et.al., 2009) ................................ 91
Figure 4. 2 Schematic Impact of climate change on several sectors ...................................... 94
Figure 4. 3 Three scenarios of climate change risks: inundation of seawater in the coastal
zone due to sea level rise, climate variability of La Nina, storm surge. Each
scene is accompanied by the highest tides perigee ................................................ 96
Figure 5. 1 The sequence of seven steps in the process of adaptation to climate change
(Diposaptono et al, 2009) ....................................................................................... 100

xiv | I C C S R
List of Tables
Table 1. 1 The report structure based on the framework of Figure 1.3 ................................. 8
Table 2. 1 Export values of fisheries by major commodities ................................................. 15
Table 2. 2 Projected incidence of El-Nino and La Nina using SRES a1b scenarios
(Source: Sofian, 2009) ................................................................................................ 40
Table 2. 3 Summary of hazards and climate change projections ........................................... 52
Table 2. 4 Hazards induced by climate change in the region I .............................................. 56
Table 2. 5 Hazards induced by climate change in the region II ............................................ 58
Table 2. 6 Hazards induced by climate change in the region III ........................................... 61
Table 2. 7 Hazards induced by climate change in the region IV ........................................... 63
Table 2. 8 Hazards induced by climate change in the region V............................................. 65
Table 2. 9 Hazards induced by climate change in the region VI ........................................... 66
Table 2. 10 Hazards induced by climate change in regions VII .............................................. 68
Table 3. 1 Description of the elements and parameters of vulnerabilities of the marine
and fisheries sector due to climate change ............................................................. 75
Table 3. 2 Elements and parameters considered in the analysis of the vulnerability to
flood hazards in coastal seawater (sampled from Table 3.1) ............................... 82
Table 3. 3 Vulnerability to climate change in the region I ...................................................... 84
Table 3. 4 Vulnerability to climate change in the region II (Java-Madura-Bali) .................. 85
Table 3. 5 Vulnerability to climate change in the region III (Nusa Tenggara) .................... 86
Table 3. 6 Vulnerability to climate change in the region IV (Borneo).................................. 87
Table 3. 7 Vulnerability to climate change in the region V (Sulawesi) ................................. 88
Table 3. 8 Vulnerability to climate change in the region VI (Maluku Islands) .................... 89
Table 3. 9 Vulnerability to climate change in the region VII (Western Part of Papua
Island) .......................................................................................................................... 90
Table 4. 1 Potential Impacts of Climate Change on the Marine and Fisheries Sector ....... 92
Table 5. 1 Nine priority activities for adaptation to climate change in the marine and
fisheries sector .......................................................................................................... 102
Table 5. 2 Explanation of the priority activities for adaptation to climate change in the
marine and fisheries sector ..................................................................................... 104

xv | I C C S R
Table 5. 3 Five Champion Activities for the adaptation to climate change in the marine
and fisheries sector .................................................................................................. 110
Table L. 1 List of Conducted Focus Group Discussions (FGD) ....................................... 124
Table L. 2 Missions of KKP Strategic Plan Year 2005-2009 ............................................... 125
Table L. 3 Sectoral vulnerability descriptions due to climate change .................................. 126
Table L. 4 Potential impacts and alternative adaptation measures specifically associated to
climate change .......................................................................................................... 129
Table L. 5 Adaptation alternatives in relation to the capacities for climate change
adaptation ................................................................................................................. 133

xvi | I C C S R
List of Abbreviations AMDAL : Environmental Impact Assessment
ASEAN : Association of Southeast Asian Nations
Bappenas : National Development Planning Agency
Bakosurtanal : National Coordinating Agency for Surveys and Mapping
BMKG : Meteorology, Climatology, and Geophysics Agency
BMKT : Goods Content of Sinking Ship
BOM Australia : Australia Bureau of Meteorology
COREMAP : Coral Reef Rehabilitation and Management Program
CRV : Climate Resilience Village
KKP : Departement Marine and Fishery Affairs
DPP : Coastal Water Areas
ENSO : El-Nino Southern Oscillation
FGD : Focus Group Discussion
GRK : Greenhouse Gasses
GTZ Germany : Deutsche Gesellschaft für Technische Zusammenarbeit
HHWL : Highest High Water Level
IPCC : Intergovernmental Panel on Climate Change
IPCC AR4 : Intergovernmental Panel on Climate Change The Fourth
Assessment Report
IPO : Interdecadal Pacific Oscillation
IPTEK : Science and Technology
ITF : Indonesian Throughflow
KML : Sea Level Rise
KP3K : Marine, Coastal, and Small Islands
KTPL : Seawater Temperature Increases
LAPAN : National Institute of Aeronautics and Space
MCRMP : Marine and Coastal Resource Management Project

xvii | I C C S R
MOD : Manado Ocean Declaration
MSL : Mean Sea Level
MRI_CGCM : Meteorological Research Institute - Coupled General Circulation
Model
NOAA :
PMEL
National Oceanic and Atmospheric Administration
: Pacific Marine Environmental Laboratory
OTEC : Ocean Thermal Energy Conversion
PEMP : Coastal Community Economic Empowerment Program
PKCE : Increased frequency and intensity of extreme weather events
PVI-AAM : Changes in the pattern of natural climate variability for wind and
ocean currents change pattern
PVI-CH : Changes in the pattern of natural climate variability for the rainfall
change pattern
RADPI : Local Action Planning for Climate Change
RANPI : National Action Planning for Climate Change
PDB : Gross Domestic Product
ICCSR : Indonesia Climate Change Sectoral Roadmap
RPJP : Long-Term Development Plan
RPJPN : National Long-Term Development Plan
RPJPD : Local Long-Term Development Plan
RPJMN : National Medium-Term Development Plan
RPJMD : Local Medium-Term Development Plan
RPWKP : Management Planning of Marine and Fisheries Area
RSWKP : Strategic Planning of Marine and Fisheries Area
RTRN : National Spatial Planning
RTRD : Local Spatial Planning
SLR : Sea Level Rise

xviii | I C C S R
SRES : Special Report on Emissions Scenarios
SS : Storm Surge
SRTM :
TML
Shuttle Radar Topography Mission
: Sea Level Height
TPL : Sea Surface Temperature
UNCLOS : United Nations Convention on Law of the Sea
UNFCCC : United Nations Framework Convention on Climate Change
UN-ISDR : United Nations
USAID
- International Strategy for Disaster Reduction
: United States Agency for International Development
USGS : United States Geological Survey
WOC : World Ocean Conference
WPP : Fisheries Potential Area
WP3K : Coastal Areas and Small Islands
ZEE : Exclusive Economic Zone

1 | I C C S R
CHAPTER 1 INTRODUCTION 1.1 Background
Global warming is a phenomenon of global temperature increase due to the
greenhouse effect which is caused by increasing greenhouse gas emissions such as
carbon dioxide (CO2), methane (CH4), dinitrooksida (N2O), and chloroflurocarbon
(CFCs) into the atmosphere.
It is well known that solar radiation into the atmosphere is partly transmitted and
absorbed by the earth, and is partly reflected back into the atmosphere by the earth
in the form of long wave radiation. In the reflection process a part of the heat is
absorbed by the greenhouse gases keeping the heat inside the atmosphere. The effect
of heat absorption by the greenhouse gases is called greenhouse effect. As a result
the Earth surface temperature and atmospheric temperature increase until these
temperatures reach a new equilibrium. The amount of heat flowing into and out of
the atmosphere does not change, but the amount of heat stored in the Earth and the
atmosphere increases and is a reason for the rising temperature of the Earth (Hadi,
et al, 2009).
Global warming due to greenhouse gases causes thermal expansion of the oceans,
especially in the surface layers (steric effect), the melting of glaciers, ice caps and ice
sheets at the poles, resulting in increase of ocean volume and level. IPCC Report
(2007) mentioned that in the period of 1961-2003 the global sea level rose 1.8 mm
(range of 1.3-3.0 mm) per year, while the rate of increase is higher between 1993 and
2003, about 3.1 mm (2.4-3.8 mm) per year. Long-term variability of the rate of sea
level rise is obvious. The results of IPCC AR4 research stated that thermal expansion
contributes about 70% to the global sea level rise and roughly 30% to ice melting.
Reduction of ice covered areas will increase the absorption of short-wave sunlight by
land and ocean and will reduce the reflection by the ice surface. This condition will
increase the acceleration of global warming, ice surface melting, thermal expansion
rising, and eventually increase the impact on the global sea level rise. An intensive
temperature rise in Antarctics is recorded since 1990s. The loss of ice which was

2 | I C C S R
about 80Gt/year in 1990s increased to 130 Gt/year since 2003. 360 Gt of ice
melting would raise sea level by 1 mm (USGS, 2009 in Hadi et al, 2009). These data
indicate the acceleration of global warming due to reduced ice cover at the poles. A
trend in global sea level rise from 1885 until 2000 is shown in Figure 1.1. Sea level
rise caused by global warming could inundate lowland areas of coastal zones,
saltmarsh area, resulting in shoreline retreats due to the coastal inundation itself and
increases of beach erosion, damages to coastal ecosystems, and even submersions of
small islands. In addition, the sea level rise could alter the patterns of ocean currents
and waves.
.
Figure 1. 1 Trends in global sea level rise for the last 125 Years (http://rst.gsfc.nasa.gov/Sect16/Sect16_2.html)
In reality sea level may suffer both long-term and short-term changes:
a. Long term sea level changes
Long term change of sea level is also called “secular change”. It is categorized into
two classes according to its causes: (1) Eustatic changes or changes of sea water
volume, and (2) Local changes that include land uplift or subsidence , including
isostasy effect. This isostasy effects comprises thermal isostasy due to changes in
temperature or the density of the Earth’s interior, glacio isostasy related to the
presence of ice, hydro-isostasy associated with the presence of water, volcanic
isostasy due to magma extrusion, and sediment isostasy linked to deposition and
erosion.

3 | I C C S R
Also, the existence of fault causing the tectonic plate to rise (up-lift) or to fall
(subsidence) could affect the sea level changes of about 1 to 3 mm/year. Sediment
compaction could cause land to be compressed, or subsidence of oil and ground
water extraction.
One of the eustatic effects is a change of the ocean basin due to expansion of the
ocean floor, changes in the oceanic ground floor elevation, and seabed sedimentation.
In addition, changes of sea watermass as a consequence of polar ice caps melting,
release of water from the earth interior, as well as release and accumulation of the
reservoir are included in the eustatic changes.
b. Short term sea level changes
Short term sea level changes could arise due to several forces including ocean tides,
storm tide, and storm surge (cyclone). A rise in sea surface height will occur when
the storm surge coincides with the highest tide level, known as storm tide. These
phenomena have periods ranging from daily up to weekly.
El Nino and La Nina phenomena also affect the sea level in a short time period. At
the time of the El Nino occurrence, sea surface in Indonesian waters decreases, while
during La Nina the sea level increases. Meanwhile, flooding in certain seasons is also
a seasonal variation that may affect sea level in the short term, which increases runoff
from rivers into the sea and causes additional sea level rise. These changes occur in
seasonal up to annual periods. In addition, the sea surface oscillations occuring at
harbors known as a seiche is also a factor that affects sea level in short-term. These
changes could occur within a period of minutes to hours.
An earthquake that causes land deformation could cause relative changes in the sea
level. Earthquakes could lead to land subsidence and/or uplift, which changes sea
level relative to the land.
In addition to the above phenomena, global warming also affects air temperature rise
and causes changes in atmospheric pressure and other climatic variables such as wind

4 | I C C S R
and rainfall. These phenomena will trigger a series of natural hazards which could
impact the coastal zones. The impact is exacerbated by vulnerability factors of the
coastal and marine region such as: explosive population growth and poverty,
excessive exploitation of resources, as well as air and water pollution.
Serious attention needs to be given to the climate change impacts, ideally before they
happen. Although the changes are slow (gradual), the potential impact is very likely
and extends to the entire surface of the earth. However, the people who live or who
depend on activities in coastal zones, marine, and small islands have already suffered
losses due to natural disasters induced by climate change. Residential, offices, and the
harbor are feeling more often the impact of flood and storm tides; the pond farmers
and the fishermen have already experienced the irregularity of wet and dry seasons
disturbed by the El-Nino and La-Nina phenomena; and the fishermen have to sail
further offshore in search for fish.
Anticipating the climate change impacts on the marine and fisheries sector is about
preparing adaptation activities so as to reduce the negative impacts of climate change
and to look for opportunities to take advantage of the positive impact through a
variety of responsive and planned efforts. These efforts can be accompanied by
mitigation activities in the form of human intervention through science and
technology to prevent or slow down climate change through the efforts of emissions
reduction and/or absorption increases of the greenhouse gases (GHG) associated
with this sector, such as maintenance and rehabilitation of mangrove forest and
seaweed cultivation.
It is therefore necessary to develop the roadmap on mainstreaming the climate
change issues into the national development planning (hereinafter abbreviated as
"Indonesia Climate Change Sectoral Roadmap, or ICCSR") especially for the marine
and fisheries sector. The aim of the ICCSR is to determine the policies and activities
that are to be integrated in the National Medium Term Development Plan (RPJMN)
for the periods 2010-2014, 2015-2019, 2020-2024, 2024-2029.

5 | I C C S R
1.2. Objectives and Targets
The main objective of the preparation of the Indonesian Climate Change Sectoral
Roadmap (ICCSR) is to determine the priority and champion activities in the area of
adaptation (and mitigation efforts) to climate change in the marine and fisheries
sector. These activities will be described in some steps in order to mainstream them
into the RPJMN in 2010-2014 and RPJPN while considering a projection of global
climate change in the period of 2010-2030 years. The position of ICCSR in the
development planning system at the national and regional levels can be seen in
Figure 1.2 (modified from Diposaptono, 2009) as follows.
Figure 1. 2 Position of Indonesia Climate Change Sectoral Roadmap (ICCSR) in the system of development planning of the marine and fisheries sector at the national
and regional levels.
Figure 1.2 above shows the important role of ICCSRs at the national and local levels,
both for the development planning in long term (RPJPN and RPJPD) and medium
term (RPJMN and RPJMD) as well as for the strategic plan and action plans of the
Marine and Fisheries sector at national and local levels ( RANPI and RADPI). The
ICCSR is furthermore implemented in the National and Regional Spatial Plans
6 | I C C S R
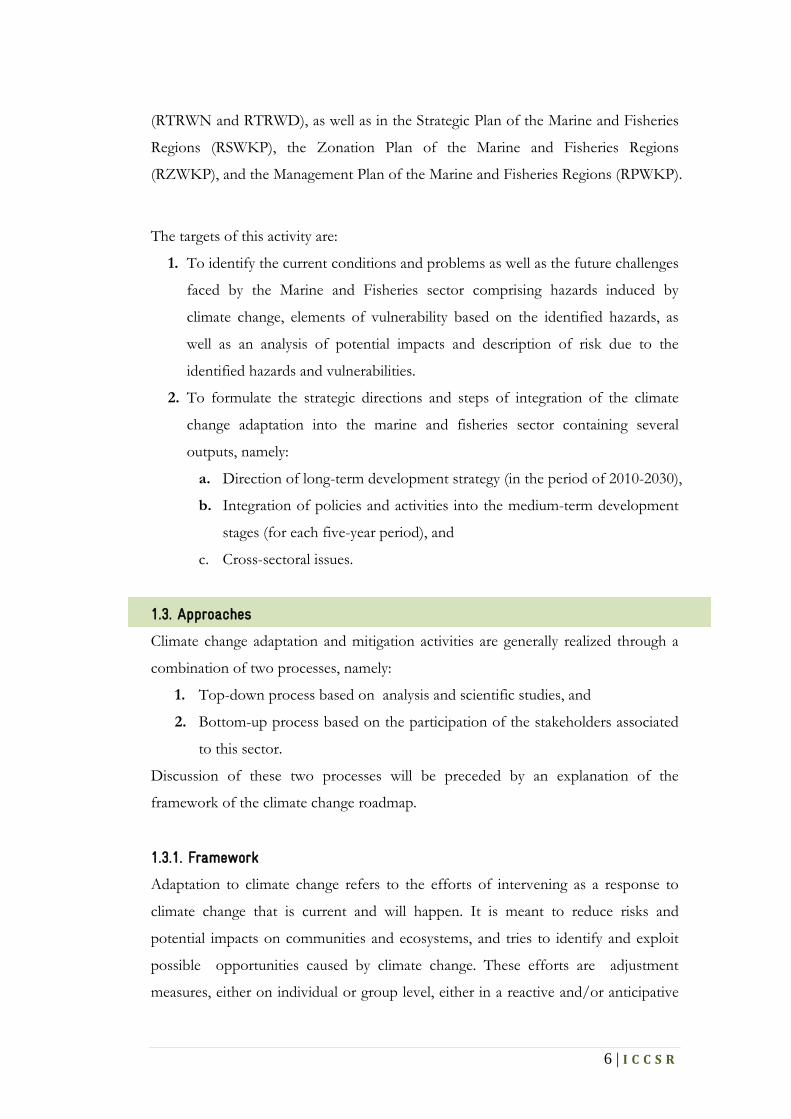
(RTRWN and RTRWD), as well as in the Strategic Plan of the Marine and Fisheries
Regions (RSWKP), the Zonation Plan of the Marine and Fisheries Regions
(RZWKP), and the Management Plan of the Marine and Fisheries Regions (RPWKP).
The targets of this activity are:
1. To identify the current conditions and problems as well as the future challenges
faced by the Marine and Fisheries sector comprising hazards induced by
climate change, elements of vulnerability based on the identified hazards, as
well as an analysis of potential impacts and description of risk due to the
identified hazards and vulnerabilities.
2. To formulate the strategic directions and steps of integration of the climate
change adaptation into the marine and fisheries sector containing several
outputs, namely:
a. Direction of long-term development strategy (in the period of 2010-2030),
b. Integration of policies and activities into the medium-term development
stages (for each five-year period), and
c. Cross-sectoral issues.
1.3. Approaches
Climate change adaptation and mitigation activities are generally realized through a
combination of two processes, namely:
1. Top-down process based on analysis and scientific studies, and
2. Bottom-up process based on the participation of the stakeholders associated
to this sector.
Discussion of these two processes will be preceded by an explanation of the
framework of the climate change roadmap.
1.3.1. Framework
Adaptation to climate change refers to the efforts of intervening as a response to
climate change that is current and will happen. It is meant to reduce risks and
potential impacts on communities and ecosystems, and tries to identify and exploit
possible opportunities caused by climate change. These efforts are adjustment
measures, either on individual or group level, either in a reactive and/or anticipative

7 | I C C S R
manner. Basically, these efforts are intended to reduce the level of vulnerability in
following way:
• Reduce the socio-economic and environmental exposure and sensitivity,
• Strengthen the resilience and capacity of governments, local governments,
and communities to anticipate these hazards.
Mitigation of climate change is an anthropogenic intervention effort in the climate
system which is designed to reduce anthropogenic effects on the climate system that
cause global warming by reducing greenhouse gas emissions and enhancing the
natural ability to absorb these emissions. Adaptation strategies accompanied by
mitigation are needed to be mainstreamed into the national development planning
for both the medium and long term. Diposaptono et al (2009) proposed a framework
to assess and develop the concept of adaptation and mitigation of climate change as
shown in Figure 1.3.
Figure 1. 3 Conceptual framework of adaptation accompanied by climate change mitigation (Diposaptono et.al. 2009)
In the conceptual framework adaptation accompanied by mitigation consists of at
least (7) seven cylic steps (Figure 1.3), namely:
(1) Assessment of climate variability and hazards induced by climate change and
their impacts ,
(2) Assessment of stressors such as human activities,

8 | I C C S R
(3) Presentation of information (facts) about climate change and the
environment, both induced by climate change or by human activities,
(4) Planning design includes criteria of development policies, directions and
identification of the options for adaptation and mitigation,
(5) Implementation of adaptation and mitigation actions,
(6) Monitoring and evaluation of the implementation results of adaptation and
mitigation actions,
(7) From the results of monitoring and evaluation, it is necessary to fine-tune
and design: (i) adaptation approaches to reduce the impacts caused by the
pressures of climate change and others, (ii) mitigation approaches to reduce
greenhouse gas emissions and increase the greenhouse gas absorptions.
The concept is embodied in the structure of the report as shown in Table 1.1.
Table 1. 1 The report structure based on the framework on Figure 1.3
No Points Description Chapter
1 Introduction and approach to the problem
Approach to the study; conditions and problems; response to the current capacity; and challenges ahead; strategic issues expected to be reviewed as the primary basis of the formulation of policies and activities
1, 2
2 Identification of the climate change hazards
Physical environmental changes triggered by global warming; current conditions and projections until the year of 2030; and other hazards that can arise as a consequence of these physical changes
2
3 Identification of elements and parameters of vulnerability
Exposure; sensitivity and adaptive capacity of the hazards induced by climate change (UN-ISDR, 2004)
3
4 Identification of potential impacts and risks
Potential impacts and risks from the hazard analysis and vulnerability
4
5 Identification of alternatives for adaptation strategies and determination of adaptation activities
Alternatives to adaptation strategies derived from the potential impact and strategic issues; selection of adaptation strategies are aligned with national development strategies; grouping strategies into priority adaptation activities; sorting the priority activities to be champion activities; stages of adaptation activities for five years (2010 -- 2030)
5

9 | I C C S R
Indonesia is a wide archipelagic country, the assessment and preparation of the
climate change adaptation and mitigation is applied to the seven regions of
development that have been determined by Bappenas, namely:
(1) Sumatra and its surrounding areas,
(2) Java-Madura-Bali and its surrounding areas,
(3) Nusa Tenggara and its surrounding areas,
(4) Kalimantan and its surrounding areas,
(5) Sulawesi and its surrounding areas,
(6) Maluku and its surrounding areas,
(7) West part of Papua and its surrounding areas.
Implementation of adaptation and mitigation of climate change also needs to
consider clusters in the marine and fisheries sectors, such as:
(1)
• Seven Marine and Fisheries Services, namely:
(2)
Sea Transport,
(3)
Maritime Industry,
(4)
Fisheries,
(5)
Marine Tourism,
(6)
Marine Energy and Mineral Resources-power,
(7)
Marine Buildings and offshore structures,
Marine Services
(1)
• Eleven Fisheries Management Areas (WPP), namely:
(2)
WPP-571: Straits of Malacca and the Andaman Sea,
(3)
WPP-572: Indian Ocean West of Sumatra and the Sunda Strait;
(4)
WPP-573: the Indian Ocean South of Java to the South of Nusa Tenggara,
Savu Sea, Western Part of Timor Sea;
(5)
WPP-711: Strait Karimata, Natuna Sea, South China Sea;
(6)
WPP-712: Java Sea;
WPP-713: Makassar Strait, Bone Gulf, Flores Sea, Bali Sea;

10 | I C C S R
(7)
(8)
WPP-714: Tolo Gulf and the Banda Sea;
(9)
WPP - 715: Tomini Gulf, Maluku Sea, Halmahera Sea, Seram Sea, Berau
Gulf;
(10)
WPP-716: Celebes Sea, North of Halmahera Island;
(11)
WPP-717: Cendrawasih Gulf, the Pacific Ocean;
WPP-718: Aru Sea, Arafuru Sea, Eastern Part of the Timor Sea.
• Clusters which are physically associated with climate change hazards.
1.3.2. Scientific Analysis
Scientific analysis is conducted by collection, analysis and synthesis of various data
and information (documents, consultations, discussions) which is described in more
detail as follows:
• Data and information that are internally obtained through the internal
discussions with the scientific team and the other sectors.
• Data and information that are obtained by studying documents and maps in
related national institutions such as Ministry of Marine Affairs and Fisheries
(MMAF/KKP), the National Coordinating Agency for Surveys and Mapping
(Bakosurtanal), the Meteorology, Climatology, and Geophysics Agency
(BMKG), and the National Institute of Aeronautics and Space (LAPAN).
• Data and information that are documents and reports obtained from some
international intitutions such as IPCC, UNFCCC, USGS, etc.. These files are
obtained through internet browsing as well as in discussions with Dr. Irving
Mintzer, a climate change expert, in March 2009.
Data and information are then analyzed with three types of analysis:
• Analysis of the scientific meteorological and oceanographic data so as to
provide some information of potential hazards induced by climate change. The
results of this analysis will be presented in Chapter 2.
• Analysis of vulnerability and potential impacts intended to provide information
of what factors cause climate change vulnerability and potential impacts in
11 | I C C S R
coastal zones and ocean waters of Indonesia. The results of this analysis will be
presented in Chapters 3 and 4.
• Analysis of strategy and identification of activities for adaptation to climate
change. The results of this analysis will be described in Chapter 5.
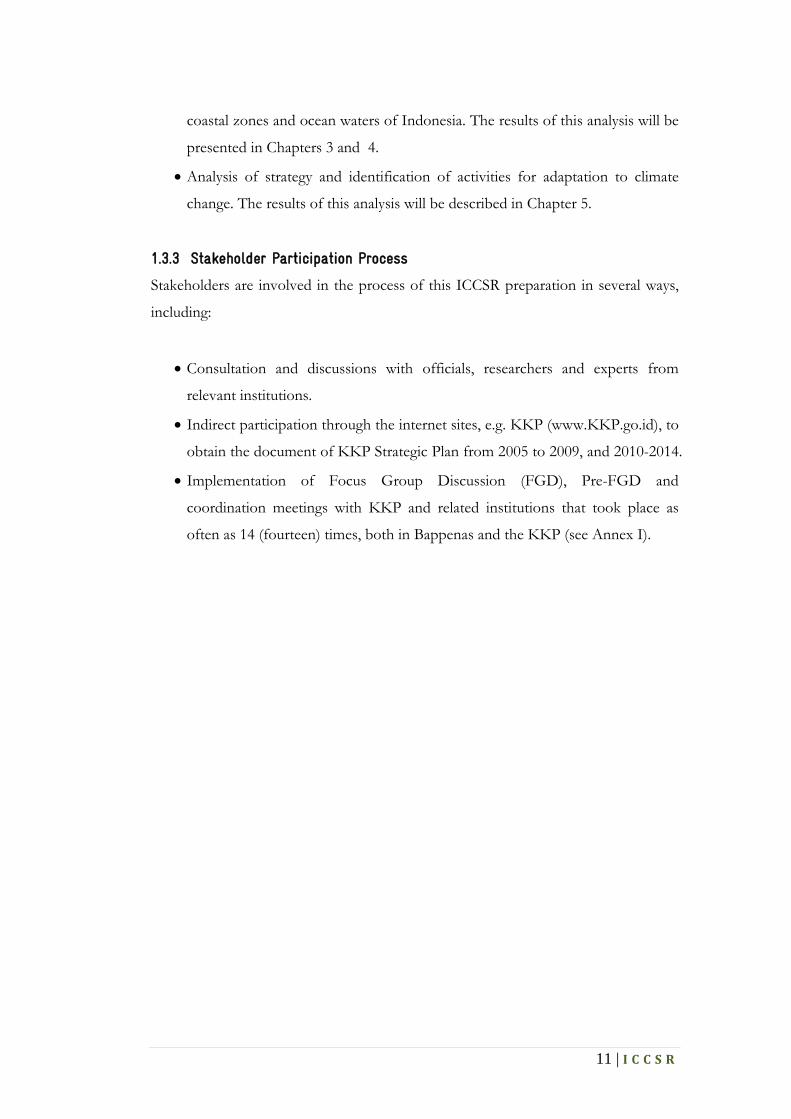
1.3.3 Stakeholder Participation Process
Stakeholders are involved in the process of this ICCSR preparation in several ways,
including:
• Consultation and discussions with officials, researchers and experts from
relevant institutions.
• Indirect participation through the internet sites, e.g. KKP (www.KKP.go.id), to
obtain the document of KKP Strategic Plan from 2005 to 2009, and 2010-2014.
• Implementation of Focus Group Discussion (FGD), Pre-FGD and
coordination meetings with KKP and related institutions that took place as
often as 14 (fourteen) times, both in Bappenas and the KKP (see Annex I).

12 | I C C S R
CHAPTER 2 CONDITIONS, PROBLEMS, AND CHALLENGES ON MARINE AND FISHERIES SECTOR
The anticipated problems in the Marine and Fisheries Sector include internal and
cross-sectoral issues as well as the problems related to the capacity (in terms of
policies) to respond to climate change. Discussion about the challenges of this sector
include the assessments of hazard, vulnerability, and impacts of climate change, and
then adaptation and mitigation efforts as well as other related issues.
2.1. Indonesian Water Areas, Interactions and Their Functions
Issuance of the United Nations Convention on Law of the Sea 1982 (UNCLOS
1982), which was ratified by the Government of the Republic of Indonesia through
the Law No. 17 Year 1985 concerning Ratification of UNCLOS 1982 in Indonesia,
says that the rights and obligations of the management of Indonesian marine areas
must be based on international laws. It also provides a positive impact on widening
the area of the marine management, so that Indonesia becomes geographically a
maritime country with a marine area of 5.8 million km² (Figure 2.1), which consists
of 0.8 million km² of sea territorial, 2.3 million km² of sea archipelagic and 2.7
million km² of the exclusive economic zone. In addition, Indonesia has 17,480
islands and 95,181 km coastline length (KKP, 2008). Furthermore about 50% of
Indonesian marine area (5.8 million km²) is a Coastal Waters Areas (DPP), which id
of potential importance: about 70% of fish resources spent their life in such areas,
and approximately 90% of marine biomasses are obtained from the DPP. Coastal
Waters Area is an area that lies between the end of the continental shelf with a water
depth of approximately 200 m and the shoreline (Figure 2.2). This area consists of
mangrove ecosystems, coral reefs, estuaries, seagrasses, and non-living and biological
resources, and facilities such as ports, coastal settlements, and coastal panorama.
13 | I C C S R
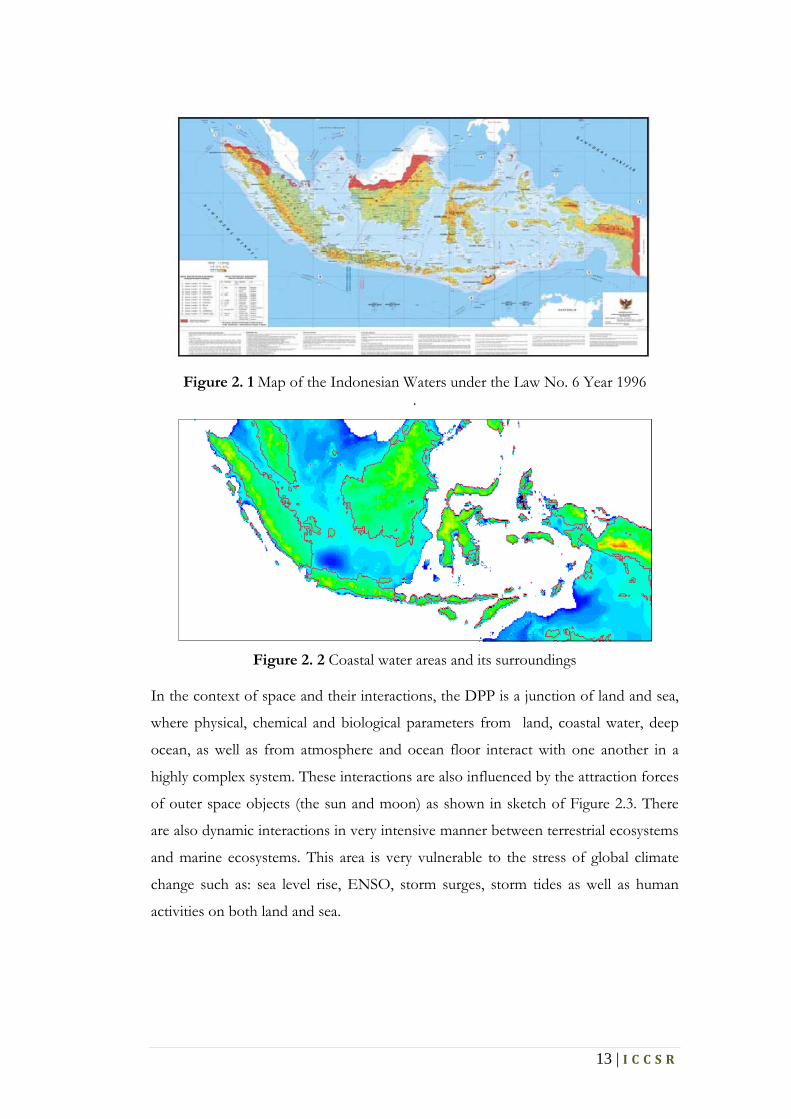
Figure 2. 1 Map of the Indonesian Waters under the Law No. 6 Year 1996
.
Figure 2. 2 Coastal water areas and its surroundings
In the context of space and their interactions, the DPP is a junction of land and sea,
where physical, chemical and biological parameters from land, coastal water, deep
ocean, as well as from atmosphere and ocean floor interact with one another in a
highly complex system. These interactions are also influenced by the attraction forces
of outer space objects (the sun and moon) as shown in sketch of Figure 2.3. There
are also dynamic interactions in very intensive manner between terrestrial ecosystems
and marine ecosystems. This area is very vulnerable to the stress of global climate
change such as: sea level rise, ENSO, storm surges, storm tides as well as human
activities on both land and sea.

14 | I C C S R
Figure 2. 3 Interactions in coastal water areas (Latief and Hadi, 2001)
Traditionally, the DPP is a very high activity area in terms of economic and social
factors. Some of its functions are:
(1) basic functions: food production, water supply and energy;
(2) social functions: housing and recreation;
(3)economic functions: commercial transportation, mining, and industrial
development; and
(4) public function: public transportation, defense, distribution of waste water,
etc.
This area is also a source of renewable energy such as: ocean thermal energy
conversion (OTEC), ocean current energy, ocean wave energy, tidal energy, energy
conversion of the salinity gradient, oceanic bio-conversion energy (whereas the non-
renewable energies are in the forms of mineral resources such as minings in coastal
areas and open oceans).
2.2. Potential of Fisheries and Marine Sector
The marine and fisheries sector has seen increases of its contribution to the National
Gross Domestic Product (NGDP), with an overall economic potential worth of
US$ 136.5 billion. The largest contributions are from fisheries, sustainable coastal
resources, marine biotechnology, marine tourism and natural oil (KKP, 2005) as seen
in Figure 2.4.
Atmospher
Atmosphere Atmosphere
River
Sky Object
Open Sea

15 | I C C S R
Figure 2. 4 Economic potential of activities related to the coastal, marine, and
fishery sector (Processed from: Ministry of Marine Affairs and Fishery, 2005)
2.2.1. The Potential of Fishery
Fishery is one of the marine resources with a high potential in Indonesia. Beside
acting as a food source, fisheries become a commercial commodity for export,
contributing to the foreign reserve, as shown in Table 2.1.
Table 2. 1 Export values of fisheries by major commodities (Ministry of Marine Affairs and Fisheries, 2008)
COMMODITY 2004 2005 2006 2007 2008*) Average Increase (%)
2004 - 2008 2007 - 2008
EKSPORT
Volume (Ton) 902.358 857.782 926.478 854.328 845.939 -1,43 -0,98 Shrimp 142.098 153.900 169.329 157.545 179.409 6,31 13,88 Tuna, Skipjack 94.221 90.589 91.822 121.316 125.992 8,37 3,85 Pearl 2 13 2 13 16 309,94 21,47 Seaweeds 51.011 69.264 95.588 94.073 95.125 18,33 1,12 Others 615.027 544.015 569.736 481.381 445.397 -7,45 -7,48 Value (US$ 1000) 1.780.833 1.912.926 2.103.471 2.258.920 2.708.678 11,17 19,91 Shrimp 892.452 948.121 1.115.963 1.029.935 1.220.428 8,68 18,50 Tuna, Skipjack 243.938 245.375 250.557 304.348 337.896 8,80 11,02 Pearl 5.866 10.735 13.409 12.644 12.694 25,65 0,39 Seaweed 25.296 57.515 49.586 57.522 105.639 53,31 83,65 Others 613.281 651.180 673.957 854.470 1.032.021 14,31 20,78
Note : *) Temporary numbers
a. General Potential of Fishery in Indonesia
The potential of marine fish resource commodities and their regional distribution in
Indonesian waters are described as follows (BE Priyono, et al., 1997):
Big pelagic fish resources
The big pelagic fish species of madidihang, big eye tuna, albacore can be found in the
waters of west Sumatra, south of Java, Bali and Nusa Tenggara, Banda Sea, Flores

16 | I C C S R
Sea and Makassar Strait, Molucca Sea and Gulf of Tomini, Celebes Sea and north of
Irian Jaya, as well as Arafura Sea. As for the bluefin tuna species, it can be found in
the waters south of Java, Bali and Nusa Tenggara, Banda Sea, Flores Sea and
Makassar Strait, and the Maluku Sea and the Gulf of Tomini. The tuna fish species of
skipjack can be found almost everywhere in the waters of Indonesia except in the
Java Sea, Malacca Strait and South China Sea. The Tongkol fish can be found near
the coast in all parts of Indonesian waters. Fishing season for all the above fish
species is throughout the year.
Small pelagic fish resources
The most widely spread small pelagic fish is of the lemuru type, consisting of lemuru
fish species (Sardinella lemuru) and siro fish, which spread from the west seas of
Sumatra, South Java, and Nusa Tenggara and concentrate in the Bali Strait. Another
type of small pelagic fish is the layang fish which mainly concentrates in the northern
and southern seas of Sulawesi and Java Sea, while the kembung fish can be found
mainly in southern, western, and eastern seas of Kalimantan, Malacca Strait and the
western seas of Sumatra.
Teri fish can be found in the western waters of Sumatra, Malacca Strait, the southern
and north eastern seas of Sulawesi and Sumatra, while tembang fish are found
especially in the southern waters of Sulawesi, Java Sea, Bali / NTT / East Timor,
eastern and southern seas of Sumatra and the sea nearby West Kalimantan. Julung-
julung fish are found in the waters of Maluku and Irian Jaya.
Demersal fish resources
Demersal fishes live near sea bottom of waters with a depth of less than 100 m; they
like to live in the waters which are relatively flat and muddy. The water which are
expected to have high potential resource of demersal fish is in the Gulf of Tolo
(Central Sulawesi) as the water there is relatively shallow and wide, and also in the
Arafura Sea where there is a very large capture areas of demersal fish, as well as in the
northern waters of Papua.

17 | I C C S R
Shrimp resources
The best potential of panaeid shrimp resources in Indonesia can be found in the
Arafura Sea, while the largest potential of reef shrimp is in the Indian Ocean.
Consumptive fish resources in reef waters
Consumptive fish resources in reef waters have not been widely exploited, it is still
limited to some accessible areas and for particular communities. Only few species are
already intensively exploited as high commercial values, such as easy to be captured
and high density fish such as yellow tail fish and bananas fish (Caessionidae). The
largest potential of reef fish in Indonesia can be found in southern Sulawesi.
It is known that the level of exploitation of fish resources in the western part of the
Indonesian waters, especially in coastal zones, has approached the maximum levels
of its carrying capacity- some resources are even excessively exploited. On the other
hand, most of the fish resources off the coast, in the eastern part of Indonesian
waters, and in the Indonesian ZEE have not been optimally exploited.
b. Primary Productivity As Indicators For Fisheries Locations
To support the marine fisheries industry, it is very important to have knowledge of
where the fish are gathered. These locations are an aquatic area with high fertility
level indicated by primary productivity. The higher the primary productivity, the
higher the fertility level.
According to Nybakken (1992), primary productivity is the rate of formation of the
energy-rich organic compounds from inorganic compounds. The primary
productivity is the equivalent of photosynthesis, although a small number of primary
productivity is produced by chemosintetic bacteria. Photosynthesis is the basis of
most marine production. Among the plants in the ocean, phytoplankton takes the
largest part of the energy, although it lies only as a thin layer at the surface of the
water where there is enough sunlight.

18 | I C C S R
Primary productivity is influenced by three factors: light, nutrients, and
oceanographic factors which will be described below.
Light factor
Phytoplankton is only found in top layers where the sunlight intensity is sufficient for
photosynthesis. In the tropical oceans the sunlight can penetrate into the depths of
100 to 120 m such that the photosynthesis is still likely to occur (Nybakken, 1992).
Nutrients substances factor
Major inorganic nutrients that are needed by phytoplankton to grow and reproduce
are nitrogen (as nitrate, NO3-) and phosphorus (as phosphate, PO42-). Those two
main elements are very important because their concentrations in the sea are
relatively small and therefore become limiting factors for phytoplankton productivity.
The most fertile oceans contain only 0.00005% of nitrogen, the amount is equal to
1/10,000 of the amount of nitrogen contained in the soil (Nybakken, 1992).
Nutrients can only be used on photic zone to become a very significant inventory
and it can increase the production.
Oceanographic factors
A very large amount of nutrient locates below the photic zone. These nutrients can
only be utilized if there are oceanographic factors such as upwelling (displacement of
water mass from beneath to the surface layer) which can raise the nutrients to the
photic zone. Results of the research carried out in various locations in Indonesian
waters (Nontji, 1993) showed that the upwelling has been known and proven in
some areas, but in some others it is still an estimate and needs to be further
investigated (Figure 2. 5).

19 | I C C S R
Figure 2. 5 Distribution of upwelling areas in Indonesian waters (Nontji, 1993)
c. Time Pattern of the Potential Fishing in Indonesia
Upwelling areas in Indonesia always shifted according to changes of wind patterns
due to monsoonal climate that affect Indonesian waters. According to Susanto
(2000), upwelling areas in the west ocean of Sumatra up to the south ocean of Java,
Bali and Nusa Tenggara are affected by two seasons, i.e. southeast and northwest
monsoons, in normal conditions.
During the southeast monsoon (May to September) the southeast wind moves
parallel to the south coast of Java Island coming from Australia. This wind causes
movement of surface water mass offshore ward in the south coast of Java. As a result
there is a lack of surface water mass in most of the south coast of Java so that, as
compensation, the water mass from the bottom moves upward (upwelling) to replace
the surface water mass deficiencies. The movements of bottom water mass are surely
accompanied by a rise of nutrients into the surface inducing the high primary
productivity in the area. This event intensively begins around May-June in the south
coast of East Java. Between August to October, the southeast monsoon winds are
intensified. Strengthening of this southeast wins causes the upwelling center to move
to the west coast of Sumatra. Upwelling center is then located around the Enggano
Island.
20 | I C C S R
In other areas, there are also temporary upwelling areas in the Makassar Strait
(Wyrtki, 1961). During the southeast monsoon winds, the sea water mass from
Flores meets with the mass of water coming out of the Makassar Strait, and move
together to the Java Sea. This situation causes the water from the lower layer of the
Makassar Strait moving upward to replace the water mass deficiencies. This situation
is characterized by high surface salinity in June and July.
2.3. Current Conditions and Problems of Marine and Fisheries Sector
2.3.1. Conditions of Marine and Fisheries Sector
The environmental condition of the marine and fishery sector can be observed from
marine, coastal and small island ecosystems because of its influences on the levels of
resource productivity (KKP, 2005). These ecosystems contain coral reefs, mangroves,
seagrass, estuary, and marine aquaculture. In general, these ecosystems have suffered
the physical degradation up to a level that threats the resource sustainability. For
instance: coral reefs which spread over an area of more than 60,000 km2 have been
damaged by up to around 40%. Some of the factors are: (i) human activities (fishing
with destructive devices, pollution, over-exploitation, etc.), and (ii) natural factors
(El-Nino and La-Nina, hurricanes, earthquakes, and floods). Similarly, mangrove
forests have reduced from 5.21 million ha to 2.5 million ha in a 12 year period (1982-
1993), partly because of land conversion to aquaculture ponds, especially in southern
parts of Sumatra, southern parts of Sulawesi and East Kalimantan, and to industrial
areas, especially in Java and Bali.
The social set up of the marine and fisheries sector is dominated by fishermen, fish
farmers, and other coastal communities. Public awareness about the development of
this sector is marked by increases in participation and collaboration between
government and local government with various parties such as the coastal
communities themselves, NGOs, universities, and media.

21 | I C C S R
2.3.2. Problems of Marine and Fisheries Sector
In general, the marine and fisheries sector faces two internal problems: the
inoptimality of management and the development of the sector in terms of captured
fisheries, cultured fisheries, utilization of small islands, marine conservation, non-
conventional marine potential and the weakness of law enforcement when it comes
to illegal fishing. The sector also meets external problems, especially arising from the
lack of national awareness about the importance of marine resources for national
prosperity. This can be seen in the form of unsupportive policies on monetary, fiscal,
investment, spatial planning, pollution control, law certainty and law enforcement.
The consequences , especially in coastal waters, are degradation or deterioration of
coastal environment habitats caused by domestic and industrial pollution, over-
exploitation of marine resources (over-fishing), losses of coral reefs, mangroves,
reclamation activities, dredging and erosion. Other consequences are settlements or
resource exploitation activities such as deforestation and mining. Other issues relate
to a decline in value or losses of historical, archaeological and cultural heritage caused
by the construction of hotels and other development activities.
Pollution in coastal zones from river catchment area is generally caused by sediments
from erosion due to deforestation and mining, waste from residents and run-off
from agriculture, pesticide residues from agriculture and aquaculture, the operation
of ships, oil spills from ship collision and oil drilling rigs, thermal pollution from
power plant emissions channels, industrial waste water pollution. The burden of
pollution is highly correlated with the density and the level of agricultural
productivity, including livestock and ponds.
Excessive fishing in the coastal waters or even in the off shore (open ocean) is
common in high population areas. The over-fishing is usually indicated by the failure
of catch per unit of effort. Another cause of fish stock decline is the degradation of
ecosystems as a place to support fish breeding. Losses of mangrove forests as a
breeding ground for fish and shrimp and destructions due to unsustainable fishing
techniques such as the use of dynamite and cyanide also contribute to the decline of
the quality of fishing grounds.

22 | I C C S R
Coral reef degradation is caused by destructive explosion fishing techniques,
pollution and others. Mining of coral reefs cause damages and losses of wave
absorber which eventually cause erosions of the beach and changes of the seabed
profile. The causes of coral reef damages are: (1) Tourism activity: the damages due
to the anchors of visitor boats, being trampled or taken as tourism souvenirs, (2)
Pollution: damages due to sedimentation carried by rivers, eutrophication
(overfertilization) carried by sewage from hotels or housing on the coast,
sedimentation caused by offshore mining, (3) Fisheries: damages due to fishing by
using bombs or poison causing the death of coral reefs, (4) Development: damages
due to mining for materials/building materials.
The losses of mangrove forest are primarily caused by the conversion into ponds,
rice fields, ports and other development activities.
Degradations of coastal environments, which are generally caused by the pressures
stemming from the activities for the fulfilment of human needs, are worsened by
climate change. This degradation can alter the coastal and marine environment
containing significant biota and biodiversity.
2.4. Current Capacity in Responses to Climate Change
Capacities required to cope with climate change issues affecting the marine and
fisheries sector include human resources, research activities, and policies.
2.4.1. Current Institutional Response
At the political and policy levels the Indonesian Government has shown strong
commitment in anticipation of climate change issues by organizing the United
Nations Framework Convention on Climate Change (UNFCCC) in Bali in
December 2007 that produced the Bali Road Map. This result was then followed up
by the implementation of the World Ocean Conference (WOC) in Manado, on May
14, 2009. This ocean conference has produced some agreements included in the
Manado Ocean Declaration (MOD) taken up by 74 countries and 13 international
agencies.

23 | I C C S R
Some of the agreements set out in the MOD include:
• Need for a national strategy in the management of sustainable coastal and
marine ecosystems as an attempt to reduce the impact of climate change.
• Need for the implementation of an integrated coastal and marine management
system to reduce risk and vulnerability for coastal communities and
infrastructures.
• Need for an integrated and sustainable scientific research and monitoring of
oceanas well as awareness building on hte community level.
At a technical level, the Ministry of Marine Affairs and Fisheries (KKP) has actually
played a role in managing climate change adaptation actions for the marine and
fisheries sector. This role becomes apparent when considering several points of the
Strategic Plan 2005-2009 (KKP, 2005). For an example, the third mission
(maintaining carrying capacity to improve the environmental quality of marine and
fisheries resources; see Table L.2) is initially directed to anticipate environmental
issues, but it has also included some climate change issues. Some of the main
activities are also associated with climate change adaptation strategies which include
(1) the management and development of marine conservation, the rehabilitation of
damaged ecosystems habitats such as coral reefs, mangrove forests, seagrass, and
estuarine; (2) marine, coastal and small island spatial planning; (3) maintenance and
improvement of the management of marine, coastal and small island ecosystems; and
(4) improvement of safety, mitigation of sea natural disasters, and forecasting of
ocean climate.
Similarly, the first mission, that is improving the public welfare of fishermen, fish
farmers, and other marine and fisheries businessmen, and the second mission of
improving the role of marine affairs and fisheries sector as a source of economic
growth, had supported and strengthened the adaptation efforts to climate change.
Some of the main activities are also relevant to adaptation strategies including: (1)
empowerment of marine and fisheries communities; (2) increase of public
participation in monitoring; (3) dissemination and assimilation of the results of

24 | I C C S R
research and development of the marine and fisheries science and technology; (4)
development of the ocean, brackish, and freshwater cultured areas; (5) development
of fishing ports and boats; monitoring of marine and fisheries resources; (6)
empowerment of small island communities and facilitating the integrated
management of coastal zones; (7) increases in the resource capacities of marine and
fisheries researches.
In Strategic Planning of 2010 – 2014, the Ministry of Marine Affairs and Fisheries
have highlighted strategic objectives that also respond to climate change. One of the
objectives is to manage marine resources and fisheries in a sustainable way, through
utilization of the natural resources in an optimal way, conserving species and areas,
managing small islands, and preventing destructive and illegal activities.
The Directorate General of Marine, Coastal, and Small Islands of Ministry of Marine
Affairs and Fisheries has responded to many issues concerning climate change. The
task of this working unit has a more territorial and cross-sectoral focus, besides
working towards the conservation of coastal, marine, and small islands. This ministry
has conducted some responses related to climate change issues such as:
• MCRMP Program (Marine and Coastal Resource Management Project), that aims
to improve the ability of the Provincial and Regency/City Governments in
conducting the functions and responsibilities to explore, utilize and manage the
natural resources in coastal and ocean within each responsible territory. This
program has been conducted in the year 2001 - 2009 in 15 provinces in Indonesia
(source: http://www.KKP.go.id/index.php/ind/menu/31/MCRMP).
• COREMAP (Coral Reef Rehabilitation and Management Program) is a program
aiming to save the coral reefs ecosystem by mapping the existing conditions,
preserving and rehabilitation activities through monitoring and dissemination to the
stakeholders, by strengthening organizations and others. This program has been
implemented in several provinces such as, Riau, North Sumatra, West Sumatra,
South Sulawesi, Riau Islands, East Nusa Tenggara and Papua (Source:
www.coremap.or.id).

25 | I C C S R
Similarly, the KKP annual programs held in all provinces have supported the
adaptation attempts to climate change, such as programs of coastal and marine
ecosystem rehabilitation as well as small island conservation and empowerment.
2.4.2. Current National Regulation and Policy Framework
Several laws and regulations which are relevant to climate change adaptation for the
marine and fisheries sector are as follows:
• Law Number 27 Year 2007 on Management of Coastal Zones and Small Islands
Laws
• Law Number 26 Year 2007 on Spatial Planning
• Law Number 24 Year 2007 on Disaster Recovery
• Law Number 17 Year 2007 on Long Term Development Plan 2005-2025
• Law Number 16Year 2006 on Agriculture, Fishery, and Forestry Counseling
Systems
• Law Number 32 Year 2004 on Local Government
• Law Number 31 Year 2004 on Fisheries as revised in Law No. 45 Year 2009
• Law Number 25 Year 2004 on National Development Planning System
• Law Number 7 Year 2004 on Water Resources
• Law Number 20 Year 2003 on National Education System (Human resources).
• Law Number 18 Year 2002 on Marine Research and Development (Ocean Law
and Inforcement)
• Law Number 23 Year 1997 on Environmental Management
• Law Number 6 Year 1996 on Indonesian Waters.
• Law Number 21 Year 1992 on Shipping.
• Law Number 9 Year 1990 on Tourism (Coastal Tourism).
• Law Number 5 Year 1990 on Conservation of Natural Resources and Its
Ecosystem
• Law Number 17 Year 1985 on
• Law Number 5 Year 1984 on Industry (Marine Industry).
Ratification of UNCLOS 1982 in Indonesia
• Law Number 15 Year 1983 on Indonesia Economic Exclusive Zone.
• Law Number 1 Year 1973 on Continental Shelf .
26 | I C C S R
• Law Number 11 Year 1967 on Mining (Marine Mining).
• Government Regulation Number 23 Year 2008 on Participation of International
Organizations and Foreign non-Governmental Organizations in Disaster
Recovery
Government Regulations
• Government Regulation Number 21 Year 2008 on Implementation of Natural
Disaster Recovery
• Government Regulation Number 8 Year 2008 on Stages and Guidelines in
Development, Controlling, and Evaluation of Implementation of Regional
Development Plan
• Government Regulation Number 38 Year 2007 on Distribution Of
Governmental Responsibilities between Central Government, Provincial
Governments, and Regency/City Governments
• Government Regulation Number 27 Year 1999 on Environmental Analysis
Assesment
• President Regulation Number 5 Year 2010 on Medium Term National
Development Planning (RPJMN) 2010-2014.
• President Regulation Number 8 Year 2008 on National Disaster Recovery
Agency
• President Regulation Number 81 Year 2005 on Ocean Safety Coordination
Agency
• President Regulation Number 32 Year 1990 on Protection Management of the
Protected Areas
• Regulation of Minister of Environment Number 5 Year 2000 on Guidelines for
Environmental Analysis of Wetland Development Activities
As the lack of laws and regulations which govern specifically and directly the
adaptation and mitigation to climate change, the implementation may refer to Law
No. 24 of 2007 on Disaster Management and Law Number 27 Year 2007 on the
Adjustments due to Unavalaible Law and Policy

27 | I C C S R
Management of Coastal Zones and Small Islands that is binding for the national
government, local governments and communities.
Disasters caused by climate change do not always have the same or similar
characters to the ones that are targetedby the laws and reguations above because
government regulations and policies nowadays still take assumption that natural
disasters are always massive and sudden, such as floods, hurricanes, storm waves,
tsunamis, and so on. But in fact, hazards induced by climate change can occur slowly
(slow onset) such as temperature increases and sea level rises.
To accommodate the peculiarities of the characteristics of natural disasters induced
by climate change, it is necessary to formulate new regulations and policies
concerned with adaptation and mitigation of climate change and/or to adjust existing
laws and policies mentioned above.
2.5. Climate Change Hazards and the Marine and Fisheries Sector
Ocean waters covering approximately 71% of the earth surface play an important
role as a receiver, storage, and distributor of heat absorbed from solar radiation
through the ocean currents circulation system from the equator region towards the
poles. Thermohaline circulation becomes an energy storage system in which heat
energy received by the surface sea water transported and distributed into the deep
ocean for thousands of years. Through this distribution of heat energy the
evaporation of sea water occurs so as to disburse the latent heat energy into the
atmosphere and stimulate the hydrological cycle that can generate storms and
cyclones.
Temperature affects the sea level rise, both directly through control of heat and
indirectly through the reflection of heat energy from the atmosphere so that it affects
icebergs, polar ice, and the hydrologic cycle. The absorption of carbon dioxide by the
ocean is naturally able to compensate the heat energy from the atmosphere.
The equilibrium system between the ocean and the atmosphere is recently disturbed
by human activities which led to increases of production of greenhouse gases, leading

28 | I C C S R
to global climate change. Climate change may trigger some natural hazards in the
marine and coastal environments which are identified and reviewed by the Working
Group I of the Intergovernmental Panel on Climate Change (IPCC-WG1) as follows:
1. Seawater temperature increases (for further coded: KTPL)
2. Increases in frequency and intensity of the extreme weather events (storms,
cyclones) (code: PKCE)
3. Changes in the patterns of natural climate variability (El-Nino, La-Nina, IPO),
leading to further hazards in the forms of:
• Changes in rainfall and river flow patterns (code: PVI-CH)
• Changes in wind circulation and ocean current patterns (code: PVI-AAM)
4. Sea level rises (code: KML or SLR)
The above hazards may interact with each other: an area may suffer various climate
forces or hazards induced by climate change at the same time.
Australian Greenhouse Office (2005) describes the influence of climate change on
hazards that will arise in the coastal and marine areas as shown in Figure 2.6 in the
form of:
• storms that affect rainfall and surface runoff,
• storms associated with wind and pressure, and
• sea-level changes (seasonal variability, ENSO and IPO).
The changes mentioned above affects: (A) the supply of sediment, (B) waves and
swell, (C) currents, (D) storm tide, (E) changes in sea level. Meanwhile, other external
factors that are not directly related to climate change are tide and (F) tsunami, where
the tides are generated by the gravitational forces of outer space objects, especially
the moon and sun, while the tsunami wave is generated by tectonic activity,
volcanism, and submarine landslides. All the elements of (A) to (F) are subject to
review in analysis of the hazards that may occur in coastal and ocean areas.

29 | I C C S R
Figure 2. 6 Interrelation between one hazard to the others triggered by climate
change upon the marine and fisheries sector (adopted from Australian Greenhouse Office, 2005)
2.5.1. Increase of Air and Sea Surface Temperatures
Ocean and atmosphere interaction occurs in at different time scales in controlling
both, the air and sea surface temperatures. These time scales vary from daily (day and
night), seasonal, inter-decadal (10 years) until century (100 years). The rate of air
temperature increases can be observed by analyzing the trend of data, as conducted
by Diposaptono (2009) for the cities of Jakarta and Semarang (Figure 2. 7), where an
average increases in air temperature from 25.5oC to 27.5oC, or about 3.0oC for the
time span of 125 years (1865-1990) can be observed (or an increase rate of air
temperature of about 0.024oC / year).

30 | I C C S R
Figure 2. 7 Trend of increasing air temperature in Jakarta and Semarang
An Analysis of the increase of sea surface temperature (SST) has also been
conducted by several researchers such as:
• Levitus et al (2000) examined and analyzed the approximately 5 million SST
profile data at depths of 0-300 meters (up to 3000 meters depth) and showed that
there was an increase in global SST around 0.31oC between 1948-1998, or the rate
of SST increase is 0.0062 oC/year which means that it already occured since the
end of World War II.
• Aldrin (2008) showed an upward trend of SST at some stations in the central and
western regions of Indonesian waters (Figure 2.8.a) with the measurement results
are shown in Figure 2.8.b, the rates of SST increase vary for each station with the
increase varying from 0.008 oC/year in Halmahera until 0.0268 oC / year in
Makassar (Fig. 2.8.c).

31 | I C C S R
Figure 2. 8 Mooring point position of sea temperature measurement, b) sea surface temperature measurement results and (c) Temperature increase rate for every station
(modified from source: Aldrin and Arifian, 2008)
• Sofian (2009) used a model of SST increase projection based on the NOAA OI
data (Figure 2.9) and on the IPCC SRESa1b (IPCC, 2007) using the
MRI_CGCM3.2 model (Figure 2.10). The figures show the existence of sea
temperature rise on average by 0.65oC, 1.10oC, 1.70oC and 2.15oC in 2030, 2050,
2080 and 2100, respectively, relative to the temperature in 2000. The highest
increase SST trends occur in the Pacific Ocean, north coast of Papua, while the
lowest ones occur on the south coast of Java Island.

32 | I C C S R
Figure 2. 9 The trend of sea level rise according to NOAA OI data, where the
highest increase is expected to occur in Pacific Ocean, at the north of Papua, while the lowest ones is expected at the southern coast of Java Island
Figure 2. 10 Trend of SST rise based on IPCC SRESa1b (IPCC, 2007) using
MRI_CGCM3.2 model (Sofian, 2009)
• Then NOAA PMEL (2003) in Diposaptono (2009) presents a SST variation
(black line) and SST increase trend (blue line), and the temperature threshold of
the coral bleaching (red line) in Raja Ampat, Papua. If seasonal SST passes the
threshold line, then coral bleaching will occur (such as in 1992 and 1998), but
these reefs will recover in normal conditions. But if the trend of SST (blue line)
continues to increase in the future and passes the threshold temperature (red line),
then the coral reefs permanently bleach.
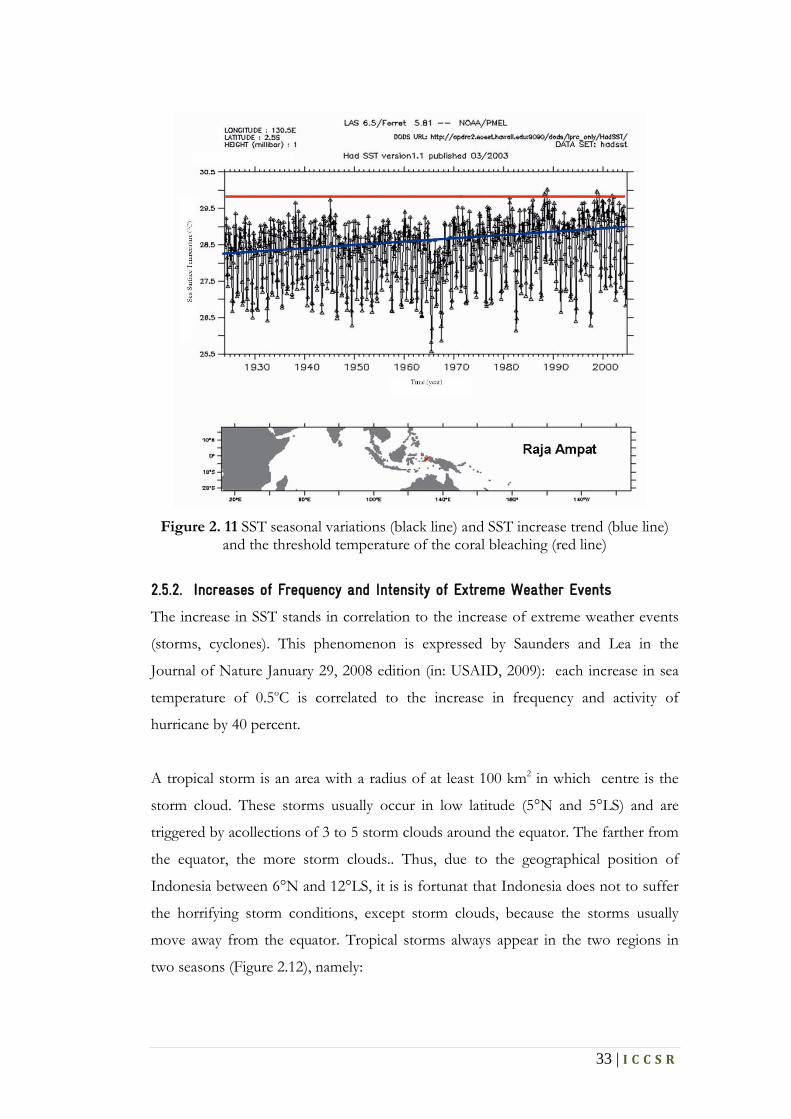
33 | I C C S R
Figure 2. 11 SST seasonal variations (black line) and SST increase trend (blue line)
and the threshold temperature of the coral bleaching (red line)
2.5.2. Increases of Frequency and Intensity of Extreme Weather Events
The increase in SST stands in correlation to the increase of extreme weather events
(storms, cyclones). This phenomenon is expressed by Saunders and Lea in the
Journal of Nature January 29, 2008 edition (in: USAID, 2009): each increase in sea
temperature of 0.5oC is correlated to the increase in frequency and activity of
hurricane by 40 percent.
A tropical storm is an area with a radius of at least 100 km2 in which centre is the
storm cloud. These storms usually occur in low latitude (5°N and 5°LS) and are
triggered by acollections of 3 to 5 storm clouds around the equator. The farther from
the equator, the more storm clouds.. Thus, due to the geographical position of
Indonesia between 6°N and 12°LS, it is is fortunat that Indonesia does not to suffer
the horrifying storm conditions, except storm clouds, because the storms usually
move away from the equator. Tropical storms always appear in the two regions in
two seasons (Figure 2.12), namely:

34 | I C C S R
• In the southern parts of Indonesia during the rainy season, particularly in the
Indian Ocean from south-west, south to southeast parts of Indonesia, and
• In the northern parts of Indonesia during the dry season, especially around the
South China Sea and the western part of the Pacific Ocean
Although parts of Indonesia are not directly affected by the cyclone storm, the tails
of the storm and the generated waves often crash onto coastal zones exposed to the
Indian Ocean, South China Sea, Western Pacific and Banda Sea.
Figure 2. 12 Area of tropical cyclones (red shade). These cyclone do not occur in
Indonesia, but the impacts of hurricane and strong wind are still suffered. (BBU= North of Equator, BBS=South of Equator)
Track path of tropical storms in the Indian Ocean provided by BOM Australia
(2006) is shown in Figure 2.13.
Figure 2. 13 Tropical cyclone track in Indian Ocean (BOM Australia, 2006)

35 | I C C S R
Generally, tropical cyclones occur in the west wind season and in the transition to the
east wind season (December-April), with the most occurrences in January and
February (T.W Hadi, 2008). This seasonal pattern causes extreme weather events to
be affected by the global climate change: this pattern is recently "disturbed" by the
more frequent occurrences of El-Nino and La-Nina. During El-Nino events,
potential areas of tropical cyclones in the western Pacific are likely to be shifted
eastward, away from the Indonesian waters. Furthermore, tropical cyclones occur
more often during the La-Nina events as sea surface temperature increases.
Tropical storm conditions can cause irregular natural condition. A storm cloud could
be called an extreme event if following phenomena are present :
• High-intensity heavy rain (storm rain), which may cause collateral effects such as
flooding and infrastructure damages.
• Rotating and direction-changing winds with speeds in between 60-350 km/h
(storm wind) that can cause house roofs to fly, knock trees and billboards down,
and disturb the marine transportation system.
• Storm surges generated by tropical storms that can cause large waves and
propagate to coastal zones, such as Jacob storm occurred in 2007. This storm
struck the southern coast of Java, Bali and Nusa Tenggara and impacted damages
on coastal zones, caused coastal erosion, disrupted the navigation, fishermen
were unable to go for fishing. Through numerical modeling, Ningsih (2009)
indicated increases of mean sea level (MSL) of approximately 50 cm during the
storm (Fig. 2.14).

36 | I C C S R
Figure 2. 14 Storm wave height distribution from model simulation results in
southern coast of Java Island (N.S. Ningsih, 2009)
In coastal zones, elevation of the mean sea level is influenced by storm waves and
will increase in the presence of wind waves triggered by monsoon. The wind wave is
considered to represent (proxy for) the storm surge hazard, because the waves height
depends on wind speed. Seasonal patterns of wind waves in January represent the
events of west monsoon (Figure 2.15.a) while the ones in August represent the east
monsoon conditions (Figure 2.15.b). Meanwhile the maximum waves generally occur
in December as shown in Figure 2.15.c. Wave data illustrated in Figure 2.15 are
obtained from Altimeter Significant Wave Height (SWH) from January 2006 until
December 2008 (Sofian, 2009).

37 | I C C S R
a. January
b. August
c. Maximum waves in December
Figure 2. 15 The mean waves height in January (a) and August (b), and the maximum waves (Sofian, 2009)
2.5.3. Changes inRainfall Pattern and Freshwater Runoff Induced by changes in
the Climate Variability Pattern
Rainfall and freshwater runoff patterns are generally controlled by the monsoon
circulation system containing two main seasons namely the rainy and dry seasons.
Based on the peak period of the rainy season, there are three types of climate regions
in Indonesia (Tjasyono, 1999).: (1) monsoonal type (one peak rainy season between
December-Jan-February), (2) equatorial type (two peaks in around April-May and
October - November), and (3) local type (one dominant peak around June-July)
(Figure 2.16).

38 | I C C S R
Figure 2. 16 Rainfall pattern in Indonesian area: (A) monsoonal type, (B) equatorial
type, (C) local type (Tjasyono, 1999)
The observation of rainfall and air temperature data of the Lombok island show that
the pattern of rainfall and air temperature has changed as given by Hadi, TW. (2008)
on Figure 2.17
(a) Rainfall (b) Air temperature
Figure 2. 17 The phenomenon of change in rainfall patterns (a) and air temperature (b) on Lombok island (Hadi, TW., 2008)
The current rainfall patterns in Lombok Island (1991-2007) are relatively different
from the previous ones (1961-1990) where current rainfall in December is much
lower than in the previous period, the opposite being true for March-April. Air
temperature patterns also change as there is an increase of about 0.5oC - 1oC (1991-

39 | I C C S R
2007) compared to the previous one (1961-1990), especially in November-April,
while the air temperature patterns from May to October are relatively unchanged.
Analysis results provided by Sofian (2009) in Figure 2.18 show that high rainfall
occurs in January with a range between 250 mm to 400mm in almost all regions in
Indonesia. While in August the rainfalls in Indonesia are low, especially in the south
of the equator, with a total rainfall below 50 mm/month.
(a) January (b) August
Figure 2. 18 Annual cycle of mean rainfall in Indonesia in January and August.
Monsoonal or seasonal wind patterns could be influenced by El-Nino and La-Nina
phenomena. Both phenomena are explained in the reports on scientific basis by
Sofian (2009). Rainfall patterns of seasonal average above can be considered to
represent (proxy) flooding or drought hazards due to La-Nina and El-Nino
phenomena.
At this moment the two types of climate variability more frequently occur. In the
past, El Nino cycle was about 4-7 years, but in the period of 1990-2006 the
phenomena occurred 6 times. The more frequent El-Nino and La-Nina phenomena
are also seen from the model projection in the years 2010-2030 (Sofian, 2009), even
both may occur simultaneously in a year (Table 2.2).

40 | I C C S R
Table 2. 2 Projected incidence of El-Nino and La Nina using SRES a1b scenarios (Source: Sofian, 2009)
Year Jan Feb Mar Apr May Jun Jul Aug Sep Oct Nov Dec
2010 0,98
0,56 1,18 1,48 1,23 1,44 1,74 1,56 1,86 1,93 2,11
2011 1,98
1,91 1,63 1,28 1,53 2,21 1,99 2,24 2,40 2,73 3,06
2012 2,75
2,37 1,61 1,00 0,83 1,18 1,59
2013 1,45
1,22
2014 2015
2016 1,09
2017 1,09
1,18 1,30 0,68 0,95 1,33 1,09 1,67 1,91 2,00 2,09 2,20
2018 1,93
1,97 1,80 1,36 1,09 2,24 1,65 1,74 1,94 2,23 2,36
2019 2,50
2,25 1,85 1,39 1,19 0,73 0,50 0,73
2020 1,03 1,26 1,13 1,41 1,71 2,28 2,16 2,35 1,8
7
2021 1,51
1,54 1,50 1,09
2022 1,1
9
2023 1,40
1,32 1,05 0,63 1,13 1,04 0,92
2024 1,33 1,25 1,31 0,95 0,85 1,03
2025 0,53 0,70 0,5
0
2026 0,73
0,71 1,23 1,87 1,59 1,64 1,43
2027 1,38
2,00 1,91 1,49
2028
2029 1,37 1,47 1,94 2,25 1,92 1,2
4
2030 0,92
0,80 1,11 0,89 0,77 0,79
Remarks: El-Nino La-Nina Normal Climate

41 | I C C S R
The table above states that according to the prediction,the El-Nino and La-Nina
phenomenon will occur with rhythm as follows:
• Between 2010 - 2012: El-Nino and La-Nina alternate for 1 year
• Between 2017 - 2021: El-Nino and La-Nina alternate for 1 to 3 years
• Between 2023 - 2027: El-Nino and La-Nina alternate for 6 to 9 months,
interspersed with normal periods.
• Between 2029 - 2030: El-Nino occurs within 1 year.
In general, changes in rainfall patterns and freshwater runoff have a potential to
induce some important changes in the physical environment such as:
• Changes in hydrological cycle (evaporation, precipitation, stream).
• Influence on water availability in coastal areas and small islands.
• Changes in ecosystems and coastal communities.
• Changes in sediment transport, nutrients, and pollutants.
• Change of water circulation in the estuary, in wetlands, and on the continental
shelf.
2.5.4. Changes of Ocean Current Circulation Induced by Changes of Climate
Variability Pattern
Oceans always interact with the atmosphere through transfer mechanisms of heat as
well as energy and momentum. The form of the heat transfer hase been discussed in
point 2.5.1 where greenhouse gas effects increase the atmospheric temperature.
There are two forms of energy and momentum transfer i.e.: (1) from surface winds
that are at the basis of propagations and ocean currents or movement (wave
generation has been discussed in point 2.5.2 where strong winds during storms or
cyclones can cause a storm surge), and (2) interaction between ocean and atmosphere
is realized by the interplay of surface wind (blowing just above the sea surface) and
ocean surface currents. However, wind patterns and ocean currents are also
influenced by other factors such as air and sea temperatures. Mechanisms of climate
variability such as ENSO (El-Nino Southern Oscillation) can affect these factors and
in turn can alter patterns of wind and current circulation in Indonesia.

42 | I C C S R
The wind circulation patterns and its changes
Indonesia is a maritime region flanked by two oceans (Indian and Pacific Oceans)
and two continents (Asia and Australia) so that the wind pattern dominantly
depends on monsoon or seasonal patterns (Figure 2.19). In presence of western wind
from October to March, weather conditions in Indonesia are influenced by the west
monsoon, the wind blows from the northeast and turns towards the southeast after
passing the equator. This stands in contrast to the east wind season from May to
September where the wind blows from the southeast and turns toward the northeast
after passing the equatorial region. The influence of the Pacific Ocean becomes
dominant in the period of western winds, except on most of western Sumatra, which
is influenced by the characteristics of the western Indian Ocean. In contrast to the
east wind season, the influence of Indian Ocean becomes dominant.
a. January
b. August
Figure 2. 19 Wind and average sea surface temperatures patterns in Indonesia in January and August (Sofian, 2009)
North wind propagation from October to March pushes the warm sea water pool of
the Pacific Ocean to the Indian Ocean so that most of Indonesian waters is warm.
In contrast to the east season from May to September, the eastern wind pushes back
the sea water with low temperatures from the Indian Ocean to Pacific Ocean
through the Java Sea, Karimata Strait and South China Sea, so that some of the
waters at the south of Indonesia are colder than the north.
Ocean currents circulation patterns and its changes
In general, Indonesia Throughflow pattern (ITF; Murray, Arief, 1988) can affect the
characteristics of the global climate through the mechanism of heat transfer between

43 | I C C S R
the Pacific Ocean and Indian Ocean through the Makassar Strait and the Lombok
Strait (Figure 2.20).
In January, when the west monsoon occurs, southwest wind cause the current in the
Java Sea flows to the east, and the current in the Karimata Strait flows to the south.
The current in the Sunda Strait flows to the east and enters the Java Sea, carrying
water mass from the Indian Ocean to Java Sea. The effect of topography with
shrinking and shallowing depth on the southern part of Karimata Strait may lead to a
difference in sea level by 40 cm between the Java Sea and the Strait of Karimata.
When the southeast monsoon or dry season occurs, the winds push the currents in
the Java Sea to the west and the ones in the Karimata Strait move to the north.
Waters on the surface of the Java Sea flows out to the Indian Ocean through the
Sunda Strait.
a. January b. August
Figure 2. 20 Distribution of sea water level and flow pattern in January and August. Sea water level and flow pattern are the monthly average for 7 years, from 1993 to
1999 (Sofian, 2009).
Unlike the flow pattern in the Java Sea and the Strait of Karimata, surface currents in
the Makassar Strait do not follow the pattern of the seasonal wind direction. These
currents tend to move to the south. The speed of surface currents in the Makassar
Strait is weak in the west wind, though the north wind is very intensive. Weak flow in
Makassar Strait surface is caused by the strong currents in the Java Sea surface
moving to the east, thus blocking the current flow in Makassar Strait surface. In

44 | I C C S R
contrast, the surface currents in the Strait of Makassar will be strengthened in the dry
season (south-east wind), and push saline surface water and low-temperature back to
the Java Sea. Strong surface currents in the Makassar Strait also cause decreases in
the sea level on the north coast of the Lombok Island, Flores Sea and eastern and
central Java Sea in August.
ENSO (El-Nino Southern Oscillation) variability patterns
Ocean and atmospheric conditions are strongly influenced by the ENSO phenomena.
In the phase of El Nino, or in a weakening trade wind (wind in the Pacific region
which moves to the east) a high gradient of Sea Surface Level (SSL) is caused, where
SSL at around Peru rises while the one in Indonesian waters decreases. The
weakening trade wind is also marked by the displacement of "warm water pool" out
of Indonesian waters towards the center of Pacific. In addition, the reduction in fresh
water flux (precipitation minus evaporation, PE forcing) decreasesSSL to the lowest
point. In this period, SSL in Indonesian waters, are approximately 20 cm below the
annual average (see Figure 2.21).
a. January

45 | I C C S R
b. August
Figure 2. 21 Spatial distribution of SSL and surface flow in January and August. SSL
based on altimeter data, while the direction and speed of currents is the result of estimation model HYCOM (Hybrid Coordinate Ocean Model) (Sofian, 2009)
In the La Nina phase, a process occurs inversely with the El Nino period. Trade
wind is strengthend causing the warm pool to move more to the west, increasing the
intensity of rainfall, which causes the increase of PE forcing. These factors may lead
SSL in Indonesia to rise more than 20cm (see Fig. 2.22). This condition causes a
variety of vulnerabilities, especially abrasion, erosion and shoreline change, which are
not only caused by high rainfall, but also due to the rising SSL.
Figure 2. 22 Time series of altimeter sea level anomalies (anomaly SSL) (1993 to
2008). SSL anomaly lowers down to 20 cm in strong El Niño period, and increases up 20cm in the strong La Niña period (Sofian, 2009).

46 | I C C S R
This global phenomenon is inversely proportional to the local phenomenon shown
in Figure 2.20 (a case in the Java Sea). During the period of El Nino, the trade wind
(west wind) in the Pacific weakens and east winds intensifies, while for the condition
in the Java Sea, the intensification of east wind is marked by increases of seawater
transport from Banda Sea and Makassar Strait (e.g. August 1997).
The influence of more significant global condition pushes the SSL down although
local phenomena due to the strong east winds try to raise SSL (raising the water mass
transport into the Java Sea in August 1998). During the period of La Nina the
opposite phenomenon occurs, i.e. the local west winds tend to strengthen and then
weaken the sea water entering through to Java Sea through Banda Sea, Flores and
Makassar Strait, as happened in August 1999.
From the above description wind patterns and sea water temperature as well as
current patterns and sea levels can be considered to represent (proxy) the hazards
induced by the phenomenon of ENSO events.
Upwelling and the Fishing Potential
Circulation of ocean currents and vertical water movements (both upwelling and
downwelling) can be influenced by global and local changes of temperature, salinity,
rainfall, and wind fields above sea level and also tides. Horizontal and vertical
movements of the water mass are closely related to the ecological properties of the
sea. Therefore, knowledge of space and time scale of the ocean currents circulation is
very important to understand the implications of global climate change on ocean
dynamics and marine biological resources, particularly marine fishing. Some marine
and coastal zones have potential productivity and high capture fisheries caused by
the upward movement of the sea water mass (upwelling) which raises nutrients from
the seabed. Changes in the current system that are influenced by global climate
change or due to ocean variabilities could increase or decrease the productivity.
Strong local eastern winds also cause a much more intense upwelling in the south
coast of Java Island which is indicated by a growing number of chlorophyll-a in
surface sea water as shown in Figure 2.23. At that time upwelling occurs more

47 | I C C S R
intensively so that the concentration of chlorophyll-a increases in the south coast of
Java Island, part of Sumatra, Bali and Lombok that reaches 4mg/m3. In the end,
during the El Nino phase, there are increases in potential captured fisheries along
with increases of concentration of chlorophyll-a, so that it becomes a measure of the
primary productivity.
a. January b. August
c. August 1997
Figure 2. 23 Distribution of average chlorophyll-a concentrations in January and
August, and in August 1997 in the event of El Nino (Sofian, 2009).
2.5.5. Sea Level Rise
Sea level rise is a hazard that has been much examined in climate change issues. This
hazard is the result of two main variables, namely thermal expansion or contraction
in the sea and the steric effects of the amount mass of water withdrawal that is
contained or trapped in the ice and snow around the poles. Projections of global sea
level rise can be seen in Figure 2.24 (Sofian, 2009). However if the ice mass changes
are considered, then the projected sea level rise can be seen in Figure 2.25 (Sofian,
2009)

48 | I C C S R
Figure 2. 24 Projected global sea level rise by SRESa1b IPCC (IPCC, 2007) with the assumption of CO2 concentration of 720ppm (Sofian, 2009)
Figure 2. 25 The increase in SSL until the year 2100, relative to SSL in 2000 (Sofian,
2009).
From the results of tidal data processing at several tide station in Indonesia and its
surrounding waters, an upward trend in sea level as shown in Figure 2.26 can be seen.
When the data are extrapolated to the year 2100 it is seen that the SSL increase
ranged 40-70 cm except in Manila, where it reaches 120 cm (Figure 2.27). The results
of this extrapolation is close to the model projections.

49 | I C C S R
Figure 2. 26 Examples of time-series SSL data from some tide stations in Indonesia
and its surrounding areas (Sofian, 2009).
Figure 2. 27 Projected sea level rise in some locations using observatory tide data obtained from the University of Hawai'i Sea Level Center (UHSLC) (Sofian, 2009).
Spatial distributions of the rate of sea level rise from the altimetry satellites and the
model can be seen in Figures 2.28 and 2.29, respectively (Sofian, 2009). The estimates
of sea level rises based on the altimeter, tide data and models, showed the same trend
with the average increases are about 0.6 cm/year to 0.8 cm/year.

50 | I C C S R
Figure 2. 28 SSL upward trend based on altimeter data from January 1993 until
December 2008 using spatial trend analysis (Sofian, 2009)
Figure 2. 29 Projected levels of sea level rise in Indonesian waters based on the IPCC SRESa1b scenario with assumptions of CO2 concentration by 750ppm
(Sofian, 2009)
Sea Level Rise in Indonesia (SRES)

51 | I C C S R
Figure 2. 30 Estimates the rate of SSL increases in Indonesian waters based on the
dynamic model with the addition of ice melting after IPCC AR4 (Sofian, 2009)
It is necessary to distinguish the sea level rise from the other fluctuations of sea
surface (ups and downs) at various time scales such as ocean waves (sea and swell)
generated by sea surface wind, tides caused by the gravitational forces of the moon
and sun, storm surges and storm waves that arise due to cyclones or storms at sea, as
well as due to climate variability of El Nino and La-Nina. However, the terminology
"relative increase in sea level" refers to sea level changes relative to the local ground
level at a particular location. Land surface can move because of isostatic reversal,
land subsidence, compaction and settling due to alluvial sediment accumulation in
estuary deltas, land subsidence from the extraction of water and oil, as well as other
factors such as tectonic earthquakes. Figure 2.31 and Figure 2.32 show the changes
of land surfaces (subsidence and uplift) due to earthquake activities.
Figure 2. 31 Examples of subsidence due to earthquake Nias in 2005 (Source: Danny NH)
Figure 2. 32 Examples of uplift due to Nias earthquake in 2005 (Source: Kerry Sieh)
Sea Level Rise in Indonesia (ice melting)

52 | I C C S R
2.5.6. Notes and Resume of the Hazard Analysis
Hazard projections induced by climate change up to the year of 2030 along with
other triggered hazards can be summarized in Table 2.3 below.
Table 2. 3 Summary of hazards and climate change projections
No Hazard Type Hazard Projection Other Induced Hazards
1 The increase in sea temperature
The average increase of 0.05°C± 0.65°C in the year 2030 to year 2000 (IPCC SRES a1b, Sofian, 2009)
---
2 Increases in frequency and intensity of the extreme weather events
Tropical cyclone generally occurs in the west wind season and the transition to the east wind season (December-April), which most often occurs in January and February (TW Hadi, 2008)
• Strong winds • Heavy rains river flood • storm wave • coastal erosion • Flood / beach inundation • Changes in sediment
deposition 3 Changes in
natural climate variability (El-Nino, La-Nina, IPO)
Projection EN and LN (Sofian, 2009): • 2010-2012: EN-LN 1 alternate
for the annual • 2017-2021: EN-LN alternate for
1 to 3 years • 2023-2027: EN-LN alternate for
6-9 months, interspersed with periods of normal.
• 2029-2030: EN occurs in 1 year
• Changes in wind patterns, especially in coastal and ocean areas
Changes in rainfall and river flows patterns: • River and estuary floodings • Long drought • Change the pattern of
ocean currents • The shift upwelling area • Changes in thermohaline
circulation • Flood / beach inundation
4 Sea level rise Trend increase in average from 0.6 to 0.8 cm / year (Sofian, 2009).
• Flood / beach inundation • Intensification of coastal
erosion • Changes in sediment
deposition • Intensification of salt
intrusion in ground water and river water
Natural hazards in the marine and fisheries sector induced by climate change can be
analyzed by considering :
a. The importance of using two parameters in general hazard analysis, i.e., the
impact intensity and frequency (probability) of hazard occurrence.

53 | I C C S R
b. The importance of using worst-case scenario in hazard analysis, especially when
the event could occur with a small probability but could cause a large impact.
c. Many studies have claimed that the effects of climate change such as sea level rise
can take place continuously with continuous increases in rate in the next few
centuries, arguing that the projections of climate change is a necessity.
d. The models used for estimation or projection of climate change need to be
justified or verified before the models will be applied on a more detailed scale.
e. An observable phenomenon can be a combination of several hazards, such as
changes in sea level that are not only influenced by sea level rise due to ice
melting at the poles, but also by storm waves, tidal, and ENSO (see Figure 2. 33).
Figure 2. 33 Scheme of the hazards associated with sea level rise (tsunamis are not
included in this case)
That last point could be used to assess the level of hazard induced by climate change
accumulatively. The assessment includes parameters of height and width of
inundation area in the coastal zone. These parameters were simulated to demonstrate
the hazards of climate change by comparing the future coastal conditions (year 2030)
to current conditions (baseline data in 2000), if the hazard of sea level rise continues
with a projected average increase of 12 cm on year 2030, and accompanied by other
types of hazards either separately or simultaneously (see Figure 2.33), namely:
• The hazard of extreme weather events are represented by storm surges that cause
increase in sea level with a maximum of about 3 meters of the MSL.
• The hazard induced by climate variability of La-Nina is represented by the
increase in sea level with an average prediction of about 10-20 cm.

54 | I C C S R
• The periodical hazard of the tidal phenomena that normaly occur once in about
19 years, when the moon is at perigee position (closest distance to Earth), in
which the water is at the highest level (perigee-spring highest tide) with a
maximum height of about 1-3 meters from mean sea level. As an illustration, the
distribution of tidal range (vertical distance between the highest tide and low tide
levels) in Indonesia can be seen in Figure 2.34 below.
Figure 2. 34 Tidal Range Distribution in Indonesia
As as note, the extreme weather events could also cause floods in coastal waters but
their height is difficult to predict quantitatively. This study analyzes the level of
hazard due to the accumulation of the combination of different hazard types
mentioned above through the three scenarios (Figure 2.35), namely
• Scenario-1 HHWL + SLR : if there is an increase in sea level during the highest
tides perigee (HHWL), accompanied by the global sea level rise (SLR)
• Scenario-2 HHWL + SLR + ENSO : if there is an increase in sea level during the
highest tides perigee (HHWL), accompanied by the global sea level rise (SLR)
and the occurrence of climate variability La-Nina (ENSO),
• Scenario-3 HHWL + SLR + SS + ENSO: if there is an increase in sea level
during the highest tides perigee (HHWL) and accompanied by the global sea level
rise (SLR), the occurrence of climate variability La-Nina (ENSO), and the storm
surges (SS). This scenario is the worst condition, although it occurs only with a
small probability.
Tidal Range Distribution Map
Tidal Range

55 | I C C S R
(a) Scenario-1 HHWL+SLR
(b) Scenario-2 HHWL+SLR+ENSO
(c) Scenario-3 HHWL+SLR+ENSO+ SS
Map of Sea Level Rise Hazard (1st Scenario)
Legend Inundation
Map of Sea Level Rise Hazard
(2nd Scenario)
Legend Inundation
Map of Sea Level Rise Hazard (3rd Scenario)
Legend
Inundation

56 | I C C S R
Figure 2. 35 Three scenarios of inundation of seawater in coastal hazards due to sea level rise, climate variability La-Nina, and a storm surge that each event is
accompanied by the highest tides perigee 2.5.7. Summary of Hazards Induced by Climate Change in Each Region
The following will describe the various hazards that would be induced by climate
change in every region in Indonesia. The simulation results of coastal inundation by
the sea waters (rob) in scenario-3 will also complete a brief analysis of the hazard
types that may occur in coastal zones in extreme conditions.
As a note, the results of this simulation are generally not very accurate because the
SRTM digital topographic data available for Indonesia has not been corrected locally
relative to the heights of canopy trees and buildings.
2.5.7.1. Region I Sumatra Island and Its Surrounding
Description of hazards induced by climate change in Region 1 Sumatra Island can be
seen in the following table.
Table 2. 4 Hazards induced by climate change in the region I
Hazard Type Description Figures Value Range
Increases in seawater temperature
Major trends occurred in the east coast (Malacca Strait), near the Riau Islands and Bangka-Belitung (0.025°C / year), while at the west coast a lower or even a negative trend may be observed near Bengkulu (-0.005°C / year)
Figure 2.9, Figure 2.10
-0,01 – 0,03°C/year
Increases in frequency and intensity of the extreme weather events (proxy: significant wind waves)
January: In general the maximum wave is 1 m, except on the coast of Bengkulu and Lampung which reaches 1.6 m August: 1 m waves occur only in the Strait of Malacca, while waves on the west coast to a maximum of 2 m
Figure 2.12, Figure 2.13,
0,4-2 meter
Precipitation changes by the change in climate variability (proxy: mean annual rainfall)
January: In general, rainfall may be more than 200 mm, an even more to the south with a maximum in Lampung around 450 mm. August: the opposite situation occurs, where rainfall has narrowed to the south with a minimum of 50 mm in Lampung
Figure 2.16 Figure 2.18
0 – 600 mm
Changes in surface wind circulation by changes in climate variability (proxy: patterns of mean annual surface wind)
January: The pattern of winds is different in almost every area. In the north and east of Sumatra wind blows from the northeast, while in the west and the south wind blows from the west - northwest. Average speed 5 m / sec.
Figure 2.19 0 – 10 m/s

57 | I C C S R
Hazard Type Description Figures Value Range
August: Most of the south of Sumatra , the wind is blowing southeast, while in Aceh and North Sumatra southwest wind occurs
Changes in ocean circulation currents by changes in climate variability (proxy: patterns of mean annual currents and sea level fluctuations)
Throughout the year: ocean currents on the west coast of Sumatra move south, while the sea is almost always at the level of about 10 cm below MSL. In the Malacca Strait, currents are moving north, while the sea level is about 5-10 cm above MSL. January: Flow around the Riau Islands and Bangka-Belitung is from the South China Sea to the Java Sea, the sea level is high enough about 40 cm above MSL. August: the current of the east coast of southern Sumatra turn north, where the sea level drops by about 10 cm above MSL.
Figure 2.20 Current: 0 – 1 m/s Sea Water Level: -40 – 50 cm relative to MSL= mean sea level
Sea-level rise Almost the entire coast of North Sumatra, Aceh and east coast of Sumatra's experiences an upward trend in sea level of about 0.75 cm / year. While the trend of increasing sea level on the west coast of West Sumatra down to Lampung is slightly smaller at around 0.745 cm / year
Figure 2.28, Figure 2.29, Figure 2.30
0,72 – 0,77 cm/year
Worst-case simulation results from a scenario combination of hazards that cause
inundation in the coastal zone of the Sumatra region that could be seen in Fig. 2.36.
In this worst condition the eastern coastal zone of Lampung, South Sumatra, Riau,
North Sumatra and Aceh suffer an inundation of more than three meters because
coastal zones are flat. The east coast of South Sumatra and Lampung are inundated
by sea water toward inland of about 100 km from the current shoreline.

58 | I C C S R
Figure 2. 36 Coastal Inundation Simulation in Sumatra Region
2.5.7.2. Region II Java-Madura-Bali Islands and Its Surroundings
Hazards description induced by climate change in the Region II Java-Madura-Bali
can be seen in the following table.
Table 2. 5 Hazards induced by climate change in the region II
Hazard Type Description Figures Value Range
Increases in seawater temperature
Small positive trend occures in the northern coast of Central Java to Jakarta (0.01°C / year), while along the southern coast notices a negative trend (-0.005°C / year)
Figure 2.9, Figure 2.10
-0,01 – 0,03°C/year
Increases in frequency and intensity of the extreme weather events (proxy: significant wind waves)
January: At the north coast occurs a wave with maximum height of 1,2 m, while at the south coast its maximum wave reaches 1,6 m August: At the north coast occurs a wave with maximum 1,4 m, while at the south coast its maximum wave reaches 2 m; at the Pelabuhan Ratu waves could occur 2,2 m
Figure 2.12, Figure 2.13,
0,4-2 meter
Precipitation changes by the change in climate variability (proxy: mean annual rainfall)
January: In general rainfall is as high as 300 mm with the maximum at the border of West Java-Central Java August: Average rainfall is less than 50
Figure 2.16 Figure 2.18
0 – 600 mm
Range of Inundation

59 | I C C S R
Hazard Type Description Figures Value Range
mm in other words there is a drought Changes in surface wind circulation by changes in climate variability (proxy: patterns of mean annual surface wind)
January: The wind pattern from the west occurs in the entire region at about 8 m / sec. August: An opposite wind pattern occurs, east – southeast wind with an average speed of almost 10 m / sec.
Figure 2.19 0 – 10 m/s
Changes in ocean circulation currents by changes in climate variability (proxy: patterns of mean annual currents and sea level fluctuations)
Throughout the year: The current along the southern coast of Java-Bali almost always moves to the east, while the sea level is about 20 cm below MSL. January: Flow along the north coast of Java-Bali moving to the east. August: the current at the north coast of Java-Bali turns west towards the South China Sea.
Figure 2.20 Current: 0 – 1 m/s Sea Water Level: -40 – 50 cm relative to MSL= mean sea level
Sea-level rise Almost the entire northern coast of Java and Bali experiences an upward trend in sea level of about 0.745 cm / year. While the trend of increasing sea level on the south coast is slightly smaller at around 0.74 cm / year
Figure 2.28, Figure 2.29, Figure 2.30
0,72 – 0,77 cm/year
Worst-case scenario simulation results from a combination of hazards that cause
flooding in coastal sea water area of Java-Madura-Bali can be seen in Figure 2.37.
Northern coastal zones ranging from Serang, DKI Jakarta to Central Java and
Surabaya and Cilacap are inundated about 3 m. In these areas the sea water could
reach 25 km inlandward from the current shoreline.
Figure 2. 37 Simulation of coastal inundation in the area of Java-Madura-Bali.
Range of Inundation
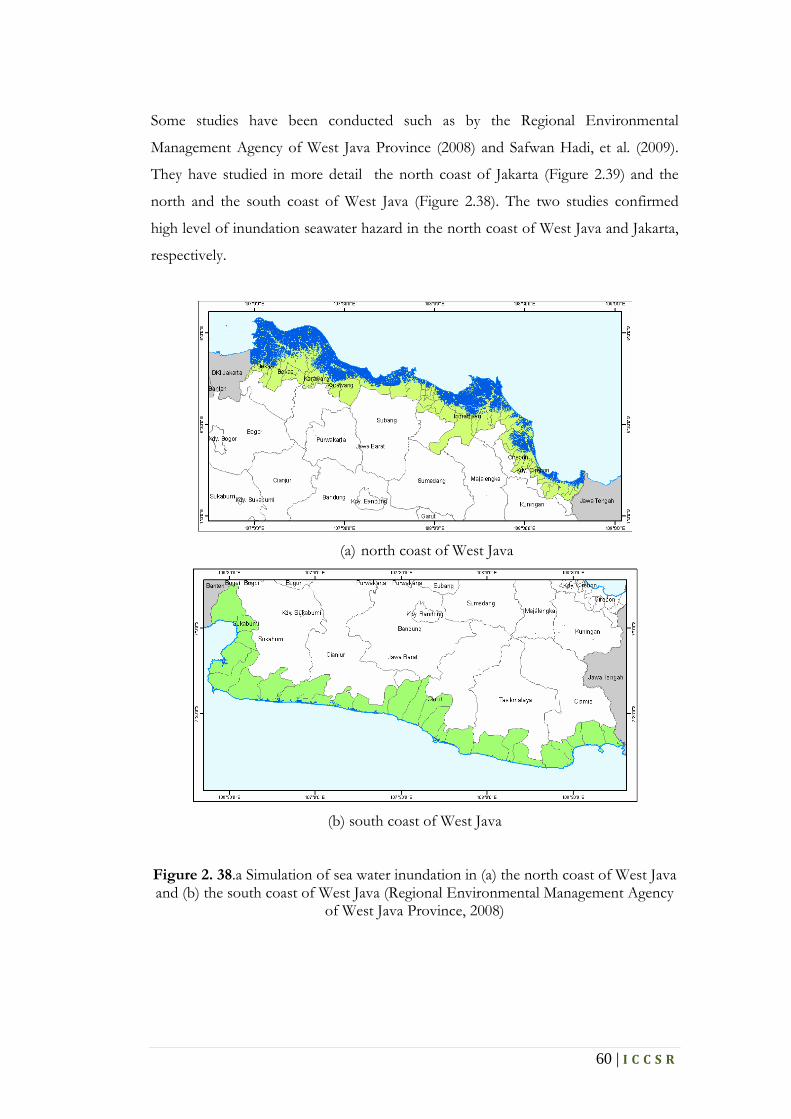
60 | I C C S R
Some studies have been conducted such as by the Regional Environmental
Management Agency of West Java Province (2008) and Safwan Hadi, et al. (2009).
They have studied in more detail the north coast of Jakarta (Figure 2.39) and the
north and the south coast of West Java (Figure 2.38). The two studies confirmed
high level of inundation seawater hazard in the north coast of West Java and Jakarta,
respectively.
(a) north coast of West Java
(b) south coast of West Java
Figure 2. 38.a Simulation of sea water inundation in (a) the north coast of West Java and (b) the south coast of West Java (Regional Environmental Management Agency
of West Java Province, 2008)

61 | I C C S R
Figure 2. 39 Simulation of sea water inundation in north coastal of Jakarta
(Hadi, et al., 2009)
2.5.7.3. Region III Nusa Tenggara Islands
Description of hazard induced by climate change in the Nusa Tenggara region III
can be seen in the following table.
Table 2. 6 Hazards induced by climate change in the region III
Hazard Type Description Figures Value Range
The increase in seawater temperature
Small increasing trend occurs along the coast of Nusa Tenggara (0-0,01°C / yr)
Figure 2.9, Figure 2.10
0,01 – 0,0°C/year
Increased frequency and intensity of extreme weather events (proxy: significant wind waves)
January: The condition is similar to waves in the area of Java-Bali II August: Waves on the north shore have a maximum 1.2 m, whereas on the south coast they have a maximum of 1.6 m
Figure 2.12, Figure 2.13,
0,4-2 meter
Precipitation changes by the change in climate variability (Proxy: rainfall annual average)
January: In general, rainfall less than 250 mm. August: Drought continues for rainfall below 50 mm
Figure 2.16 Figure 2.18
0 – 600 mm
Changes in surface wind circulation by changes in climate variability (proxy: patterns of surface wind annual average)
January: west wind occurs in the entire region at about 8 m / sec. August: The wind pattern from the southeast occurs throughout this region with an average speed of almost 10 m / sec.
Figure 2.19 0 – 10 m/ s
Changes in ocean circulation currents by
Flow is predominantly influenced by the Indonesian Throughflow (Arlindo) that
Figure 2.20 Current: 0 – 1 m/s

62 | I C C S R
Hazard Type Description Figures Value Range
changes in climate variability (proxy: patterns of currents and sea level fluctuations in annual average)
passes through the Lombok Strait to the south, with changing magnitude. Sea level is also not changed much from approximately 10-20 cm below MSL. January: Arlindo through the Lombok Strait is weak enough, there is an eastward flow along both the north and south sides of West Nusa Tenggara. August: Arlindo is strong enough, (approximately 1 m / sec) occurs in the Lombok Strait and the Strait Alas, while the sea level on the coast further south is down to about 30 cm below MSL.
Sea Water Level: -40 – 50 cm relative to MSL= mean sea level
Sea-level rise West Nusa Tenggara coast has an increasing trend of sea level of about 0.74 cm / year, while in the east it is about 0.75 to 0.76 cm / year.
Figure 2.28, Figure 2.29, Figure 2.30
0,72 – 0,77 cm/year
Simulation results from a worst-case scenario that raise the hazard of coastal
inundation in Nusa Tenggara Islands can be seen in Figure 2.40 below. In this case,
there is no inundation of sea water on the coast, except a few in the south coast of
Timor island. There is a possibility that this result is caused by the forest canopy
covering the actual lands.
Figure 2. 40 Simulation of coastal inundation in Nusa Tenggara Islands
Ministry of Environment in collaboration with GTZ of Germany has initiated the
study of coastal flooding hazards in the Lombok island in detail (Figure 2.41). On the
island, there is a very risky area around Mataram City which is the provincial capital
of West Nusa Tenggara.
Range of Inundation

63 | I C C S R
Figure 2. 41 Simulation of coastal inundation on Lombok Island
(KLH and GTZ, 2009)
2.5.7.4. Region IV Kalimantan Island and Its Surrounding
Description of hazard induced by climate change in the Region-IV Kalimantan and
its surroundings can be seen in the following table.
Table 2. 7 Hazards induced by climate change in the region IV
Hazard Type Description Figures Value Range
The increase in seawater temperature
Major trend happening on the west coast (South China Sea) and southern (0.025°C / year), while on the east coast a small trend (0.01°C / year) occurs
Figure 2.9, Figure 2.10
0,01 – 0,03°C/year
Increased frequency and intensity of extreme weather events (proxy: significant wind waves)
January: The wave that occurs is generally low, even in the Makassar Strait it is is only about 0.6 m, except in the north of Pontianak where a wave of about 1.2 m rose August: A low wave still occurs in northern Makassar Strait, while in other coastal areas, the wave reaches its maximum 1.2 m
Figure 2.12, Figure 2.13,
0,4-2 meter
Precipitation changes by the change in climate variability (Proxy: rainfall annual average)
January: Rainfall in East Kalimantan is at around 200-250 mm, whereas in around Pontianak maximum rainfall is about 500 mm. August: Low rainfall about 100 mm occures in South Kalimantan, while around Pontianak it is about 150-200 mm.
Figure 2.16 Figure 2.18
0 – 600 mm
Changes in surface wind circulation by changes
January: The wind pattern from the northwest - west occurs in western and
Figure 2.19 0 – 10 m/ s
Map of Sea Level Rise hazard in 2030
Legend Coast Line District Boundary Sub District Boundary
SLR in 2030
Climate Change Vulnerability Assessment
and Adaptation Strategy in Lombok Island

64 | I C C S R
Hazard Type Description Figures Value Range
in climate variability (proxy: patterns of surface wind annual average)
southern Kalimantan, while in the eastern part of weak the wind blows from the north. August: The pattern of wind that is opposite occurs: southeast winds at about 10 m / sec in the south and west of Kalimantan, while at the east, wind from the south occurs.
Changes in ocean circulation currents by changes in climate variability (proxy: patterns of currents and sea level fluctuations in annual average)
Flow throughout Indonesia through the Makassar Strait moves south but with changing speeds. In August, Arlindo is very strong (more than 1 m / sec), whereas in January Arlindo weakened especially near the coast of South Kalimantan January: The current along the coast of West Kalimantan, Central, to the South moves eastward. August: Flow on the coast of Central and South Kalimantan moves westwards with little speed.
Figure 2.20 Current: 0 – 1 m/s Sea Water Level: -40 – 50 cm relative to MSL= mean sea level
Sea-level rise West coast of west Kalimantan and east coast of Kalimantan experienced an upward trend in sea level of 0.755 cm / year, while the trend in the south coast of South and Central Kalimantan is approximately about 0.76 cm / year
Figure 2.28, Figure 2.29, Figure 2.30
0,72 – 0,77 cm/year
Simulation results from a worst-case
scenario combination which raises the
coastal flooding hazard in Kalimantan
region can be seen in Figure 2.42. In
general, lack of accuracy of digital
topographic data by the forest canopy
closure has led to low water-flooding
areas in coastal Borneo. Some areas
seem to have sea water inundation in
coastal zones such as around
Pontianak, Banjarmasin, and
Samarinda.
Figure 2. 42 Simulation of coastal pools in Borneo and the surrounding area
Range Of Inundation

65 | I C C S R
2.5.7.5. Region V Sulawesi Island and Its Surrounding
Description of hazard induced by climate change in the Sulawesi Region V can be
seen in the following table.
Table 2. 8 Hazards induced by climate change in the region V
Hazard Type Description Figures Value Range
The increase in seawater temperature
Major trends occur in the coastal West and Central Sulawesi (0.03°C / year), while the Banggai Archipelago experiences a smaller trend (0.005°C / year)
Figure 2.9, Figure 2.10
0,01 – 0,03°C/year
Increased frequency and intensity of extreme weather events (proxy: significant wind waves)
January: The wave that occurs is generally low such as in Kalimantan IV; except on the coast of Manado with 1.2 m August: Low wave still occurs in the northern region, while south experiences a 1 m maximum wave
Figure 2.12, Figure 2.13,
0,4-2 meter
Precipitation changes by the change in climate variability (Proxy: rainfall annual average)
January: low rainfall (about 100 mm) occurs in Central Sulawesi and Gorontalo, while high rainfall occures in South Sulawesi, Southeast, and in the north of Manado August: In general, low rainfall occurs (50-100 mm), except in the middle of Sulawesi, about 150-200 mm)
Figure 2.16 Figure 2.18
0 – 600 mm
Changes in surface wind circulation by changes in climate variability (proxy: patterns of surface wind annual average)
January: A wind from the west occurs in South and Southeast Sulawesi, while in other parts blows a weak wind from the north. August: The wind pattern is opposite, southeast winds at about 10 m / sec in South Sulawesi, Southeast, and Central, while in the north occurs a weak wind from the south.
Figure 2.19 0 – 10 m/ s
Changes in ocean circulation currents by changes in climate variability (proxy: patterns of currents and sea level fluctuations in annual average)
ITF currents in the Strait of Makassar, Indonesia have been described in the V region of Borneo. January: Flow on the South coast and Southeast Sulawesi moving eastward with enough speed (about 0.5 m / sec). While current at the coast of North Sulawesi and Gorontalo comes from the western Pacific Ocean. August: Flow on the coast of North Sulawesi and Gorontalo moves toward the north, while on the coast of South and Southeast Sulawesiit is very weak.
Figure 2.20 Current: 0 – 1 m/s Sea Water Level: -40 – 50 cm relative to MSL= mean sea level
Sea-level rise Trends in sea level rise in coastal South Sulawesi, Southeast Sulawesi, North Sulawesi, and the east coast of Central
Figure 2.28, Figure 2.29, Figure 2.30
0,72 – 0,77 cm/year

66 | I C C S R
Hazard Type Description Figures Value Range
Sulawesi, is about 0.76 cm / year. West Sulawesi coast experiences an upward trend in sea level which is slightly lower at around 0.75 cm / year.
Simulation results of the worst-case
scenario of the coastal inundation hazard
in the Sulawesi region can be seen in
Figure 2.43 below. Some coastal zones
suffer quite extreme inundation such as
the coasts of South Sulawesi, Southeast
Sulawesi and Central Sulawesi.
Figure 2. 43 Simulation of inundation in
the area of Sulawesi and its surrounding
2.5.7.6. Region VI Maluku Islands
Description of hazard induced by climate change in the Maluku Islands can be seen
in the following table.
Table 2. 9 Hazards induced by climate change in the region VI
Hazard Type Description Figures Value Range
Increases in seawater temperature
Small-medium trend occures in the central and southern of Maluku (0,01-0,015°C / year), while in North Maluku a significant trend is observed (0.025°C / year)
Figure 2.9, Figure 2.10
0,01 – 0,03°C/year
Increases in frequency and intensity of the extreme weather events (proxy: significant wind waves)
January: low wave occures in the Central Maluku, only about 0.6 m, whereas the northern Maluku and southern Maluku experiences a high wave of approx. 1.5 m August: low wave occurs only in northern Maluku, while in the southern part the maximum wave is 1.2 m
Figure 2.12, Figure 2.13,
0,4-2 meter
Precipitation changes by the change in climate variability (proxy: mean annual rainfall)
January: In general, the rainfall reaches about 100-150 mm August: Drought (rainfall is below 50 mm) occures in almost all regions, except around Halmahera where between 100-
Figure 2.16 Figure 2.18
0 – 600 mm
Range Of Inundation
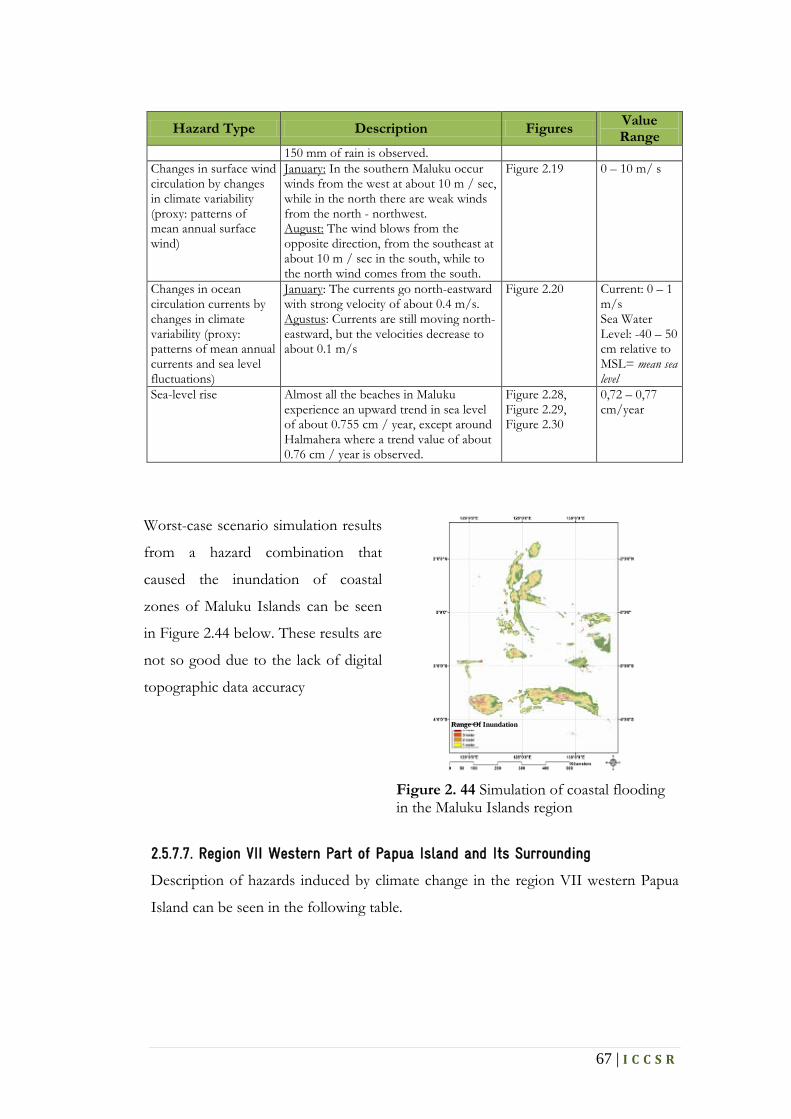
67 | I C C S R
Hazard Type Description Figures Value Range
150 mm of rain is observed. Changes in surface wind circulation by changes in climate variability (proxy: patterns of mean annual surface wind)
January: In the southern Maluku occur winds from the west at about 10 m / sec, while in the north there are weak winds from the north - northwest. August: The wind blows from the opposite direction, from the southeast at about 10 m / sec in the south, while to the north wind comes from the south.
Figure 2.19 0 – 10 m/ s
Changes in ocean circulation currents by changes in climate variability (proxy: patterns of mean annual currents and sea level fluctuations)
January: The currents go north-eastward with strong velocity of about 0.4 m/s. Agustus: Currents are still moving north-eastward, but the velocities decrease to about 0.1 m/s
Figure 2.20 Current: 0 – 1 m/s Sea Water Level: -40 – 50 cm relative to MSL= mean sea level
Sea-level rise Almost all the beaches in Maluku experience an upward trend in sea level of about 0.755 cm / year, except around Halmahera where a trend value of about 0.76 cm / year is observed.
Figure 2.28, Figure 2.29, Figure 2.30
0,72 – 0,77 cm/year
Worst-case scenario simulation results
from a hazard combination that
caused the inundation of coastal
zones of Maluku Islands can be seen
in Figure 2.44 below. These results are
not so good due to the lack of digital
topographic data accuracy
Figure 2. 44 Simulation of coastal flooding
in the Maluku Islands region
2.5.7.7. Region VII Western Part of Papua Island and Its Surrounding
Description of hazards induced by climate change in the region VII western Papua
Island can be seen in the following table.
Range Of Inundation

68 | I C C S R
Table 2. 10 Hazards induced by climate change in regions VII
Hazard Type Description Figures Value Range
Increases in seawater temperature
Small-medium trend occures in the south coast (0,01-0,015°C / year), while in the northern part the trend is very large (0.03°C / year)
Figure 2.9, Figure 2.10
0,01 – 0,03°C/year
Increases in frequency and intensity of the extreme weather events (proxy: significant wind waves)
January: A wave of about 1.2 m high occurs in northern Papua, and even in the western part, a wave of about 0.8 m is observed August: lower wave of 0.8 m not only occurs in the west but also in the north, while in the Arafura Sea a 1.4 m maximum wave is observed
Figure 2.12, Figure 2.13,
0,4-2 meter
Precipitation changes by the change in climate variability (proxy: mean annual rainfall)
January: The maximum rainfall around the coast of Timika (south) is about 450-550 mm, while other coastal zones experienced rainfall between 150-300 mm. August: Drought struck the southern coast near Merauke, but high rainfall (about 300-350 mm) occurs in coastal Nabire (north) and Timika
Figure 2.16 Figure 2.18
0 – 600 mm
Changes in surface wind circulation by changes in climate variability (proxy: patterns of mean annual surface wind)
January: In almost all Papua, wind blows from the northwest with a speed of about 3 to 6 m / sec. August: The wind is blowing from the southeast with a speed of between 2 - 10 m / s in almost all areas of Papua.
Figure 2.19 0 – 10 m/ s
Changes in ocean circulation currents by changes in climate variability (proxy: patterns of mean annual currents and sea level fluctuations)
January: At northern of Papua the currents go eastward with weak velocity of about 0.1 m/s. Agustus: Currents at northern of Papua are still moving eastward, but the velocities increase to about 0.3 m/s
Figure 2.20 Current: 0 – 1 m/s Sea Water Level: -40 – 50 cm relative to MSL= mean sea level
Sea-level rise North coast of Papua experiences an upward trend in sea level of about 0.73 cm / year, while the trend in the southern coast is around 0.75 to 0.76 cm / year. Trends in sea level rise on the coast of West Papua took place between 0.75 to 0.765 cm / year
Figure 2.28, Figure 2.29, Figure 2.30
0,72 – 0,77 cm/year

69 | I C C S R
Worst-case scenario simulation
results of inundation in coastal
zones of West Papua Island can be
seen in Figure 2.45. Tree canopy
cover is the reason why the results
of simulation show no areas of
coastal inundation even though the
south coast of Papua is a gently
sloping beach.
Figure 2. 45 Simulation of coastal inundation
in West Papua Island
2.6. Strategic Issues of Marine and Fisheries Sector Related to Climate Change
In general, the marine and fisheries sector is one that relies on many potential natural
resources, hence problems or issues that arise can always be associated with three
elements: (1) availability of both biological or non-biological resources, (2)
environment of the resources: physical, geographical and ecological, and (3) people
or communities who use resources for social and economic needs.
The implication is that climate change will affect the availability of resources directly
and/or through their environmental factors. For example, the availability of fish in
the waters is influenced directly or indirectly by changes in temperature and ocean
currents, but the availability of wind energy in coastal zone is influenced directly by
changes in wind pattern itself and indirectly by climate variability.
Strategic issues in the scope of marine and fisheries sector is surely a synthesis of all
three elements of the issues above. These issues are then grouped into five aspects as
follows (processed from: KKP, 2005):
1. Physical/geographical environmental issues, arising from the conditions and
locations of coastal, marine, and small islands. The strategic issues include:
• Is still needed a strong regional management system based on islands
perspective to manage the impacts of climate change both on the coastal and
Range Of Inundation

70 | I C C S R
small islands (WP3K) and marine waters. Therefore, discussion of climate
change issues in this study will be poured into 7 areas of national
development with respect to clusters of marine and fisheries services,
captured and cultured fisheries, and other physical factors (see point I.2.1).
• Lack of research and dissemination of disaster mitigation in coastal zones and
small islands. The focus of this system is on hazards of climate variability and
extreme weather events originating from the Indian and Pacific Oceans
surrounding Indonesia.
2. Social, economic, and population issues in the system of coastal and small islands
communities. These are:
• The problem of poverty experienced by most of the coastal communities and
small islands, usually fishermen and fish farmers. Policies and adaptation
activities will be arranged to be directed in order to ensure the sustainability
of Community Economic Empowerment Program Coastal (PEMP) which is
ongoing today.
• Problem of population density in certain coastal zone which can potentially
give rise to social conflict if the experienced socio-economic pressures
increase due to the pressure from climate change impacts on the coast.
3. Economic issues related to infrastructure and vital facilities located on coastal
and small islands, among others:
• There are many cases of inundation to buildings, infrastructures and vital
facilities on coastal and small islands, especially at highest tide condition.
• There are increases in cases of erosion to buildings, infrastructure and vital
facilities in coastal and small islands due to the intensification of storm surges
(extreme weather events)
These issues are caused at least by two fundamental factors, namely:
• Most of the current and past development of infrastructure and vital facilities
on the coast did not consider projections of climate change. The calculation
of building base levels relative to mean sea surface level was only based on
tidal and ocean wave, but not on the sea level rise hazards. The calculation of

71 | I C C S R
the forces the structure of a building must resist only considers wind and
ocean waves, without anticipating more frequent occurrences of storms and
storm surges.
• Coastal boundary factor in an effort to manage coastal spatial planning
physically is only based on the tidal range and normal wave climate, but has
not noticed projected sea level rise and variability due to ENSO, IPO, and
storm surge events.
4. Economic issues related to the utilization of resource are often dominated by less
than optimal knowledge in terms of science and technology. This is reflected by
several issues including:
• Most traditional fishermen are still not using information on fishing ground
location in the sea; its ships are of small-scale so that they could not reach
the EEZ (Exclusive Economic Zone) waters; and also lack of the cold chain
establishment from fishing location at sea until its sales location.
• There is less detailed information on the fishing ground location and the
migration pattern of some high economic potential fish
• There is less utilization of surface wind patterns information in the sea for
fishing boat operation.
• Unbalanced utilization of fish stocks either between regions or between
species that sometimes leads to overfishing
• Less than optimal development of sea water, brackish water, and freshwater
aquaculture
• Less than optimal utilization of small islands
• Unexplored and unproduced alternative energy sources (non-conventional
energy) from the sea such as energies from waves, currents, tides, and Ocean
Thermal Energy Conversion (OTEC)
Having learned from the above issues, knowledge and the application of science
and technology becomes a key role in the efforts of adaptation to climate change
and in the utilization of resources from marine and fisheries sectors.

72 | I C C S R
5. Ecological issues are:
• There are still many conflicts of interest in the utilization of the coastal zones
and small islands, there are many conservation lands converted into
residential land and productive activities (industry, ponds, agriculture,
tourism). For example, degradation of mangrove forests from 5.21 million ha
in 1982 to 2.5 million ha in 1993 (KKP, 2005). In addition, the condition of
coral reef damage has reached the level about 40% in 2005 (KKP, 2005).
Contributing factors include: (1) human activity, such as catching using a
destructive device (illegal fishing), and excessive exploitation (overfishing),
pollution and sedimentation, lack of proper planning, the impact on land
development, and (2) natural factors such as the influence of El-Nino, La-
Nina, hurricanes, earthquakes, and floods.
• Less than optimal management of marine and coastal conservation
• Weakness of supervision and control of pollution in coastal zones.
The emergence of these issues are caused by two main factors: (1) A development
strategy factor with a past development paradigm that is more oriented towards the
terresterial, where the priority allocation of development resources are more aimed at
land sectors, so that the potential maritime and fisheries sector has not been fully
utilized to empower fishery communities and fish farmers on the coast and on small
islands; (2) A lack of awareness to the potential impacts of climate change in aspects
and projections to be included in the process of sectoral development planning and
management. The implication of this is that there is a need to strengthen the
implementation of the five pillars of development strategies of marine and fisheries
sector that are:
• pro-poor (poverty alleviation through increased income),
• pro-job (employment),
• pro-growth (economic growth),
• pro-business (empower micro, small and medium businesses in the field of marine
affairs and fisheries), and
• pro-sustainable (restoration and preservation of aquatic, coastal and small islands
environments, as well as mitigation and adaptation to climate change)

73 | I C C S R
As a summary, the themes covered in the strategic issues include:
1. Research and monitoring of the climate change phenomenon
2. Study of vulnerabilities, potential impacts, and risks of climate change on coastal
zones and small islands.
3. Management of natural resources in coastal zones, marine, and small islands,
especially the captured fisheries and aquaculture related to the regional
livelihoods.
4. Management of ecosystems in coastal zones, waters, and small islands, including
the small islands that are strategically located at the outer ring.
5. Spatial planning and zoning in coastal waters
6. Secure the infrastructures and vital facilities in the coastal zone
7. Management of disaster due to extreme weather events and climate variability
Further strategic issues will be implemented in the form of adaptation activities to
climate change on marine and fisheries sector, as will be described in Chapter 5.

74 | I C C S R
CHAPTER 3 VULNERABILITY OF MARINE AND FISHERIES SECTOR TOWARDS CLIMATE CHANGE Natural hazards induced by climate change as described above can expand to all
Indonesian regions. A factor that informes about the locality of the potential
impacts of climate change is vulnerability. A hazard with a quite small magnitude will
have a major potential impact if it occurs in a very vulnerable area, or the other way
round, a great hazard may have only a small impact if it occurs in an area that is not
vulnerable. Therefore, identification of vulnerability is needed in the assessment of
risk or potential impact.
Vulnerability is defined as a lack or incapability of an individual, social system, or
natural system to anticipate, resolve, defend, and rescue itself or its system from a
hazard triggered by climate change. Basically, vulnerability is dynamic, in line with the
human condition and the environment. Therefore, vulnerability depends on three
factors i.e.: the level of exposure to hazards, the level of sensitivity, and the adaptive
capacity (that may absorb or compensate the damage or get a benefit from climate
change). Conceptually, vulnerability can be formulated as follows (UN-ISDR, 2004;
USAID, 2007):
Where:
• Exposure is the component of vulnerability which refers to the exposure of the
human and the environment to natural hazards location. Exposure describes the
type and amount of assets in the coastal area that is exposed to risk; including
physical, social/cultural, economic, and ecologic elements.
• Sensitivity is the component of vulnerability which refers to the level of
individual or group loss or of an infrastructure or environment relative to its
exposure to a natural disaster. Sensitivity represents the level of impact on coastal
zones and on the people who live and have activities in the zone.
• Adaptive capacity is a component of vulnerability, which refers to capability of
humans or their environment to react and adapt in reducing a hazard so that it is
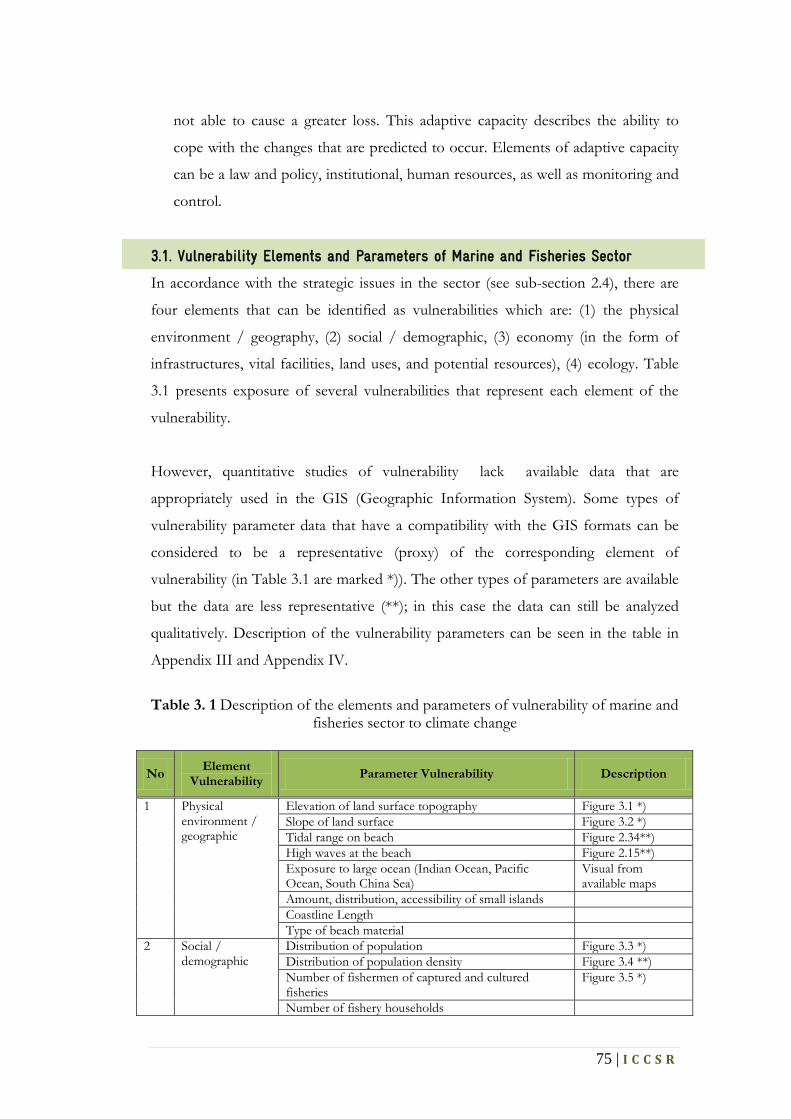
75 | I C C S R
not able to cause a greater loss. This adaptive capacity describes the ability to
cope with the changes that are predicted to occur. Elements of adaptive capacity
can be a law and policy, institutional, human resources, as well as monitoring and
control.
3.1. Vulnerability Elements and Parameters of Marine and Fisheries Sector
In accordance with the strategic issues in the sector (see sub-section 2.4), there are
four elements that can be identified as vulnerabilities which are: (1) the physical
environment / geography, (2) social / demographic, (3) economy (in the form of
infrastructures, vital facilities, land uses, and potential resources), (4) ecology. Table
3.1 presents exposure of several vulnerabilities that represent each element of the
vulnerability.
However, quantitative studies of vulnerability lack available data that are
appropriately used in the GIS (Geographic Information System). Some types of
vulnerability parameter data that have a compatibility with the GIS formats can be
considered to be a representative (proxy) of the corresponding element of
vulnerability (in Table 3.1 are marked *)). The other types of parameters are available
but the data are less representative (**); in this case the data can still be analyzed
qualitatively. Description of the vulnerability parameters can be seen in the table in
Appendix III and Appendix IV.
Table 3. 1 Description of the elements and parameters of vulnerability of marine and
fisheries sector to climate change
No Element Vulnerability Parameter Vulnerability Description
1 Physical environment / geographic
Elevation of land surface topography Figure 3.1 *) Slope of land surface Figure 3.2 *) Tidal range on beach Figure 2.34**) High waves at the beach Figure 2.15**) Exposure to large ocean (Indian Ocean, Pacific Ocean, South China Sea)
Visual from available maps
Amount, distribution, accessibility of small islands Coastline Length Type of beach material
2 Social / demographic
Distribution of population Figure 3.3 *) Distribution of population density Figure 3.4 **) Number of fishermen of captured and cultured fisheries
Figure 3.5 *)
Number of fishery households

76 | I C C S R
No Element Vulnerability Parameter Vulnerability Description
3.a Economic: Infrastructure & facilities vital
Number and variety of infrastructure and vital facilities in the coastal zone
Distribution of land use Figure 3.6 *) Number of cities in the coastal zone Figure 3.7 *)
3.b Economies: the potential resource
Distribution of fishing ground Distribution of fish cultures in the sea, brackish water, fresh water
Figure 3.8 **)
The potential distribution of non-fisheries resources 4 Ecological Reef biodiversity
Distribution of mangrove forests and the threat of land conversion
Figure 3.9 **)
Sea grass distribution Figure 3.10 **) Fish diversity
Figure 3. 1 Elevation map (altitude, topography) of land surface
Map of Data Elevation Model
Legend
Elevation

77 | I C C S R
Figure 3. 2 Map of slope of Land Surface
Figure 3. 3 Map of distribution of population
Slope Map of Land Surface
Slope (degree)
Population Distribution Map
Legend

78 | I C C S R
Figure 3. 4 Population data from Indonesia in 2005 (a) and projections for the year
2025 (b) (processed from BPS data)
Figure 3. 5 Map of Indonesia’s population density distribution
Population Density Map
Population Density
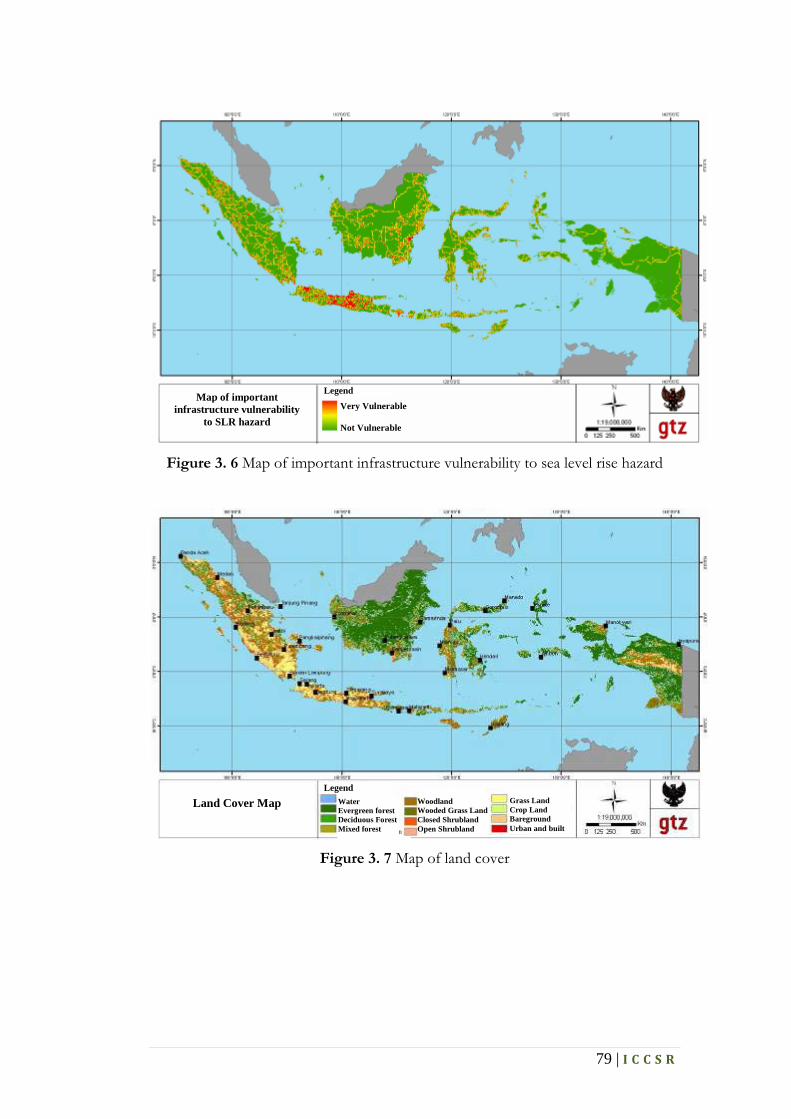
79 | I C C S R
Figure 3. 6 Map of important infrastructure vulnerability to sea level rise hazard
Figure 3. 7 Map of land cover
Map of important infrastructure vulnerability
to SLR hazard
Legend
Land Cover Map Legend
Water Evergreen forest Deciduous Forest Mixed forest
Woodland Wooded Grass Land Closed Shrubland Open Shrubland
Grass Land Crop Land Bareground Urban and built
Very Vulnerable Not Vulnerable

80 | I C C S R
Figure 3. 8 Fishery Management Areas as a proxy for the potential to capture fish in Indonesia (Marine and Fisheries Ministerial Regulation No. 01-MEN-2009)
Figure 3. 9 Map of coral reefs distribution in the world
(Departement of Marine and Fishery Affairs, 2005)
Coral Reef Distributrion in The World

81 | I C C S R
Figure 3. 10 Map of mangrove forest distribution (red) in Indonesia (Ministry of
Marine Affairs and Fishery, 2005)
Figure 3. 11 Map of seagrass distribution (pink) in Indonesia (Ministry of Marine
Affairs and Fishery, 2005)
3.2. Quantitative and Qualitative Vulnerability Description for Marine and
Fisheries Sector in Each Region
A vulnerability study to climate change can be represented quantitatively by a
vulnerability assessment for the impacts of seawater inundation or flooding hazards
in coastal zones due to global sea level rise and sea level increase triggered by storm
surges and climate variability of La-Nina (map of vulnerability distribution can be
Mangrove Forest

82 | I C C S R
seen in Figure 3.12), with the elements and parameters of vulnerability as shown in
Table 3.2 below.
Table 3. 2 Elements and parameters considered in the analysis of vulnerability to flooding hazards in coastal seawater (sampled from Table 3.1)
No Element Vulnerability Parameter Vulnerability Description
1 Physical environment / geographic
Slope of land surface Figure 3.2 *)
2 Social / demographic
Density distribution Figure 3.5 *)
3.a Economic: Infrastructure & vital facilities
The number and variety of vital infrastructure and facilities in the coastal
Figure 3.6 *)
Distribution of land use Figure 3.7 *)
Figure 3. 12 Map of vulnerability to sea level rise hazards
In general, the level of vulnerability of the region is: (1) very high to high for some
of Java's northern coastal regions, the southern part of Central Java’s coastal region
and Bali, especially around big cities; (2) moderate (medium) for most of the east
coast of Sumatra, the north coast of Java, coast of Central Java, a small part of
coastal of West Nusa Tenggara, Sulawesi, and Maluku, as well as the south coast of
Kalimantan and Papua, and (3) low to not-vulnerable levels for the majority of the
Map of Vulnerability to SLR Hazard
High Vurn Very High Vurn
No Vuln
Low Vurn
Medium Vurn
Legend

83 | I C C S R
west coast of Sumatra and south of Java, most areas of Nusa Tenggara, Sulawesi,
north of Maluku and Papua.
In addition, the description of vulnerability will also be qualitatively examined for
particular types of impacts such as sea water temperature increases, coastal erosion
caused by storm surges, and changes in ocean circulation currents triggered by
changes in climate variability patterns. Vulnerability studies that generally cover the
ocean waters need to be done in a qualitative way because of lack of or even
unavailability of appropriate quantitative data, such as the number and distribution of
the fishermen who catch fish in a WPP and the amount of their catch, the number
and distribution of aquaculture in waters, and so on. The studies of climate
vulnerability in coastal waters need to be incorporated in the proposed adaptation
activities to climate change.
3.2.1. Region I Sumatra Island
Moderate vulnerability towards the hazard of sea level increase dominates almost all
the coastal islands of Sumatra and the small islands in the vicinity (Figure 3.12). The
moderate level of vulnerability is more on the east coast which extends from
Lampung to North Sumatra. The main factors of vulnerability on the east coast of
Sumatra are a small slope of the coast between 0-0.05 degrees (Figure 3.2), while an
additional factor is that the population numbers and density are quite high (Figure
3.3 and Figure 3.5), as well as the existence of many important infrastructure
installations on the coast (Figure 3.6), especially around the city of Bandar Lampung
and Medan.
Vulnerability for each type of hazard triggered by climate change can be seen in
Table 3.3 below.

84 | I C C S R
Table 3. 3 Vulnerability to climate change in the region I (Sumatra and surrounding areas)
Hazard Type Dominant Element of
Vulnerability Vulnerability Description
The increase in sea temperature
Ecological Coral reefs on the west coast, north, and southeast (Figure 3.9)
Increased frequency and intensity of extreme weather events
Physical environment / geographic
West coast is exposed to the Indian Ocean, while the east coast faces the Malacca Strait that connects to the South China Sea and Indian Ocean. The potential emergence of storm surges is to be expected. Presence of small islands in the west and north Sumatra with strategic importance as they are the starting point of frontiers.
Changes in rainfall patterns
Ecological There are many systems and wetland estuaries on the east coast, especially in Riau, Riau Islands and Bangka-Belitung that will be affected(Figure 3.11)
Changes in wind patterns and ocean currents
Economies: the potential resource
There is a fishing ground along the west coast of Sumatra and the Mentawai Islands and Nias (Figure 3.8)
Seawater flooding in coastal areas due to sea level rise, storm surge, and ENSO events
(See Table 3.2) Main contributing factors: the small slope on the coast of Sumatra's east coast (between 0 - 0.05). Another factor is the high number of population and population density , many critical infrastructure on the coast, especially around the city of Bandar Lampung and Medan city
3.2.2. Region II Java-Madura-Bali Islands and Its Surrounding
Vulnerabilities ranging from medium to high levels regarding the sea level increase
hazard dominate almost all the northern coast of Java Island (from Anyer to around
Surabaya, Banten west coast, south coast of Central Java and Malang (East Java), and
the south coast of Bali Island (Figure 3. 12). The level of vulnerability is very high in
some locations such as Jakarta, Tangerang, Cirebon, north and south coast of Central
Java, around Surabaya, and around Denpasar, Bali. Some of the major factors that
contribute to the high level of vulnerability in the region II are small coastal slopes
(between 0-0.05 degrees) (Figure 3.2), high numbers of population and population
density (Figure 3.3 and Figure 3.5), and numbers of critical infrastructures in the
coastal zone (Figure. 3.6), especially around major cities on the coast of Java and Bali.
Vulnerability summary to the types of hazards triggered by climate change can be
seen in Table 3.4 below.

85 | I C C S R
Table 3. 4 Vulnerability to climate change in the region II (Java-Madura-Bali)
Hazard Type Dominant Element of
Vulnerability Vulnerability Description
The increase in sea temperature
Ecological Many of the presence of coral reefs at the south coast of Java-Bali, Thousand Island’s, and Madura (Figure 3.9)
Increased frequency and intensity of extreme weather events
Physical environment / geographic
South coast is exposed to the Indian Ocean, while the north coast faces the Java Sea and Bali Sea connected to the South China Sea and Makassar Strait: all regions are at risk from the potential development of storm surges. Presence of small islands on the north.
Changes in rainfall patterns
Ecological There are many estuary systems and seagrass in the west and south coast of Banten and West Java (Figure 3.11)
Changes in wind patterns and ocean currents
Economies: the potential resource
There is a fishing ground along the southern coast of Java-Bali (Figure 3.8)
Seawater flooding in coastal areas due to sea level rise, storm surge, and ENSO events
(See Table 3.2) Main contributing factors: the small slope on the north coast beaches of Java and Bali (between 0 - 0.05 degrees). Another factor is the high number of population and population density, many critical infrastructures on the coast, especially around big cities in the coastal
3.2.3. Region III Nusa Tenggara Islands
Almost the entire Nusa Tenggara region III has a low level of vulnerability and is not
vulnerable to the hazards of sea level rise (Figure 3.12). The low level of vulnerability
is due to several factors such as the small population and population density (Figure
3.3 and Figure 3.5), as well as the small proportion of critical infrastructure on the
coast (Figure 3.6). Vulnerability reaches a moderate level in only a few regions such
as the north coast of Sumbawa Island considering the low coastal slope.
Vulnerability for each type of hazards triggered by climate change can be seen in
Table 3.5 below.

86 | I C C S R
Table 3. 5 Vulnerability to climate change in the region III (Nusa Tenggara)
Hazard Type Dominant Element of
Vulnerability Vulnerability Description
The increase in sea temperature
Ecological Presence of coral reefs (Fig. 3.9)
Increased frequency and intensity of extreme weather events
Physical environment / geographic
South coast faces the Indian Ocean, while the north coast of Flores Sea is exposed to the Straits of Makassar associated with the emergence of potential storm surges.
Changes in rainfall patterns
Ecological There are many estuary systems and seagrass on the coast of Lombok, Sumba, and Timor (Fig. 3.11)
Changes in wind patterns and ocean currents
Economies: the potential resource
There are fishing grounds along the southern coast of Nusa Tenggara (Figure 3.8)
Seawater flooding in coastal areas due to sea level rise, storm surge, and ENSO events
(See Table 3.2) Generally low level of vulnerability, except on the north coast of Sumbawa island with moderate level of vulnerability because of the low coastal slope
3.2.4. Region IV Kalimantan Island and Its Surroundings
In general, almost all coastal zones in Kalimantan have a low vulnerability level to sea
level increase (Fig. 3.12), because although the coasts are gently sloping (Fig. 3.2),
the population is very small (Fig. 3.3). Some coastal zones between Sambas and
Pontianak, Banjarmasin, and Samarinda have moderate vulnerability level, in which
factors such as population (Fig. 3.3) and productive lands (Fig. 3.7) have some
influence. In summary, vulnerability to climate change can be seen in Table 3.6.

87 | I C C S R
Table 3. 6 Vulnerability to climate change in the region IV (Borneo)
Hazard Type Dominant Element of
Vulnerability Vulnerability Description
The increase in sea temperature
Ecological Presence of coral reefs around small islands (Fig. 3.9)
Increased frequency and intensity of extreme weather events
Physical environment / geographic
West coast faces to the South China Sea and the eastern coast is exposed to Makassar Strait and the Pacific Ocean: potential emergence of a storm. Presence of small islands in the west, northeast, and southeast
Changes in rainfall patterns
Ecological There are many estuary systems and seagrass almost along the coast (Figure 3.11)
Changes in wind patterns and ocean currents
Economies: the potential resource
Presence of fishing grounds in the southern Makassar Strait (South Kalimantan) (Figure 3.8)
Seawater flooding in coastal areas due to sea level rise, storm surge, and ENSO events
(See Table 3.2) Although there are many areas with a low coastal slope as in Central and South Kalimantan, the population is small, so vulnerability levels are low. In coastal zone of Sambas, Pontianak, Banjarmasin, and Samarinda the level of vulnerability is moderate due to insufficiency of productive land
3.2.5. Region V Sulawesi Island and Its Surrounding
In general, almost the entire coast of Sulawesi region has low to very low levels of
vulnerability to sea level increase (Fig. 3.12) as the coastal slopes are quite high (about
1.5-3 degree; Fig. 3.2). At some western coasts such as West Sulawesi, around
Makassar, Pare-Pare, Wajo, Bone, Palopo-Bonebone (Luwu), and Kendari the level
of vulnerability is moderate because of a coastal zone that is quite flat and moderate
population density (Fig. 3.3).
Summary of vulnerability to climate change can be seen in Table 3.7 below.

88 | I C C S R
Table 3. 7 Vulnerability to climate change in the region V (Sulawesi)
Hazard Type Dominant Element of
Vulnerability Vulnerability Description
The increase in sea temperature
Ecological Coral reef presence in almost all of the coastal zone (Fig. 3.9)
Increased frequency and intensity of extreme weather events
Physical environment / geographic
North coast is exposed to the Sulawesi Sea and the west coast faces to the Straits of Makassar - western Pacific Ocean: potential emergence of storm surges. Presence of small islands in the north, west, southeast, and south
Changes in rainfall patterns
Ecological There are many estuary systems and seagrass almost along the coast (Figure 3.11)
Changes in wind patterns and ocean currents
Economies: the potential resource
Presence of fishing ground in the southern Strait of Makassar (South Sulawesi, Southeast Sulawesi) (Figure 3.8)
Seawater flooding in coastal areas due to sea level rise, storm surge, and ENSO events
(See Table 3.2) Almost all coastal zones have a low to very low vulnerability level because many parts of the zones are not flat (slope approximately 1.5 - 3). The west coasts of West Sulawesi, around Makassar, Pare-Pare, Wajo, Bone, Palopo-Bonebone (Luwu) and Kendari have moderate vulnerable areas because the zones are flat and contain sufficient population
3.2.6. Region VI Maluku Islands
In general, almost all the coastal islands of Maluku are not vulnerable to the rising sea
level (Fig. 3.12) because the population is relatively low (Figure 3.3) and only few
importance infrastructures are situated at the coast (Fig. 3.6). Except around
Ambon where low to moderate levels of vulnerability are observed. Summary of
vulnerability to climate change can be seen in Table 3.8.

89 | I C C S R
Table 3. 8 Vulnerability to climate change in the region VI (Maluku Islands)
Hazard Type Dominant Element of
Vulnerability Vulnerability Description
The increase in sea temperature
Ecological Presence of coral reefs (Fig. 3.9)
Increased frequency and intensity of extreme weather events
Physical environment / geographic
Southern Maluku is exposed to Arafura Sea and the Indian Ocean and the northern part faces the Pacific: emergence of potential storm surges. Spread of small islands in west and north part of the area.
Changes in rainfall patterns
Ecological Many estuary and seagrass in south, west, and north coast (Fig. 3.11)
Changes in wind patterns and ocean currents
Economies: the potential resource
Presence of fishing ground in the Banda and Arafura Sea (Fig. 3.8)
Seawater flooding in coastal areas due to sea level rise, storm surge, and ENSO events
(See Table 3.2) Almost all of the coastal islands of Maluku are not vulnerable to the hazards of sea level rise because the population is relatively low and only few important infrastructures are at the coast. Exceptions occur around Ambon which has low to moderate levels of vulnerability
3.2.7. Region VII Western Part of Papua Island and Its Surroundings
In general, almost all the northern coast of Papua and the entire coast of West Papua
is not vulnerable to the hazards of sea level increases (Fig. 3.12) as the coastal slopes
are relatively high (1.5-3 degrees; Fig. 3.2). The south coast of Papua has moderate to
low levels of vulnerability because the coastal slope is very low. Another factor is that
the number of people is very low (Fig. 3.3) and few important infrastructures are at
the coast (Fig. 3.6). Qualitative description of vulnerability of the other hazard types
of climate change can be seen in Table 3.9 below.

90 | I C C S R
Table 3. 9 Vulnerability to climate change in the region VII (Western Part of Papua Island)
Hazard Type Dominant Element of Vulnerability Vulnerability Description
The increase in sea temperature
Ecological Presence of coral reefs at the western and northern coast (Fig. 3.9)
Increased frequency and intensity of extreme weather events
Physical environment / geographic
South coast is exposed to the Arafura Sea, Indian Ocean, and the northern coast faces the Pacific Ocean: potential emergence of a storm. Spread of small islands in the west and north
Changes in rainfall patterns
Ecological Many seagrass and estuary in the south, west, and north coast (Figure 3.11)
Changes in wind patterns and ocean currents
Economies: the potential resource
Presence of fishing ground in the Arafura Sea (Fig. 3.8)
Seawater flooding in coastal areas due to sea level rise, storm surge, and ENSO events
(See Table 3.2) North coast of Papua and West Papua is not vulnerable because the slope of the beach is rather high (about 1.5 - 3). South coast of Papua has a moderate to low vulnerability because of less population and coastal infrastructures. .

91 | I C C S R
CHAPTER 4 POTENTIAL IMPACTS AND RISKS OF CLIMATE CHANGES ON MARINE AND FISHERY SECTOR
Potential impacts of climate change always relate to hazard (discussed in Chapter 2)
and vulnerability (discussed in Chapter 3). Risk assessments can be considered as
quantification of the potential impacts of climate change. Discussion of the potential
impact and risk assessment in this chapter is very important as an input to develop
alternatives to the general adaptation strategies.
4.1. Potential Impacts
Potential impacts of climate change are a a consequence that may occur if no efforts
to increase the adaptive capacity are made or if no adaptation takes place. The linkage
between the different components of the vulnerability to climate change can be seen
in Fig. 4.1 follows:
Figure 4. 1 Vulnerability framework (USAID, 2009; Daw, et.al., 2009)
In the diagram above, potential impacts from climate change can be viewed as an
element of vulnerability in the context of climate change. The various potential
impacts of climate change on marine and fishery sector are presented in Table 4.1 as
follows (see also Appendix IV).

92 | I C C S R
Table 4. 1 Potential Impact of Climate Change on Marine and Fisheries Sector
Triggered Hazards
Physical Environmental Changes Potential Impact Focus Areas
KT
PL
PKC
E
PVI-
CH
PV
I-A
AM
K
ML/
SLR
√ √ √ Coastal inundation/ flooding Disruption of social activities in the settlement
• Reg.I: east coast of Sumatra • Reg.II: north coast of Java, south coast of Bali • Reg.III: Nusa Tenggara, • Reg.IV: Kalimantan • Reg.V: Sulawesi, • Reg.VI: Maluku, • Reg.VII: Papua
Disruption of economic activities of infrastructures and vital facilities in the coastal zone
√ √ √ Increased coastal erosion Damages to settlements in the coastal zone Sandy or muddy coastal zones, which are exposed to the sea: • Indian Ocean (Reg.I, II, III, VI, VII) • Pacific Ocean (Reg.IV, V, VI, VII) • South China Sea (Reg.I, IV,V) • Internal Indonesian waters
Damages to infrastructures & vital facilities in the coastal zone
√ √ √ Sinking of small islands Disruption to economic activities
Damages to infrastructures & vital facilities • Small islands for marine conservation • Small islands that rich in natural resources • Small islands that rich in vital facilities
√ √ √
Sinking of outermost strategic small islands
The withdrawal of the country borders due to the sinking of the outermost strategic small islands
Small islands bordered with countries: • ASEAN and India at northwest parts of Indonesia • Australia, Timor Timur, and Papua New Guinea at
southeast parts of Indonesia
√ √ √
Flooding of rivers and estuaries
Damages of settlements, infrastructures & vital facilities in the coastal zone
• Mangrove areas • Estuarine, seagrass areas • Coral reefs • Small islands
√
Decrease in flow and water quality of rivers and estuaries; drought
Decreased availability of fresh water for coastal settlements, vital facilities, and ponds Decreased productivity of brackish water and freshwater ponds
• Mangrove areas • Estuarine, seagrass areas • Coral reefs • Small islands

93 | I C C S R
Triggered Hazards
Physical Environmental Changes Potential Impact Focus Areas
KT
PL
PKC
E
PVI-
CH
PV
I-A
AM
K
ML/
SLR
√ √ √
Increased intrusion of salt in river waters and ground waters
The decline in freshwater supplies for coastal settlements, vital facilities, and ponds
• Mangrove areas • Estuarine, seagrass areas • Coral reefs • Small islands
√ √
Primary productivity changes Changes in fish migration pattern Fishing ground shifts
Decreases or increase in the capture fisheries production decrease or increase in capacity of fish processing units
Eleven WPP
√ √
Sudden changes of wind pattern at the seas
Decreases in the duration of catching fish at the sea Decreases in capture fisheries production Increased fishing boat's fuel consumption
Eleven WPP
√ √ Changes in the composition of aquatic biodiversity; damages in aquatic habitats
Changes in the availability of natural feed for aquaculture Changes in the capacity of fish processing units
Nine fishery clusters
√ √ Coral bleaching; Alga blooming
Degradation of marine and coastal environment and resources
• Coral reef • Small islands
√ √ √ Changes in hydraulic regime in wetlands
Degradation of wetlands that served as a coastal protection
• Mangrove areas • Estuarine, seagrass • Small islands
√ √
Weakening of deepwater circulation (thermohaline)
Adding to the disruption of global climate Affect human lives
• Eastern part of India Ocean • Indonesian throughflow route • South China Seas • Arafura Sea

94 | I C C S R
The table above shows how the hazards of climate change influence the parameters
of physical environment and the marine atmosphere which then lead to a potential
impact on the marine and fisheries sector. Potential impacts of climate change on
marine and fishery sector do not always have to be negative, but can also be
conducive. For example, El-Nino phenomenon precisely affects captured fisheries
production increases in the Indian Ocean (WPP 572 and WPP 573; see Fig. 3.8)
because at that time it strengthens the upwelling process and primary productivity.
However, the negative impacts of climate change on this sector were much felt by
the community and other stakeholders on the coast, such as seawater inundation at
the harbor dock, settlements, and other vital facilities.
Diposaptono, et al (2009) describes the potential impacts of climate change on
various sectors in coastal zones, marine, and small islands (Figure 4.2).
Figure 4. 2 Schematic Impact of climate changes on several sectors
95 | I C C S R
The scheme became the basic formulation for adaptation measurement and
mitigation of climate change, which will be presented in Chapter 5.
4.2. Risk Analysis (Quantitative Potential Impacts) in Each region
A potential impact can be determined quantitatively by using risk analysis of a
disaster or hazard. Law No. 24 of 2007 on Disaster Mitigation mentioned that the risk
of disaster is the potential losses caused by the disasters in a region and a period of
time, the risks can be the form of deaths, injuries, illnesses, threatened lives, losses of
secure sense, displacement, damages, or losses of property and disruptions of
community activities.
In general, the risk can be interpreted as a possibility which can cause harms and
losses of materials, losses of life, or environmental damages. Risk can also be
interpreted as possibility of damaging the social, societal, and the environmental
orders caused by the interaction between hazards and vulnerabilities. Therefore, the
relationship between variables of hazards or threats of disaster, vulnerability and risk
is (UN-ISDR, 2004): R = H x V where: H is the hazard, V is vulnerability, R is risk.
If the definition of risk is associated with the formulation of vulnerability which has
been discussed in Chapter 3, the variable of adaptive capacity is inversely
proportional to the value of risk level. Consequently, if a community has a higher
value of vulnerability than value of adaptation capacity, then the value of risk is
relatively high. Conversely, if the value of community capacity higher than the value
of vulnerability then the value of the risk is relatively low.
Risks or potential impact of hazards triggered by climate change can be determined
from the prediction or simulation of coastal inundation or flooding conditions as
described in point II.5.7 above. Risk level simulation has a result in each of three
scenarios; it can be seen in Fig. 4.3 (a), (b), and (c).
Risk analysis for sea water flooding impact in the coastal zone, especially for
scenario-3 which is the worst scenario in each area will be described below.

96 | I C C S R
(a) Scenario-1 HHWL+SLR
(b) Scenario-2 HHWL+SLR+ENSO
(c) Scenario-3 HHWL+SLR+ENSO+ SS
Figure 4. 3 Three scenarios of climate change risk which is inundation of seawater in the coastal zone due to sea level rise, climate variability of La Nina, and a storm surge
that each scene is accompanied by the highest tides perigee
Risk Map of SLR Hazard
(scenario 1)
No Risk Low risk Medium Risk High Risk Very High Risk
Risk Map of SLR Hazard
(scenario 2)
No Risk Low risk Medium Risk High Risk Very High Risk
Risk Map of SLR Hazard
(scenario 3)
No Risk Low risk Medium Risk High Risk Very High Risk

97 | I C C S R
4.2.1. Region I Sumatra Island and Its Surroundings
Almost all of the Sumatra coast and the small islands on the west of Sumatra Island
have a moderate risk level of flooding hazards. While some locations such as the
coastal zones of Riau Province, North Sumatra, Nangroe Aceh Darussalam, West
Sumatra, and Lampung have a high risk level.
4.2.2. Region II Java-Madura-Bali Islands and Its Surroundings
Almost all the coasts of Java and southern coasts of Madura and Bali have a
moderate to high risk for sea water flooding hazard in coastal zone. In some location
the risk is very high such as in the coasts of Jakarta and Tangerang (Banten) and
Tanjung Muria (Central Java).
4.2.3. Region III Nusa Tenggara Islands
A moderate risk level of sea water flooding in coastal areas is to be found on the
south coast of Lombok Island, south coast of the island of Sumba, Sumbawa, Flores
to Alor Island. Meanwhile there is a level of high risk on the south coast of Lombok
Island, the Saleh Gulf coast of the Sumbawa Island and the Ende beach up to around
Larantuka beach on the Island of Flores.
4.2.4. Region 4 Kalimantan Island and Its Surroundings
In general the coast of Borneo has a moderate risk level of flooding hazards, except
in area of Nunukan (East Kalimantan). Some coastal zones around Pontianak and
Banjarmasin even have a very high level of risk, and the coastline around Samarinda
has a high risk.
4.2.5. Region V Sulawesi Island and Its Surroundings
Many coastal zones have a moderate risk level of flooding hazards in coastal zones
e.g. coast of South Sulawesi, west coast of Southeast Sulawesi, west coast of West
Sulawesi, coast of Central Sulawesi, and the coast of North Sulawesi and Manado.
Several coastal zones have a high level of risk and very high on the west coast of
South Sulawesi.

98 | I C C S R
4.2.6. Region VI Maluku Islands
A moderate risk level for flooding hazards in coastal zones is to be found on the
western coast of Halmahera Island and on the Island of Buru, some parts of the
Seram Island coast, Tanimbar Islands, and the Aru Islands. Some locations even have
a high risk level such as the coast around Ternate (Halmahera), coast of Ambon City,
coast of Tual City on Little Kai Island, which is caused by the existence of many vital
infrastructures such as the airport.
4.2.7. Region VII Western Part of Papua Island and Its Surroundings
The south coastal region of Papua (between Timika and Merauke) and the coast
around Fakfak generally have moderate risk level of sea water flooding hazards. High
risk level is only locally around the town of Jayapura and Biak because of the airport
infrastructure. Other areas showed practically no risk at all.

99 | I C C S R
CHAPTER 5 FUTURE DIRECTIONS AND STEPS FOR THE INTEGRATION OF CLIMATE CHANGE ADAPTATION IN MARINE AND FISHERIES SECTOR
Basically, adaptation to climate change consist of a number of strategies and activities
in response to climate change in the form of adjustments in ecological, economical,
and social systems in order to maintain or even improve the welfare of society (e.g.,
Daw et al., 2009). Adaptation to climate change involves two main activities,
specifically to improve and strengthen the adaptive capacity of governments and
communities in coastal and small islands as well as to implement adaptation decisions
that alter the capacity of adaptation to some actions or activities.
Adaptation actions are all efforts made to reduce the impact of hazards triggered by
climate change, both before, during or after the occurrence of an impact it caused.
Put simply, the impact arises when the hazard meet vulnerability. Therefore, to
avoid a large impact, it is necessary to attempt to separate these two elements in the
following manner: (i) avoid vulnerability to hazards so that they will not meet for
each other, such as retreat population to a safe place from hazard, (ii) reduce the
hazard as much as possible so that the hazard does not hit a vulnerability, such as the
construction of the beach wall. The two options are sometimes very difficult to
perform as they cause social problems and need high investment. Then (iii) reduce
hazards as well as increase the capacity of vulnerability by adaptive or
accommodative ways using risk analysis and management.
This risk management examines all options of strategy and implementation, both in
structural and non-structural measures to avoid (preventive) or to reduce the effects
of climate change induced hazards by preparedness and increased resilience.
Structural handling of sea level rise include coastal protection systems by building
wave retaining walls such as breakwater, seawall, and the floodgates which are known
as hard protection, as well as soft protection by using coastal vegetation (mangrove), sand
dune, and coral reefs. While non-structural treatments include: the development of
laws and government regulations, law enforcement, establishment of government

100 | I C C S R
and non-governmental organizations related to disaster mitigation, providing spatial
regulation concepts that are familiar to disaster, providing database, information
system, and early warning system, providing maps of hazards and risks of sea level
rise, and by providing an evacuation route and shelter (safe place) maps, public
education, and increases of support facilities of lifeline.
Conceptually, Diposaptono et al (2009) gives 7 cyclical steps in attempts to the
climate change adaptation (Figure 5.1), ie:
(1) involve relevant stakeholders, (2) determine the problem, (3) assess the available and necessity
capacities of adaptation, (4) identify adaptation options, (5) evaluate adaptation options and
chose the action (6) Implement adaptation actions, and (7) monitor and evaluate the
implementation of adaptation.
Figure 5. 1 The sequence of seven steps in the process of adaptation to climate change (Diposaptono et al, 2009)
The directions of adaptation strategies for the fisheries and marine sector can
basically be grouped into:
1. Physical adaptation of coastal zones and small islands
a. Integrated management of physical aspects of coastal zones and small islands
b. Environmentally sound physical engineering (e.g., coastal structures with
environmental consideration)
2. Management of social and population (settlement)
3. Management of infrastructures and vital public facilities
4. Management of marine and fishery resources potential
a. Management and marketing of captured and cultured fisheries
b. Management of water resources
c. Management of defense and security resources (i.e., strategic outermost small
islands that are located nearby the country borders)
Adaptation Process
Stakeholder participation
Define problems
Adaptation capacity
Assessment
Identified adaptation option
Evaluate adaptation Option and action
selection
Adaptation Implementation
Monitoring and evaluation of Adaptation

101 | I C C S R
5. Integrated ecosystem management of coastal zones, small islands, and oceans
6. Formulation of regulations, policies, and institutional capacities for adaptation to
climate change
7. Data and research inventories as well as human resource development
To apply these directions of adaptation strategy, we arrange activities involving three
steps i.e.:
1. Formulation of directions for the determination of adaptation strategies
considering to certain criteria;
2. Determination of activities and sub-activities of adaptation priorities including
their stages and required indicative budget;
3. Sharpening of the activities by choosing and ranking 5 (five) among the priority
activities as leading activities.
5.1. Future Directions for Marine and Fisheries Sector 2010 - 2030
Various alternatives of adaptation strategies on marine and fisheries sector have been
compiled with information on hazards, vulnerabilities, potential impacts, and risks, i.e.
Table 4.1 that was expanded to the table in Appendix IV. The next step is to choose
among the alternatives of adaptation strategy and arrange them into a number of
strategies and recommended activities. Selection of the strategy alternatives is to
consider two directions at once, i.e. not only to anticipate potential impacts and risks
of climate change, but also to support and ensure the sustainability of the
development strategy of marine and fisheries sector. Development strategy for this
sector is essentially aimed at realizing the five pillars of national development
strategies (see point 2.6), i.e. pro-poor strategy, pro-jobs, pro-growth, pro-business,
and pro-sustainable.
For the implementation, climate change adaptation strategies include several aspects
such as physical area (either through engineering, spatial planning and zonation),
infrastructure, public facilities, socio-cultural, potential resources, ecosystems, human
resources, data and information, law and public policy, as well as defence and security.
Alternative adaptation strategies are then classified into four groups according to the
framework as can be seen in Figure 1.3 namely:

102 | I C C S R
Strategy-1 (inventories of data, information systems, and researches): Conduct
inventories of data, information systems, and researches related to climate change;
Strategy-2 (Planning): Integrate adaptation and mitigation of climate change into
planning and management of natural resources, coastal ecosystems, and small islands
in an integrated manner;
Strategy-3 (Regulation and Policy): Develop and/or adjust the regulations and
policies on marine and fisheries sector on climate change on coastal zones and small
islands;
Strategy-4 (Implementation): Implement activities of adaptation and mitigation of
climate change on coastal and marine areas.
5.2. Future Steps for the Marine and Fisheries Sector in 2010-2030
5.2.1. Priority Activities for Adaptation
From the analysis of alternative adaptation strategies in Appendix IV, 9 (nine)
priority activities are formulated 9 (Table 5.1 below). These activities are grouped
into four clusters of activities and adapted to the issue of climate change and
national development strategies.
Table 5. 1 Nine priority activities for adaptation to climate change on marine
fisheries sector Anticipated Hazards Development Strategy
Activity Group
(strategy) No Priority Activities
KT
PL
PKC
E
PVI-
CH
PVI-
AA
M
KM
L/S
LR
PRO
-PO
OR
PRO
-JO
B
PRO
-GR
OW
TH
PRO
-BU
SIN
ESS
PRO
-SU
STA
INA
BLE
Inventories of data, information systems, and researches
1 Implementation of inventories of data, information systems, and researches related to climate change
√ √ √ √ √ √ √
Planning
2 The integration of adaptation and mitigation of climate change into
√ √ √ √ √ √

103 | I C C S R
Anticipated Hazards Development Strategy
Activity Group
(strategy) No Priority Activities
KT
PL
PKC
E
PVI-
CH
PVI-
AA
M
KM
L/S
LR
PRO
-PO
OR
PRO
-JO
B
PRO
-GR
OW
TH
PRO
-BU
SIN
ESS
PRO
-SU
STA
INA
BLE
planning and management of marine and fisheries
Regulation and policies
3 Formulation and / or adjustment of regulation, policy, and institutional capacity in the marine and fisheries sector related to climate change in coastal, small islands and ocean areas
√ √ √ √ √ √ √ √ √ √
Implementation 4 Elevation adjustments and strengthening the structures of buildings and vital facilities in coastal zones related to climate change
√ √ √ √ √ √
5 Adjustments of the integrated management of natural resources and ecosystems of coastal and small islands
√ √ √ √ √ √ √ √
6 Adjustments of the management of strategic small islands related to climate change
√ √ √ √ √ √ √
Implementation 7 Strengthening the capacity of disaster mitigation on climatology and oceanography in the coastal, small islands, and ocean
√ √ √ √ √
8 Adjustments of the integrated management of the potential resources of capture fisheries related to climate change
√ √
√ √ √ √ √ √
9 Adjustments of the integrated management of the potential resources of aquaculture fishery in marine, brackish water, and freshwater related to climate change
√ √ √ √ √ √ √ √
Priority activities above are elaborated in the form of a number of related sub-
activities associated to their focus areas in Table 5.2 below.

104 | I C C S R
Table 5. 2 Explanation of the priority activities of adaptation to climate change on marine and fisheries sector
No Priority Activities Purposes Sub Priority-Activities Focus Areas Other Institutions /
Sectors To be involved
I. ACTIVITY CLASS OF INVENTORIES OF DATA, INFORMATION SYSTEMS AND RESEARCHES 1 Implementation of
inventories of data, information systems, and researches related to climate change
• Strengthening the research capacity of the phenomena, hazards, and potential impacts of climate change on the sector
• Strengthening the capacity of adaptation and mitigation of climate change to be more appropriate in accordance with the vulnerability conditions and local wisdom
Sub-activity of strengthening databases related to climate change: • Active contribution in the international database networks
for monitoring the phenomena and the impacts of climate change
Sub-activity of strengthening information systems related to climate change • Analysis and development of the hazard maps on climate
change in the coastal zones and small islands • Analysis and development of the hazard maps on climate
change in the ocean areas • Development of vulnerability maps on climate change in the
coastal zones and small islands • Development of vulnerability maps on climate change in the
ocean areas • Analysis and development of risk maps on climate change in
the coastal zones and small islands • Analysis and development of risk maps on climate change in
the ocean areas Sub-activity of strengthening researches related to climate change: • Research on ocean-atmosphere exchanges in climate change • Active contribution in the international research network
about the understanding of phenomena and impacts of climate change
• Research on the vulnerability index in coastal zones and small islands as well as in ocean areas
• Research on the effective and efficient strategies and technologies of climate change mitigation (e.g. alternative energy from the sea, the absorption of CO2 by the coastal and marine ecosystems)
• Research on the efective and efficient strategies and technologies of climate change adaptation
The focus in ocean areas: Indonesian Throughflow: western Pacific Ocean in Reg.VI, Reg.VII; Makassar Strait in Reg.IV, Reg.V; Lombok Strait in Reg.III; eastern Indian Ocean at Reg.I, Reg.II, Reg.III Focus in coastal
zones and small islands: areas having high level of risk to climate change Focus in curriculum
of the Elementary and Secondary Education; as well as of the Higher Education
National Education Non-departmental
research institutions (BMKG, LAPAN, BPPT, PPGL, Bakosurtanal, Research and Technology)
i. The provincial governments and local governments having coastal regions and small islands

105 | I C C S R
No Priority Activities Purposes Sub Priority-Activities Focus Areas Other Institutions /
Sectors To be involved
• Research on the impacts of climate change in fishing ground • Research on the impacts of climate change on stock
assessment Sub-activity of placement of material related to climate change on the national curriculum
II. ACTIVITY CLASS OF PLANNING
2 The integration of adaptation and mitigation of climate change into planning and management of marine and fisheries
Adjusting the planning and management of marine and fisheries in anticipation to climate change issues by integrating the activities of adaptation and mitigation of climate change
• Identification of current conditions and future projections of the spatial planning and zonation of coastal and waters areas
• Formulation of the planning hierarchy of marine and fisheries sector which have been contained the natural disaster issues including climate change
• Formulation of the concept of coastal demarcation containing the disaster issues including climate change
• Formulation of Climate Change Action Plan • Mainstreaming the planning hierarchy of marine fisheries
sector into development planning system • Selection of appropriate climate change adaptation
technologies (retreat, accommodation, protection) • Selection of appropriate climate change mitigation
technologies (energy from ocean, coastal ecosystems) • Supervision and control for spatial planning and zonation of
the coastal and waters areas due to climate change • Information dissemination and public awareness upon the
phenomena and impacts of climate change
• High risk areas of coastal inundation hazards: Reg.II: Java (northern), Bali, Reg.I: Sumatra (eastern)
• Medium risk areas of coastal inundation hazards: Reg.I, Reg.III, Reg.IV, Reg.V Sulawesi (south, west)
• Low risk areas of coastal inundation hazards: Reg.VI, Reg.VII Papua (southern)
• Public Works • Forestry • Agriculture • Tourism • Transportation • Energy and Mineral
Resources • The provincial
governments and local governments having coastal regions and small islands
III. ACTIVITY CLASS OF REGULATION, POLICY AND INSTITUTIONAL CAPACITY 3 Formulation and /
or adjustment of regulation, policy, and institutional capacity in the marine and fisheries
Strengthening the capacities of the sectors related in coastal zones and small islands to: • anticipate hazards
triggered by climate
• Formulation of norms, standards, guidelines and criteria of the adaptation and mitigation of climate change
• Adjustment of regulations and policies due to climate change
• Accelerating issuance of Decree of the Local Head upon the
• High risk areas of coastal inundation hazards: Reg.II: Java (northern), Bali, Reg.I: Sumatra (eastern)
• Laws and Regulations • House of
Representatives • National Education

106 | I C C S R
No Priority Activities Purposes Sub Priority-Activities Focus Areas Other Institutions /
Sectors To be involved
sector related to climate change in coastal, small islands and ocean areas
change that is continuing
• better ensure the sustainability of the overall national development
Strategic Plan of Marine and Fisheries Sector that have contained issues and strategies of disaster mitigation including climate change adaptation
• Accelerating issuance of Local Regulation on Zonation Plan of Marine and Fisheries Sector containing hazard and risk maps on climate change
• Improvement of the institutional capacity (regulations, human resources, institutions, and the others)
• Improvement the supervision and control capacities, particularly based on the villages in coastal zones and small islands
• Medium risk areas of coastal inundation hazards: Reg.I, Reg.III, Reg.IV, Reg.V Sulawesi (south, west)
• Low risk areas of coastal inundation hazards: Reg.VI, Reg.VII Papua (southern)
IV. ACTIVITY CLASS OF IMPLEMENTATION 4 Elevation
adjustments and strengthening the structures of buildings and vital facilities in coastal zones related to climate change
Evaluating and adjusting elevation and strength of building structures on the coast due to the issues of sea level rise, more frequently storm surges, and more uncertain pattern of climate variability events (ENSO, IPO)
• Identification of current conditions and future projections for all the infrastructure and vital facilities in coastal zones
• Adjustment of elevation and strengthening of building structures and vital facilities (coastal settlement, harbor docks, roads, etc.).
• Assessment and dissemination of elevated house construction in the coastal zones
• Development and maintenance of coastal protection structures (seawalls, groin, breakwater, beach nourishment, tidal flood gates, etc.)
• Development of Climate Resilience Villages (CRV)
• High risk areas of coastal inundation hazards: Reg.II: Java (northern), Bali, Reg.I: Sumatra (eastern)
• Medium risk areas of coastal inundation hazards: Reg.I, Reg.III, Reg.IV, Reg.V Sulawesi (south, west)
• Low risk areas of coastal inundation hazards: Reg.VI, Reg.VII Papua (south)
• Public Works • Tourism • Transportation • Energy and Mineral
Resources • Public Housing • Development of
Disadvantaged Regions
• The provincial governments and local governments having coastal regions and small islands
5 Adjustments of the integrated management of natural resources and ecosystems of
Strengthening the capacity to maintain and rehabilitate ecosystems of the coastal and small
• Identification of current conditions and future projections of ecosystem management of coastal and small islands
• Maintenance and rehabilitation of ecosystems and resources of coastal and small islands (mangroves, wetlands and
Coastal regions and small islands consisting of many ecosystems of: • Mangrove
• Environment • Public Works • The provincial
governments and
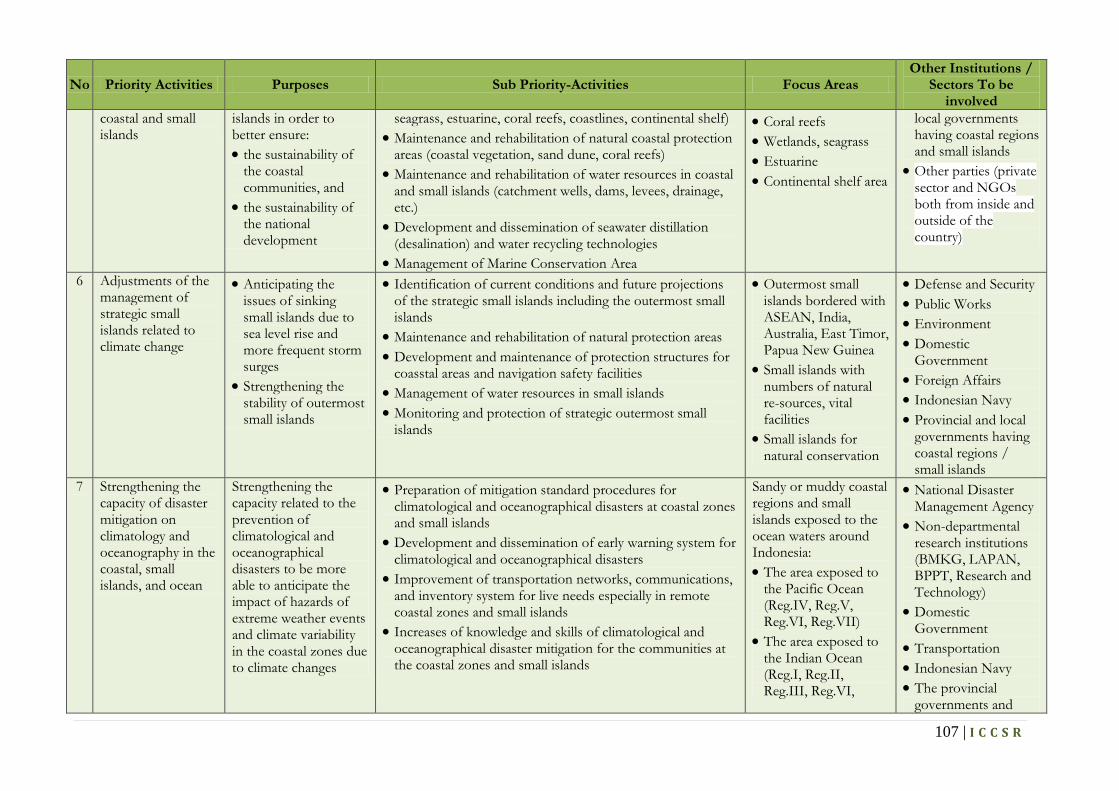
107 | I C C S R
No Priority Activities Purposes Sub Priority-Activities Focus Areas Other Institutions /
Sectors To be involved
coastal and small islands
islands in order to better ensure: • the sustainability of
the coastal communities, and
• the sustainability of the national development
seagrass, estuarine, coral reefs, coastlines, continental shelf) • Maintenance and rehabilitation of natural coastal protection
areas (coastal vegetation, sand dune, coral reefs) • Maintenance and rehabilitation of water resources in coastal
and small islands (catchment wells, dams, levees, drainage, etc.)
• Development and dissemination of seawater distillation (desalination) and water recycling technologies
• Management of Marine Conservation Area
• Coral reefs • Wetlands, seagrass • Estuarine • Continental shelf area
local governments having coastal regions and small islands
• Other parties (private sector and NGOs both from inside and outside of the country)
6 Adjustments of the management of strategic small islands related to climate change
• Anticipating the issues of sinking small islands due to sea level rise and more frequent storm surges
• Strengthening the stability of outermost small islands
• Identification of current conditions and future projections of the strategic small islands including the outermost small islands
• Maintenance and rehabilitation of natural protection areas • Development and maintenance of protection structures for
coasstal areas and navigation safety facilities • Management of water resources in small islands • Monitoring and protection of strategic outermost small
islands
• Outermost small islands bordered with ASEAN, India, Australia, East Timor, Papua New Guinea
• Small islands with numbers of natural re-sources, vital facilities
• Small islands for natural conservation
• Defense and Security • Public Works • Environment • Domestic
Government • Foreign Affairs • Indonesian Navy • Provincial and local
governments having coastal regions / small islands
7 Strengthening the capacity of disaster mitigation on climatology and oceanography in the coastal, small islands, and ocean
Strengthening the capacity related to the prevention of climatological and oceanographical disasters to be more able to anticipate the impact of hazards of extreme weather events and climate variability in the coastal zones due to climate changes
• Preparation of mitigation standard procedures for climatological and oceanographical disasters at coastal zones and small islands
• Development and dissemination of early warning system for climatological and oceanographical disasters
• Improvement of transportation networks, communications, and inventory system for live needs especially in remote coastal zones and small islands
• Increases of knowledge and skills of climatological and oceanographical disaster mitigation for the communities at the coastal zones and small islands
Sandy or muddy coastal regions and small islands exposed to the ocean waters around Indonesia: • The area exposed to
the Pacific Ocean (Reg.IV, Reg.V, Reg.VI, Reg.VII)
• The area exposed to the Indian Ocean (Reg.I, Reg.II, Reg.III, Reg.VI,
• National Disaster Management Agency
• Non-departmental research institutions (BMKG, LAPAN, BPPT, Research and Technology)
• Domestic Government
• Transportation • Indonesian Navy • The provincial
governments and

108 | I C C S R
No Priority Activities Purposes Sub Priority-Activities Focus Areas Other Institutions /
Sectors To be involved
Reg.VII) • The area exposed to
South China Sea (Reg.I, Reg.II, Reg.IV, Reg.V)
• Internal Indonesian waters
local governments having coastal regions and small islands
8 Adjustments of the integrated management of the potential resources of capture fisheries related to climate change
• Anticipating the possibility of seaward shifts of the fishing ground
• Ensuring the sustainability of captured fish production
• Development and dissemination of information system and mapping of dynamic fishing ground
• Development and dissemination of real-time weather information systems in ocean
• Increases of capacity of fishermen to reach offshore fishing ground until the limit of EEZ (Exclusive Economic Zone) as well as to enhance fuel-efficiency
• Development of cold-chain system from the fishermen ship to fish auction and processing units.
• Strengthening and development of stock/logistic management (cold storages, warehouses) to ensure the availability of food as well as input of fish processing units
Eleven WPP-RI: 1. 571: Malacca Strait
and Andaman Sea; 2. 572: Indian Ocean:
western Sumatra, Sunda Strait;
3. 573: Indian Ocean: southern Java to Nusa Tenggara, Savu Sea, west part of Timor Sea;
4. 711: Karimata Strait, Natuna, South China Sea
5. 712: Java Sea; 6. 713: Makassar Strait,
Bone, Flores & Bali Seas;
7. 714: Gulf of Tolo, Banda Sea;
8. 715: Gulf Tomini, Molucca Sea, Halma-hera, Seram, Berau Bay;
9. 716: Celebes Sea, north of Halmahera;
10. 717: Paradise Bay, the Pacific Ocean;
• Public Works • Micro, Small and
Medium Enterprises (MSMEs)
• Non-departmental research institutions (BMKG, LAPAN, BPPT, Research and Technology)
• The provincial government and local governments with coastal regions and small islands

109 | I C C S R
No Priority Activities Purposes Sub Priority-Activities Focus Areas Other Institutions /
Sectors To be involved
11. 718: Aru and Arafuru Seas, eastern Timor Sea
9 Adjustments of the integrated management of the potential resources of aquaculture fishery in marine, brackish water, and freshwater related to climate change
• Anticipating the possibility of irresistant fish species and natural food to temperature rise
• Ensuring the sustainability of cultured fish production
• Development of aquaculture species that are resilient to climate change (grouper, snapper, sea weeds, red algae)
• Development of information system for seeding season • Heightening, widening, deepening and strengthening of
pond dikes and channels • Strengthening and developing the role of fish marketing
depot (seeds and consumptive fish) in terms of stock management
• Development of alternative sources of natural food • Development of fish farming in wetlands
Fisheries clusters: 1. Serang, Banten; 2. Sumenep, East Java; 3. Dompu, NTT; 4. East Sumba, West
Nusa Tenggara. 5. Pangkep, South
Sulawesi; 6. Gorontalo, 7. Tomini Bay Central
Sulawesi; 8. Mamuju, Sulbar; and 9. Karimun, Riau
Islands
• Public Works • Micro, Small &
Medium Enterprises (MSMEs)
• Non-departmental research institutions
• The provincial governments and local governments having coastal regions and small islands

110 | I C C S R
5.2.2. Champion Activities for Adaptation
Sharpening the nine priority activities is performed by determining five Champion
Activities. These activities are meant to anticipate the impacts that are being
experienced by the marine and fisheries sector up to now. Determination of the
champion activities and their order can be made relative to some criteria such as: the
level of effectiveness (in response to potential impacts of climate change), costs,
feasibility, social and cultural feasibilities, adequacy to anticipate impacts being
experienced, implementation rate, and consistency with the policies of central and
local governments (USAID (2007). The champion activities can be seen in Table 5.3
below.
Table 5. 3 Five Champion Activities for adaptation to climate change marine and fisheries sector
Champion num-ber
Champion Activities
Anticipated Hazards Impacts already and still
happening
KT
PL
PKC
E
PVI-
CH
PVI-
AA
M
KM
L/
SLR
1 Formulation and / or adjustment of regulation, policy, and institutional capacity in the marine and fisheries sector related to climate change in coastal, small islands & ocean areas
√ √ √ √ √
Yet specifically in the scope of climate change adaptation in the existing regulations and policies such as Act No. 27 Year 2007, Act No. 26 Year 2007, Act No. 24 Year 2007 Act, Act No. 31 Year 2004
2 Elevation adjustments and strengthening the structures of buildings and vital facilities in coastal zones related to climate change
√ √ √
Flooding in settlements, offices, harbour docks due to sea level rise at a rate of 0.6 cm / year and frequent occurrences of storm surges
3 Adjustements of the integrated management of the potential resources of capture fisheries related to climate change
√ √ √
Shifting the location of fishing grounds; Changes in ocean wind patterns and thus more difficult in prediction
4 Adjustments of the inte-grated management of the potential resources of aqua-culture in marine, brackish water, and freshwater related to climate change
√ √ √
Flooding of aquaculture ponds in the coastal waters due to sea-level rise at the rate of 0.6 cm/year
5 Adjustments of the management of strategic small islands related to climate change
√ √ √
Indications of damages and sinks of some small islands, especially ones in the outermost

111 | I C C S R
5.2.3. Stages of the Priority Activities
The priority activities are split up into some sub-activities to be implemented in 4
(four) steps for the medium-term development planning from 2010 to 2030 as
follows.
Activity-1: Implementation of inventories of data, information systems, and researches related to climate change:
Sub Priority-Activities 2010-2014
Sub Priority-Activities 2015-2020
Sub Priority-Activities 2020-2025
Sub Priority-Activities 2025-2030
• Strengthening databases related to climate change
• Strengthening information systems related to climate change
• Strengthening researches related to climate change
Focus for ocean areas: west part of Pacific Ocean, Reg.VI, Reg.VII Focus for coastal zones and small islands: Areas with a high level of risk to climate change (Reg.II, Reg.I) • Placement of material
on climate change on the national curriculum
Focus: for curriculum materials of Environment at the Higher Education
• Continuity of strengthening databases related to climate change
• Continuity of strengthening information systems related to climate change
• Continuity of strengthening researches related to climate change
Focus for ocean areas: Makassar Strait in Reg.IV, Reg.V; Lombok Strait in Reg.III Focus for coastal zones and small islands: Areas with moderate risk level (Reg.I, Reg.III, Reg.IV, Reg.V) • Continuity of
placement of material on climate change on the national curriculum
Focus: for curriculum materials of Environment at the Elementary and Secondary Education
• Continuity of strengthening databases related to climate change
• Continuity of strengthening information systems related to climate change
• Continuity of strengthening researches related to climate change
Focus for ocean areas: eastern Indian Ocean at Reg.I, Reg.II, Reg.III Focus for coastal zones and small islands: Areas with low risk level, (Reg.VI, Reg.VII) • Continuity of
placement of material on climate change on the national curriculum
Focus: for curriculum materials of Natural Sciences at the Higher Education
• Evaluation of strengthening databases related to climate change
• Evaluation of strengthening information systems related to climate change
• Evaluation of strengthening researches related to climate change
Focus for ocean areas: South China Sea (Reg.I, Reg.II, Reg.IV) Focus for coastal zones and small islands: Areas with very low risk level • Continuity of
placement of material on climate change on the national curriculum
Focus: for curriculum materials of Natural Sciences at the Elementary and Secondary Education
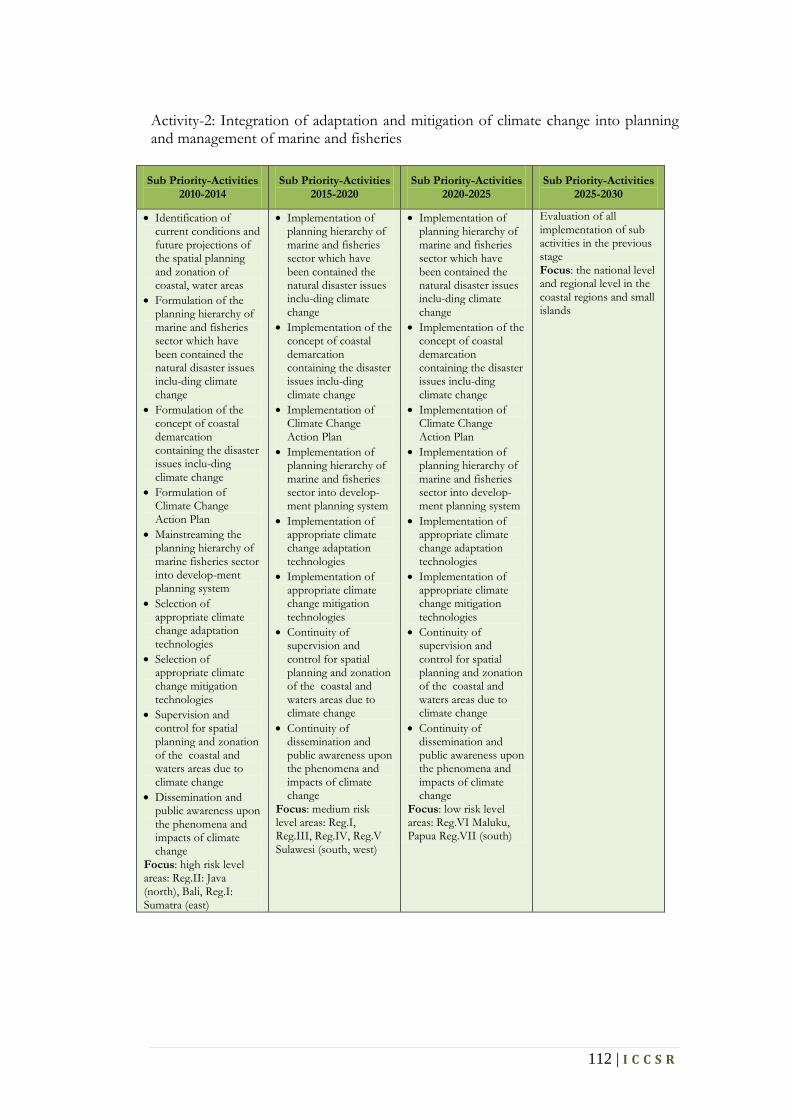
112 | I C C S R
Activity-2: Integration of adaptation and mitigation of climate change into planning and management of marine and fisheries
Sub Priority-Activities 2010-2014
Sub Priority-Activities 2015-2020
Sub Priority-Activities 2020-2025
Sub Priority-Activities 2025-2030
• Identification of current conditions and future projections of the spatial planning and zonation of coastal, water areas
• Formulation of the planning hierarchy of marine and fisheries sector which have been contained the natural disaster issues inclu-ding climate change
• Formulation of the concept of coastal demarcation containing the disaster issues inclu-ding climate change
• Formulation of Climate Change Action Plan
• Mainstreaming the planning hierarchy of marine fisheries sector into develop-ment planning system
• Selection of appropriate climate change adaptation technologies
• Selection of appropriate climate change mitigation technologies
• Supervision and control for spatial planning and zonation of the coastal and waters areas due to climate change
• Dissemination and public awareness upon the phenomena and impacts of climate change
Focus: high risk level areas: Reg.II: Java (north), Bali, Reg.I: Sumatra (east)
• Implementation of planning hierarchy of marine and fisheries sector which have been contained the natural disaster issues inclu-ding climate change
• Implementation of the concept of coastal demarcation containing the disaster issues inclu-ding climate change
• Implementation of Climate Change Action Plan
• Implementation of planning hierarchy of marine and fisheries sector into develop-ment planning system
• Implementation of appropriate climate change adaptation technologies
• Implementation of appropriate climate change mitigation technologies
• Continuity of supervision and control for spatial planning and zonation of the coastal and waters areas due to climate change
• Continuity of dissemination and public awareness upon the phenomena and impacts of climate change
Focus: medium risk level areas: Reg.I, Reg.III, Reg.IV, Reg.V Sulawesi (south, west)
• Implementation of planning hierarchy of marine and fisheries sector which have been contained the natural disaster issues inclu-ding climate change
• Implementation of the concept of coastal demarcation containing the disaster issues inclu-ding climate change
• Implementation of Climate Change Action Plan
• Implementation of planning hierarchy of marine and fisheries sector into develop-ment planning system
• Implementation of appropriate climate change adaptation technologies
• Implementation of appropriate climate change mitigation technologies
• Continuity of supervision and control for spatial planning and zonation of the coastal and waters areas due to climate change
• Continuity of dissemination and public awareness upon the phenomena and impacts of climate change
Focus: low risk level areas: Reg.VI Maluku, Papua Reg.VII (south)
Evaluation of all implementation of sub activities in the previous stage Focus: the national level and regional level in the coastal regions and small islands

113 | I C C S R
Activity-3: Formulation and / or adjustment of regulation, policy, and institutional capacity in the marine and fisheries sector related to climate change in coastal, small islands and ocean areas
Sub Priority-Activities 2010-2014
Sub Priority-Activities 2015-2020
Sub Priority-Activities 2020-2025
Sub Priority-Activities 2025-2030
• Formulation of norms, standards, guidelines and criteria of the adaptation and mitigation of climate change
• Adjustment of regulations and policies due to climate change
• Accelerating issuance of Decree of the Local Head upon the Strategic Plan of Marine and Fisheries Sector that have contained issues and strategies of disaster mitigation including climate change adaptation
• Accelerating issuance of Local Regulation on Zonation Plan of Marine and Fisheries Sector containing hazard and risk maps on climate change
• Improvement of the institutional capacity
• Improvement the supervision and control capacities, particularly based on the villages in coastal zones and small islands
Focus: the national and local levels in high risk level areas, such as Reg.II: Java (north), Bali, Reg.I: Sumatra (east)
• Implementation of norms, standards, guidelines & criteria of the adaptation and mitigation of climate change
• Implementation of regulations and policies due to climate change
• Accelerating issuance of Decree of the Local Head upon the Strategic Plan of Marine and Fisheries Sector that have contained issues and strategies of disaster mitigation including climate change adaptation
• Accelerating issuance of Local Regulation on Zonation Plan of Marine and Fisheries Sector containing hazard and risk maps on climate change
• Continuty of improvement of the institutional capacity
• Continuty of improvement the supervision and control capacities
Focus: Medium risk level areas such as Reg.I, Reg.III, Reg.IV Borneo (west, east, south), Reg.V Sulawesi (south, west)
• Implementation of norms, standards, guidelines & criteria of the adaptation and mitigation of climate change
• Implementation of regulations and policies due to climate change
• Accelerating issuance of Decree of the Local Head upon the Strategic Plan of Marine and Fisheries Sector that have contained issues and strategies of disaster mitigation including climate change adaptation
• Accelerating issuance of Local Regulation on Zonation Plan of Marine and Fisheries Sector containing hazard and risk maps on climate change
• Continuty of improvement of the institutional capacity
• Continuty of improvement the supervision and control capacities Focus: Low risk level areas, such as Reg.VI Maluku, Reg.VII Papua (south)
Evaluation of the implementation of sub activities in the previous stage Focus: the national level and regional level in the coastal regions and small islands

114 | I C C S R
Activity-4: Elevation adjustments and strengthening the structures of buildings and vital facilities in coastal zones related to climate change
Sub Priority-Activities 2010-2014
Sub Priority-Activities 2015-2020
Sub Priority-Activities 2020-2025
Sub Priority-Activities 2025-2030
• Identification of current conditions and future projections for all the infrastructure and vital facilities in coastal zones
• Adjustment of elevation and strengthening of building structures and vital facilities
• Assessment and dissemination of elevated house construction in the coastal zones
• Development and maintenance of coastal protection structures
• Development of Climate Resilience Villages in coastal zones and small islands
Focus: High-risk level areas such as Reg.II: Java (north), Bali, Reg.I: Sumatra (east)
• Adjustment of elevation and strengthening of building structures and vital facilities
• Assessment and dissemination of elevated house construction in the coastal zones
• Development and maintenance of coastal protection structures
• Development of Climate Resilience Villages in coastal zones and small islands
Focus: Medium risk level areas such as Reg.I, Reg.III, Reg.IV Kalimantan, Reg.V Sulawesi (south, west)
• Adjustment of elevation and strengthening of building structures and vital facilities
• Assessment and dissemination of elevated house construction in the coastal zones
• Development and maintenance of coastal protection structures
• Development of Climate Resilience Villages in coastal zones and small islands
Focus: Low risk level areas such as Reg.VI, Reg.VII Papua (south)
• Adjustment of elevation and strengthening of building structures and vital facilities
• Assessment and dissemination of elevated house construction in the coastal zones
• Development and maintenance of coastal protection structures
• Development of Climate Resilience Villages in coastal zones and small islands
Focus: all the coastal zones and small islands

115 | I C C S R
Activity-5: Adjustments of the integrated management of natural resources and ecosystems of coastal and small islands
Sub Priority-Activities 2010-2014
Sub Priority-Activities 2015-2020
Sub Priority-Activities 2020-2025
Sub Priority-Activities 2025-2030
• Identification of current conditions and future projections of ecosystem management of coastal and small islands
• Maintenance and rehabilitation of ecosystems and resources of coastal and small islands
• Maintenance and rehabilitation of natural coastal protection areas
• Maintenance and rehabilitation of water resources in coastal and small islands
• Development and dissemination of seawater distillation (desalination) and water recycling technologies
• Management of Marine Conservation Area
Focus: Coastal regions and small islands consisting of many ecosystems of mangrove and coral reefs
• Continuity of management of ecosystems and resources of coastal and small islands
• Continuity of management of natural coastal protection areas
• Maintenance and rehabilitation of water resources in coastal and small islands
• Continuity of management of seawater distillation (desalination) and water recycling technologies
• Continuity of management of Marine Conservation Area
Focus: Coastal regions and small islands consisting of many ecosystems of wetland and seagrass
• Continuity of management of ecosystems and resources of coastal and small islands
• Continuity of management of natural coastal protection areas
• Maintenance and rehabilitation of water resources in coastal and small islands
• Continuity of management of seawater distillation (desalination) and water recycling technologies
• Continuity of management of Marine Conservation Area
Focus: Coastal regions and small islands consisting of many ecosystems of estuarine and continental shelf
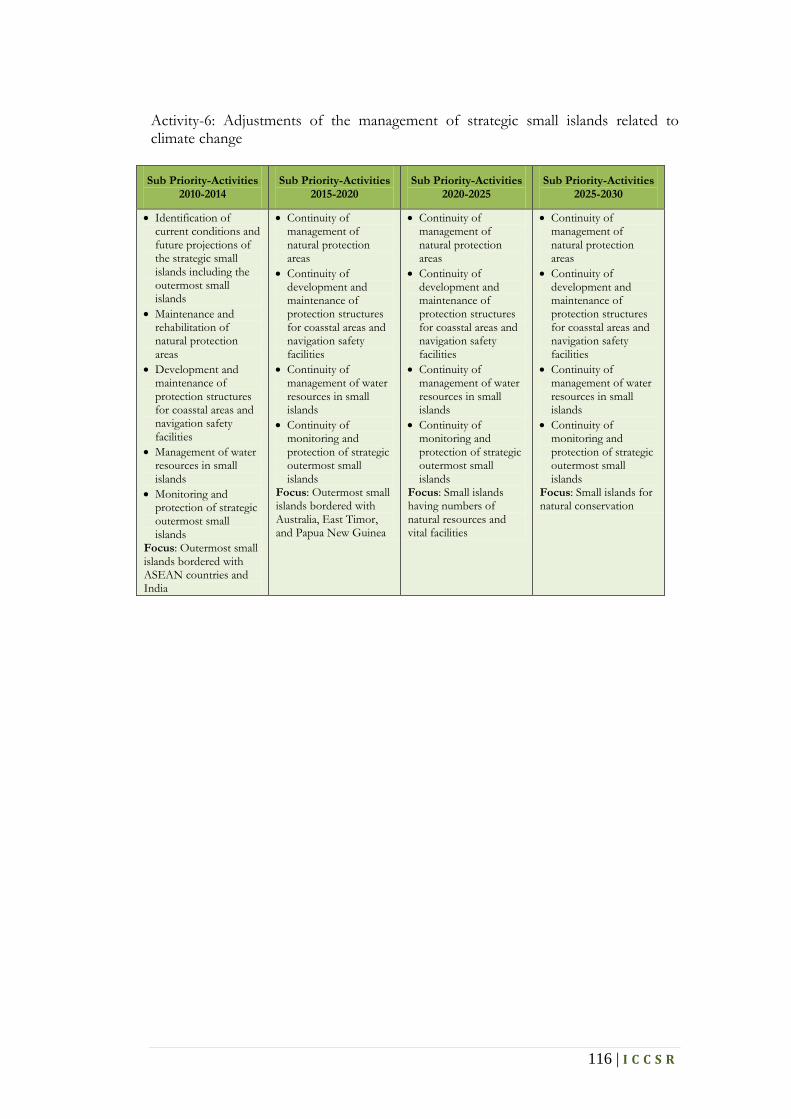
116 | I C C S R
Activity-6: Adjustments of the management of strategic small islands related to climate change
Sub Priority-Activities 2010-2014
Sub Priority-Activities 2015-2020
Sub Priority-Activities 2020-2025
Sub Priority-Activities 2025-2030
• Identification of current conditions and future projections of the strategic small islands including the outermost small islands
• Maintenance and rehabilitation of natural protection areas
• Development and maintenance of protection structures for coasstal areas and navigation safety facilities
• Management of water resources in small islands
• Monitoring and protection of strategic outermost small islands
Focus: Outermost small islands bordered with ASEAN countries and India
• Continuity of management of natural protection areas
• Continuity of development and maintenance of protection structures for coasstal areas and navigation safety facilities
• Continuity of management of water resources in small islands
• Continuity of monitoring and protection of strategic outermost small islands
Focus: Outermost small islands bordered with Australia, East Timor, and Papua New Guinea
• Continuity of management of natural protection areas
• Continuity of development and maintenance of protection structures for coasstal areas and navigation safety facilities
• Continuity of management of water resources in small islands
• Continuity of monitoring and protection of strategic outermost small islands
Focus: Small islands having numbers of natural resources and vital facilities
• Continuity of management of natural protection areas
• Continuity of development and maintenance of protection structures for coasstal areas and navigation safety facilities
• Continuity of management of water resources in small islands
• Continuity of monitoring and protection of strategic outermost small islands
Focus: Small islands for natural conservation

117 | I C C S R
Activity-7: Strengthening the capacity of disaster mitigation on climatology and oceanography in the coastal zone, small islands, and ocean
Sub Priority-Activities 2010-2014
Sub Priority-Activities 2015-2020
Sub Priority-Activities 2020-2025
Sub Priority-Activities 2025-2030
• Preparation of mitigation standard procedures for climatological and oceanographical disasters at coastal zones and small islands
• Development and dissemination of early warning system for climatological and oceanographical disasters
• Improvement of transportation networks, communications, and inventory system for live needs especially in remote coastal zones and small islands
• Increases of knowledge and skills of climatological and oceanographical disaster mitigation for the communities at the coastal zones and small islands
Focus: Sandy or muddy coastal regions and small islands exposed the Pacific Ocean (Reg.IV, Reg.V, Reg.VI, Reg.VII)
• Implementation of mitigation standard procedures for climatological and oceanographical disasters at coastal zones and small islands
• Continuity of development and dissemination of early warning system for climatological and oceanographical disasters
• Continuity of improvement of transportation networks, communications, and inventory system for live needs especially in remote coastal zones and small islands
• Continuity of increases of knowledge and skills of climatological and oceanographical disaster mitigation for the communities at the coastal zones and small islands
Focus: Sandy or muddy coastal regions and small islands exposed the Indian Ocean (Reg.I, Reg.II, Reg.III, Reg.VI, Reg.VII)
• Implementation of mitigation standard procedures for climatological and oceanographical disasters at coastal zones and small islands
• Continuity of development and dissemination of early warning system for climatological and oceanographical disasters
• Continuity of improvement of transportation networks, communications, and inventory system for live needs especially in remote coastal zones and small islands
• Continuity of increases of knowledge and skills of climatological and oceanographical disaster mitigation for the communities at the coastal zones and small islands
Focus: Sandy or muddy coastal regions and small islands exposed to the South China Sea (Reg.I, Reg.IV, Reg.V)
• Implementation of mitigation standard procedures for climatological and oceanographical disasters at coastal zones and small islands
• Continuity of development and dissemination of early warning system for climatological and oceanographical disasters
• Continuity of improvement of transportation networks, communications, and inventory system for live needs especially in remote coastal zones and small islands
• Continuity of increases of knowledge and skills of climatological and oceanographical disaster mitigation for the communities at the coastal zones and small islands
Focus: Sandy or muddy coastal regions and small islands in the internal Indonesian waters

118 | I C C S R
Activity-8: Adjustments of the integrated management of the potential resources of capture fisheries related to climate change
Sub Priority-Activities 2010-2014
Sub Priority-Activities 2015-2020
Sub Priority-Activities 2020-2025
Sub Priority-Activities 2025-2030
• Development and dissemination of information system and mapping of dynamic fishing ground
• Development and dissemination of real-time weather infor-mation systems in ocean
• Increases of capacity of fishermen to reach offshore fishing ground until the limit of EEZ (Exclusive Economic Zone) as well as to enhance fuel-efficiency
• Development of cold-chain system from the fishermen ship to fish auction and processing units.
• Strengthening and development of stock/ logistic management (cold storages, warehouses) to ensure the availability of food as well as input of fish processing units
Focus: Eastern WPP: 1. 716: Celebes Sea,
north of Halmahera; 2. 717: Paradise Bay, the
Pacific Ocean; 3. 718: Aru and Arafuru
Seas, eastern Timor Sea
• Continuity of development and dissemination of information system and mapping of dynamic fishing ground
• Continuity of development and dissemination of real-time weather infor-mation systems in ocean
• Continuity of increases of capacity of fishermen to reach offshore fishing ground until the limit of EEZ (Exclusive Economic Zone) as well as to enhance fuel-efficiency
• Continuity of development of cold-chain system from the fishermen ship to fish auction and processing units.
• Continuity of strengthening and development of stock/ logistic management (cold storages, warehouses) to ensure the availability of food as well as input of fish processing units
Focus: Eastern and central WPP: 1. 713: Makassar Strait,
Bone, Flores and Bali Seas;
2. 714: Gulf of Tolo, Banda Sea;
3. 715: Gulf Tomini, Molucca Sea, Halma-hera, Seram, Berau Bay;
• Continuity of development and dissemination of information system and mapping of dynamic fishing ground
• Continuity of development and dissemination of real-time weather infor-mation systems in ocean
• Continuity of increases of capacity of fishermen to reach offshore fishing ground until the limit of EEZ (Exclusive Economic Zone) as well as to enhance fuel-efficiency
• Continuity of development of cold-chain system from the fishermen ship to fish auction and processing units.
• Continuity of strengthening and development of stock/ logistic management (cold storages, warehouses) to ensure the availability of food as well as input of fish processing units
Focus: western and central WPP: 1. 571: Malacca Strait
and Andaman Sea; 2. 711: Karimata Strait,
Natuna, South China Sea
3. 712: Java Sea;
• Continuity of development and dissemination of information system and mapping of dynamic fishing ground
• Continuity of development and dissemination of real-time weather infor-mation systems in ocean
• Continuity of increases of capacity of fishermen to reach offshore fishing ground until the limit of EEZ (Exclusive Economic Zone) as well as to enhance fuel-efficiency
• Continuity of development of cold-chain system from the fishermen ship to fish auction and processing units.
• Continuity of strengthening and development of stock/ logistic management (cold storages, warehouses) to ensure the availability of food as well as input of fish processing units
Focus: western and sothern WPP: 1. 572: Indian Ocean:
western Sumatra, Sunda Strait;
2. 573: Indian Ocean: southern Java to Nusa Tenggara, Savu Sea, west part of Timor Sea;

119 | I C C S R
Activity-9: Adjustments of the integrated management of the potential resources of aquaculture fishery in marine, brackish water, and freshwater related to climate change
Sub Priority-Activities 2010-2014
Sub Priority-Activities 2015-2020
Sub Priority-Activities 2020-2025
Sub Priority-Activities 2025-2030
• Development of aquaculture species that are resilient to climate change
• Development of information system for seeding season
• Heightening, widening, deepening and strengthening of pond dikes and channels
• Strengthening and developing the role of fish marketing depot in terms of stock management
• Development of alternative sources of natural food
• Development of fish farming in wetlands
Focus: Eastern fisheries clusters: 1. Pangkep, South
Sulawesi; 2. Gorontalo, 3. Tomini Bay Central
Sulawesi; 4. Mamuju, Sulbar;
• Implementation of development of aquaculture species that are resilient to climate change
• Implementation of development of information system for seeding season
• Continuity of heightening, widening, deepening and strengthening of pond dikes and channels
• Continuity of strengthening and developing the role of fish marketing depot in terms of stock management
• Implementation of development of alternative sources of natural food
• Implementation of development of fish farming in wetlands
Focus: Central fisheries clusters: 1. Dompu, NTT; 2. East Sumba, West
Nusa Tenggara.
• Implementation continuity of development of aquaculture species that are resilient to climate change
• Implementation continuity of development of information system for seeding season
• Continuity of heightening, widening, deepening and strengthening of pond dikes and channels
• Continuity of strengthening and developing the role of fish marketing depot in terms of stock management
• Implementation continuity of development of alternative sources of natural food
• Implementation continuity of development of fish farming in wetlands
Focus: Western fisheries clusters: 1. Serang, Banten; 2. Sumenep, East Java; 3. Karimun in Riau
Islands
• Implementation continuity of development of aquaculture species that are resilient to climate change
• Implementation continuity of development of information system for seeding season
• Continuity of heightening, widening, deepening and strengthening of pond dikes and channels
• Continuity of strengthening and developing the role of fish marketing depot in terms of stock management
• Implementation continuity of development of alternative sources of natural food
• Implementation continuity of development of fish farming in wetlands
Focus: all 9 fisheries cluster and the outer one

120 | I C C S R
CHAPTER 6 CONCLUSIONS
The concept of long-term vision and cross-sectoral issues are two key words in
planning and implementing the climate change adaptation in the marine and fisheries
sector. The insight becomes essential since the hazards of climate change have
generally a slow onset, with the projection of direction and intensity being difficult to
predict.
Dealing with cross-sectoral issues becomes imperative as the coastal and ocean
regions become important for various activities of other sectors such as water
resources, agriculture, forestry, transportation, public works, health, defense and
security.
Also, the dissemination to the communities who live and conduct activities in coastal
zones by counseling, education, and increasing awareness of the hazards induced by
climate change becomes a key to successful implementation of the climate change
adaptation. One of the important things that need to be done is to straighten the
false public perception that the climate change has not occurred yet and this will
happen in the next decade or century.
Implementation of climate change adaptation is, however, being challenged by
various economic, social, and cultural problems in Indonesia. For example,
destructions of coastal ecosystems such as mangroves and wetlands become more
extensive whereas these ecosystems play a significant role as barriers for the impacts
of climate change in the coastal zones.

121 | I C C S R
References
Aldrin E. (2008). Predicting Precipitation Intencity for Vulnerability Assessment, Power Point.,
Presented in a Round Table Discussion on Dveloping a Methodology and
Information Sharing for Vulnerability assessment to Climate Change in Indonesia,
KLH-GTZ, 10 July 2008, Jakarta
Australian Greenhouse Office, Department of the Environment and Heritage (2005).
Climate Change Risk and Vulnerability, Promoting an Efficient Adaptation Response in
Australia, Final Report, The Allen Consulting Group
Badan Pengendalian Lingkungan Hidup Daerah Provinsi Jawa Barat (2008). Pedoman
Manajemen Pengurangan Risiko Kebencanaan Tsunami, Rob dan Gelombang Ekstrim
Wilayah Pesisir Jawa Barat.
Daw, T., W.N. Adger, K. Brown, M-C. Badjeck (2009). Climate Change and Capture
Fisheries. Dalam: K. Cochrane, C.D. Young, D. Soto, T.. Bahri (eds.), Climate
Change Implications for Fisheries and Aquaculture: Overview of Current
Scientific Knowledge. Food and Agriculture Organization of the United Nations,
Rome, p. 97 – 138.
Departemen Kelautan dan Perikanan (2005). Rencana Strategis Pembangunan Kelautan
dan Perikanan Tahun 2005–2009. Website: www.KKP.go.id
Departemen Kelautan dan Perikanan (2009). KKP Usulkan Kelautan dan Perikanan
menjadi Bidang Pembangunan Tersendiri. Pers releases, 27-9-
2009, http://www.KKP.go.id/index.php/ind/news/1601/
Departemen Kelautan dan Perikanan (2009). Rancangan Blueprint Pengelolaan Industri
Kelautan. Workshop Kebijakan Kelautan Indonesia, 12 Oktober 2009
Dewan Kelautan Indonesia (2008): Perumusan Kebijakan Lintas Sektoral dlam Rangka
Percepatan Pembangunan Perikanan, Pariwisata Bahari, dan Jasa Kelautan, Presentation
at UNCLOS Seminar, Jayakarta Hotel, 06 Nopember 2008
Diposaptono, S., Budiman, F. Agung (2009). Menyiasati Perubahan Iklim di Wilayah
Pesisir dan Pulau-Pulau Kecil. Penerbit Buku Ilmiah Populer, Printed I, Bogor.
Diposaptono, S. (2009), Review Draft Road Map Pengarusutamaan Isu Perubahan Iklim
Sektor Pesisir dan Laut, Departemen Kelautan dan Perikanan, Oktober 2009.

122 | I C C S R
Hadi, T.W, (2008). Kementrian Lingkungan Hidup dan GTZ (2009). Draft Laporan
Akhir Kajian Kerentanan dan Risiko Perubahan Iklim Pulau Lombok, NTB.
Hadi, S., I.M. Radjawane, K. Priyatna, H. Latief, T.W. Hadi, D.S. Soeroso (2009).
Kenaikan Permukaan Laut (Sea Level Rise). Dalam Buku: Majelis Guru Besar Institut
Teknologi Bandung, Mengelola Resiko Bencana di Negara Maritim Indonesia,
Institut Teknologi Bandung.
IPCC (2007). Climate Change 2007 - The Physical Science Basis: Contribution of Working
Group I to the Fourth Assessment Report of the IPCC. Cambridge, Cambridge
University Press.
KLH dan GTZ (2009). Laporan Akhir Kajian Kerentanan dan Strategi Adaptasi terhadap
Perubahan Iklim di Pulau Lombok, NTB: Sektor Pesisir dan Laut.
Kementerian Kelautan dan Perikanan (2010). Renstra Strategis Kementerian Kelautan dan
Perikanan 2010-2014.
Latief, H. dan Hadi, S.: “Status Oseonografi Pantai dalam Penataan Ruang Wilayah Pesisir
dan Laut di Kabupaten–Kabupaten”. National Seminar on Marine, Geodesi–ITB–
Bandung, 14 pp., 7 April 2001
Murray, S.P., D. Arief (1988). Throughflow into the Indian Ocean through the
Lombok Strait, Januari 1985 – Januari 1986, Nature, 333, 444-447
Ningsih, N.S. (2009). Gelombang Badai Pasang. Dalam Buku: Majelis Guru Besar
Institut Teknologi Bandung, Mengelola Resiko Bencana di Negara Maritim
Indonesia, Bandung.
Nybakken, J.W., (1992). Biologi Laut : Suatu Pendekatan Ekologis, PT. Gramedia,
Jakarta.
Nontji, A. (1993). Laut Nusantara, Djambatan, Jakarta.
Priyono, B.E., et.al. (1997). Potensi dan Penyebaran Sumber Daya Ikan Laut di Perairan
Indonesia, Direktorat Jenderal Perikanan Departemen Perikanan.
Sofyan, I. (2009). Roadmap Pengarusutamaan Isu Perubahan Iklim dalam Perencanaan
Pembangunan Nasional Kajian Dasar Akademis (Scientific Basis). Draft Laporan,
Bappenas – GTZ.
Susanto, R.D., (2000). El Nino dan Perpindahan Lokasi Ikan. Mailing-list Oseanina.
Tjasyono, B. (1999). Klimatologi Umum. Penerbit ITB

123 | I C C S R
UN-ISDR (2004). Living with Risk: Global Review of Disaster Reduction Initiatives. Geneva
USAID (2007). Adapting to Climate Variability and Change: A Guidance Manual for
Development Planning.
USAID (2009). Adapting to Coastal Climate Change: A Guidebook for Development Planners.
The Coastal Resources Center – University of Rhode Island (CRC–URI) and
International Resources Group (IRG)
Wyrtki, K.(1961) Naga Report Volume 2: Physical Oceanography of the Southeast Asian
Waters. The University of California, California.
--- (2008). Pemerintah Bentuk Sembilan Klaster Rumput Laut. Kompas News-paper,
Monday, 20 Oktober 2008
--- (2009). Peraturan Menteri Kelautan dan Perikanan No. 01-MEN-2009
http://rst.gsfc.nasa.gov/Sect16/Sect16_2.html

124 | I C C S R
Appendix I. Execution of Focus Group Discussion (FGD) with Associated Stakeholders
Table L. 1 List of Focus Group Discussion (FGD) Conducted Date Place Participants Schedule
24 February 2009
Bappenas KKP, KLH, LIPI, LAPAN, TNI-AL, Bakosurtanal, Dephut, BPLHD Jabar, BPPT, Ristek, Dept. PU
FGD I: Dissemination and coordination between agencies and experts associated to marine and fisheries sector
13 March 2009
KKP Ditjen KP3K KKP Planning of FGD II
17 March GTZ Sectors Introductory meeting with Dr. Irving Mintzer
20 March 2009
KKP Ditjen KP3K KKP Technical Planning of FGD II
24 March 2009
PPKPL-ITB Dr. Irving Mintzer Perform unstructured depth interviews
6 April 2009 KKP Bureau of Planning and DG KP3K KKP
Pre FGD II: An explanation of the scientific aspects of climate change and its impacts on this sector
22 April 2009 Borobudur Hotel, Jakarta
All work units of echelon I KKP and some experts on climate change
Pre FGD II: • Opening and directions from the
Secretary General of KKP • Description of the Roadmap by
each work unit of echelon I KKP 6 May 2009 Treva Hotel,
Jakarta All work units of echelon I KKP
Pre FGD II: A description of the technical aspects of development of this adaptation roadmap including priority activities
25 May 2009 Bappenas Echelon I units of work-related KKP and some experts on climate change
Review of initial draft of this roadmap compilation
17 June 2009 Nikko Hotel, Jakarta
Echelon I units KKP work related and other sectors
Cross-cutting issues between relevant sectors
9 July 2009 Park Lane Hotel, Jakarta
Echelon I units of work-related KKP
Sharpening the initial draft of this roadmap by relevant institutions
29 July 2009 Bappenas KKP Planning Bureau Finalization of Champion Program of each sector
8 October 2009
Manhattan Hotel, Jakarta
Echelon I units of work-related KKP, and KLH
Finalization of revised draft based on previous FGD and risk assessment
19 October 2009
KKP Bureau of Planning Unit of work echelon I KKP
Sharpening and finalization of the activities in the Roadmap

125 | I C C S R
Appendix II. Missions of Ministry of Marine and Fisheries Directly Related to Climate Change Adaptation Strategies
Table L. 2 Missions of KKP Strategic Plan Year 2005-2009 Strategic Items Description
Mission-3 Maintaining the supports and improving the quality of resources environment of marine and fisheries
Purpose Realizing the environmental condition of marine resources and fisheries quality Target The reduced level of damage to marine ecosystems and fisheries Target indicators • Reduction in violation rate of 5% per year
• Sustainability improvement of the ecosystem quality of coastal, ocean, and small islands
• Development of ocean conservation area covering 9 million hectares • Reduction of degraded areas and extinct species/genetics • Increase of obedience of legislation on spatial planning of ocean and small islands
Strategy Maintaining the sustainability of resources and ecosystems of ocean, coastal zones, small islands and freshwater
Policies • Improving rehabilitation and conservation of marine and fisheries resources and ecosystem
• Strengthening supervision and controlling in the uses of marine and fisheries resources
• Increasing the controlling efforts of illegal fishing Programs Conservation and Controlling Program of Marine and Fisheries Resources Sub-main activities
• Management and development of ocean conservation, and rehabilitation of damaged ecosystems habitats such as coral reefs, mangroves, seagrass, and estuarine
• Spatial planning of the ocean, coastal and small islands • Maintaining and improving management of ocean, coastal and small island
ecosystems • Increase of safety, marine natural disaster mitigation, climate forecasts in ocean • Identifying and naming small islands • Accelerating the settlement agreement and ocean border with neighboring
countries • Rehabilitation of cultivated resource areas • Improvement of capacity of marine and fisheries resources exploitation • Supervision and management of marine ecosystems and services • Research and technology development for the sustainable management of marine
and fisheries resources and ecosystems • Development of marine ecological research

126 | I C C S R
Appendix III. Vulnerability Description
Table L. 3 Sector vulnerability descriptions to climate change (source: KKP, 2005)
Vulnerability Element-1: Physical / Geographical Environments
No Vulnerability Parameter Estimated Quantity / Focused Location
1 Territory area 5.8 million km2 (70% total area) to the ZEE 2 Length of coastline 81.000 km 3 Exposure to Indian Ocean Sumatra's west coast, south coast of Java, Bali, Nusa
Tenggara, Maluku, Papua, the south coast 4 Exposure to the South China Sea Kep. Riau, Bangka Belitung, Jambi, Lampung, West
Kalimantan, East Kalimantan, North Sulawesi, Gorontalo, Central Sulawesi
5 Exposure to the Pacific Ocean North Sulawesi, North Maluku, north coast of Papua 6 Flatness of the coastal zone East coast of Sumatra, north coast of Java, south coast of
Bali, the coastal zones in Kalimantan, the south coast of Papua, and some small islands
7 The number of small islands 17,508 pieces 8 Distribution of small islands Present in every region in Indonesia 9 Tidal range Maximum of about 6 m 10 Waves height at the coast Maximum of about 3 m Vulnerability Element-2: Social / Demographic Conditions
No Vulnerability Parameter Estimated Quantity / Focused Location
1 Population
Current conditions (2005): 218 million Projections 2025: 273 million
2 Unequal distribution of population
131.8 million (60%) in P. Java (Reg. II) (2005) 46 million (21%) in P. Sumatra (Reg. I) 155.6 million (57%) in P. Java (Reg. II) (proy. 2025) 62 million (23%) in P. Sumatra (Reg. I)
3 The number of fishermen of captured fishery and of fish farmers
Fishermen: 3.4 million; (2004) Fish farmers: 2.4 million Fishermen: 5.2 million; (projection 2025) Fish farmers: 3.9 million
4 The number of fishery households
44,392 units (50.3%) in Sulawesi (Reg.V) 25,943 units (29.4%) in Nusa Tenggara (Reg.III) 6740 units (7.6%) in Sumatra (W.I) and 6320 units (7.2%) in Java (Reg.II)

127 | I C C S R
Vulnerability Element-3: Economics: Infrastructures and Vital Facilities No Vulnerability Parameter Estimated Quantity / Focused Location
1 Land use
• Settlements • Office, tourist locations, business areas • Forestry • Waters • Bushes, grass field, bare soil • Agriculture, plantation, ponds
2 Numbers of infrastructures and vital facilities developed in coastal zones
• Steam & gas power plants • Production of oil and its derivatives • Installation of drinking water and waste water disposal • Place the fish auction (TPI) • Aquacultured fisheries in marine, brackish, fresh waters • Tidal agriculture • Coastal and marine tourism • Transportation and distribution networks • Fishery, oceans, and inter-island ports • Defense and security
3 Numbers of major cities in coastal zones
31 cities (27%) in Java (Reg.II) 25 cities (21.7%) in Sulawesi (Reg.V) 24 cities (20.9%) in Sumatra (Reg.I) 14 cities (12.2%) in Kalimantan (Reg.IV)
Vulnerability Element-4: Economics: Potential Resources
No Vulnerability Parameter Estimated Quantity / Focused Location
1 Numbers and distribution of fishing ground in Indonesian territorial waters (grouped into eleven Regional Fisheries Management; WPP-RI):
1. 571: Malacca Strait and Andaman Sea; 2. 572: Indian Ocean: western Sumatra, Sunda Strait; 3. 573: Indian Ocean: southern Java to Nusa Tenggara,
Savu Sea, west part of Timor Sea; 4. 711: Karimata Strait, Natuna, South China Sea 5. 712: Java Sea; 6. 713: Makassar Strait, Bone, Flores & Bali Seas; 7. 714: Gulf of Tolo, Banda Sea; 8. 715: Gulf Tomini, Molucca Sea, Halma-hera, Seram,
Berau Bay; 9. 716: Celebes Sea, north of Halmahera; 10. 717: Paradise Bay, the Pacific Ocean; 11. 718: Aru and Arafuru Seas, eastern Timor Sea (Fig. III.8)
2 Numbers of marine aquaculture 65,827 ha in Sulawesi (Reg.V) 13,649 ha in East Nusa Tenggara (Reg.III)
3 Numbers of brackish water ponds
147,341 ha in Java (Reg.II) 126,423 ha in Sulawesi (Reg.V) 96,081 ha in Sumatra (Reg.I)
4 Numbers of fresh water ponds 117,894 ha in Java (Reg.II) 72,321 ha in Sumatra (Reg.I)
5 Numbers of outermost small islands
92 islands

128 | I C C S R
Vulnerability Element-5: Ecology No Vulnerability Parameter Estimated Quantity / Focused Location
1 Diversity of ecosystem types available in Indonesia
Ecosystems of coral reefs, mangroves, wetlands, shoreline, estuarine, and continental shelf areas
2 Extensive coral reefs
The total area of 60,000 km2 (1/8 of total area worldwide); (Figure 3.9)
3 Coral reef biodiversity
Comprising of about 300 species of coral, 200 species of fish and other biota
4 Fish diversity
About 25,000 species (88% of the distribution in the world)
5 Mangrove forest Size 5.21 million ha (1983-1993) Size 2.5 million Ha (2005) (Figure 3.10)

129 | I C C S R
Appendix IV. Interrelation between Potential Impacts and Adaptation Strategies as well as Hazards and Vulnerabilities Related to Climate Change
Table L. 4 Potential impacts and alternative adaptation specifically associated with hazard and vulnerability to climate change
Triggered hazard Physical
Environment Changes
Vulnerability Potential Impact Adaptation Strategy Alternatives Focus Areas
KT
PL
PKC
E
PVI-
CH
PV
I-A
AM
K
ML
/SL
R
√ √ √
Coastal inundation/ flooding
• Flat coastal slope • Small tide range • Large and dense population
Disruption of social activities in the settlement
• Identification of current condition and future projections of settlements in coastal zones
• Adjustment of spatial planning and zonation of coastal waters due to inundation hazards
• Adjustment of building level, elevated houses in coastal zone • Retreat and relocation of settlements in certain areas
• Reg.I: east coast of Sumatra
• Reg.II: north coast of Java, south coast of Bali
• Reg.III: Nusa Tenggara,
• Reg.IV: Kalimantan • Reg.V: Sulawesi, • Reg.VI: Maluku, • Reg.VII: Papua
• Flat coastal slope • Small tide range • Numbers of infrastructures
and vital facilities Numbers of enterprises using brackish and seawater ponds
Disruption of operational activity of infrastructure and vital facilities in the coastal zone
• Identification of current condition and future projections of infrastructures in coastal zones
• Adjustment of spatial planning and zonation of coastal waters due to inundation hazards
• Adjustment of levels of buildings and vital facilities in coastal zone • Heightening dikes of existing cultured fishery ponds Retreat and relocation of settlements in certain areas
√ √ √
Increases of coastal erosion
• Flat coastal slope • High significant wave heights • Coastal with exposure to
open ocean • Large and dense population
Damages of settlements in the coastal zone
• Identification of current condition and future projections of settlements in coastal zones
• Adjustment of spatial planning and zonation of coastal waters due to storm surge hazards
• Strengthening settlement building structures in coastal zone • Development and maintenance of coastal protection structures
(sea walls, groins, breakwaters, beach nourishments, tidal flood gates, etc.)
• Maintenance and rehabilitation of coastal vegetation (mangroves, etc.), sand dunes, coral reefs
• Retreat and relocation of settlements in certain areas
Sandy or muddy coastal zones that are exposed to: • Indian Ocean (Reg.I,
II, III, VI, VII) • Pacific Ocean (Reg.IV,
V, VI, VII) • South China Sea
(Reg.I, IV,V) • Internal Indonesian
waters

130 | I C C S R
Triggered hazard Physical
Environment Changes
Vulnerability Potential Impact Adaptation Strategy Alternatives Focus Areas
KT
PL
PKC
E
PVI-
CH
PV
I-A
AM
K
ML
/SL
R
• Flat coastal slope • Large mean wave heights • Coastal with exposure to
open ocean • Numbers of infrastructures
and vital facilities • Numbers of enterprises
using brackish and seawater ponds
Damage of infra-structures and vital facilities in the coastal zone
• Identification of current condition and future projections of infrastructures in coastal zones
• Adjustment of spatial planning and zonation of coastal waters due to storm surge hazards
• Strengthening building and vital facility structures in coastal zone • Strengthening, heightening, deepening dikes of existing ponds and
its channels • Development and maintenance of coastal protection structures
(sea walls, groins, breakwaters, beach nourishments, tidal flood gates, etc.)
• Maintenance and rehabilitation of coastal vegetation (mangroves, etc.), sand dunes, coral reefs
• Retreat and relocation of settlements in certain areas
Sandy or muddy coastal zones, which are exposed to: • Indian Ocean (Reg.I,
II, III, VI, VII) • Pacific Ocean (Reg.IV,
V, VI, VII) • South China Sea
(Reg.I, IV,V) • Internal Indonesian
waters
√ √ √
Sinking of small islands
• Flat coastal slope • Coastal with exposure to
open ocean • Small tidal range • Large mean wave heights • Large and dense population • Numbers of infrastructures
and vital facilities • Widely distributed, numbers
of islands, difficult to be accessed
Disruption of economic activities Damages of infrastructures and vital facilities
• Identification of current condition and future projections of strategic small islands
• Maintenance and rehabilitation of integrated small island resources and ecosystems
• Maintenance of coastal vegetation, sand dunes, coral reefs • Development of coastal protection structures and navigation
facilities
• Small islands for marine conservation
• Small islands with numbers of natural resources
• Small islands with numbers of vital facilities
√ √ √
Sinking of outermost strategic small islands
• Flat coastal slope • Coastal with exposure to
open ocean • Difficult to be accessed • Position as base point of
country border
Withdrawal of the country borders due to the sinking of the outermost strategic small islands
• Increases of supervision and controlling of protection systems of strategic outermost small islands
Small islands bordered with countries: • ASEAN, • Australia • East Timor • Papua New Guinea
√ √ √ Flooding of river and estuary
• Flat coastal slope • Large and dense population
Damages of settlements, infrastructures and
• Identification of current condition and future projections of river and estuary conditions
• Maintenance and rehabilitation of coastal water resources (dams,
• Mangrove areas • Estuarine, seagrass

131 | I C C S R
Triggered hazard Physical
Environment Changes
Vulnerability Potential Impact Adaptation Strategy Alternatives Focus Areas
KT
PL
PKC
E
PVI-
CH
PV
I-A
AM
K
ML
/SL
R
• Numbers of infrastructures and vital facilities
• Numbers of enterprises using brackish and seawater ponds
• Numbers of estuary systems
vital facilities in the coastal zone
levees, drainages, etc.) • Coral reefs • Small islands
√
Decrease in flow and water quality of rivers and estuaries; drought
• Large and dense population • Numbers of infrastructures
and vital facilities • Numbers of enterprises
using brackish and seawater ponds
Decreases of fresh water availability for coastal settlements, vital facilities, and ponds Decreases of productivity of brackish water and freshwater ponds
• Maintenance and rehabilitation of integrated water resources and coastal ecosystems
• Management of water resources in coastal zone (catchment wells, dams, levees, drainage, etc.)
• Development and dissemination of processing technologies of seawater into freshwater
• Mangrove area • Estuaria, seagrass • Coral reefs • Small Islands
√ √ √
Increases in salt intrusion in river and ground waters
• Numbers of estuary systems • Large and dense population • Numbers of infrastructures
and vital facilities Numbers of enterprises using freshwater ponds
Decline in freshwater supplies for coastal settlements, vital facilities, and ponds
√ √
Primary productivity changes Changes in fish migration pattern Fishing ground shifts
• Numbers of fishing grounds • Numbers of fishery
enterprises • Numbers of fishery
households • Numbers of fish population
in ocean
Decrease or increase in captured fisheries production Decrease or increase in capacity of fish processing units
• Development and dissemination of information system and mapping of dynamic fishing ground
• Strengthening the capacity of fishermen to reach the offshore fishing ground
• Development of cold chain system from fisherman ships to the fish auction location and household processing unit.
Eleven Fisheries Management Area (WPP)
√ √ Sudden changes of wind pattern at
• Numbers of fishing grounds • Numbers of fishery
enterprises
Decreases in the duration of catching fish in the
• Development and dissemination of information system on the accurate and real-time marine weather
• Strengthening the capacity of fishermen to reach the ofshore
Eleven WPP
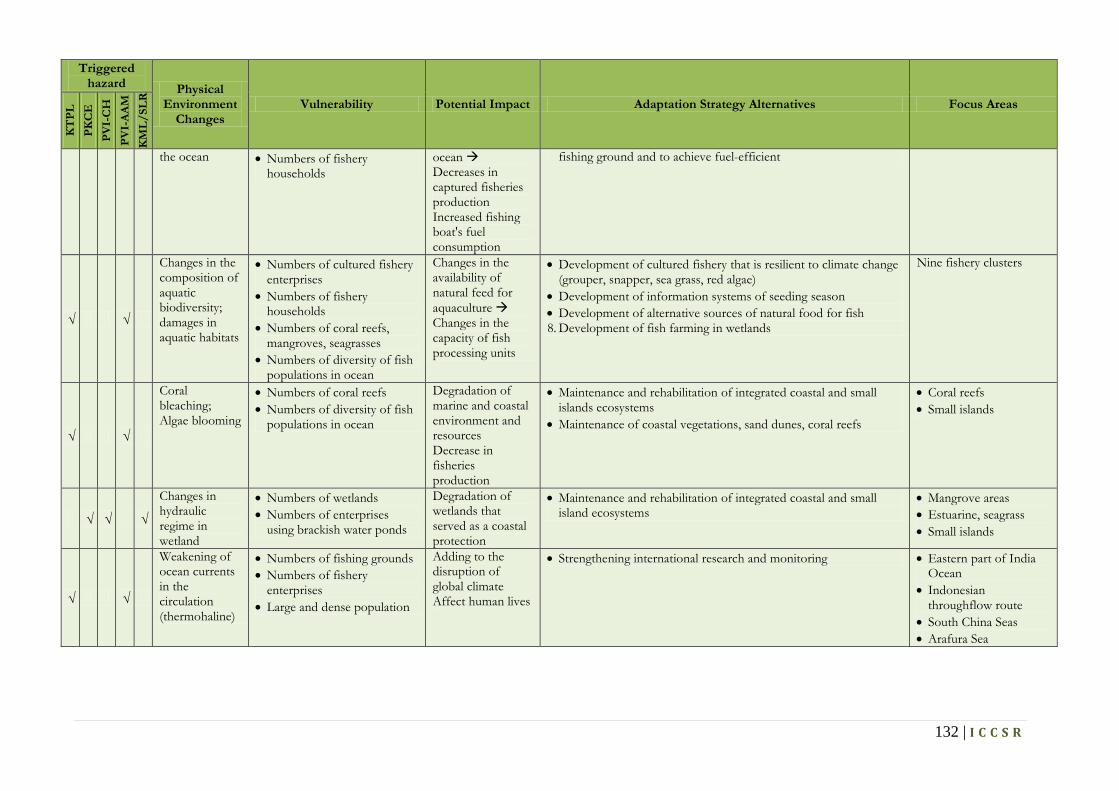
132 | I C C S R
Triggered hazard Physical
Environment Changes
Vulnerability Potential Impact Adaptation Strategy Alternatives Focus Areas
KT
PL
PKC
E
PVI-
CH
PV
I-A
AM
K
ML
/SL
R
the ocean • Numbers of fishery households
ocean Decreases in captured fisheries production Increased fishing boat's fuel consumption
fishing ground and to achieve fuel-efficient
√ √
Changes in the composition of aquatic biodiversity; damages in aquatic habitats
• Numbers of cultured fishery enterprises
• Numbers of fishery households
• Numbers of coral reefs, mangroves, seagrasses
• Numbers of diversity of fish populations in ocean
Changes in the availability of natural feed for aquaculture Changes in the capacity of fish processing units
• Development of cultured fishery that is resilient to climate change (grouper, snapper, sea grass, red algae)
• Development of information systems of seeding season • Development of alternative sources of natural food for fish 8. Development of fish farming in wetlands
Nine fishery clusters
√ √
Coral bleaching; Algae blooming
• Numbers of coral reefs • Numbers of diversity of fish
populations in ocean
Degradation of marine and coastal environment and resources Decrease in fisheries production
• Maintenance and rehabilitation of integrated coastal and small islands ecosystems
• Maintenance of coastal vegetations, sand dunes, coral reefs
• Coral reefs • Small islands
√ √ √
Changes in hydraulic regime in wetland
• Numbers of wetlands • Numbers of enterprises
using brackish water ponds
Degradation of wetlands that served as a coastal protection
• Maintenance and rehabilitation of integrated coastal and small island ecosystems
• Mangrove areas • Estuarine, seagrass • Small islands
√ √
Weakening of ocean currents in the circulation (thermohaline)
• Numbers of fishing grounds • Numbers of fishery
enterprises • Large and dense population
Adding to the disruption of global climate Affect human lives
• Strengthening international research and monitoring • Eastern part of India Ocean
• Indonesian throughflow route
• South China Seas • Arafura Sea

133 | I C C S R
Table L. 5 Adaptation alternatives related only to climate change adaptation capacities
Condition of adaptive capacity Alternative adaptation
Lack of capacities of research, monitoring, and assessment of: hazards/phenomena, vulnerabili-ties, potential impact and risk, adaptation and mitigation of climate change
• Strengthening the networking of database and information systems on relevant institutions • Strengthening the research and monitoring both in national and international scales • Mapping and analysis of hazards, vulnerabilities and disaster risks induced by climate change • Strengthening the assessments of adaptation and mitigation strategies to climate change in coastal, ocean, and small
islands Lack of capacities of legal and policy, institution, human resources, as well as monitoring and controlling to implement adaptation and mitigation of climate change on coastal and ocean areas
• Adjustment of laws and policies related to climate change (eg: Act No.27 Year 2007, Act No.26 Year 2007, Act No. 24 Year 2007, Act No. 31 Year 2004)
• Strengthening institutional capacity for climate change • Strengthening human resource capacity to manage climate change adaptation • Strengthening capacity for monitoring and controlling climate change adaptation; based on coastal and small island
villages • Development of Master Plan for Risk Management of Climate Change Induced Disasters • Dissemination and knowledge increase attempts of climate change adaptation and mitigation among the government
personnels, community leaders, coastal communities, young generations, and general public • Adjustment of the environment subject materials of school and university curriculum
Lack of experience in managing the disasters due to hazard impacts of extreme weather events and climate variability in coastal zone integratedly
• Strengthening the capacity of disaster mitigation due to extreme weather on the coastal zone and ocean. • Strengthening the capacity of transportation and liveline supply system to the remote coastal zone and small islands • Dissemination and and knowledge increase attempts of disaster mitigation due to extreme weather in coastal zone

134 | I C C S R
Appendix V. Priority Activities and Its Stages
No Priority Activity Part of Adaptation Strategies
Anticipated Hazards
Sub Priority-Activities 2010-2014
Sub Priority-Activities 2015-2020
Sub Priority-Activities 2020-2025
Sub Priority-Activities 2025-2030
Other Sector s/ Institutions to be involved
I. ACTIVITIES CLASS OF INVENTORIES OF DAT, INFORMATION SYSTEMS AND RESEARCHES
1 Implementation of inventories of data, information systems, and researches related to climate change
Strengthening the data bases, information systems, as well as research and assessment capacities
Associated to all types of hazards of climate change
• Strengthening databases related to climate change
• Strengthening information systems related to climate change
• Strengthening researches related to climate change
Focus for ocean areas: west part of Pacific Ocean, Reg.VI, Reg.VII Focus for coastal zones and small islands: Areas with a high level of risk to climate change (Reg.II, Reg.I) • Placement of material
on climate change on the national curriculum
Focus: for curriculum materials of Environment at the Higher Education
• Continuity of strengthening databases related to climate change
• Continuity of strengthening information systems related to climate change
• Continuity of strengthening researches related to climate change
Focus for ocean areas: Makassar Strait in Reg.IV, Reg.V; Lombok Strait in Reg.III Focus for coastal zones and small islands: Areas with moderate risk level (Reg.I, Reg.III, Reg.IV, Reg.V) • Continuity of
placement of material on climate change on the national curriculum
Focus: for curriculum materials of Environment at the Elementary and Secondary Education
• Continuity of strengthening databases related to climate change
• Continuity of strengthening information systems related to climate change
• Continuity of strengthening researches related to climate change
Focus for ocean areas: eastern Indian Ocean at Reg.I, Reg.II, Reg.III Focus for coastal zones and small islands: Areas with low risk level, (Reg.VI, Reg.VII) • Continuity of
placement of material on climate change on the national curriculum
Focus: for curriculum materials of Natural Sciences at the Higher Education
• Evaluation of strengthening databases related to climate change
• Evaluation of strengthening information systems related to climate change
• Evaluation of strengthening researches related to climate change
Focus for ocean areas: South China Sea (Reg.I, Reg.II, Reg.IV) Focus for coastal zones and small islands: Areas with very low risk level • Continuity of
placement of material on climate change on the national curriculum
Focus: for curriculum materials of Natural Sciences at the Elementary and Secondary Education
National Education Non-
departmental research institutions (BMKG, LAPAN, BPPT, PPGL, Bakosurtanal, Research and Technology)
ii. The provincial governments and local governments having coastal regions and small islands

135 | I C C S R
No Priority Activity Part of Adaptation Strategies
Anticipated Hazards
Sub Priority-Activities 2010-2014
Sub Priority-Activities 2015-2020
Sub Priority-Activities 2020-2025
Sub Priority-Activities 2025-2030
Other Sector s/ Institutions to be involved
II. ACTIVITY CLASS OF PLANNING 2 The integration
of adaptation and mitigation of climate change into planning and management of marine and fisheries
Integrated physical management of coastal zones and small islands
• Sea level rises • Increases of
frequency and intensity of storm surges
• Changes in the pattern of natural climate variabilities
• Identification of current conditions and projections of spatial planning and zonation of coastal, water areas
• Formulation of the planning hierarchy of marine and fisheries sector which have been contained climate change issues
• Formulation of the concept of coastal demarcation containing the disaster issues including climate change
• Formulation of Climate Change Action Plan
• Mainstreaming the planning hierarchy of marine fisheries sector into development planning system
• Selection of appropriate climate change adaptation technologies
• Selection of appropriate climate change mitigation technologies
• Supervision and
• Implementation of planning hierarchy of marine and fisheries sector which have been contained climate change issues
• Implementation of the concept of coastal demarcation containing the disaster issues inclu-ding climate change
• Implementation of Climate Change Action Plan
• Implementation of planning hierarchy of marine and fisheries sector into develop-ment planning system
• Implementation of appropriate climate change adaptation technologies
• Implementation of appropriate climate change mitigation technologies
• Continuity of supervision and control for spatial planning and zonation of the coastal and waters areas due to climate change
• Continuity of
Evaluation of all implementation of sub activities in the previous stage Focus: the national level and regional level in the coastal regions and small islands
• Public Works • Forestry • Agriculture • Tourism • Transportatio
n • Energy and
Mineral Resources
• The provincial governments and local governments having coastal regions and small islands

136 | I C C S R
No Priority Activity Part of Adaptation Strategies
Anticipated Hazards
Sub Priority-Activities 2010-2014
Sub Priority-Activities 2015-2020
Sub Priority-Activities 2020-2025
Sub Priority-Activities 2025-2030
Other Sector s/ Institutions to be involved
control for spatial planning and zonation of the coastal and waters areas due to climate change
• Dissemination and public awareness upon the phenomena and impacts of climate change
Focus: high risk level areas: Reg.II: Java (north), Bali, Reg.I: Sumatra (east)
dissemination and public awareness upon the phenomena and impacts of climate change
Focus: medium risk level areas: Reg.I, Reg.III, Reg.IV, Reg.V Sulawesi (south, west)
dissemination and public awareness upon the phenomena and impacts of climate change
Focus: low risk level areas: Reg.VI Maluku, Papua Reg.VII (south)
III. ACTIVITY CLASS OF REGULATION AND POLICY 3 Formulation and
/ or adjustment of regulation, policy, and institutional capacity in the marine and fisheries sector related to climate change in coastal, small islands and ocean areas
General adaptation strategies
Associated to all types of hazards of climate change
• Formulation of norms, standards, guidelines and criteria of the adaptation and mitigation of climate change
• Adjustment of regulations and policies due to climate change
• Accelerating issuance of Decree of the Local Head upon the Strategic Plan of Marine and Fisheries Sector that have contained issues and strategies of disaster mitigation including climate change adaptation
• Accelerating issuance
• Implementation of norms, standards, guidelines & criteria of the adaptation and mitigation of climate change
• Implementation of regulations and policies due to climate change
• Accelerating issuance of Decree of the Local Head upon the Strategic Plan of Marine and Fisheries Sector that have contained issues and strategies of disaster mitigation including climate change adaptation
• Accelerating issuance
Evaluation of the implementation of sub activities in the previous stage Focus: the national level and regional level in the coastal regions and small islands
• Laws and Regulations
• House of Representatives
• National Education

137 | I C C S R
No Priority Activity Part of Adaptation Strategies
Anticipated Hazards
Sub Priority-Activities 2010-2014
Sub Priority-Activities 2015-2020
Sub Priority-Activities 2020-2025
Sub Priority-Activities 2025-2030
Other Sector s/ Institutions to be involved
of Local Regulation on Zonation Plan of Marine and Fisheries Sector containing hazard and risk maps on climate change
• Improvement of the institutional capacity
• Improvement the supervision and control capacities, particularly based on the villages in coastal zones and small islands
Focus: the national and local levels in high risk level areas, such as Reg.II: Java (north), Bali, Reg.I: Sumatra (east)
of Local Regulation on Zonation Plan of Marine and Fisheries Sector containing hazard and risk maps on climate change
• Continuty of improvement of the institutional capacity
• Continuty of improvement the supervision and control capacities
Focus: Medium risk level areas such as Reg.I, Reg.III, Reg.IV Borneo (west, east, south), Reg.V Sulawesi (south, west)
of Local Regulation on Zonation Plan of Marine and Fisheries Sector containing hazard and risk maps on climate change
• Continuty of improvement of the institutional capacity
• Continuty of improvement the supervision and control capacities Focus: Low risk level areas, such as Reg.VI Maluku, Reg.VII Papua (south)
IV. ACTIVITY CLASS OF IMPLEMENTATION 4 Elevation
adjustments and strengthening the structures of buildings and vital facilities in coastal zones related to climate change
Environmentally sound physical engineering
• Sea level rises • Increases of
frequency and intensity of storm surges
• Changes in the pattern of natural climate variabilities
• Identification of current conditions and future projections for all the infrastructure and vital facilities in coastal zones
• Adjustment of elevation and strengthening of building structures and vital facilities
• Assessment and dissemination of elevated house construction in the
• Adjustment of elevation and strengthening of building structures and vital facilities
• Assessment and dissemination of elevated house construction in the coastal zones
• Development and maintenance of coastal protection structures
• Development of Climate Resilience
• Adjustment of elevation and strengthening of building structures and vital facilities
• Assessment and dissemination of elevated house construction in the coastal zones
• Development and maintenance of coastal protection structures
• Development of Climate Resilience
• Adjustment of elevation and strengthening of building structures and vital facilities
• Assessment and dissemination of elevated house construction in the coastal zones
• Development and maintenance of coastal protection structures
• Development of Climate Resilience
• Public Works • Tourism • Transportatio
n • Energy and
Mineral Resources
• Public Housing
• Development of Disadvantaged Regions
• The provincial governments

138 | I C C S R
No Priority Activity Part of Adaptation Strategies
Anticipated Hazards
Sub Priority-Activities 2010-2014
Sub Priority-Activities 2015-2020
Sub Priority-Activities 2020-2025
Sub Priority-Activities 2025-2030
Other Sector s/ Institutions to be involved
coastal zones • Development and
maintenance of coastal protection structures
• Development of Climate Resilience Villages in coastal zones and small islands
Focus: High-risk level areas such as Reg.II: Java (north), Bali, Reg.I: Sumatra (east)
Villages in coastal zones and small islands
Focus: Medium risk level areas such as Reg.I, Reg.III, Reg.IV Kalimantan, Reg.V Sulawesi (south, west)
Villages in coastal zones and small islands
Focus: Low risk level areas such as Reg.VI, Reg.VII Papua (south)
Villages in coastal zones and small islands
Focus: all the coastal zones and small islands
and local governments having coastal regions and small islands
5 Adjustments of the integrated management of natural resources and ecosystems of coastal and small islands
Integrated planning and management of coastal ecosystems and the small islands
Associated to all types of hazards of climate change
• Identification of current conditions and future projections of ecosystem management of coastal and small islands
• Maintenance and rehabilitation of ecosystems and resources of coastal and small islands
• Maintenance and rehabilitation of natural coastal protection areas
• Maintenance and rehabilitation of water resources in coastal and small islands
• Development and dissemination of
• Continuity of management of ecosystems and resources of coastal and small islands
• Continuity of management of natural coastal protection areas
• Maintenance and rehabilitation of water resources in coastal and small islands
• Continuity of management of seawater distillation (desalination) and water recycling technologies
• Continuity of management of Marine Conservation Area
• Environment • Public Works • The provincial
governments and local governments having coastal regions and small islands
• Other parties (private sector and NGOs both from inside and outside of the country)

139 | I C C S R
No Priority Activity Part of Adaptation Strategies
Anticipated Hazards
Sub Priority-Activities 2010-2014
Sub Priority-Activities 2015-2020
Sub Priority-Activities 2020-2025
Sub Priority-Activities 2025-2030
Other Sector s/ Institutions to be involved
seawater distillation (desalination) and water recycling technologies
• Management of Marine Conservation Area
Focus: Coastal regions and small islands consisting of many ecosystems of mangrove and coral reefs
Focus: Coastal regions and small islands consisting of many ecosystems of mangrove and coral reefs
Focus: Coastal regions and small islands consisting of many ecosystems of wetland and seagrass
Focus: Coastal regions and small islands consisting of many ecosystems of estuarine and continental shelf
6 Adjustments of the management of strategic small islands related to climate change
Management of territorial resources as well as defense and security
• Sea level rises • Increases of
frequency and intensity of storm surges
• Changes in the pattern of natural climate variabilities
• Identification of current conditions and future projections of the strategic small islands including the outermost small islands
• Maintenance and rehabilitation of natural protection areas
• Development and maintenance of protection structures for coasstal areas and navigation safety facilities
• Management of water resources in small islands
• Monitoring and protection of strategic outermost small
• Continuity of management of natural protection areas
• Continuity of development and maintenance of protection structures for coasstal areas and navigation safety facilities
• Continuity of management of water resources in small islands
• Continuity of monitoring and protection of strategic outermost small islands
Focus: Outermost small islands bordered with Australia, East Timor, and Papua New
• Continuity of management of natural protection areas
• Continuity of development and maintenance of protection structures for coasstal areas and navigation safety facilities
• Continuity of management of water resources in small islands
• Continuity of monitoring and protection of strategic outermost small islands
Focus: Small islands having numbers of natural resources and vital facilities
• Continuity of management of natural protection areas
• Continuity of development and maintenance of protection structures for coasstal areas and navigation safety facilities
• Continuity of management of water resources in small islands
• Continuity of monitoring and protection of strategic outermost small islands
Focus: Small islands for natural conservation
• Defense and Security
• Public Works • Environment • Domestic
Government • Foreign
Affairs • Indonesian
Navy • Provincial and
local governments having coastal regions / small islands

140 | I C C S R
No Priority Activity Part of Adaptation Strategies
Anticipated Hazards
Sub Priority-Activities 2010-2014
Sub Priority-Activities 2015-2020
Sub Priority-Activities 2020-2025
Sub Priority-Activities 2025-2030
Other Sector s/ Institutions to be involved
islands Focus: Outermost small islands bordered with ASEAN countries and India
Guinea
7 Strengthening the capacity of disaster mitigation on climatology and oceanography in the coastal, small islands, and ocean
Associated to all types of adaptation strategies
• Sea level rises • Increases of
frequency and intensity of storm surges
• Changes in the pattern of natural climate variabilities
• Preparation of mitigation standard procedures for climatological and oceanographical disasters at coastal zones and small islands
• Development and dissemination of early warning system for climatological and oceanographical disasters
• Improvement of transportation networks, communications, and inventory system for live needs especially in remote coastal zones and small islands
• Increases of knowledge and skills of climatological and oceanographical disaster mitigation for the communities at the coastal zones and small islands
Focus: Sandy or muddy coastal regions and
• Implementation of mitigation standard procedures for climatological and oceanographical disasters at coastal zones and small islands
• Continuity of development and dissemination of early warning system for climatological and oceanographical disasters
• Continuity of improvement of transportation networks, communications, and inventory system for live needs especially in remote coastal zones and small islands
• Continuity of increases of knowledge and skills of climatological and oceanographical disaster mitigation for the communities at the coastal zones and
• National Disaster Management Agency
• Non-departmental research institutions (BMKG, LAPAN, BPPT, Research and Technology)
• Domestic Government
• Transportation
• Indonesian Navy
• The provincial governments and local governments having coastal regions and small islands

141 | I C C S R
No Priority Activity Part of Adaptation Strategies
Anticipated Hazards
Sub Priority-Activities 2010-2014
Sub Priority-Activities 2015-2020
Sub Priority-Activities 2020-2025
Sub Priority-Activities 2025-2030
Other Sector s/ Institutions to be involved
small islands exposed the Pacific Ocean (Reg.IV, Reg.V, Reg.VI, Reg.VII)
small islands Focus: Sandy or muddy coastal regions and small islands exposed the Indian Ocean (Reg.I, Reg.II, Reg.III, Reg.VI, Reg.VII)
small islands Focus: Sandy or muddy coastal regions and small islands exposed to the South China Sea (Reg.I, Reg.IV, Reg.V)
small islands Focus: Sandy or muddy coastal regions and small islands in the internal Indonesian waters
8 Adjustments of the integrated management of the potential resources of capture fisheries related to climate change
Management and marketing of capture fisheries
• Increes of sea water temperature
• Changes in the pattern of natural climate variabilities (changes in circulation patterns of ocean currents)
• Increases of frequency and intensity of storm surges
• Development and dissemination of information system and mapping of dynamic fishing ground
• Development and dissemination of real-time weather infor-mation systems in ocean
• Increases of capacity of fishermen to reach offshore fishing ground until the limit of EEZ (Exclusive Economic Zone) as well as to enhance fuel-efficiency
• Development of cold-chain system from the fishermen ship to fish auction and processing units.
• Strengthening and development of stock/ logistic management (cold storages, warehouses) to ensure the
• Continuity of development and dissemination of information system and mapping of dynamic fishing ground
• Continuity of development and dissemination of real-time weather infor-mation systems in ocean
• Continuity of increases of capacity of fisher-men to reach offshore fishing ground until the limit of EEZ and to enhance fuel-efficiency
• Continuity of development of cold-chain system from the fishermen ship to fish auction & processing units.
• Continuity of strengthening and development of
• Continuity of development and dissemination of information system and mapping of dynamic fishing ground
• Continuity of development and dissemination of real-time weather infor-mation systems in ocean
• Continuity of increases of capacity of fishermen to reach offshore fishing ground until the limit of EEZ as well as to enhance fuel-efficiency
• Continuity of development of cold-chain system from the fishermen ship to fish auction and processing units.
• Continuity of strengthening and development of
• Public Works • Micro, Small
and Medium Enterprises (MSMEs)
• Non-departmental research institutions (BMKG, LAPAN, BPPT, Research and Technology)
• The provincial government and local governments with coastal regions and small islands

142 | I C C S R
No Priority Activity Part of Adaptation Strategies
Anticipated Hazards
Sub Priority-Activities 2010-2014
Sub Priority-Activities 2015-2020
Sub Priority-Activities 2020-2025
Sub Priority-Activities 2025-2030
Other Sector s/ Institutions to be involved
availability of food as well as input of fish processing units
Focus: Eastern WPP: 4. 716: Celebes Sea,
north of Halmahera; 5. 717: Paradise Bay, the
Pacific Ocean; 6. 718: Aru and Arafuru
Seas, eastern Timor Sea
stock/ logistic management to ensure the availability of food as well as input of fish processing units
Focus: Eastern and central WPP: 1. 713: Makassar Strait,
Bone, Flores, Bali Seas
2. 714: Gulf of Tolo, Banda Sea;
3. 715: Gulf of Tomini, Maluku Sea, Halma-hera, Seram, Berau Bay
stock/ logistic management to ensure the availability of food as well as input of fish processing units
Focus: western and central WPP: 4. 571: Malacca Strait
and Andaman Sea; 5. 711: Karimata Strait,
Natuna, South China Sea
6. 712: Java Sea;
stock/ logistic management to ensure the availability of food as well as input of fish processing units
Focus: western and sothern WPP: 3. 572: Indian Ocean:
western Sumatra, Sunda Strait;
4. 573: Indian Ocean: southern Java to Nusa Tenggara, Savu Sea, west part of Timor Sea;
9 Adjustments of the integrated management of the potential resources of aquaculture fishery in marine, brackish water, and freshwater related to climate change
Management and marketing of cultured aquaculture
• Increases in sea water temperature
• Changes in the pattern of natural climate variabilities (changes in rainfall and river discharge patterns)
• Sea level rises • Increases of
frequency and intensity of storm surges
• Development of aquaculture species that are resilient to climate change
• Development of information system for seeding season
• Heightening, widening, deepening and strengthening of pond dikes and channels
• Strengthening and developing the role of fish marketing depot in terms of stock management
• Development of alternative sources of natural food
• Implementation of development of aquaculture species that are resilient to climate change
• Implementation of development of information system for seeding season
• Continuity of heightening, widening, deepening and strengthening of pond dikes and channels
• Continuity of strengthening and developing the role of fish marketing depot in terms of stock management
• Implementation continuity of development of aquaculture species that are resilient to climate change
• Implementation continuity of development of information system for seeding season
• Continuity of heightening, widening, deepening and strengthening of pond dikes and channels
• Continuity of strengthening and developing the role of fish marketing depot
• Public Works • Micro, Small
& Medium Enterprises (MSMEs)
• Non-departmental research institutions
• The provincial governments and local governments having coastal regions and small islands

143 | I C C S R
No Priority Activity Part of Adaptation Strategies
Anticipated Hazards
Sub Priority-Activities 2010-2014
Sub Priority-Activities 2015-2020
Sub Priority-Activities 2020-2025
Sub Priority-Activities 2025-2030
Other Sector s/ Institutions to be involved
• Development of fish farming in wetlands
Focus: Eastern fisheries clusters: 5. Pangkep, South
Sulawesi; 6. Gorontalo, 7. Tomini Bay Central
Sulawesi; 8. Mamuju, Sulbar;
• Implementation of development of alternative sources of natural food
• Implementation of development of fish farming in wetlands
Focus: Central fisheries clusters: 1. Dompu, NTT; 2. East Sumba, West
Nusa Tenggara.
in terms of stock management
• Implementation continuity of development of alternative sources of natural food
• Implementation continuity of development of fish farming in wetlands
Focus: Western fisheries clusters: 4. Serang, Banten; 5. Sumenep, East Java; 6. Karimun in Riau
Islands
in terms of stock management
• Implementation continuity of development of alternative sources of natural food
• Implementation continuity of development of fish farming in wetlands
Focus: all 9 fisheries cluster and the outer one