701363/fulltext01.pdf · nordic statistical yearbook 2010 nordisk statistisk årsbok 2010 isbn...
TRANSCRIPT

Nordic Statistical Yearbook
2010Nordisk statistisk årsbok
NSÅ 2010- omslag101010.indd 1 15-10-2010 11:55:22

NSÅ 2010- omslag101010.indd 2 15-10-2010 11:55:22

Nordic Statistical
Yearbook 2010
Nordisk statistisk årsbok 2010
Volume 48
Edited byUlla AgerskovStatistics Denmark
Nord 2010:001

Nordic Statistical Yearbook 2010
Nordisk statistisk årsbok 2010
ISBN 978-92-893-2137-2
ISSN 1398-0017
Nord 2010:001
ISSN 0903-7004
© Nordic Council of Ministers, Copenhagen 2010
Design: Publication Unit, Nordic Council of Ministers, Copenhagen
Print: Scanprint A/S, Denmark
Copies: 1 500
Nordic Statistical Yearbook web-site: www.norden.org
Main suppliers of data: The Nordic national statistical institutes.
Editor: Ulla Agerskov, [email protected], Statistics Denmark.
Secretariat: Leila L. Hjulgaard, [email protected], Statistics Denmark.
Maps: LIBER KARTOR, Stockholm.
Printed in Denmark
Nordic Council of Ministers Nordic Council
Ved Stranden 18 Ved Stranden 18
DK-1061 Copenhagen K DK-1061 Copenhagen K
Phone (+45) 3396 0200 Phone (+45) 3396 0400
Fax (+45) 3396 0202 Fax (+45) 3311 1870
www.norden.org
Nordic co-operation
Nordic co-operation is one of the world’s most extensive forms
of regional collaboration, involving Denmark, Finland, Iceland,
Norway, Sweden, and three autonomous areas: the Faroe Islands,
Greenland, and Åland.
Nordic co-operation has firm traditions in politics, the economy,
and culture. It plays an important role in European and
international collaboration, and aims at creating a strong Nordic
community in a strong Europe.
Nordic co-operation seeks to safeguard Nordic and regional
interests and principles in the global community. Common Nordic
values help the region solidify its position as one of the world’s
most innovative and competitive.

3Preface · Förord
Preface
The Nordic countries have much in common – their way of life, history, language and social structure. Many of these common features and the results of their joint efforts may be described by statistics. This is why the Nordic Council of Ministers publishes the Nordic Statistical Yearbook.
Our ambition is to provide comparable statistics on the life in the Nordic countries – to shed light on the similarities and the differences. Against the background of globalization, data on conditions in the Nordic in relation to other Western European countries are also provided in a number of areas. The emphasis has been on making the data easy to understand and relevant to the way we live, and thus useful in many contexts.
The 2010 edition includes a new page about the Sami popu-lation under Facts about the Nordic countries. Other new features are figures about relative poverty, youth unemployment, part-time employment and unaccompanied children seeking asylum in the Nordic countries.
The book also gives a good overview of, how the Nordic countries are coping with the present financial crisis.
There is free access to a databank containing thousands of figures describing the Nordic region. The databank can be found at the Nordic Council of Ministers’ website, www.norden.org. Data for the Yearbook are extracted from this databank. It is also possible to download, free of charge, the Nordic Statistical Yearbook in pdf format at www.norden.org
If errors are detected after the deadline for publishing, corrections to the page in question will be available at www.norden.org.
Enjoy your reading!
Copenhagen, October 2010
Halldór ÁsgrímssonSecretary GeneralNordic Council of Ministers

4 Preface · Förord
Förord
De nordiska länderna har mycket gemensamt – livsstil, histo-ria, språk och samhällsstruktur – vilket ligger till grund för en unik tradition av samarbete. Mycket av detta kan beskrivas med statistik, vilket är anledningen till att Nordiska ministerrådet ger ut Nordisk statistisk årsbok.
Ambitionen är att presentera jämförbar statistik om livet och livsvillkoren i de nordiska länderna – att belysa likheterna och skillnaderna. I ljuset av globaliseringen behandlas också de nordiska ländernas förhållande till det övriga Västeuropa på en rad områden. Stor vikt har lagts på att göra uppgifterna lätta att förstå och relevanta för det sätt på vilket vi lever. På så vis kan boken få många användningsområden.
2010 års upplaga innehåller en ny sida om den samiska befolkningen under Fakta om de nordiska länderna. Andra nya uppgifter är siffror om relativ fattigdom, ungdomsarbetslöshet, deltidsanställning och ensamkommande barn som söker asyl i de nordiska länderna.
Boken ger också en bra överblick över hur de nordiska länderna klarar sig i den ekonomiska krisen.
Det finns fri tillgång till en databas med tusentals siffror om Norden, som ger otaliga möjligheter till intressanta analyser. Databasen finns på Nordiska ministerrådets webbplats www.norden.org. Uppgifterna i årsboken kommer från denna databas. Det är också möjligt att kostnadsfritt läsa boken i pdf-format på hemsidan.
Eventuella rättelser till fel som upptäcks efter bokens publice-ring kommer att finnas tillgängliga på www.norden.org.
Mycket nöje med läsningen!
Köpenhamn i oktober 2010
Halldór ÁsgrímssonGeneralsekreterareNordiska ministerrådet

5Contents · Innehåll
Contents
Preface . . . . . . . . . . . . . . . . . . . . . . . . . . . . . . . . . . . . . . . . . 3
Contents . . . . . . . . . . . . . . . . . . . . . . . . . . . . . . . . . . . . . . . . 5
Facts about the Nordic countries . . . . . . . . . . . . . . . . . . . . 8
Substainable development . . . . . . . . . . . . . . . . . . . . . . . . . 18
Environment and energy . . . . . . . . . . . . . . . . . . . . . . . . . . . 21Area, land use, energy, global warming, emissions, fertilizers, pesticides and organic farming
Population . . . . . . . . . . . . . . . . . . . . . . . . . . . . . . . . . . . . . . 33Life expectancy, dependency ratio, population changes and projections, fertility, abortions, family structure, migration, asylum and elections
Science and technology . . . . . . . . . . . . . . . . . . . . . . . . . . . . 51Research and development and ICT
Quality of life . . . . . . . . . . . . . . . . . . . . . . . . . . . . . . . . . . . . 59Income, social assistance, pensions, absence from work, childcare, maternity days benefits, health, causes of death, smoking, alcohol and culture
Education . . . . . . . . . . . . . . . . . . . . . . . . . . . . . . . . . . . . . . . 77Enrolment and graduates, level of education and student financial aid
Economic trends . . . . . . . . . . . . . . . . . . . . . . . . . . . . . . . . . . 85Economic growth, factors behind economic growth, primary sector, manufacturing and service sector
Globalisation . . . . . . . . . . . . . . . . . . . . . . . . . . . . . . . . . . . . 97Import, export and trade, foreign assets and liabilities, balance of payments, foreign direct investments and studying abroad Public finance and prices . . . . . . . . . . . . . . . . . . . . . . . . . . . 110General government expenditure, taxes, budget deficit, debt, development aid to developing countries, consumer prices, real estate prices, exchange rates, share prices and interest rate
Labour market . . . . . . . . . . . . . . . . . . . . . . . . . . . . . . . . . . . 126Activity rates, unemployment, employment and commuting
Appendix 1: User guide . . . . . . . . . . . . . . . . . . . . . . . . . . . . 137
Appendix 2: Geonomenclature . . . . . . . . . . . . . . . . . . . . . . 141
Subject index – English . . . . . . . . . . . . . . . . . . . . . . . . . . . . 142
Subject index – Swedish . . . . . . . . . . . . . . . . . . . . . . . . . . . 147
Throughout the book the following symbols and country codes are used:
Symbols Country codes
Nil - Denmark: DK Åland: AX
Less than half 0 Faroe Islands: FO Iceland: IS
Not applicable . Greenland: GL Norway: NO
Data not available .. Finland: FI Sweden: SE
To describe the different countries in the diagrammes following colours
are used:
Denmark: Greenland: Åland: Norway:
Faroe Islands: Finland: Iceland: Sweden:

6 Contents · Innehåll
Innehåll
Förord . . . . . . . . . . . . . . . . . . . . . . . . . . . . . . . . . . . . . . . . . . 3
Innehåll . . . . . . . . . . . . . . . . . . . . . . . . . . . . . . . . . . . . . . . . . 5
Fakta om de nordiska länderna . . . . . . . . . . . . . . . . . . . . . . 8
Hållbar utveckling . . . . . . . . . . . . . . . . . . . . . . . . . . . . . . . . 18
Miljö och energi . . . . . . . . . . . . . . . . . . . . . . . . . . . . . . . . . . 21Areal, markanvändning, energi, global uppvärmning, utsläpp, gödningsmedel, bekämpningmedel och ekologiskt jordbruk
Befolkning . . . . . . . . . . . . . . . . . . . . . . . . . . . . . . . . . . . . . . 33Medellivslängd, försörjningsbördan, befolkningsutveckling och prognoser, fruktsamhet, aborter, familjestruktur, migration, asyl och val
Vetenskap och teknologi . . . . . . . . . . . . . . . . . . . . . . . . . . . 51Forskning och utveckling och IT
Livskvalitet . . . . . . . . . . . . . . . . . . . . . . . . . . . . . . . . . . . . . . 59Inkomst, socialhjälp, pensioner, sjukfrånvaro, barnomsorg, havandeskaps- och föräldrapenning, hälsa, dödsorsaker, rökning, alkohol och kultur
Utbildning . . . . . . . . . . . . . . . . . . . . . . . . . . . . . . . . . . . . . . . 77Inskrivna och examinerade, utbildningsnivå och studiestöd
Ekonomiska tendenser . . . . . . . . . . . . . . . . . . . . . . . . . . . . 85Ekonomisk tillväxt, faktorer bakom ekonomiska tillväxten, basnäringarna, industrin och servicesektorn
Globalisering . . . . . . . . . . . . . . . . . . . . . . . . . . . . . . . . . . . . 97Import, export och handel, utländska tillgångar och skulder, betalningsbalans, utländska direktinvesteringar och utomlands studerande Offentlig ekonomi och priser . . . . . . . . . . . . . . . . . . . . . . . . 110Offentliga utgifter, skatter, offentliga sektorns underskott och skuld, statligt internationellt bistånd, konsumentpriser, fastighetspriser, växelkurser, aktiekurser och ränteutveckling
Arbetsmarknad . . . . . . . . . . . . . . . . . . . . . . . . . . . . . . . . . . . 126Relativa arbetskraftstal, arbetslöshet, sysselsättning och arbetspendling
Bilaga 1: Användarhandledning . . . . . . . . . . . . . . . . . . . . . 137
Bilaga 2: Geonomenklatur . . . . . . . . . . . . . . . . . . . . . . . . . 141
Sakregister – engelska . . . . . . . . . . . . . . . . . . . . . . . . . . . . 142
Sakregister – svenska . . . . . . . . . . . . . . . . . . . . . . . . . . . . . 147
Följande symboler och landskoder används genomgående i boken:
Symboler Landskoder
Noll - Danmark: DK Åland: AX
Mindre än hälften 0 Färöarna: FO Island: IS
Inte tillämpligt . Grönland: GL Norge: NO
Uppgift saknas .. Finland: FI Sverige: SE
Följande färger används för att beskriva de olika länderna i diagrammen:
Danmark: Grönland: Åland: Norge:
Färöarna: Finland: Island: Sverige:
7Key figures · Nyckel tal
Key figures · 7 Nyckel tal
The Nordic region in an international context – key figures. 2009Norden i ett internationellt sammanhang – nyckeltal
Norden Euro-area United States Japan
Total areal, 1 000 km2 Total area, 1 000 sq km 3 429 2 650 9 629 378 Landareal, 1 000 km2 Land area, 1 000 sq km 1 577 2 616 9 160 375
Arable land, per cent of land area 18.8 24.7 18.1 11.6 Åkermark, procent av landarealen
Population, million 26 329 307 127 Folkmängd, miljoner Invånare per km2 Inhabitants per sq km 16 126 33 338
1.51 Fertility rate (2008) 1.9 2.1 1.4 Fertilitet (2008) Part of population, 0–14 years, per cent 17.5 15.5 20.3 13.5 Andel invånare, 0–14 år procent Part of population, 65+ years, per cent 16.6 17.9 12.6 22.1 Andel invånare, 65+ år, procent Life expectancy (2008): men, years women, years
Medellivslängd (2008): År, män
År, kvinnor 78 78
83 7681
7986 83
Production of energy, 1000 tons oil equiv.(2008) 298 150 453 614 1 706 060 88 660 Energiproduktion, 1 000 ton oljeekvivalenter (2008) Consumption of energy per person, kg oil equiv. (2008) 6 609 3 861 7 500 3 880 Konsumtion av energi per person, kg oljeekvivalenter (2008) Emission of greenhouse gases, tons CO2 equiv., per person (2008) 10.2 8.4 23.2 10.7 Utsläpp av växthusgaser, CO2-ekvivalenter, ton per person (2008)
GDP, billion euro 968 8 963 10 123 3 639 BNP, miljarder euro 27 2003 GDP per capita, PPP-euro 30 318 25 500 34 500 BNP per person, PPP euro
6.5 -0.6 -3.0 3.2 Balance of payments, current account surplus, per cent of GDP Betalningsbalans överskott, procent av BNP
178.04 Off. sektorns skulder, procent av BNP General government debt ult. per cent of GDP 43.3 78.7 53.1 0.5 -6.3 -6.1 -5.6 General govern. public surplus per cent of GDP Offentliga sektorns överskott, procent av BNP
Labour force participation rate, per cent (2007), men women
Relativa arbetskraftstal (2008), män
kvinnor 81.776.7
80.1 64.8
80.870.4
85.261.9
4.9 9.4 9.3 5.1 Unemployment rate, per cent Arbetslöshet, procent
39.32 26.93 28.3 Skattetryck, procent av BNP (2006) Tax burden, total taxes as per cent of GDP (2007) 43.3Tax on personal income, per cent of GDP (2007) 15.8 10.42 10.8 5.5 Skatt på personlig inkomst, procent av BNP (2006)
Sources: The World Bank. Eurostat. OECD, Revenue Statistics 1965–2008, 2009 Edition. International Monetary Fund. United Nations. IEA, Key World Energy Statistics, 2010. US Sensus bureau. International Monetary Fund, World Economic Outlook Database. UNFCCC. Nordic Statistic. e-Stat Portal Site of Official Statistics of Japan. WHO, Core Health Indicators. Note: Where statistics do not give figures for total Norden, figures are calculated as weight averages, using population as weighing basis. Norden comprises Denmark, Finland, Iceland, Norway, Sweden and the three autonomous areas of the Faroe Islands, Greenland and Åland. Euro-area is the 14 countries that have euro as their common currency. Land area is the ice-free area. Not: I de fall där siffrorna inte anger samlad statistik för Norden har de framräknats som ett viktat genomsnitt med utgångspunkt från folkmängden. Norden inkluderar Danmark, Finland, Island, Norge, Sverige samt de tre självstyrande områdena Färöarna, Grönland och Åland. Euro-area avser de 14 länder som har infört euron som gemensam valuta. Landytan avser den yta som inte är täckt av landis eller vatten. 1) EU–27 (2007) 2) EU–15 3) 2007 4) 2008

8 Facts about the Nordic countries · Fakta om de nordiska länderna
The Nordic countries
Total area (1 000 sq km) 3 429 sq km
Arable land and gardens (% of land area) 18.8
Icecap and glaciers (% of total area) 52
Largest lake Vänern – 5 648 sq km (Sweden)
Highest point Gunbjørns Fjeld – 3 693 m (Greenland)
Population 1 January 2010 25 535 512
Inhabitants per sq km land area 16.3(1 January 2010)
Average age 40.4
Fertility rate (2008) 1.9
Non-Nordic population, per cent 4.6
Intra-nordic foreign trade (% of total foreign trade) Imports 22.7 Exports 18.7
GDP per capita, PPP-euro 30 318
Unemployment rate, per cent 6.8
Renewable energy supply, (% of total energy) 32
Nordic films, number of premières 119
Museums numbers 1 002 visits, mio. 46
Theaters, number 407
Secretary General Halldór Ásgrímsson
Official website www.norden.org

9Facts about the Nordic countries · Fakta om de nordiska länderna
Denmark
Total area 43 561 sq kmLakes and streams 671 sq kmLand area 42 890 sq kmIcecap and glaciers .Arable land and gardens 25 329 sq kmForests 5 294 sq kmLargest lake Arresø – 39.5 sq kmHighest point Yding Skovhøj – 172.5 mCoastline 7 314 kmPopulation 1 January 2010 5 534 738Population per sq km land area1 January 2010 128.4Capital population 678 873 (Copenhagen)National holiday 5 June (Constitution Day 5 June 1849)Form of government Constitutional monarchyParliament Folketinget (179 seats)Membership of EU Yes, from 1 January 1973Membership of NATO Yes, from 4 April 1949Head of state Queen Margrethe IIHead of government Prime Minister Lars Løkke Rasmussen (Liberal Democratic Party)Currency Danish krone (DKK)Official website www.denmark.dk
Foto: ImageSelect

10 Facts about the Nordic countries · Fakta om de nordiska länderna
Total area 1 396 sq kmLakes and streams 9 sq kmLand area 1 387 sq kmIcecap and glaciers .Arable land and gardens ..Forests ..Largest lake Leitisvatn 3.6 sq kmHighest point Slættaratindur 882 mCoastline 1 289 kmPopulation 1 January 2010 48 650Population per square kmtotal area, 1 January 2010 34.9Capital population 19 873 (Tórshavn, municipallity)National holiday 29 July (Olaifest)Form of government Home rule – within the kingdom of DenmarkParliament Lagtinget (33 seats)Membership of EU NoMembership of NATO Yes, since 1949 (due to the Danish membership)Head of state Queen Margrethe IIHead of government Prime Minister Kaj Leo Johannesen (Unionist Party)Currency Danish krone (DKK)Official website www.hagstova.fo
Faroe Islands
Foto: ImageSelect

11Facts about the Nordic countries · Fakta om de nordiska länderna
Total area 2 166 086 sq kmLakes and streams ..Land area 410 449 sq kmIcecap and glaciers 1 755 637 sq kmArable land and gardens ..Largest lake ..Highest point Gunnbjørns Fjeld 3 693 mCoastline 44 087 kmPopulation 1 January 2010 56 452Population per square kmice-free land area, 1 January 2010 0.14Capital population 15 469 (Nuuk municipality)National holiday 21 June (longest day)Form of government Self Government – within the kingdom of DenmarkParliament Inatsisartut or Landstinget (31 seats)Membership of EU From 1 January 1973 to 1 February 1985Membership of NATO Yes, since 1949 (due to the Danish membership)Head of state Queen Margrethe IIHead of government Kuupik Kleist (Inuit Ataqatigiit, Independence Party)Currency Danish krone (DKK)Official website www.gh.gl
Greenland
Foto: ImageSelect

12 Facts about the Nordic countries · Fakta om de nordiska länderna
Total area 338 441 sq kmLakes and streams 34 534 sq kmLand area 303 907 sq kmIcecap and glaciers ..Arable land and gardens 22 899 sq kmForests 228 190 sq kmLargest lake Saimaa 1 377 sq kmHighest point Halti, Halditjåkko (Haldefjäll) 1 324 mCoastline, mainland 1 250 kmPopulation 1 January 2010 5 351 427Population per square km land area1 January 2010 17.6Capital population 583 350 (Helsinki/Helsingfors)National holiday 6 December (Independence Day)Form of government RepublicParliament Riksdag (200 seats)Membership of EU Yes, from 1 January 1995Membership of NATO NoHead of state President Tarja HalonenHead of government Prime Minister Matti Vanhanen (Center Party)Currency Euro Official website www.finland.fi
* Finland includes Åland.
Finland
Foto: ImageSelect
13Facts about the Nordic countries · Fakta om de nordiska länderna
Total area (6 757 islands) 1 582 sq kmLakes and streams 27.4 sq kmLand area 1 553 sq kmIcecap and glaciers .Arable land and gardens 140 sq kmForests 937 sq kmLargest lake Östra och Västra Kyrksundet 2.6 sq kmHighest point Orrdalsklint 129 mCoastline, mainland ..Population 1 January 2010 27 734Population per square km land area1 January 2010 17.9Capital population 11 123 (Mariehamn municipality)National holiday 9 June (Autonomy Day 9 June 1922) Form of government Home rule – within the Republic of FinlandParliament Lagtinget (30 seats)Membership of EU Yes, since 1995 (due to the Finnish membership)Membership of NATO NoHead of state President Tarja HalonenHead of government Lantrådet Viveka Eriksson (Åland Liberals)Currency EuroOfficial website www.aland.ax
Åland
Foto: Visit Åland
14 Facts about the Nordic countries · Fakta om de nordiska länderna
Iceland
Total area 103 300 sq kmLakes and streams 2 606 sq kmLand area 89 825 sq kmIcecap and glaciers 10 869 sq kmArable land and gardens 1 290 sq kmForests 1 524 sq kmLargest lake Þingvallavatn 82 sq kmHighest point Hvannadalshnúkur 2 110 mCoastline, mainland 4 970 kmPopulation 1 January 2010 317 630Population per square km ice-freeland area, 1 January 2010 3.5Capital population 118 326 (Reykjavik)National holiday 17 June (Independence Day 17 June 1944)Form of Government RepublicParliament Alþingi or Althingi (63 seats)Membership of EU No, but member of EEA from 1 Jan. 1994Membership of NATO Yes, from 4 April 1949Head of state Ólafur Ragnar GrímssonHead of government Prime Minister Jóhanna Sigudardóttir (The Socail Democratic Alliance) Currency Icelandic krona (ISK)Official website www.iceland.is
Foto: ImageSelect
Foto: Visit Åland

15Facts about the Nordic countries · Fakta om de nordiska länderna
Norway
Total area1 323 782 sq kmLakes and streams 18 312 sq kmLand area incl. Icecap and glaciers 305 470 sq kmIcecap and glaciers 3 133 sq kmArable land and gardens 8 399 sq kmForests 120 000 sq kmLargest lake Mjøsa 362 sq kmHighest point Galdhøpiggen 2 469 mCoastline, mainland 25 148 kmPopulation 1 January 2010 4 858 199 Population per square km land area1
1 January 2010 15.9Capital population 586 860 (Oslo)National holiday 17 May (Constitution Day 17 May 1814)Form of government Constitutional monarchyParliament Stortinget (169 seats)Membership of EU No, but member of EEA from 1 Jan. 1994Membership of NATO Yes, from 4 April 1949Head of state King Harald VHead of government Prime minister Jens Stoltenberg (Social Democratic Party)Currency Norwegian krone (NOK)Official website www.norway.no
1) Excluding Svalbard and Jan Mayen
Foto: ImageSelect
Foto: Visit Åland
16 Facts about the Nordic countries · Fakta om de nordiska länderna
Sweden
Total area1 450 295 sq kmLakes and streams 39 960 sq kmLand area 410 052 sq kmIcecap and glaciers 283 sq kmArable land and gardens 26 305 sq kmForests 227 250 sq kmLargest lake Vänern 5 648 sq kmHighest point Kebnekaise 2 106 mCoastline, mainland 11 530 kmPopulation 1 January 2010 9 340 682Population per square km land area1 January 2010 22.8Capital area population 829 417 (Stockholm)National holiday 6 June (Swedish flag)Form of government Constitutional monarchyParliament Riksdagen (349 seats)Membership of EU Yes, from 1 January 1995Membership of NATO NoHead of state King Carl XVI GustafHead of government Prime minister Fredrik Reinfeldt (Moderate Party)Currency Swedish krona (SEK)Official website www.sweden.se
1) Incl. the greater lakes but excl. the area from the coastline to the territorial border, 81 502 sq km.
Foto: ImageSelect

17 · Facts about the Nordic countries · Fakta om de nordiska länderna
Lapland
The SamiThe Sami are an indigenous people who have their traditional settlement areas in nothern Norway, Sweden, Finland and Russia. Most Sami live in Norway. Then follow Sweden and Finland, while the fewest Sami live in Russia. Because you do not make an official record of who has the Sami identity / background, no one knows how many the Sami are. The Sami language is spoken in several variants. The Sami people are among the largest indigenous ethnic groups in Europe.
Traditionally, the Sami have plied a variety of livelihoods, including coastal fishing, fur trapping, and sheep herding. However, the best known Sami livelihood is semi-nomadic reindeer herding. For traditional, environmental, cultural, and political reasons, reindeer herding is legally reserved only for Sami people in certain regions of the Nordic countries. Nowadays, the Sami work in all sectors, in line with the non-Sami population, though, the primary industries are still important culture bearers for the Sami people.
SamernaSamerna är ett ursprungsfolk som har sina traditionella bosättningsområden i norra Norge, Sverige, Finland och Ryssland. Flest samer bor det i Norge, därefter följer Sverige och Finland, medan det lägsta antalet samer bor i Ryssland. Eftersom det inte officiellt registreras vem som har samisk bakgrund är det oklart hur många samerna är. Det finns olika varianter av det samiska språket. Det samiska folket är bland de största inhemska etniska grupperna i Europa.
Traditionellt har samerna olika försörjningsformer, bland annat kustfiske, pälsfångst och fårvallning, men det mest kända samiska levebrödet är den halvnomadiska rennäringen. Av traditionella, miljömässiga, kulturella och politiska skäl är rennäringen i lag reserverad endast för samerna i vissa regioner av de nordiska länderna. I dag är samerna verksamma i alla näringarna, liksom med den icke-samiska befolkningen, även om de primära näringarna fortfarande är vigtiga kulturbärare för samerna.
Total Population 1 January 2010 50 000 – 80 000
Geographic area Norway, Sweden, Finland and Russia
More detailed information www.sami-statistics.info
Foto: Ojo Images
18 ·
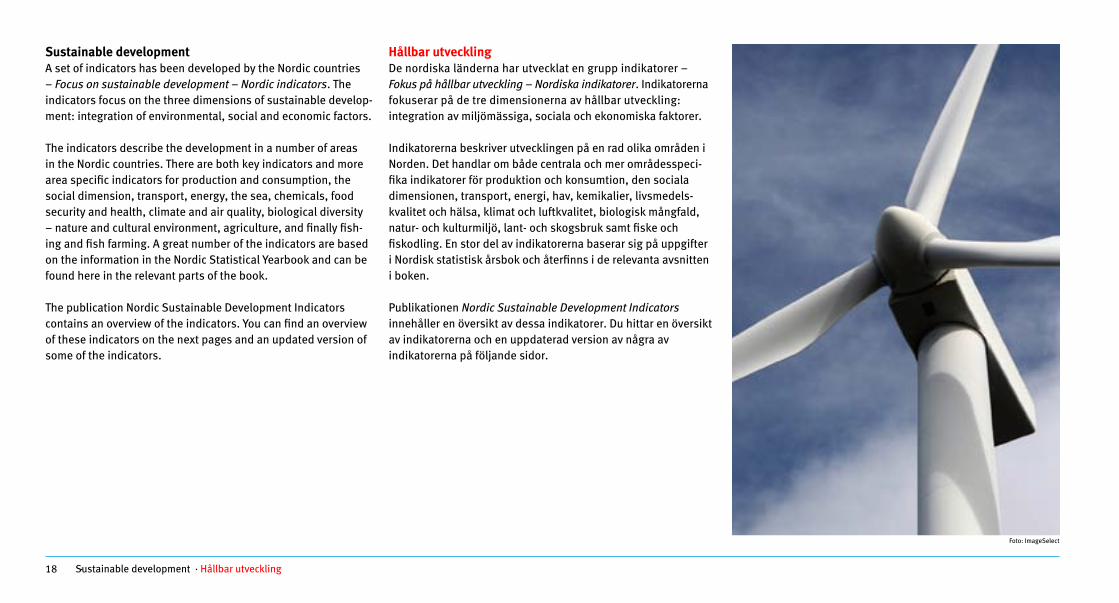
Sustainable developmentA set of indicators has been developed by the Nordic countries – Focus on sustain able development – Nordic indicators. The indicators focus on the three dimensions of sustainable develop-ment: integration of environmental, social and economic factors.
The indicators describe the development in a number of areas in the Nordic countries. There are both key indicators and more area specific indicators for production and con sumption, the social dimension, transport, energy, the sea, chemicals, food security and health, climate and air quality, biological diversity – nature and cultural environment, agr iculture, and finally fish-ing and fish farming. A great number of the indicators are based on the information in the Nordic Statistical Yearbook and can be found here in the relevant parts of the book.
The publication Nordic Sustainable Development Indicators contains an overview of the indicators. You can find an overview of these indicators on the next pages and an updated version of some of the indicators.
Hållbar utvecklingDe nordiska länderna har utvecklat en grupp indikatorer – Fokus på hållbar utveckling – Nordiska indikatorer. Indikatorerna fokuserar på de tre dimensionerna av hållbar utveckling: integration av miljömässiga, sociala och ekonomiska faktorer.
Indikatorerna beskriver utvecklingen på en rad olika områden i Norden. Det handlar om både centrala och mer områdesspeci-fika indikatorer för produktion och konsumtion, den sociala dimensionen, transport, energi, hav, kemikalier, livsmedels-kvalitet och hälsa, klimat och luftkvalitet, biologisk mångfald, natur- och kulturmiljö, lant- och skogsbruk samt fiske och fiskodling. En stor del av indikatorerna baserar sig på uppgifter i Nordisk statistisk årsbok och återfinns i de relevanta avsnitten i boken.
Publikationen Nordic Sustainable Development Indicators innehåller en översikt av dessa indikatorer. Du hittar en översikt av indikatorerna och en uppdaterad version av några av indikatorerna på följande sidor.
Sustainable development · Hållbar utveckling
Foto: ImageSelect
19 · Sustainable development · Hållbar utveckling
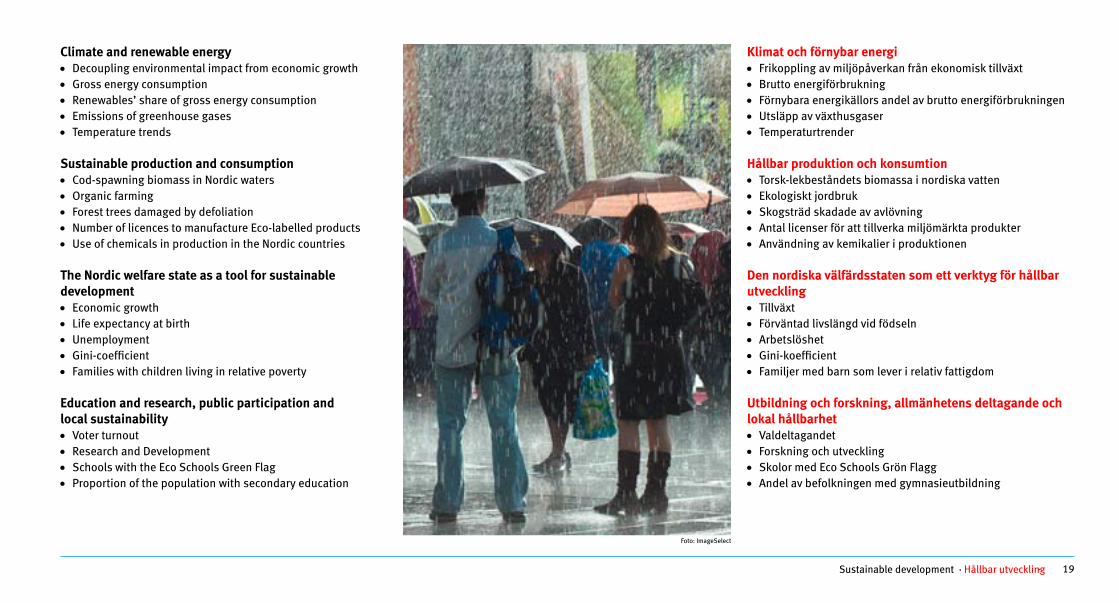
Climate and renewable energy• Decoupling environmental impact from economic growth • Gross energy consumption• Renewables’ share of gross energy consumption• Emissions of greenhouse gases• Temperature trends
Sustainable production and consumption• Cod-spawning biomass in Nordic waters• Organic farming • Forest trees damaged by defoliation • Number of licences to manufacture Eco-labelled products• Use of chemicals in production in the Nordic countries
The Nordic welfare state as a tool for sustainabledevelopment • Economic growth• Life expectancy at birth• Unemployment• Gini-coefficient • Families with children living in relative poverty
Education and research, public participation andlocal sustainability • Voter turnout• Research and Development• Schools with the Eco Schools Green Flag • Proportion of the population with secondary education
Klimat och förnybar energi • Frikoppling av miljöpåverkan från ekonomisk tillväxt• Brutto energiförbrukning• Förnybara energikällors andel av brutto energiförbrukningen• Utsläpp av växthusgaser • Temperaturtrender
Hållbar produktion och konsumtion • Torsk-lekbeståndets biomassa i nordiska vatten • Ekologiskt jordbruk • Skogsträd skadade av avlövning • Antal licenser för att tillverka miljömärkta produkter • Användning av kemikalier i produktionen
Den nordiska välfärdsstaten som ett verktyg för hållbar utveckling • Tillväxt • Förväntad livslängd vid födseln • Arbetslöshet • Gini-koefficient • Familjer med barn som lever i relativ fattigdom
Utbildning och forskning, allmänhetens deltagande och lokal hållbarhet • Valdeltagandet • Forskning och utveckling • Skolor med Eco Schools Grön Flagg • Andel av befolkningen med gymnasieutbildning
Foto: ImageSelect
20 · Sustainable development · 19 Hållbar utveckling
Sustainable development indicators Hållbar utveckling, indikatorer
Den-mark
Faroe lands Is
Greenl nda Finland Åland Ic and el Norway Sweden
Renewables’ share of energy consumption 1 909 7 20 65 50 25 2000 2009 17 .. .. 23 .. 751 45 31 Förnybara energikällor andel av energiförbrukningen
Life expectancy at birth, men 1990 72 (72) (61) ( 71) (75) (75) (73) (75) Medellivslängd, män 2000 2009 76 77 662 76 781 80 78 79
Life expectancy at birth, women 1990 78 (79) (68) (79) (82) 1 (80) (80) (80) Medellivslängd, kvinnor 2000 2009 81 82 712 83 84 83 83 83
Unemployment 1990 (7.2 (11.5)3 .. (3.2) .. (1.8) (5.2) (1.7) Arbetslöshet, procent 2000 2009 3.3 0.3 6.4 3.0 2.5 6.2
R&D expenditure in percent of GDP 1991 1990 1.6 .. .. (2.0) .. (1.2) (1.6) (2.7) FoU-utgifter i procent av BNP
2000
2009 2.6 3.5 2.8 1.7 3.6
1990=100
GDP 2009 2000 143 .. .. 152 .. 175 173 147 GDP 2008
2009
Gross energy consumption 2007 2000 116 .. .. 122 .. 117 110 115 Bruttoenergiförbrukningen 2007
2009
Emission of greenhouse gases 2007 2000 97 .. .. 111 .. 132 111 91 Utsläpp av växthusgaser
2009 ) ) ) )
Sustainable development indicators Hållbar utveckling, indikatorer
Den rk Faroe Islands Greenland Finland Åland Iceland Norway Swedenma
Renewables’ share of energy consumption Förnybara energikällor, andel av energiförbrukningen 1990 7 .. .. 20 .. 65 50 25 1990 2000 11 .. .. 25 .. 71 48 32 2000 2009 18 .. .. 26 .. 752 44 32 2009
Life expectancy at birth, men Medellivslängd, män 1990 72 72 61 71 75 75 73 75 1990 2000 74 75 63 74 79 78 76 77 2000 2009 77 77 673 77 793 80 79 79 2009
Life expectancy at birth, women Medellivslängd, kvinnor
1990 78 79 68 79 83 80 80 80 1990 2000 79 81 68 81 82 81 81 82 2000 2009 81 82 723 83 833 83 83 83 2009
Unemployment Arbetslöshet, procent
1990 7.2 11.51 .. 3.2 .. 1.8 5.2 1.7 1990 2000 4.3 3.0 7.7 9.8 2.0 1.3 3.2 5.6 2000 2009 6.0 5.1 .. 8.2 3.0 8.0 3.1 8.3 2009
R&D expenditure in per cent of GDP FoU-utgifter i procent av BNP
1991 1.6 .. .. 2.0 .. 1.2 1.6 2.7 1990 2001 2.4 .. .. 3.3 .. 3.0 1.6 4.2 2000 2008 2.7 .. .. 3.7 .. 2.6 1.6 3.8 2009
GDP index 1990=100 BNP index 1990=100 1990 100 .. .. 100 .. 100 100 100 1990 2000 129 .. .. 122 129 144 123 2000 2009 136 .. .. 142 .. 166 169 143 2009
Gross energy consumption index 1990=100 Bruttoenergiförbrukningen index 1990=100 1990 100 .. .. 100 .. 100 100 100 1990 2000 113 .. .. 111 150 121 100 2000 2009 114 .. .. 125 .. 2012 135 106 2009
Emission of greenhouse gases index 1990=100 Utsläpp av växthusgaser index 1990=100 1990 100 .. .. 100 .. 100 100 100 1990 2000 99 .. .. 98 110 107 95 2000 2009 93 .. .. 100 .. 143 108 88 2009 1) 1995 2) 2006 3) 2008
Sustainable development · Hållbar utveckling

21Environment and energy · Miljö och energi
Environment and energyMiljö och energi
We have plenty of untouched nature, clean water and fresh air in the Nordic countries, but we must keep a close eye on the environment so that future generations will also be able to enjoy this. In the Nordic countries, there is a long tradition of cooperating on natural and environmental issues.
In this chapter you can find information on areas such as
• land use • energy supply and use • global warming • emissions • organic farming
More detailed information on the subject and longer time series are available in the Nordic database, more specifically under environment and energy.
Vi har gott om orörd natur, rent vatten och frisk luft i Norden, men vi måste hålla ett vaksamt öga på miljön om kommande generationer också ska kunna ha glädje av detta. I de nordiska länderna finns det en lång tradition av att samarbeta om natur- och miljöfrågor.
I detta kapitel finner du information om områden som
• markanvändning • energiförsörjning och energianvändning• global uppvärmning• utsläpp • ekologiskt jordbruk Mer detaljerad information om ämnet och längre tidsserier finns tillgängliga i den nordiska databasen, mer specifikt inom miljö och energi.
Foto: ImageSelect

22 Environment and energy · Miljö och energi
Total area in the Nordic countriesThe Nordic countries comprise a total area of 3.5 million sq km. Even without Greenland and the Norwegian islands of Svalbard and Jan Mayen, the remaining part of the Nordic countries covers a vast area of 1.2 million sq km. This area is the size of Germany, France and Italy together. The Nordic region stretches over five time zones. To the east, the region borders on Russia, and in fair weather one can just make out the Canadian coastline to the west. To the south, its neighbours are Germany and Poland, and to the north: the Arctic Ocean.
However, with a population of only 25 million, the region has one of the lowest population densities in the world. The low den-sity is partly due to the fact that large parts of the Nordic coun-tries are marginal areas, where nature puts limitations on settle-ment. Denmark (excluding the Faroe Islands and Greenland) has the highest population density in the Nordic countries with 128 people per sq km and, thus, differs significantly from the other Nordic countries in this respect. In both Norway and Denmark 30–40 per cent of the population is to be found in the vicinity of the respective capitals. In Iceland it is more than 60 per cent.
Total areal i NordenDe nordiska länderna täcker en total areal av 3,5 miljoner km2. Även utan Grönland, Svalbard och Jan Mayen utgör den resteran-de delen av Norden ett enormt område, nämligen 1,2 miljoner kvadratkilometer. Det är en yta av samma storlek som Tyskland, Frankrike och Italien tillsammans. Norden sträcker sig över fem tidszoner. I öster gränsar Norden mot Ryssland, och i väster kan man skymta Kanadas kust i klart väder. I söder är Norden granne till Tyskland och Polen och i norr gränsar Norden till Ishavet.
Med en befolkning på endast 25 miljoner är emellertid regio nen en av de minst tätbefolkade i världen. Detta beror huvud sakligen på att naturen sätter gränser för bosättning i de nordiska länder-na. Danmark (exklusive Färöarna och Grönland) har den högsta befolkningstätheten i de nordiska länderna med 128 personer per km2 och skiljer sig alltså väsentligt från de övriga nordiska länderna i detta avseende. I både Norge och Danmark finns 30–40 procent av befolkningen i närheten av huvudstaden. När det gäller Island är det mer än 60 procent.
Environment and energy · 20 Miljö och energi
Opdateret: Kontrolleret: Total area in the Nordic countries. 2010 Figur 1.1 Total areal i Norden
1%
0%
3%
9%
13% 0%
10%63%
Denmark - 1%
Faroe Islands - 0%
Greenland - 63%
Finland - 10%
Åland - 0%
Iceland - 3%
Norway - 9%
Sweden - 13%
Area02 Source: National statistical institutes and National Land Survey of Finland.
23Environment and energy · Miljö och energi
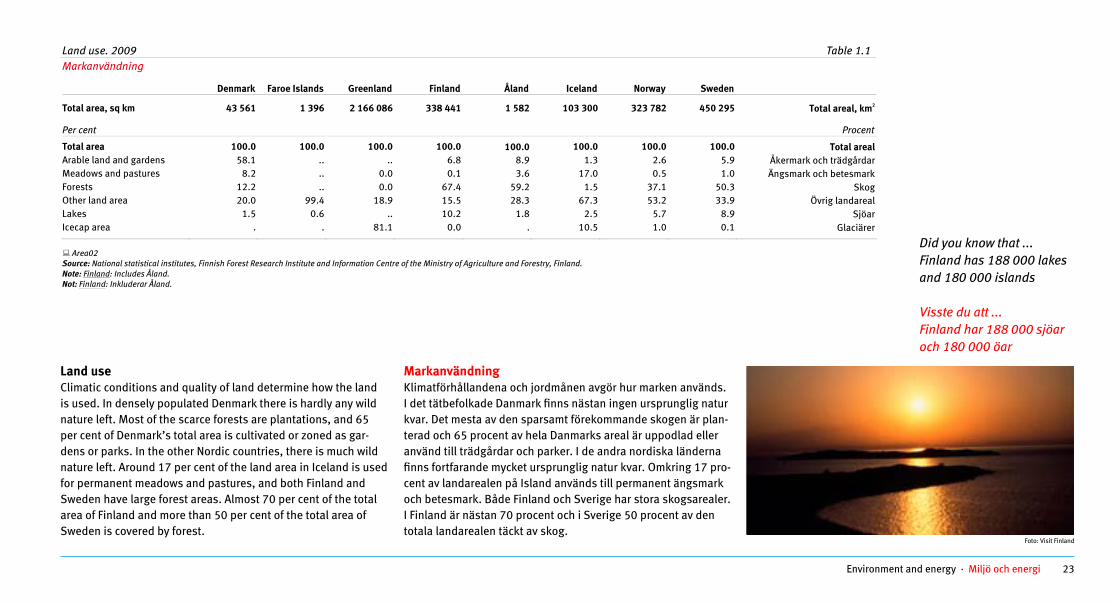
Land useClimatic conditions and quality of land determine how the land is used. In densely populated Denmark there is hardly any wild nature left. Most of the scarce forests are plantations, and 65 per cent of Denmark’s total area is cultivated or zoned as gar-dens or parks. In the other Nordic countries, there is much wild nature left. Around 17 per cent of the land area in Iceland is used for permanent meadows and pastures, and both Finland and Sweden have large forest areas. Almost 70 per cent of the total area of Finland and more than 50 per cent of the total area of Sweden is covered by forest.
MarkanvändningKlimatförhållandena och jordmånen avgör hur marken an vänds. I det tätbefolkade Danmark finns nästan ingen ursprung lig natur kvar. Det mesta av den sparsamt förekom mande skogen är plan-terad och 65 procent av hela Danmarks areal är uppodlad eller använd till trädgårdar och parker. I de andra nordiska länderna finns fortfarande mycket ursprung lig natur kvar. Omkring 17 pro-cent av landarealen på Island används till permanent ängsmark och betesmark. Både Finland och Sverige har stora skogsarealer. I Finland är nästan 70 procent och i Sverige 50 procent av den totala landarealen täckt av skog.
20 Environment and energy · Miljö och energi
Opdateret: 25/9-2010! Kontrolleret:
Land use. 2009 Table 1.1 Markanvändning
Denmark Faroe Islands Greenland Finland Åland Iceland Norway Sweden
Total area, sq km 43 561 1 396 2 166 086 338 441 1 582 103 300 323 782 450 295 Total areal, km2
Per cent Procent
Total area 100.0 100.0 100.0 100.0 100.0 100.0 100.0100.0 Total arealArable land and gardens 58.1 .. .. 6.8 8.9 1.3 2.6 5.9 Åkermark och trädgårdarMeadows and pastures 8.2 .. 0.0 0.1 3.6 17.0 0.5 1.0 Ängsmark och betesmarkForests 12.2 .. 0.0 67.4 59.2 1.5 37.1 50.3 SkogOther land area 20.0 99.4 18.9 15.5 28.3 67.3 53.2 33.9 Övrig landarealLakes 1.5 0.6 .. 10.2 1.8 2.5 5.7 8.9 Sjöar Icecap area . . 81.1 0.0 . 10.5 1.0 0.1 Glaciärer
Area02 Source: National statistical institutes, Finnish Forest Research Institute and Information Centre of the Ministry of Agriculture and Forestry, Finland. Note: Finland: Includes Åland. Not: Finland: Inkluderar Åland.
Did you know that ...Finland has 188 000 lakes and 180 000 islands
Visste du att ... Finland har 188 000 sjöar och 180 000 öar
Foto: Visit Finland
24 Environment and energy · Miljö och energi
Environment and energy · 21 Miljö och energi
Opdateret: 25/9-2010! Kontrolleret:
Area and population. 2009 Table 1.2 Areal och folkmängd
Denmark Faroe Islands Greenland Finland Åland Iceland Norway Sweden
Total areal, km2 43 561 1 396 2 166 086 338 441 1 582 103 300 323 782 450 295Total area, sq km Vatten och glaciärer, km2 Water and icecap area, sq km 671 9 1 755 637 34 542 29 13 700 21 445 39 960
Landareal, km2 Land area, sq km 42 890 1 387 410 449 303 899 1 553 89 600 305 407 410 335
1 January 2010 1 januari 2010
Population 5 534 738 48 650 56 452 5 351 427 27 734 317 630 4 858 199 9 340 682 Folkmängd
Invånare per km2 landareal Inhabitants per sq km land area 128.4 34.8 0.1 17.6 17.9 3.1 15.9 22.8
Area02,urce:
Note
Dens01 and Popu01 So National statistical institutes and National Land Survey of Finland.
: Finland: Includes Åland. Not: Finland: Inkluderar Åland.
Foto: ImageSelect
Environment and energy · 20 Miljö och energi
Opdateret: Kontrolleret:
Population density. 2010 Figure 1.2 Befolkningstäthet
60
80
100
120
140Inhabitants per sq km
0
20
40
DK FO GL FI AX IS NO SE EU-15
Dens01 Source: National statistical institutes, National Land Survey of Finland and Eurostat. Note: EU–15: 2006 data. Not: EU–15: 2006 års uppgifter.
25Environment and energy · Miljö och energi
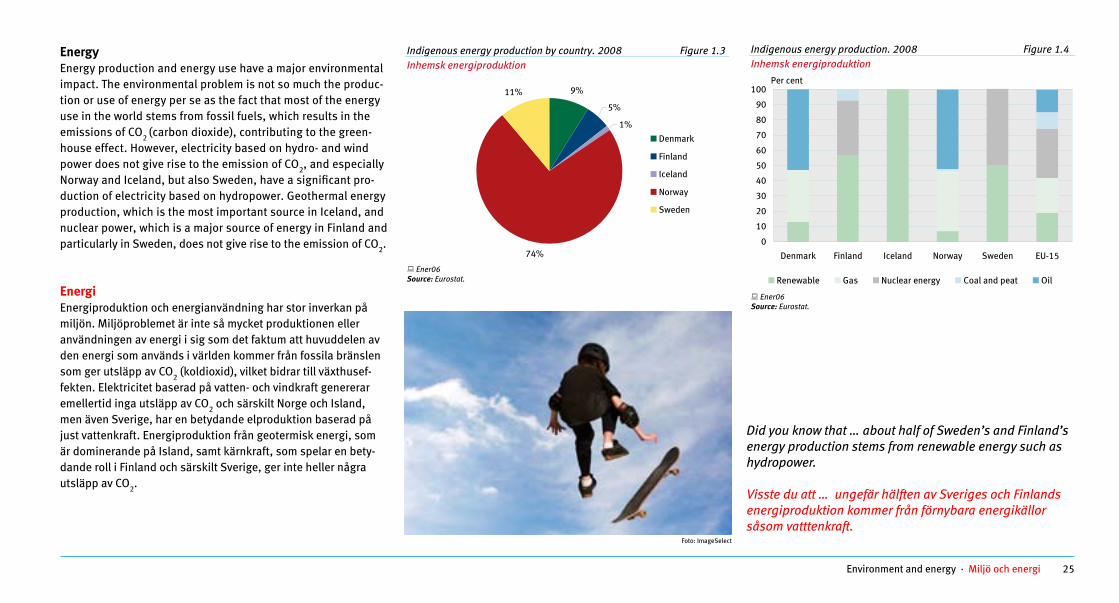
EnergyEnergy production and energy use have a major environ mental impact. The environmental problem is not so much the produc-tion or use of energy per se as the fact that most of the energy use in the world stems from fossil fuels, which results in the emissions of CO2 (carbon dioxide), contributing to the green-house effect. However, electricity based on hydro- and wind power does not give rise to the emission of CO2, and especially Norway and Iceland, but also Sweden, have a significant pro-duction of electricity based on hydropower. Geothermal energy production, which is the most important source in Iceland, and nuclear power, which is a major source of energy in Finland and particularly in Sweden, does not give rise to the emission of CO2.
Energi Energiproduktion och energianvändning har stor inverkan på miljön. Miljöproblemet är inte så mycket produktionen eller användningen av energi i sig som det faktum att huvuddelen av den energi som används i världen kommer från fossila bränslen som ger utsläpp av CO2 (koldioxid), vilket bidrar till växthusef-fekten. Elektricitet baserad på vatten- och vindkraft genererar emellertid inga utsläpp av CO2 och särskilt Norge och Island, men även Sverige, har en betyd ande elproduktion baserad på just vattenkraft. Energiproduktion från geotermisk energi, som är domine rande på Island, samt kärnkraft, som spelar en bety-dande roll i Finland och särskilt Sverige, ger inte heller några utsläpp av CO2.
Environment and energy · 21 Miljö och energi
Indigenous energy production. 2008 Figure 1.4 Inhemsk energiproduktion
30
40
50
60
70
80
90
100
0
10
20
Denmark Finland Iceland Norway Sweden EU-15
Renewable Gas Nuclear energy Coal and peat Oil
Per cent
Ener06
Source: Eurostat.
Did you know that … about half of Sweden’s and Finland’s energy production stems from renewable energy such as hydropower.
Visste du att … ungefär hälften av Sveriges och Finlands energiproduktion kommer från förnybara energikällor såsom vatttenkraft.
Foto: ImageSelect
Environment and energy · 20 Miljö och energi
Indigenous energy production by country. 2008 Figure 1.3 Inhemsk energiproduktion
9%
5%
11%
1%
74%
Denmark
Finland
Iceland
Norway
Sweden
Ener06
Source: Eurostat.

26 Environment and energy · Miljö och energi
20 Environment and energy · Miljö och energi
Opdateret: 25/9-2010! Kontrolleret:
Final consumption of energy. 2008 Table 1.3Slutlig energiförbrukning
Denmark Finland Iceland Norway Sweden
Ekvivalenta oljeton per personTonnes oil equivalents per person
Total 2.8 4.9 7.4 4.0 3.6 TotaltIndustry 0.5 2.3 2.6 1.4 1.3 IndustriTransport 1.0 0.9 1.2 1.1 1.0 TransporterHouseholds, trades, services, etc. 1.3 1.6 3.6 1.5 1.2 Hushåll, handel, service m.m.
Ener10 and Popu02 Source: Eurostat.
IcelandNote: : 2006 data. N Islandot: : 2006 års uppgifter.
Energy sources The most important energy sources in the Nordic countries meas-ured in terms of energy supply in million toe (tonnes oil equivalent) are in order of importance: oil, solid fuels (e.g. coal and wood), nuclear power, hydro-, geothermal and solar energy, and gas. Hydro- and geothermal power are major sources of energy in the Nordic countries, as compared, for example, to other OECD coun-tries. Particularly in Iceland and Norway, hydro- and geothermal power constitute a major share of the overall energy supply. Den-mark depends almost entirely on thermal power generated from coal, oil and gas. Iceland obtains a substantial part of its energy for heating from geothermal energy and depends almost entirely upon hydropower resources for its production of electricity.
The indigenous production of energy in the Nordic countries has risen considerably over the last couple of decades – especially in Denmark and Norway. Nuclear power is not produced in Denmark, Iceland and Norway. However, it is Sweden’s most important source of energy and constitutes 34 per cent of its energy supply. In Finland, it provides 17 per cent of the energy supply. With their oil fields in the North Sea, Denmark and especially Norway have a very large production of oil and gas.
EnergikällorDe viktigaste energikällorna i de nordiska länderna räknat i ener-gitillskott i miljoner toe (tonnes oil equivalent, ekvivalenta oljeton) är i storleksordning: olja, fasta bränslen (exempelvis kol och ved), kärnkraft, vattenkraft, jordvärmeenergi, solkraft och gas. Vattenkraft och jordvärmeenergi är mer betydande kraftkällor i de nordiska länderna än i exempelvis andra OECD-länder. Särskilt på Island och i Norge utgör vattenkraft och jordvärmeenergi den största andelen av den totala energi försörjningen. Danmark är nästan uteslutande beroende av termisk kraft genererad från kol, olja och gas. Island utvinner en väsentlig del av sin energi för uppvärmning från geoter-misk energi och är nästan helt beroende av vattenkraftkällor för sin produktion av elektricitet.
Den inhemska produktionen av energi i de nordiska länderna har ökat väsentligt under de senaste årtiondena – särskilt i Danmark och Norge. Kärnkraft produceras inte i Danmark, Norge eller på Island. Det är emellertid Sveriges viktigaste energikälla och utgör omkring 34 procent av dess energitill gång. I Finland utgör kärnkraften 17 procent av energitillgången. Med sina oljefält i Nordsjön har Danmark och i synnerhet Norge en mycket stor produktion av olja och gas.
Environment and energy · 20 Miljö och energi
Opdateret: Kontrolleret:
Energy supply by source. 2008 Figure 1.5Energitillgång per bränsleslag
0
10
20
30
40
50
60
70
80
90
100
Denmark Finland Iceland Norway Sweden EU-15
Renewable energy Gas Nuclear power Coal and peat Oil
Per cent
Ener05 Source: Eurostat. Note: Iceland: 2006 data. Not: Island: 2006 års uppgifter.
27Environment and energy · Miljö och energi
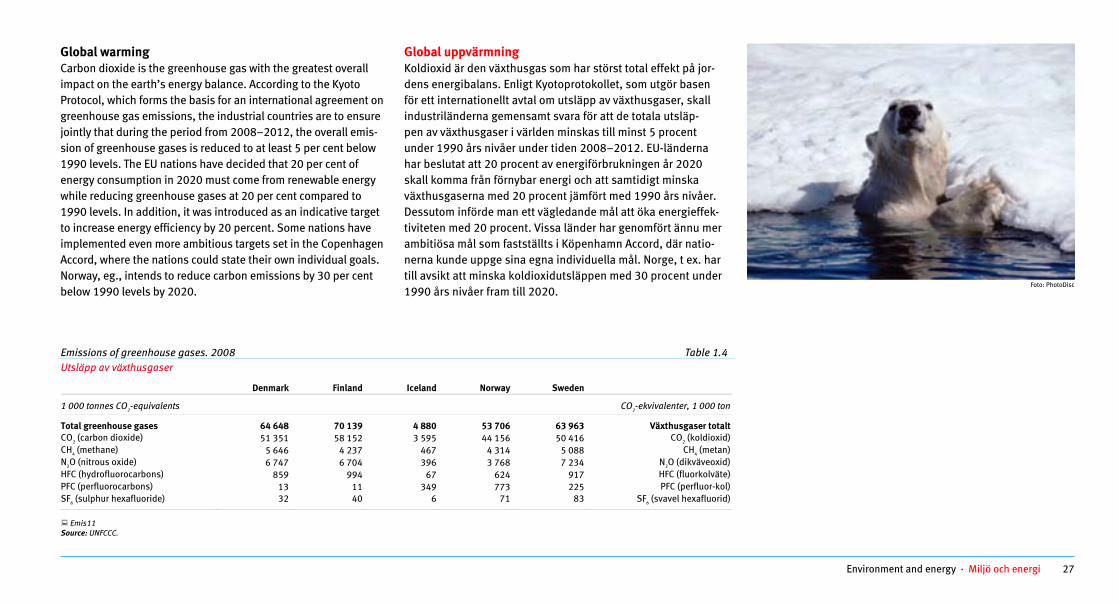
Global warmingCarbon dioxide is the greenhouse gas with the greatest overall impact on the earth’s energy balance. According to the Kyoto Protocol, which forms the basis for an inter national agreement on greenhouse gas emissions, the industrial countries are to ensure jointly that during the period from 2008–2012, the overall emis-sion of greenhouse gases is reduced to at least 5 per cent below 1990 levels. The EU nations have decided that 20 per cent of energy consumption in 2020 must come from renewable energy while reducing greenhouse gases at 20 per cent compared to 1990 levels. In addition, it was introduced as an indicative target to increase energy efficiency by 20 percent. Some nations have implemented even more ambitious targets set in the Copenhagen Accord, where the nations could state their own individual goals. Norway, eg., intends to reduce carbon emissions by 30 per cent below 1990 levels by 2020.
Global uppvärmningKoldioxid är den växthusgas som har störst total effekt på jor-dens energibalans. Enligt Kyotoprotokollet, som utgör basen för ett internationellt avtal om utsläpp av växthusgaser, skall industriländerna gemensamt svara för att de totala utsläp-pen av växthusgaser i världen minskas till minst 5 procent under 1990 års nivåer under tiden 2008–2012. EU-länderna har beslutat att 20 procent av energi förbrukningen år 2020 skall komma från förnybar energi och att samtidigt minska växthusgaserna med 20 procent jämfört med 1990 års nivåer. Dessutom införde man ett vägledande mål att öka energieffek-tiviteten med 20 procent. Vissa länder har genomfört ännu mer ambitiösa mål som fastställts i Köpenhamn Accord, där natio-nerna kunde uppge sina egna individuella mål. Norge, t ex. har till avsikt att minska koldioxidutsläppen med 30 procent under 1990 års nivåer fram till 2020.
Foto: PhotoDisc
Opdateret: 25/9-2010! Kontrolleret:
Environment and energy · Miljö och energi 21
Emissions of greenhouse gases. 2008 Table 1.4Utsläpp av växthusgaser
Denmark Finland Iceland Norway Sweden
1 000 tonnes CO2-equivalents CO2-ekvivalenter, 1 000 ton
Total greenhouse gases 64 648 70 139 4 880 53 706 63 963 Växthusgaser totaltCO2 (carbon dioxide) CO2 (koldioxid)51 351 58 152 3 595 44 156 50 416CH4 (methane) CH4 (metan)5 646 4 237 467 4 314 5 088N2O (nitrous oxide) N2O (dikväveoxid)6 747 6 704 396 3 768 7 234HFC (hydrofluorocarbons) HFC (fluorkolväte)859 994 67 624 917PFC (perfluorocarbons) PFC (perfluor-kol)13 11 349 773 225SF6 (sulphur hexafluoride) 32 40 6 71 83 SF6 (svavel hexafluorid)
Emis11 urce:So UNFCCC.

28 Environment and energy · Miljö och energi
Emissions of greenhouse gasesIn Iceland and Norway the emissions of greenhouse gases in 2008 were above 1990 level. Finland was at the 1990 level in 2008. The emissions were below 1990 level in both Sweden and Denmark. Denmark was 7 per cent below 1990 level in 2008, while Sweden did even better and reduced emissions by almost 12 per cent since 1990.
Utsläpp av växthusgaserPå Island och i Norge låg utsläppen av växthusgaser år 2008 över nivån för 1990. Finland var på 1990 års nivå i 2008. Ut-släppen låg under nivån för 1990 i både Sverige och Danmark. Danmark var 7 procent under 1990 års nivån, medan Sverige hade lyckats ännu bättre och minskat utsläppen med 12 procent sedan 1990.
20 Environment and energy · Miljö och energi
Opdateret: 25/9-2010! Kontrolleret:
Greenhouse gas emissions per capita Table 1.5Utsläpp av växthusgaser per person
Denmark Finland Iceland Norway Sweden
CO2-equivalents, tonnes CO2-ekvivalenter, ton
1990 13.4 14.2 13.4 11.7 8.4 19902000 12.7 13.4 13.4 11.9 7.7 20002008 11.8 13.2 15.3 11.3 6.9 2008
Emis11 and Popu02 Source: UNFCCC.
Opdateret: 25/9-2010! Kontrolleret: Emissions of greenhouse gases (CO2-equivalents) Figure 1.6
Utsläpp av växthusgaser (CO2-ekvivalenter)
859095
100
1990 1991 1992 1993 1994 1995 1996 1997 1998 1999 2000 2001 2002 2003 2004 2005 2006 2007 2008
Iceland
Norway
Sweden
Finland
EU
105110115120125130135140145
Index 1990=100
Denmark
Emis11
Source: UNFCCC.
Emissions of greenhouse gases (CO2
equivalents) Figure 1.6
Utsläpp av växthusgaser (CO2-
Environment and energy · 20 Miljö och energi
29Environment and energy · Miljö och energi
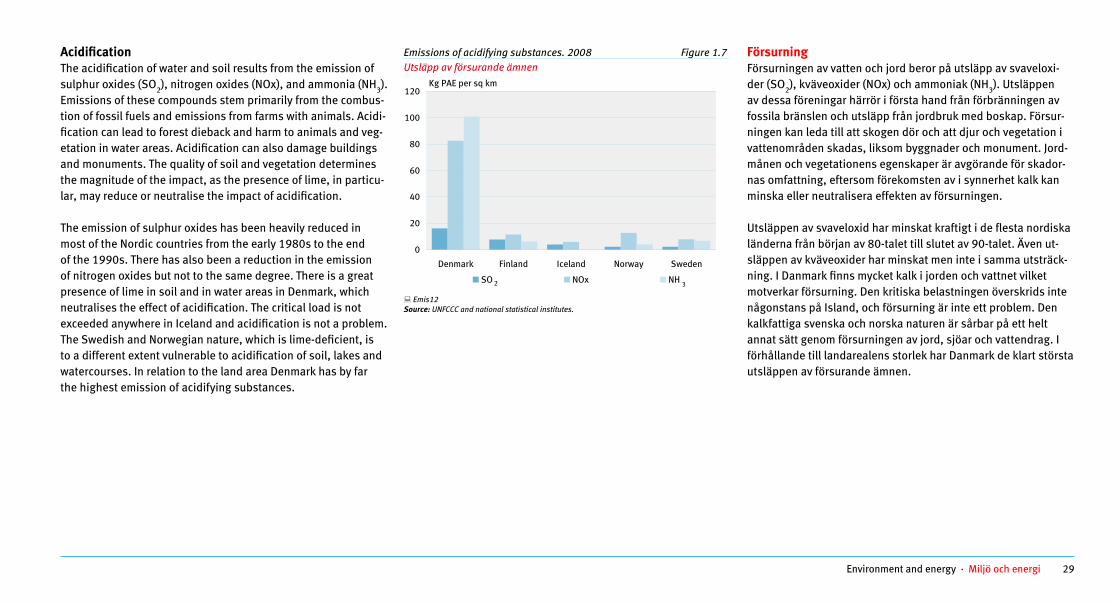
AcidificationThe acidification of water and soil results from the emission of sulphur oxides (SO2), nitrogen oxides (NOx), and ammonia (NH3). Emissions of these compounds stem primarily from the combus-tion of fossil fuels and emissions from farms with animals. Acidi-fication can lead to forest dieback and harm to animals and veg-etation in water areas. Acidification can also damage buildings and monuments. The quality of soil and vegetation determines the magnitude of the impact, as the presence of lime, in particu-lar, may reduce or neutralise the impact of acidification.
The emission of sulphur oxides has been heavily reduced in most of the Nordic countries from the early 1980s to the end of the 1990s. There has also been a reduction in the emission of nitrogen oxides but not to the same degree. There is a great presence of lime in soil and in water areas in Denmark, which neutralises the effect of acidification. The critical load is not exceeded anywhere in Iceland and acidification is not a problem. The Swedish and Norwegian nature, which is lime-deficient, is to a different extent vulnerable to acidification of soil, lakes and watercourses. In relation to the land area Denmark has by far the highest emission of acidifying substances.
FörsurningFörsurningen av vatten och jord beror på utsläpp av svaveloxi-der (SO2), kväveoxider (NOx) och ammoniak (NH3). Utsläppen av dessa föreningar härrör i första hand från förbrän nin gen av fossila bränslen och utsläpp från jordbruk med boskap. Försur-ningen kan leda till att skogen dör och att djur och vegetation i vattenområden skadas, liksom byggnader och monument. Jord-månen och vegetationens egenskaper är avgörande för skador-nas omfattning, eftersom förekomsten av i synnerhet kalk kan minska eller neutralisera effekten av försurningen.
Utsläppen av svaveloxid har minskat kraftigt i de flesta nordiska länderna från början av 80-talet till slutet av 90-talet. Även ut-släppen av kväveoxider har minskat men inte i samma utsträck-ning. I Danmark finns mycket kalk i jorden och vattnet vilket motverkar försurning. Den kritiska belastningen överskrids inte någonstans på Island, och försurning är inte ett problem. Den kalkfattiga svenska och norska naturen är sårbar på ett helt annat sätt genom försurningen av jord, sjöar och vattendrag. I förhållande till landarealens storlek har Danmark de klart största utsläppen av försurande ämnen.
Environment and energy · 20 Miljö och energi
Opdateret: 13. august Kontrolleret:
Emissions of acidifying substances. 2008 Figure 1.7 Utsläpp av försurande ämnen
40
60
80
100
120
0
20
Denmark Finland Iceland Norway Sweden
SO NOx NH2 3
Kg PAE per sq km
Emis12 Source: UNFCCC and national statistical institutes.

30 Environment and energy · Miljö och energi
FertilizersAnimal and crop production in the agricultural sector involves the use of both manure and commercial fertilizers. This adds nitrogen (N), phosphorus (P) and potassium (K), which are the main ingredients in commercial fertilizers, to the soil. Parts of nitrogen and phosphorus and, to a lesser extent, potassium are not absorbed by plants but are washed out of the soil and taken to the sea by water runoffs. In particular, the release of nitrogen can lead to an unwanted algae growth, which is harmful to the marine environment. The following measures are taken to limit the runoff of soil nutrients: better management of the use of fertilizers, better cultivation systems, and technical facilities.
The consumption of commercial fertilizers affecting the environ-ment has generally declined over the last ten years.
GödningsmedelBoskapsuppfödning och produktion av grödor i jordbruks-sektorn innefattar användning av både naturgödsel och konst-gödsel. Detta tillför jorden kväve (N), fosfor (P) och kalium (K), som är de aktiva huvudingredienserna i konstgödsel. En del av kvävet och kaliumet och en mindre del av fosforn absorberas inte av växterna utan urlakas ur jorden och förs via vatten dragen till havet. Särskilt utsläppen av kväve kan leda till oönskad alg-tillväxt, som är skadlig för den marina miljön. Följande åtgärder har vidtagits för att begränsa avrinningen av näringsämnen i jorden: mer effektiv användning av gödsel, bättre odlingsmeto-der samt tekniska åtgärder.
Användningen av konstgödsel med miljöeffekter har allmänt sett minskat under de senaste tio åren.
Opdateret: 12/8-2010 Kontrolleret:
Consumption of commercial fertilizers. 2008/2009 Table 1.6Användning av handelsgödsel
Denmark Finland Åland Iceland Norway Sweden
1 000 tonnes 1 000 ton
Nitrogen (N) 200.3 136.0 0.7 12.0 82.5 186.5 Kväve (N)Phosphorus (P) 7.2 10.8 0.1 3.8 7.1 14.6 Fosfor (P)Potassium (K) 26.4 32.9 0.3 2.9 27.7 33.5 Kalium (K)
Kg per ha arable land Nitrogen (N)
79.1 59.4 52.9 93.0 98.2 70.6
Kg per ha åkermarkKväve (N)
Phosphorus (P) 2.8 4.7 2.8 29.5 8.5 5.5 Fosfor (P)Potassium (K) 10.4 14.4 22.7 22.5 33.0 12.7 Kalium (K)
Fert01 and Area02 Source: National statistical institutes and Information Centre of the Ministry of Agriculture and Forestry, Finland. Note: Åland
Environment and energy · Miljö och energi 21
and Sweden: 2006/2007 data. Finland: Excl. forest fertilizers. SverigeNot: : 2006/2007 års uppgifter. Finland: Exkl. skogsgödselmedel.
Foto: BeeLine

31Environment and energy · Miljö och energi
PesticidesPesticides are chemical products used primarily in the agricul-tural sector to fight weeds, fungi and insects. Pesticides can harm environmental conditions for wild animals, plants and insects but are not harmful to the plant they are intended to protect. Pesticides also accumulate in lakes and water streams, causing pollution.
Pesticides are divided into three different groups: herbicides against weeds, fungicides against fungi, and insecticides against unwanted insects. In addition, growth regulators are used, for example, to control the length of the straw in grain. There are major year-to-year variations in pesticide application, based on weather and other factors – for example, changes in what is cultivated.
The total amount of pesticides used in the Nordic countries has been cut almost in half since 1985. Since the 1980s, inorganic fungicidal compounds with application rates of several tens of kilograms per hectare have been replaced by more active or-ganic compounds with application rates of a few kilograms per hectare.
BekämpningsmedelBekämpningsmedel är kemisk-tekniska produkter som huvud-sakligen används inom jordbruket för att bekämpa ogräs, svamp och insekter. Bekämpningsmedel kan ha skadlig inverkan på levnadsvillkoren för vilda djur, växter och insekter, men skadar inte de odlade växter som de är avsedda att skydda. Medlen kan också ackumuleras i och förorena sjöar och vattendrag.
Bekämpningsmedel kan indelas i tre olika grupper: ogräsmedel mot ogräs, svampmedel mot svamp och insektsmedel mot ska-deinsekter. Dessutom används tillväxtreglerande medel, exem-pelvis för att kontrollera stjälkens längd på spannmål. Det finns stora skillnader i förbrukningen av bekämpningsmedel mellan olika år beroende på väder och andra faktorer, exempelvis för-ändringar beträffande de grödor man odlar.
Den totala förbrukningen av bekämpningsmedel i de nordiska länderna har nästan halverats sedan 1985. Sedan 80-talet har oorganiska svampmedel med förbrukningstal på åtskilliga tiotals kilo per hektar nu ersatts av organiska föreningar som är mer aktivt biologiska med förbrukningstal på några kilo per hektar.
Environment and energy · 21 Miljö och energi
Opdateret: 13. august Kontrolleret:
Consumption of pesticides Figure 1.8 Total förbrukning av bekämpningsmedel
20
40
60
80
100
1996 1998 2000 2002 2004 2006 2008
Denmark
Finland
Norway
Sweden
120
140
160
180
200
220
240
260Index 1995=100
Fert02
Source: National statistical institutes and Finnish Food Safety Authority Evira.

32 Environment and energy · Miljö och energi
Organic farmingOrganic farming is a form of agriculture that relies on the management of ecosystems and seeks to reduce or refrain from adding material. It is especially important not to add ar-tificial substances, such as fertilizers or chemical pesticides. Organic farming tends to have lower intensity than conven-tional farming. It is an approach that looks at the big picture and intends to develop the ecosystem that can survive for a very long time (sustainable agriculture), a diversity of species (biodiversity) and ecosystem live in the soil (topsoil). The organic farming area has risen in all of the Nordic coun-tries since 2000. Norway has more than doubled the area from 2 to 5 per cent of total arable land. Finland and Denmark have had a more moderate growth. The organic farming area has also risen remarkably in Iceland and Åland.
Ekologiskt jordbrukEkologiskt jordbruk är en form av jordbruk som förlitar sig på förvaltande av ekosystem och strävar efter att minska eller helt avstå från att tillföra material. Särskilt viktigt är det att inte tillföra konstgjorda ämnen som handelsgödsel eller kemiska bekämpningsmedel. Ekologiskt jordbruk tenderar att ha lägre intensitet än konventionellt jordbruk. Det är ett förhållningssätt som ser till helheten och avser att åstadkomma ekosystem som kan fortleva mycket länge (hållbart jordbruk), en mångfald av arter (biodiversitet) och levande ekosystem i jorden (matjorden).
Det ekologiska jordbruket har ökat i alla nordiska länder sedan 2000. Norge har mer än fördubblat området för ekologiskt jord-bruk från 2 till 5 procent av den totala åkermarken. Finland och Danmark har haft en mer måttlig tillväxt. Det ekologiska jordbru-ket har också ökat anmärkningsvärt på Island och Åland.
Environment and energy · 22 Miljö och energi
Opdateret: Kontrolleret:
Organic farming area in per cent of total arable land Figure 1.9 Ekologisk jordbruksareal i procent av total åkermark
0
2
4
6
2000 2001 2002 2003 2004 2005 2006 2007 2008 2009
Denmark
Finland
Åland
Iceland
Norway
8
10
12
14
16
18
20
Sweden
Per cent
Oeko01
Source: National statistical institutes and Information Centre of Agriculture and Forestry, Finland.
Foto: ImageSelect

33Population · Befolkning
PopulationBefolkning
At the beginning of the 20th century, almost 12 mio. people lived in the Nordic countries. Today, the population has in-creased to over 25 million people – more than a doubling. The strongest growth is seen in Green land, where the population has multiplied by almost five, from 12 000 to 56 000 people. In Ice-land the increase has gone from 78 000 to 318 000 people. The popula tion on the Faroe Islands has tripled, from 15 000 to 49 000 people. The Swedish and Ålandic populations are the only ones who have not at least doubled.
In this chapter you can find information on population such as
• population figures • life expectancy • dependency ratio • population changes and projections• fertility and abortions• family structure • migration and asylum• elections
More detailed information on the subject and longer time series are available in the Nordic database, more specifically under population and election.
I början av 1900-talet bodde nästan 12 milj. människor i de nordiska länderna. I dag har befolkningen ökat till 25 miljonar människor – mer än en fördubbling. Den snabbaste tillväxten har skett på Grön land, där befolk ningen nästan har femdubb-lats, från 12 000 till 56 000 personer. På Island har folkmängden ökat från 78 000 till 318 000. Befolkningen på Färöarna har tredubblats med en ökning från 15 000 till 49 000 personer. Sverige och Åland är de enda länder där det inte skett minst en fördubbling av befolkningen.
I detta kapitel finner du bl.a. följande information om befolkningen
• befolkningstal • medellivslängd• försörjningsbördan • befolkningsutvecklingen och prognoser• fruktsamhet och aborter• familjestruktur• migration och asyl• val Mer detaljerad information om ämnet och längre tidsserier finns tillgängliga i den nordiska databasen, mer specifikt inom befolkning och val.
Foto: ImageSelect

34 Population · Befolkning
The Nordic populationSince 1990 the total popu lation in the Nordic countries has in-creased by more than 2 million people (10 per cent) – most in Ice land (25 per cent) and Norway (15 per cent). Certain regions in Sweden, Norway and Finland have experienced a decline in the population, but at the national level, all the Nordic countries have experien ced growth.
For the first time since 2005 the population in Greenland has increased. From 2009 to 2010 the populations on the Faroe Islands and Iceland have experienced a slight decrease.
Den nordiska befolkningenSedan 1990 har den totala folkmängden i de nordiska länderna ökat med omkring 2 miljonar invånare (10 procent) – mest på Is-land (25 procent) och i Norge (15 procent). Vissa regio ner i Sve-rige, Norge och Finland har upplevt en befolknings minsk ning, men på natio nell nivå har det skett en ökning i hela Norden.
För första gången sedan 2005 har befolkningen på Grönland ökat. Från 2009 till 2010 har befolkningarna på Färöarna och Island minskat något.
Environment and energy · 20 Miljö och energi
Opdateret: 25/9-10 Overført: Kontrolleret: Population. 1 January Table 2.1 Folkmängd
Denmark Faroe Is. Greenland Finland Åland Iceland Norway Sweden Nordic total
Persons Personer
Total Totalt
1990 5 135 409 47 770 55 558 4 974 383 24 231 253 785 4 233 116 8 527 036 23 227 057 19901995 5 215 718 43 644 55 732 5 098 754 25 158 266 978 4 348 410 8 816 381 23 845 617 19952000 5 330 020 45 353 56 124 5 171 302 25 706 279 049 4 478 497 8 861 426 24 221 771 20002005 5 411 405 48 337 56 969 5 236 611 26 530 293 577 4 606 363 9 011 392 24 664 654 20052009 5 511 451 48 702 56 194 5 326 314 27 456 319 368 4 799 252 9 256 347 25 317 628 20092010 5 534 738 48 650 56 452 5 351 427 27 734 317 630 4 858 199 9 340 682 25 507 778 2010
Men Män
1990 2 530 597 24 915 30 057 2 412 760 11 900 127 432 2 093 280 4 212 080 11 431 121 19901995 2 573 324 22 577 29 706 2 481 649 12 365 133 891 2 150 257 4 356 254 11 747 658 19952000 2 634 122 23 464 29 989 2 523 026 12 639 139 665 2 217 140 4 380 118 11 947 524 20002005 2 677 292 25 116 30 319 2 562 077 13 102 147 170 2 284 070 4 466 311 12 192 355 20052009 2 732 020 25 317 29 809 2 611 653 13 641 162 068 2 395 053 4 603 710 12 559 630 20092010 2 743 286 25 308 29 936 2 625 067 13 807 159 936 2 426 752 4 649 014 12 659 299 2010
Women Kvinnor
1990 2 604 812 22 855 25 501 2 561 623 12 331 126 353 2 139 836 4 314 956 11 795 936 19901995 2 642 394 21 067 26 026 2 617 105 12 793 133 087 2 198 153 4 460 127 12 097 959 19952000 2 695 898 21 889 26 135 2 648 276 13 067 139 384 2 261 357 4 481 308 12 274 247 20002005 2 734 113 23 221 26 650 2 674 534 13 428 146 407 2 322 293 4 545 081 12 472 299 20052009 2 779 431 23 385 26 385 2 714 661 13 815 157 300 2 404 199 4 652 637 12 757 998 20092010 2 791 452 23 342 26 516 2 726 360 13 927 157 694 2 431 447 4 691 668 12 848 479 2010
Popu01 Source: National statistical institutes. Note: Finland: Includes Åland. Not: Finland: Inkluderar Åland.

35Population · Befolkning
Life expectancyOne way of measuring the mortality rate is by life expect ancy at birth. This measure indicates how many years a newborn is expected to live, based on current patterns of mortality. As the mortality rate of men and women differs quite a bit (women tend to live longer), life expectancy is calculated separately for men and women.
Life expectancy is rising in all the Nordic countries. However, the levels vary greatly. Life expectancy for men in Greenland is 66.6 years, compared to 79.7 years for men in Iceland. Women in Sweden and in Iceland are expected to live the longest – 83.3 years.
MedellivslängdAtt mäta dödlighetsfrekvensen är ett sätt att beräkna medel-livslängden för en ny född. Detta mått indikerar hur många år en nyfödd kan förvänta sig att leva baserat på nuvarande dödlighetsmönster. Eftersom dödlighetstalen skiljer sig en hel del mellan män och kvinnor (kvinnor tenderar att leva längre), beräknas medellivs längden separat för män och kvinnor.
Medellivslängden ökar i alla nordiska länder. Den varierar emel-lertid kraftigt. Medellivslängden för män på Grönland är 66,6 år jämfört med 79,7 år för män på Island. Kvinnor i Sverige och på Island kan förvänta sig att leva längst – 83,3 år.
Environment and energy · 20 Miljö och energi
Opdateret: 25/9-10 Overført: Kontrolleret:
Life expectancy at birth Table 2.2Förväntad medellivslängd för nyfödda
Denmark Faroe Is. Greenland Finland Åland Iceland Norway Sweden
P ersons ersoner P
Men Män 1990 72.0 72.3 60.7 70.9 74.7 75.0 73.4 74.8 19901995 72.6 73.5 62.3 72.8 75.1 76.5 74.8 76.2 19952000 74.3 75.1 62.8 74.1 78.5 77.6 76.0 77.4 20002005 75.6 76.9 65.5 75.5 77.6 79.2 77.7 78.4 20052008 76.3 76.8 66.6 76.3 79.0 79.6 78.3 79.1 20082009 76.5 76.9 .. 76.5 .. 79.7 78.6 79.3 2009
Women Kvinnor1990 77.7 79.4 68.4 78.9 82.8 80.1 79.8 80.4 19901995 77.8 80.5 68.3 80.2 81.1 80.6 80.8 81.5 19952000 79.0 81.4 68.0 81.0 81.5 81.4 81.4 82.0 20002005 80.2 81.4 70.9 82.3 83.6 83.1 82.5 82.8 20052008 80.7 82.3 71.6 83.0 83.1 83.0 83.0 83.2 20072009 80.8 82.4 .. 83.1 .. 83.3 83.1 83.3 2009
Life01 Source: National statistical institutes. Note: Finland: Includes Åland. Not: Finland: Inkluderar Åland.
Foto: ImageSelect
36 Population · Befolkning
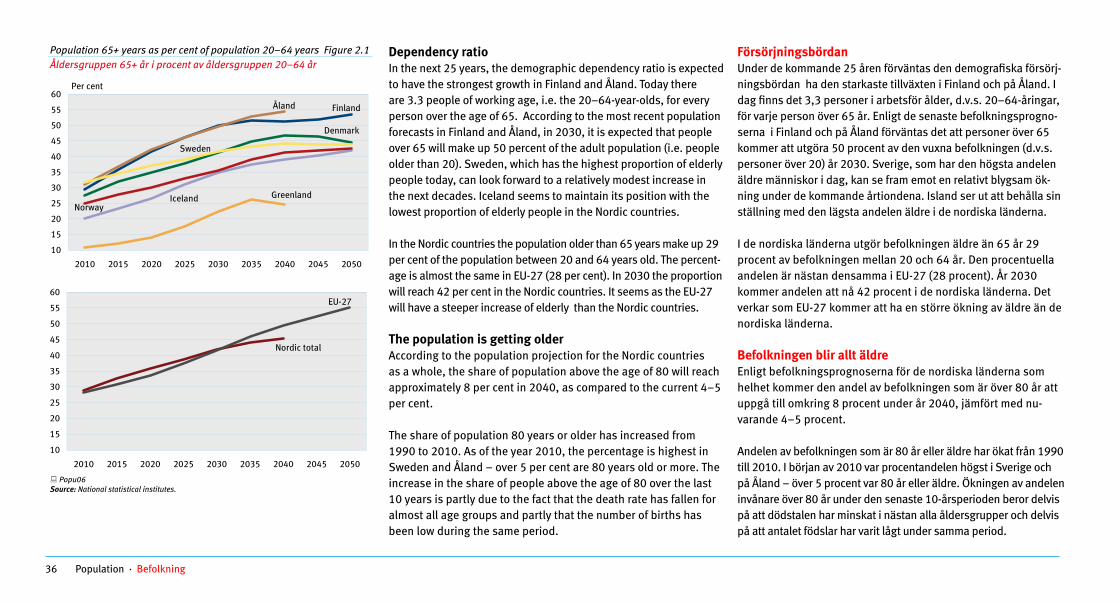
Dependency ratioIn the next 25 years, the demographic dependency ratio is expected to have the strongest growth in Finland and Åland. Today there are 3.3 people of working age, i.e. the 20–64-year-olds, for every person over the age of 65. According to the most recent population forecasts in Finland and Åland, in 2030, it is expected that people over 65 will make up 50 percent of the adult population (i.e. people older than 20). Sweden, which has the highest proportion of elderly people today, can look forward to a relatively modest increase in the next decades. Iceland seems to maintain its position with the lowest proportion of elderly people in the Nordic countries.
In the Nordic countries the population older than 65 years make up 29 per cent of the population between 20 and 64 years old. The percent-age is almost the same in EU-27 (28 per cent). In 2030 the proportion will reach 42 per cent in the Nordic countries. It seems as the EU-27 will have a steeper increase of elderly than the Nordic countries.
The population is getting olderAccording to the population projection for the Nordic coun tries as a whole, the share of population above the age of 80 will reach approximately 8 per cent in 2040, as compared to the current 4–5 per cent.
The share of population 80 years or older has increased from 1990 to 2010. As of the year 2010, the percentage is highest in Sweden and Åland – over 5 per cent are 80 years old or more. The increase in the share of people above the age of 80 over the last 10 years is partly due to the fact that the death rate has fallen for almost all age groups and partly that the number of births has been low during the same period.
FörsörjningsbördanUnder de kommande 25 åren förväntas den demografiska försörj-ningsbördan ha den starkaste tillväxten i Finland och på Åland. I dag finns det 3,3 personer i arbetsför ålder, d.v.s. 20–64-åringar, för varje person över 65 år. Enligt de senaste befolkningsprogno-serna i Finland och på Åland förväntas det att personer över 65 kommer att utgöra 50 procent av den vuxna befolkningen (d.v.s. personer över 20) år 2030. Sverige, som har den högsta andelen äldre människor i dag, kan se fram emot en relativt blygsam ök-ning under de kommande årtiondena. Island ser ut att behålla sin ställning med den lägsta andelen äldre i de nordiska länderna.
I de nordiska länderna utgör befolkningen äldre än 65 år 29 procent av befolkningen mellan 20 och 64 år. Den procentuella andelen är nästan densamma i EU-27 (28 procent). År 2030 kommer andelen att nå 42 procent i de nordiska länderna. Det verkar som EU-27 kommer att ha en större ökning av äldre än de nordiska länderna.
Befolkningen blir allt äldreEnligt befolknings prog noserna för de nordiska länderna som helhet kommer den andel av befolkningen som är över 80 år att uppgå till omkring 8 procent under år 2040, jämfört med nu-varande 4–5 procent.
Andelen av befolkningen som är 80 år eller äldre har ökat från 1990 till 2010. I början av 2010 var procentandelen högst i Sverige och på Åland – över 5 procent var 80 år eller äldre. Ökningen av andelen invånare över 80 år under den senaste 10-årsperioden beror delvis på att dödstalen har minskat i nästan alla ålders grupper och delvis på att antalet födslar har varit lågt under samma period.
Environment and energy · 20 Miljö och energi
Population 65+ years as per cent of population 20–64 years Figure 2.1 Åldersgruppen 65+ år i procent av åldersgruppen 20–64 år
10
15
20
25
30
2010 2015 2020 2025 2030 2035
Iceland Norway
35
40
45
50
55
60
2040 2045 2050
Denmark
Finland Åland
Sweden
Per cent
Greenland
10
15
20
25
30
35
40
45
50
55
60
2010 2015 2020 2025 2030 2035 2040 2045 2050
Nordic total
EU-27
Popu06
Source: National statistical institutes.
Opdateret: 25/9-10; Kontrolleret: ÆNDRES til db. figure…. Nederste indhold: Nordic og EU15

37Population · Befolkning
Population changesThe population increase in the Nordic countries during recent years is partly the re sult of a natural increase (live births minus deaths) and partly a positive net migra tion (immigration minus emigration). A positive net migration means that more people enter the country than leave.
In 2009, net migration had the greatest impact on the popula-tion increase in Sweden. That was also the case with Denmark, Finland, Åland and Norway. Only in the Faroe Islands and in Greenland, natural population increase had the greatest impact on the population change.
Iceland and Faroe Islands both had a slight decrease in the population growth due to a negative netmigration from 2009 to 2010.
BefolkningsutvecklingenBefolkningsökningen i de nordiska länderna under senare år är delvis ett resultat av en naturlig ökning (antalet födda minskat med antalet döda) och delvis av en posi tiv nettomigration (in-vandring minskat med utvandring). En positiv nett o migra tion betyder att det är fler människor som kommer in i landet än som lämnar det.
Net tomigrationen har år 2009 haft störst inverkan på befolkn-ingsutvecklingen i Sverige. Detta gäller också Danmark, Finland, Åland och Norge. Bara på Färöarna och på Grönland var den naturliga befolkningsförändringen av störst betydelse. Island och Färöarna hade en lille minskning i befolkningen på grund av en negativ netmigration från 2009 till 2010.
Did you know that ... more than 300 000 children were born in the Nordic countries in 2009.
Visste du att ... mer än 300 000 barn föddes i de nordiska länderna under 2009.
Foto: ImageSelect
Environment and energy · 20 Miljö och energi
Opdateret: 25/9-10 Overført: Kontrolleret:
Population changes during 2009 Table 2.3Befolkningsförändringar under 2009
Denmark Faroe Is. Greenland Finland Åland Iceland Norway Sweden
Persons Personer
Population 1 January 2009 5 505 504 48 702 56 194 5 326 314 27 456 319 368 4 799 252 9 256 347 Folkmängd 1 januari 2009
Live births 62 818 614 895 60 430 267 5 027 61 807 111 801 Levande föddaDeaths 54 872 386 438 49 883 247 2 002 41 449 90 080 DödaNatural population increase 7 946 228 457 10 547 20 3 025 20 358 21 721 Naturlig folkökning
InvandringImmigration 67 161 1 341 2 551 26 699 953 5 777 65 186 102 280Emigration 44 874 1 621 2 740 12 151 700 10 612 26 549 39 240 UtvandringNet migration 22 287 -280 -189 14 548 253 -4 835 38 637 63 040 Nettomigration
Population increase 30 233 -52 268 25 095 273 -1 810 58 995 84 335 Folkökning
Corrections -999 0 -10 -18 5 72 -48 -428 Avvikelse
Population 1 January 2010 5 534 738 48 650 56 452 5 351 427 27 734 317 630 4 858 199 9 340 682 Folkmängd 1 januari 2010
Popu07 Source: National statistical institutes. Note: Finland: Includes Åland. Not: Finland: Inkluderar Åland.

38 Population · Befolkning
Population projectionsThe population projections are based on assumptions relating to fer tility, mortality and immigration and emigration in the future, which are naturally subject to uncertainty. The most certain projec-tions concern the development in the number of elderly, as their number is already known.
The fastest increase in the population figure is seen in Iceland, Norway and on Åland, where the youngest population live. According to the latest population pro jections, the population figure is, during the next 25 years, expected to increase by 27 per cent in Åland. In Norway an increase of 24 per cent is expected, while the increase in Iceland is expected to be 21 per cent.
The Danish population is expected to increase by 9 per cent until 2035, while Finland and Sweden expect an increase in the population of about 13 and 16 per cent. Subsequently, the population figure will begin to drop if developments follow the most recent population projections.
BefolkningsprognoserDessa befolkningsprognoser utgår ifrån ett antal antaganden om framtida fertilitet, dödstal samt in- och utvandring, vilka själv klart är osäkra. De mest tillförlitliga siffrorna är de som anger utvecklingen av antalet äldre, eftersom man redan kän-ner deras antal.
Befolkningen växer snabbast på Island, i Norge och på Åland, som också har den yngsta befolkningen. Enligt de senaste befolkningstillväxtprognoserna förväntas befolkningen inom de närmaste 25 åren att växa med dryga 27 procent på Åland. I Norge förväntas ökningen bli 24 procent och på Island förvän-tas den bli 21 procent.
Den danska be folkningen förväntas att växa med 9 procent fram till 2035, medan Finland och Sverige kan se fram emot en befolkningsökning på 13 respektive 16 procent. Därefter kom-mer befolkningen att minska, förutsatt att utvecklingen följer de senaste prog noserna.
Environment and energy · 20 Miljö och energi
Opdateret: 25/9-10 Kontrolleret:
Population trends according to latest population projections Figure 2.2 Befolkningen enligt de senaste befolkningsprognoserna
95
100
105
110
2005 2010 2015 2020 2025 2030 2035 2040 2045 2050
Denmark
Sweden
Greenland
Åland
Iceland
Norway
Finland115
120
125
130
135
140
145Index 2005=100
Popu06 and Popu01 Source: National statistical institutes.
Did you know that ... the average age in the Nordic coun-tries is 40.4 years. Finland and Sweden have the oldest population with an average age of 41.3 and 41.0 years.
Visste du att ... medelåldern i de nordiska länderna är 40,4 år. Finland och Sverige har den äldsta befolkningen med en medelålder på 41,3 respektive 41,0 år.
Foto: ImageSelect

39Population · Befolkning
FertilityThe number of births depends, among other things, on the number of women in the child-bearing age group – the ages of 15–49 – and the pattern of pregnancies and birth frequency in the various age groups. A measure for calcu lating this is the total fertility rate, which is the average number of live births per 1 000 women of child-bear-ing age. Thus, the total fertility rate is comparable, despite differ-ences in the demographic structure in different countries.
The fertility rate can give an impression of whether a population increases or decreases. If the fertility rate is 2.1 the population will remain at the same size. Women in the Nordic countries give birth to a relative high number of children, compared to the other European countries.
Fruktsamheten kan ge en bild av om en befolkning ökar eller minskar. Om fruktsamheten är 2,1 kommer befolkningens stor-lek att förbli densamma. Kvinnor i de nordiska länderna har ett relativt högt födelsetal jämfört med övriga Eu ropa.
Även om under de senaste åren har fruktsamheten ökat i samt-liga nordiska länder, har Danmark har haft en liten minskning från 2009 till 2010. Högst fruktsamhet har Färöarna, Grönland och Island, lägst har Danmark.
Environment and energy · 20 Miljö och energi
Opdateret: 25/9-10 Overført: Kontrolleret:
Fertility rate by mother's age. 2009 Table 2.4Fruktsamhet efter moderns ålder
Denmark Faroe Is. Greenland Finland Åland Iceland Norway Sweden
Live births, 1 000 women Levande födda, 1 000 kvinnor
Total fertility rate
Summerade fruktsamhetstal1 842.2 2 333.9 2 217.0 1 864.0 1 682.0 2 221.0 1 979.0 1 935.4
–19 years 5.6 14.1 53.1 8.5 1.2 14.3 9.5 5.8 –19 år 20–24 years 42.7 77.3 112.4 59.4 41.1 74.9 61.4 51.0 20–24 år25–29 years 122.1 150.4 134.4 115.7 95.7 140.7 128.1 115.0 25–29 år 30–34 years 131.4 139.4 93.9 119.5 122.7 130.7 127.2 134.9 30–34 år 35–39 years 56.3 75.9 38.8 56.5 62.7 67.7 58.3 66.7 35–39 år40–44 years 10.0 8.4 10.6 11.9 13.1 15.1 10.2 13.0 40–44 år45+ years 0.4 1.3 0.0 0.4 0.0 0.7 0.5 0.7 45+ år
Chil02 Source: National statistical institutes. Note: Greenland: 2008 data. Finland: Includes Åland. Not: Grönland: 2008 års uppgifter. Finland: Inkluderar Åland.
Environment and energy · 20 Miljö och energi
Opdateret: 25/9-10 Overført Kontrolleret:
Total fertility rate Figure 2.3 Summerade fruktsamhetstal
1.41.51.61.71.81.9
1991 1993 1995 1997 1999 2001 2003 2005 2007 2009
Denmark
Faroe Islands
Greenland
Finland
Åland
Iceland
Norway
Sweden EU-15
2.02.12.22.32.42.52.62.72.8
Number of children per woman
Chil02 Source: National statistical institutes and Eurostat. Note: Finland: Includes Åland. Not: Finland: Inkluderar Åland.
In recent years, the fertility rate has increased slightly in the five Nordic countries, although Denmark has had a slight decrease from 2009–2010. The Faroe Islands, Greenland and Iceland have the high est fertility rates, and the lowest rates are seen in Denmark.
FruktsamhetAntalet födslar beror bland annat på antalet kvinnorna i bar-nafödande ålder – 15–49 år – och på fruktsamheten i olika åldersgrupper. Ett mått på fruktsamheten är det summerade fruktsamhetstalet, beräknat som ett genomsnitt av antalet le-vande födda per 1 000 kvinnor i barnafödande ålder. Detta mått på frukt samheten är oberoende av demografisk struktur och kan därför användas för jämfö relser mellan olika länder.

40 Population · Befolkning
Opdateret: 25/9-10 Kontrolleret: Total number of induced abortions Figure 2.4 Totalt antal utförda aborter
Environment and energy · 20 Miljö och energi
0 100 200
Denmark FaroeIslands
Green-land
Finland Åland Iceland Norway Sweden
300 400 500 600 700 800 900
1 000 1 100
2000 2008
Per 1 000 live births
Total number of induced abortions Figure 2.4 Heal15
Source: NOMESCO. Totalt antal utförda aborter 1 100
Per 1 000 live births
1 000
AbortionsSince the mid 1970s, induced abortions have been available in most of the Nordic countries. In Denmark, Greenland, Norway and Sweden, it is entirely up to the pregnant woman in the early stages of pregnancy to determine whether to have an abortion. In the Faroe Islands, Finland, Åland and Iceland, a leave based on social and/or medical criteria is required.
Greenland has the highest rate of abortions with 1 064 abor-tions per 1 000 live births. Sweden has the second highest with a rate of 348. The Faroe Islands has the lowest with 68 abortions per 1 000 live births. Since 1990 the abortion rate has risen in Greenland, Iceland, Åland, Norway and Sweden and only decreased in Denmark and Finland.
In Iceland and Sweden, abortions occur among mothers who are fairly young – below the age of 25. In Denmark and Finland, women who choose an abortion tend to be slightly older.
AborterSedan mitten på 1970-talet har det varit möjligt att få abort i flertalet nordiska län der. I Danmark, på Grönland, i Norge och Sverige är det den gravida kvinnan som tidigt i graviditeten kan bestämma om hon vill ha abort. På Färöarna, i Finland, på Åland och Island krävs tillstånd som grundas på sociala och/eller medicinska krite rier.
Grönland har den högsta abortfrekvensen med 1 064 aborter per 1 000 levande födda. Sverige har den näst högsta frekven-sen med 348 aborter per 1 000 levande födda. Färöarna har den lägsta med 68 aborter. Antalet aborter har sedan 1990 ökat på Grönland, Island, Åland, Norge samt i Sverige och gått ner i Danmark och Finland.
När det gäller Island och Sverige görs aborter ofta av mödrar som är ganska unga – under 25 år. I Danmark och Finland ten-derar de kvinnor som väljer abort att vara lite äldre.
Foto: ImageSelect
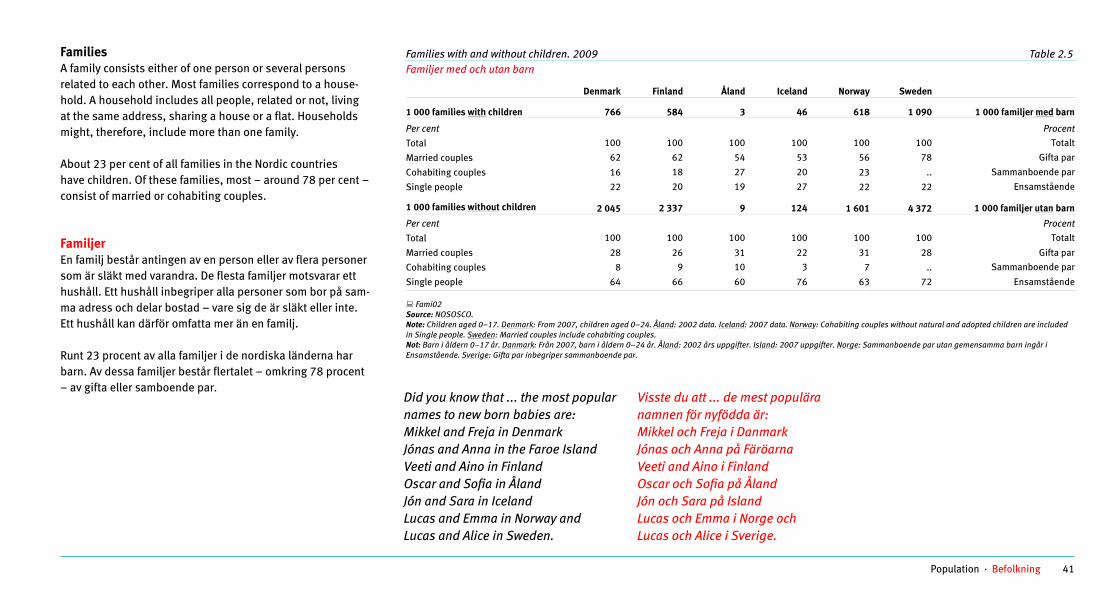
41Population · Befolkning
FamiliesA family consists either of one person or several persons related to each other. Most families correspond to a house-hold. A household includes all people, related or not, living at the same address, sharing a house or a flat. Households might, therefore, include more than one family.
About 23 per cent of all families in the Nordic countries have children. Of these families, most – around 78 per cent – consist of married or cohabiting couples.
FamiljerEn familj består antingen av en person eller av flera personer som är släkt med varandra. De flesta familjer motsvarar ett hushåll. Ett hushåll inbegriper alla perso ner som bor på sam-ma adress och delar bostad – vare sig de är släkt eller inte. Ett hushåll kan därför omfatta mer än en familj.
Runt 23 procent av alla familjer i de nordiska länderna har barn. Av dessa familjer består flertalet – omkring 78 procent – av gifta eller samboende par.
Opdateret: 25/9-10 Kontrolleret:
Families with and without children. 2009 Table 2.5Familjer med och utan barn
Denmark Finland Åland Iceland Norway Sweden
1 000 families with
Environment and energy · Miljö och energi 5
children 766 584 3 46 618 1 090 1 000 familjer med barn
Per cent ProcentTotal 100 100 100 100 100 100 Totalt
Married couples 62 62 54 53 56 78
1 000 families without
Gifta par18 27 20 Sammanboende par16 23 ..Cohabiting couples 20 19 27 Ensamstående22 22 22Single people
children 2 045 2 337 9 124 1 601 4 372 1 000 familjer utan barn
Per cent Procent100 100 100 100 100 100 TotaltTotal
28 26 31 22 31 28 Gifta parMarried couples 9 10 3 7 .. Sammanboende par8 Cohabiting couples
64 66 60 76 63 72 EnsamståendeSingle people
Fami02 Source: NOSOSCO.
: Children aged 0–17. Note Denmark: From 2007, children aged 0–24. Åland: 2002 data. Iceland: 2007 data. Norway: Cohabiting couples without natural and adopted children are included in Single people. Sweden: Married couples include cohabiting couples. Not: Barn i åldern 0–17 år. Danmark: Från 2007, barn i åldern 0–24 år. Åland: 2002 års uppgifter. Island: 2007 uppgifter. Norge: Sammanboende par utan gemensamma barn ingår i Ensamstående. Sverige: Gifta par inbegriper sammanboende par.
Did you know that ... the most popular names to new born babies are:Mikkel and Freja in DenmarkJónas and Anna in the Faroe IslandVeeti and Aino in FinlandOscar and Sofia in ÅlandJón and Sara in IcelandLucas and Emma in Norway andLucas and Alice in Sweden.
Visste du att ... de mest populära namnen för nyfödda är:Mikkel och Freja i DanmarkJónas och Anna på FäröarnaVeeti and Aino i FinlandOscar och Sofia på ÅlandJón och Sara på IslandLucas och Emma i Norge ochLucas och Alice i Sverige.

42 Population · Befolkning
Marriages and divorcesThe number of marriages and divorces only comprises so-called legal part nerships. Couples living together without being legally married make up a large share of the partnerships in the Nordic countries. Consequently, the number of mar riages and divorces does not give the complete picture of the number of people en-tering partner ships or dissolution rates.
The number of marriages has increased in almost all the Nordic countries since 1995, except in Denmark who has had a decline
of number of marriages since 1995. Åland and the Faroe Islands have had the largest increase in number of divorces since 1995. Finland, Norway and Sweden have had a decline in the number of divorces since 1995.
In relation to the total number of marriages, Denmark and Sweden had the highest divorce rate in 2009.
Environment and energy · 20 Miljö och energi
Opdateret: 25/9-10 Kontrolleret:
Divorces Figure 2.5Äktenskapsskillnader
0
1
2
3
4
5
6
7
8
Denmark FaroeIslands
Finland Åland Iceland Norway Sweden Nordictotal
1995 2009
Divorces per 1 000 marriages
Popu03 and Popu04 Source: National statistical institutes. Note: See table 2.6. Faroe Islands: 1995 refers to 1996. Not: Se table 2,6. Färöarna: 1995 avser 1996 års uppgifter.
Did you know that ... the number of reg-istered partners in Denmark has more than doubled since 2000.
Visste du att ... i Danmark har antalet registrerade partnerskap mer än for-dobblats sedan 2000.
Marriages and divorces. 2009 Table 2.6 Opdateret: 25/9-10
Overført: Giftermål och äktenskapsskillnader Kontrolleret::
Grønland ikke med – kan ikke finde tal for vielser og skilsmisser Marriages and divorces. 2009 Table 2.6 Giftermål och äktenskapsskillnader
Denmark Faroe Island
Finland Åland Iceland Norway Sweden Nordic total
Nu mber Antal
Marriages 32 934 224 29 836 120 1 480 24 793 48 033 137 420 GiftermålDivorces 14 940 64 13 527 53 550 10 235 22 211 61 580 Äktenskapsskillnader
Per 1 000, mean population Per 1 000, medelfolkmängd
Marriages 6.0 4.6 5.6 4.3 4.6 5.1 5.2 5.4 Giftermål
Per 1 000 married, 1 January Per 1 000 gifta, 1 januari
Divorces 6.9 3.4 6.8 5.4 5.1 5.7 7.0 6.6 Äktenskapsskillnader
Popu03 and Popu04 Source: National statistical institutes. Note: Norway: A new Marriage Act from 1 January 2009, permits people of same sex to be married. Persons already in a partnership can change their partnership to a marriage, or continue their partnership. Finland: Includes Åland. Not: Norge: En ny äktenskapslag från den 1 januari 2009 betyder att personer av samma kön kan gifta sig. Personer som redan ä är i ett partnerskap kan ändra sitt partnerskap till ett äktenskap eller fortsätta sitt partnerskap. Finland: Inkluderar Åland.
Environment and energy · 5 Miljö och energi

43Population · Befolkning
Åland och Färöarna har haft den största ökningen av anta-let skilsmässor sedan 1995. Finland, Norge och Sverige har haft en minskning i antalet skilsmässor sedan 1995.
I förhållande till antalet äktenskap hade Danmark och Sverige flest skilsmässor under 2009.
Giftermål och äktenskapsskillnader Antalet giftermål och äktenskapsskillnader omfattar här endast relationer i juridisk mening. Många par i de nordiska länderna bor tillsammans utan att vara lagligen gifta. Följaktligen ger an-talet giftermål och äktenskapsskillnader inte en fullständig bild av det antal invånare som flyttar ihop eller flyttar isär.
Antalet ingångna äktenskap i nästan alla de nordiska länderna har ökat se dan 1995, utom i Danmark som har haft en minsk-ning av antalet äktenskap sedan 1995.
Environment and energy · 20 Miljö och energi
Opdateret: 25/9-10 Overført: Kontrolleret: Kontrolleret:
Marital status. People aged 15 and more. 1 January 2010 Table 2.7Civilstånd. Personer 15 år och äldre
Denmark Faroe Is. Greenland Finland Åland Iceland Norway Sweden
1 000 persons 1 000 personer
Total 4 533.4 38.0 43.6 4 463.1 23.1 251.1 3 940.5 7 791.2 TotaltUnmarried Ogifta1 591.9 15.1 23.1 1 645.3 9.4 113.4 1 528.6 3 250.1Married and separated Gifta och separerade2 181.0 18.9 15.2 2 005.5 9.9 107.3 1 794.5 3 175.7Divorced Skilda440.0 1.6 3.4 512.8 2.2 18.9 363.5 878.7Registered partners Registrerade partners8.4 .. .. 3.2 .. 0.3 2.9 4.3Dissolved partnerships, persons Avregistrerade partnerskap, personer1.9 .. .. 0.4 .. .. 0.8 1.3Widow/widowers 310.3 2.4 2.0 296.0 1.5 11.3 250.1 481.1 Änklingar/änkor
Popu03 Source: National statistical institutes. Note: Widow/widowers includes Surviving partners. Norway: A new Marriage Act from 1 January 2009, permits people of same sex to be married. Persons already in a partnership can change their partnership to a marriage, or continue their partnership. Finland: Includes Åland. Not: Änklinger/ änkor inkluderar överlevande partners. Norge: En ny äktenskapslag från den 1 januari 2009 betyder att personer av samma kön kan gifta sig. Personer som redan är i ett partnerskap kan ändra sitt partnerskap till ett äktenskap eller fortsätta sitt partnerskap. Finland: Inkluderar Åland.
Foto: ImageSelect

44 Population · Befolkning
Environment and energy · 7 Miljö och energi
Immigration. 2009 Table 2.8 Invandring To: Denmark Faroe
Islands Greenland Finland
incl. ÅlandIceland Norway Sweden Till:
Persons Personer
From: Från:Total 67 161 1 341 2 551 26 699 5 777 65 186 102 280 TotaltDenmark . 967 2 198 408 1 193 3 124 5 457 DanmarkFaroe Islands 1 345 . 50 - 47 46 - FäröarnaGreenland 2 459 28 .- 1 15 27 - GrönlandFinland 431 1 - . 48 571 2 932 FinlandIceland 1 558 71 99 60 .- 1 625 741 IslandNorway 3 005 30 28 608 301 . 5 097 NorgeSweden 5 378 22 40 3 456 327 7 923 . SverigeBaltic countries 2 893 5 3 3 733 429 4 849 2 786 BaltikumPoland 4 635 15 2 357 1 235 10 323 5 141 PolenOther EEA 20 080 111 45 4 681 1 195 11 472 18 917 Övriga EESOther Europe 4 276 8 12 3 821 150 2 819 7 905 Övriga EuropaAmerica 6 341 22 9 1 545 418 3 505 6 763 AmerikaAfrica 2 112 15 4 2 000 72 5 296 13 274 AfrikaAsia 10 863 38 51 5 566 306 12 375 31 397 AsienOceania 1 381 7 6 246 23 493 924 OceanienUnknown and stateless 404 1 4 217 18 738 946 Okänt land och statslösa
Of which foreign citizens Varav utlänningarTotal 44 977 195 299 18 087 3 392 56 682 83 763 TotaltDenmark . 12 44 70 56 1 610 4 086 DanmarkFaroe Islands 25 . - - 17 39 - FäröarnaGreenland 30 - . - 9 19 - GrönlandFinland 383 1 - . 36 518 2 289 FinlandIceland 1 425 58 91 27 . 1 564 628 IslandNorway 2 018 6 15 94 31 . 2 024 NorgeSweden 2 300 10 32 910 70 6 199 . SverigeBaltic countries 2 818 5 2 3 440 420 4 825 2 692 BaltikumPoland 4 507 15 1 323 1 230 10 303 5 022 PolenOther EEA 13 696 31 39 2 039 831 9 485 13 529 Övriga EESOther Europe 3 637 7 10 3 449 106 2 612 7 136 Övriga EuropaAmerica 3 936 11 9 694 241 2 358 4 062 AmerikaAfrica 1 191 11 2 1 846 66 4 903 12 403 AfrikaAsia 8 309 27 48 5 023 257 11 226 28 733 AsienOceania 563 1 4 93 17 341 465 OceanienUnknown and stateless 139 - 2 79 5 680 694 Okänt land och statslösa
Migr01 Source: National statistical institutes.
Environment and energy · 20 Miljö och energi
Opdateret: 12/8-10 LLH Kontrolleret:
Immigration, total. 2009 Figure 2.6 Invandring, totalt
19%
13%
23%
2%
7%
7%
8%
22%
Intra-Nordic - 19%
Poland and Balticum - 13%
Other EEA - 21%
Other Europe - 7%
America - 7%
Africa - 8%
Asia - 22%
Other - 2%
Migr01
Source: National statistical institutes.
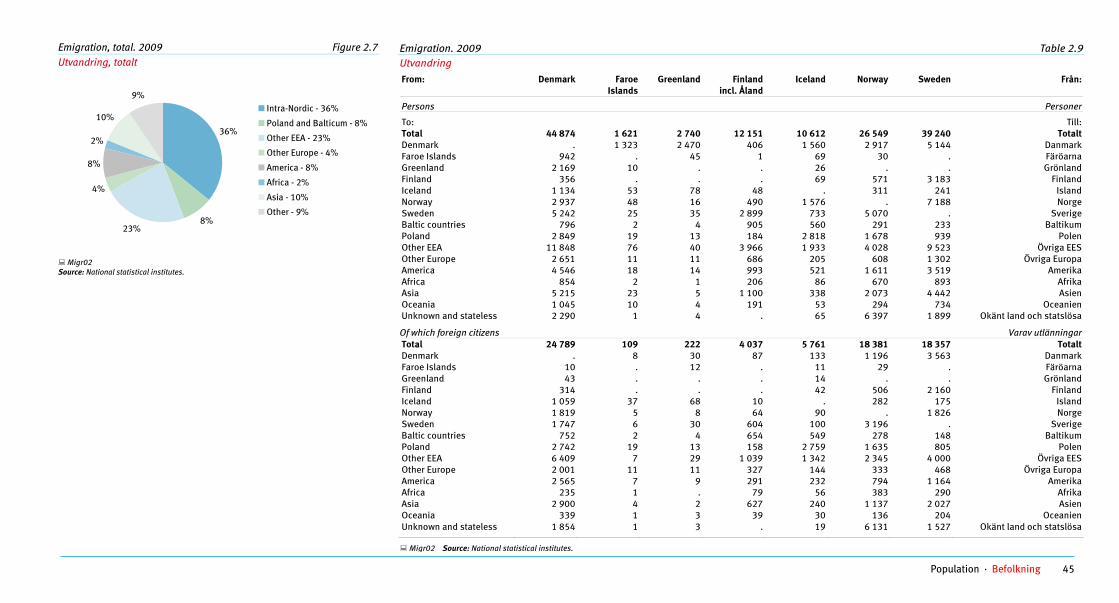
45Population · Befolkning
Environment and energy · 21 Miljö och energi
Emigration. 2009 Table 2.9 Utvandring From: Denmark Faroe
Islands Greenland Finland
incl. ÅlandIceland Norway Sweden Från:
Persons Personer
To: Till:Total 44 874 1 621 2 740 12 151 10 612 26 549 39 240 TotaltDenmark . 1 323 2 470 406 1 560 2 917 5 144 DanmarkFaroe Islands 942 . 45 1 69 30 . FäröarnaGreenland 2 169 10 . . 26 . . GrönlandFinland 356 . . . 69 571 3 183 FinlandIceland 1 134 53 78 48 . 311 241 IslandNorway 2 937 48 16 490 1 576 . 7 188 NorgeSweden 5 242 25 35 2 899 733 5 070 . SverigeBaltic countries 796 2 4 905 560 291 233 BaltikumPoland 2 849 19 13 184 2 818 1 678 939 PolenOther EEA 11 848 76 40 3 966 1 933 4 028 9 523 Övriga EESOther Europe 2 651 11 11 686 205 608 1 302 Övriga EuropaAmerica 4 546 18 14 993 521 1 611 3 519 AmerikaAfrica 854 2 1 206 86 670 893 AfrikaAsia 5 215 23 5 1 100 338 2 073 4 442 AsienOceania 1 045 10 4 191 53 294 734 OceanienUnknown and stateless 2 290 1 4 . 65 6 397 1 899 Okänt land och statslösa
Of which foreign citizens Varav utlänningarTotal 24 789 109 222 4 037 5 761 18 381 18 357 TotaltDenmark . 8 30 87 133 1 196 3 563 DanmarkFaroe Islands 10 . 12 . 11 29 . FäröarnaGreenland 43 . . . 14 . . GrönlandFinland 314 . . . 42 506 2 160 FinlandIceland 1 059 37 68 10 . 282 175 IslandNorway 1 819 5 8 64 90 . 1 826 NorgeSweden 1 747 6 30 604 100 3 196 . SverigeBaltic countries 752 2 4 654 549 278 148 BaltikumPoland 2 742 19 13 158 2 759 1 635 805 PolenOther EEA 6 409 7 29 1 039 1 342 2 345 4 000 Övriga EESOther Europe 2 001 11 11 327 144 333 468 Övriga EuropaAmerica 2 565 7 9 291 232 794 1 164 AmerikaAfrica 235 1 . 79 56 383 290 AfrikaAsia 2 900 4 2 627 240 1 137 2 027 AsienOceania 339 1 3 39 30 136 204 OceanienUnknown and stateless 1 854 1 3 . 19 6 131 1 527 Okänt land och statslösa
Migr02 Source: National statistical institutes.
Opdateret: 25/9-10 Overført: Kontrolleret:
Opdateret: 19/7-10 Kontrolleret:
Emigration, total. 2009 Figure 2.7 Utvandring, totalt
36%
8%
4%
8%
2%
10%
9%
23%
Intra-Nordic - 36%
Poland and Balticum - 8%
Other EEA - 23%
Other Europe - 4%
America - 8%
Africa - 2%
Asia - 10%
Other - 9%
Migr02
Source: National statistical institutes.
Environment and energy · Miljö och energi 21
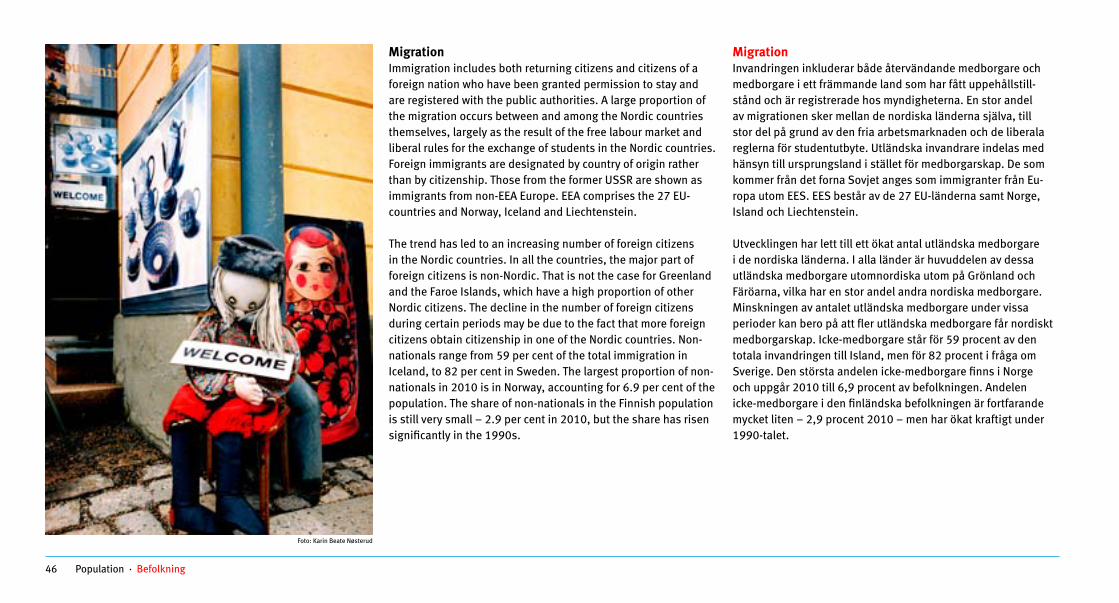
46 Population · Befolkning
MigrationImmigration includes both returning citizens and citizens of a foreign nation who have been granted permission to stay and are registered with the public authorities. A large proportion of the migration occurs between and among the Nordic coun tries themselves, largely as the result of the free labour market and liberal rules for the exchange of students in the Nordic coun tries. Foreign immigrants are desig nated by country of origin rather than by citizenship. Those from the former USSR are shown as immigrants from non-EEA Europe. EEA comprises the 27 EU-coun tries and Norway, Iceland and Liechtenstein.
The trend has led to an increasing number of foreign citizens in the Nordic coun tries. In all the countries, the major part of foreign citizens is non -Nordic. That is not the case for Greenland and the Faroe Islands, which have a high proportion of other Nordic citizens. The decline in the number of foreign citizens during certain periods may be due to the fact that more foreign citi zens obtain citizenship in one of the Nordic countries. Non-nationals range from 59 per cent of the total immigration in Iceland, to 82 per cent in Sweden. The largest proportion of non-nationals in 2010 is in Norway, accounting for 6.9 per cent of the population. The share of non-nationals in the Finnish popula tion is still very small – 2.9 per cent in 2010, but the share has risen significantly in the 1990s.
MigrationInvandringen inkluderar både återvändande medborgare och medborgare i ett främmande land som har fått uppehålls till-stånd och är registrerade hos myndig he terna. En stor andel av migrationen sker mellan de nordiska länderna själva, till stor del på grund av den fria arbetsmarknaden och de liberala reglerna för student ut byte. Utländska invandrare indelas med hänsyn till ursprungsland i stället för med borgarskap. De som kommer från det forna Sovjet anges som immigranter från Eu-ropa utom EES. EES består av de 27 EU-länderna samt Norge, Island och Liechten stein.
Utvecklingen har lett till ett ökat antal utländska medborgare i de nordiska län derna. I alla länder är huvuddelen av dessa utländska medborgare utom nordiska utom på Grönland och Färöarna, vilka har en stor andel andra nordiska medborgare. Minskningen av antalet utländska medborgare under vissa perioder kan bero på att fler utländska medborgare får nordiskt medborgar skap. Icke-medborgare står för 59 procent av den totala invandringen till Island, men för 82 procent i fråga om Sverige. Den största andelen icke-medborgare finns i Norge och uppgår 2010 till 6,9 procent av befolkningen. Andelen icke-medborgare i den finländska befolkningen är fortfarande mycket liten – 2,9 procent 2010 – men har ökat kraftigt under 1990-talet.
Foto: Karin Beate Nøsterud

47Population · Befolkning
Asylum requestsOne way to measure the number of foreigners who want to settle in the Nordic coun tries is to measure the number of asylum re-quests. Asylum seekers have entered the country but have not yet been granted leave to stay. For this reason, they do not appear in ordinary population statistics, which only cover persons entered in the population registers.
The number of asylum requests has increased in most Nordic countries during the 1990s, except in Sweden, where there was a huge number of requests in 1990–1992.
In 2009, more than 17 000 people applied for asylum in Norway, a 19 per cent increase. Denmark has doubled the number of asy-lum seekers in 2009 and Finland had an increase of 48 per cent.
Granted asylumThe number of persons who have been granted asylum in the Nordic countries has been increasing in the recent years. Denmark had a slight decline in granted asylum by 6 per cent. Finland and Norway granted respectively 1 373 and 4 508 per-sons asylum in 2009.
AsylansökningarEtt sätt att räkna antalet utlänningar som vill bosätta sig i de nordiska länderna är att utgå ifrån antalet asylansökningar. De asylsökande har kommit in i landet men har ännu inte blivit be viljade uppehållstillstånd. Av den anledningen finns de inte med i den vanliga befolkningsstatistiken, vilken endast omfattar personer som är registrerade i befolkningsregistret.
Antalet asylsökande ökade i alla nordiska länder under 1990-talet – utom i Sve rige, där det fanns ett mycket stort antal sökande under 1990–1992.
Under 2009 sökte mer än 17 000 personer asyl i Norge, en ökning på 19 procent. Danmark har fördubblat antalet asylsö-kande 2009 och Finland hade en ökning på 48 procent.
Beviljade asylAntalet personer som har beviljats asyl i de nordiska länderna har ökat under de senaste åren. I Danmark minskade dock anta-let beviljade asyl med 6 procent. Finland och Norge beviljade 1 373 respektive 4 508 personer asyl under 2009.
Environment and energy · 22 Miljö och energi
Opdateret: 25/9-10 Overført: Kontrolleret: Kontrolleret: Asylum requests and granted Table 2.10 Asylansökningar och beviljade asyl
Denmark Finland Iceland Norway Sweden
Persons requested asylum Personer ansökt om asyl
1990 5 292 2 743 4 .. 29 420 19902000 10 347 3 170 25 10 843 16 303 20002005 1 283 3 574 87 5 402 17 530 20052008 951 4 035 73 14 431 24 353 20082009 2 022 5 988 34 17 226 .. 2009
Persons granted asylum Personer beviljade asyl
1990 .. 157 .. .. .. 19902000 5 156 458 .. .. 7 221 20002005 1 147 597 .. .. 5 358 20052008 1 453 785 3 3 051 8 276 20082009 1 376 1 373 10 4 508 .. 2009
Migr04 Source: National statistical institutes, Icelandic Directorate of Immigration and Finnish Immigration Service. Note: Asylum seekers may live in a given country for several years before their case is determined, they are not counted as part of the population before asylum is granted. Not: De asylsökande kan bo i ett visst land under flera år innan deras ärende avgörs. De räknas dock inte som en del av befolkningen före asyl beviljas.

48 Population · Befolkning
Asylum requests by citizenship. 2009 Table 2.11 Asylansökningar efter medborgarskap
Denmark Finland Iceland Norway Sweden
Persons Personer
Total 2 022 5 988 34 17 226 24 353 TotaltEEA 5 7 - 83 36 EESBulgaria 6 739 - 13 12 BulgarienRomania 11 54 - 6 14 RumänienRussia 114 602 - 867 933 RysslandBelarus 2 95 - 10 361 VitrysslandUkraine 4 7 - 27 60 UkrainaTurkey 14 140 1 82 254 TurkietOther Europe 209 392 4 421 2 424 Övriga EuropaAmerica, total 12 10 1 36 273 Amerika, totaltSomalia 66 1 180 1 1 901 3 361 SomaliaOther Africa 170 610 12 5 068 2 892 Övriga AfrikaAfghanistan 514 461 2 3 871 784 AfghanistanIraq 153 1 195 3 1 214 6 083 IrakIran 280 162 6 574 799 IranOther Asia O
417 275 4 1 773 4 560 Övriga Asienceania - - - - - Oceanien
Unknown and stateless 45 59 - 1 280 1 507 Okänt land och statslösa Migr04
Source: National statistical institutes, Icelandic Directorate of Immigration and Finnish Immigration Service. Note: Sweden: 2008 data. EEA: European Economic Area. Consists of the 27 members of the European Union, Norway, Iceland and Lichtenstein. Bulgarian and Romanian figures are not included in figures for EEA. Not: Sverige: 2008 års uppgifter. EES: Europeiska ekonomiska samarbetsområdet. Det består av de 27 medlemsländerna i den Europeiska unionen, Norge, Island och Liechtenstein. Data från Bulgarien och Rumänien är inte inkluderade i EES.
Opdateret: 25/9-10 Overført: Kontrolleret: Kontrolleret:
Asylum requests by citizenship. 2009
Asylansökningar efter medborgarskap
Denmark Finland Iceland Norway
Total 2 022 5 988 34 17 226 EEA 5 7 .. 83 Bulgaria 6 739 .. 13 Romania 11 54 .. 6 Russia 114 602 .. 867 Belarus 2 95 10
Environment and energy · 23 Miljö och energi
Did you know that ... Finland granted asylum to 1 373 persons in 2009, of which 40 per cent came from Somalia and 36 per cent from Iraq.
Visste du att ... Finland beviljade asyl till 1 373 personer under 2009, varav 40 procent kom från Somalia och 36 procent från Irak.
Foto: ImageSelect

49Population · Befolkning
Unaccompanied childrenAn unaccompanied child is defined as a person under the age of 18 years, who enters the country without parents or other people responsible for the child. Children who are abandoned when in the country are also treated as unaccompanied.
In recent years more and more children have come to the Nordic countries alone. From 2008 to 2009 the number of unaccom-panied children has increased by 50 per cent to 5 839 children. Norway and Sweden recieved the most children – 2 500 and 2 250 children. In 2009, Denmark recieved 75 percent more children than in 2008, Norway recieved 82 per cent more.Finland is the only country which had a decrease in recieving unaccompanied children from 2008 to 2009 by 21 per cent.
The majority of the children who come to the Nordic countries are in the age-group 15–17 years and make up 4 628 children or 79 per cent of all unaccompanied children in 2009. This is an increase of 48 per cent from 2008 to 2009.
Opdateret: 25/9-10 Overført: Kontrolleret: Kontrolleret: Unaccompanied children. 2009 Table 2.12 Ensamkommande barn
Denmark Finland Iceland Norway Sweden Nordic total
Persons Personer
Total 529 560 - 2 500 2 250 5 839 Totalt0–11 years old 5 16 - 25 124 170 0–11-åriga12–14 years old 56 55 - 161 383 658 12–14-åriga15–17 years old 461 408 - 2 017 1 743 4 628 15–17-årigaUnknown 7 81 - 297 - 383 Okänd
Migr05 Source: The Danish Immigration Service, Icelandic Directorate of Immigration, Finnish Immigration Service, The Norwegian Directorate of Immigration and The Swedish Migration Board.
Unaccompanied children. 2009Asylansökningar efter medborgarskap
Denmark Finland
Total 529 5600–11 years old 5 1612–14 years old 59 5515–17 years old 460 408Unknown 5 81
Migr05 Source: National statistical institutes, Icelandic Directorate of Immigration and Finnish Immigration Service.
Environment and energy · 24 Miljö och energi
Opdateret: 26/7-10; LLH Kontrolleret:
Unaccompanied children by age group. 2009 Figure 2.8 Ensamkommande barn efter åldersgrupp
3%11%
7%
79%
0-11 years old - 3 %
12-14 years old - 11 %
15-17 years old - 79 %
Unknown - 7 %
Migr05
Source: The Danish Immigration Service, Icelandic Directorate of Immigration, Finnish Immi- gration Service, The Norwegian Directorate of Immigration and The Swedish Migration Board.
Environment and energy · Miljö och energi 22
Ensamkommande barnEtt ensamkommande barn definieras som en person under 18 år, som reser in i landet utan föräldrar eller andra personer som ansvarar för barnet. Barn som överges i landet behandlas också som ensamkommande.
På senare år har fler och fler barn kommit till Norden ensamma. Från 2008 till 2009 har antalet ensamkommande barn ökat med 50 procent till 5 839 barn. Norge och Sverige fick flest barn - 2 500 respektive 2 250 barn. Under 2009 fick Danmark 75 pro-cent mer barn än under 2008, medan Norge fick 82 procent mer.Finland är det enda land som har haft en minskning i antalet ensamkommande barn från 2008 till 2009, en minskning på 21 procent.
Majoriteten av de barn som kommer till de nordiska länderna är 15–17 år gamla och utgör 4 628 barn eller 79 procent av alla ensamkommande barn under 2009. Det är en ökning på 48 pro-cent från 2008 till 2009.

50 Population · Befolkning
ValPå Färöarna är människorna mest angelägna vid valurnorna och andelen röstande är 90 procent. Väljarna på Åland och i Finland är de minst angelägna, och valdeltagandet är runt 65 procent i dessa länder.
Det är fortfarande fler män än kvinnor som väljs in till de na-tionella parlamenten. Den största skillnaden mellan könen ses på Färöarna, medan svenska män och kvinnor har nästan lika stor representation i nationalförsamlingen.
Opdateret: 25/9-10; Kontrolleret:
Valid votes at the last two national elections Figure 2.9 Giltiga röster vid de två senaste nationella valen
0
10
20
30
40
50
60
70
80
90
100
Denmark Faroe Is. Greenland Finland Åland Iceland Norway Sweden
Previous election Latest election
Percentage of electorates
Ele01
Source: National statistical institutes.
Valid votes at the last two national elections Figure 2.8 Giltiga röster vid de två senaste nationella valen
Miljö och energi 23
100Percentage of electorates
Environment and energy ·
ElectionsIn the Faroe Islands, people are the most eager at the ballot box, as the percentage of electorates is about 90 per cent. Voters in Åland and Finland are the least eager, which is reflected in the percentage of electorates, which is around 65 per cent.
Men are more often elected to the national assembly compared to women. The biggest bias between the two sexes is seen in the Faroe Islands, while in Sweden, men and women are almost equally represented in the national assembly.
Foto: ImageSelect
Opdateret: 25/9-10; Kontrolleret:
Miljö och energi 24
Candidates elected to national parliaments, latest election Figure 2.10 Invalda ledamöter till de nationella parlamenten vid senaste valet
0
10
20
30
40
50
60
70
80
90
100
Denmark Faroe Is. Greenland Finland Åland Iceland Norway Sweden
Men Women
Percentage men and women
Ele03
Source: National statistical institutes.
Environment and energy ·

51Science and technology · Vetenskap och teknologi
Science and technologyVetenskap och teknologi
Research and development (R&D) comprises creative work undertaken on a systematic basis in order to increase the stock of knowledge, including knowledge of man, culture and society, and the use of this stock of knowledge to devise new applications. The purpose of statistics on R&D is to estimate resources devoted to this activity in all sectors – in particular, science and industry.
New communication tech nologies (ICT) started to enter into people’s everyday life in the latter part of the 1990s. Mobile phones, computers and the Internet opened up new channels of communication. In several studies it has been shown that the Nordic countries have been in the forefront of the ICT penetration and use. Almost everybody have now access to the Internet – both enterprises and households.
In this chapter you can find information on areas such as
• Research and development • ICT
More detailed information on the two subjects and longer time series are available in the Nordic database, more specifically under science and technology.
Forskning och utveckling (FoU) omfattar skapande arbete som bedrivs på ett systematiskt sätt för att höja den totala kun-skapsnivån, bland annat kunskap om människan, kulturen och samhället, samt användning av dessa kunskaper till nya tillämpningar. Syftet med statistik över forskning och utveck-ling (FoU) är att uppskatta de resurser som avsätts till dessa aktiviteter i alla sektorer, i synnerhet vetenskap och industri.
I den senare delen av 1990-talet började ny kommunika-tionsteknik träda in i människors vardagsliv. Mobiltelefoner, datorer och Internet öppnade nya kanaler för kommunikation. I flera studier har man visat att de nordiska länderna har varit ledande i användning av IKT. Nästan alla har nu tillgång till Internet – både företag och hushåll.
I detta kapitel finner du information om områden som
• Forskning och utveckling • IKT
Mer detaljerad information om båda ämnen och längre tidsse-rier finns tillgängliga i den nordiska databasen, mer specifikt inom vetenskap och teknologi.
Foto: ImageSelect

52 Science and technology · Vetenskap och teknologi
Research and development In relative terms, the Nordic countries spend more resources on R&D than other West European countries. The 15 countries in EU-15 spend 2.0 per cent of their gross domestic product (GDP) on research and development, while Finland spends 3.9 per cent, Sweden 3.8 per cent and Iceland as well as Denmark 2.7 per cent. The comparison above is based on the latest available figures for the respective countries.
Only Norway is below the EU-15 average with 1.6 per cent of GDP. On the other hand, Norway’s GDP is extraordinarily high due to the country’s oil and gas revenue, and if the Norwegian R&D expenses are calculated as euro per person, they are higher than the R&D expenses per person in EU-15. While the R&D expenses in EU-15 have constituted an unchanged proportion of GDP since the mid-1990s, the R&D expenses of the Nordic countries have typically increased, also if calculated as percent-age of GDP.
Forskning och utveckling De nordiska länderna använder relativt sett mera resur ser på FoU än de övriga länderna i Västeuropa. De 15 länderna i EU-15 använder 2,0 procent av brutto nationalprodukten (BNP) till forskning och utveckling, medan Finland an-vänder 3,9 procent, Sverige 3,8 procent samt Island och Danmark 2,7 procent. Jämförelsen ovan är baserad på de senast tillgängliga siffrorna för respektive land.
Bara Norge ligger med sina FoU-utgifter på 1,6 procent av BNP under EU-15-genomsnittet. Å andra sidan är Norges BNP tack vare landets olje- och gasintäkter ovanligt hög, och mäter man i stället de norska FoU-utgifterna i euro per capita, är de högre än FoU-utgifterna per capita i EU-15. Medan FoU-utgifterna i länderna i EU-15 sedan mitten av 90-talet har legat på en oförändrad andel av BNP, har FoU-utgifterna i de nordiska länderna i allmänhet ökat, också som andel av BNP.
20 Environment and energy · Miljö och energi
Opdateret: 16. august 2010 Kontrolleret:
Total R&D expenditure Table 3.1 Totala FoU-utgifter
2005 2006 2007 2008 2009
Per cent of GDP Procent av BNP
Denmark 2.46 2.48 2.55 2.72 .. DanmarkFinland Finland3.48 3.48 3.48 3.73 3.91 Iceland Island2.77 2.99 2.70 2.65 .. Norway Norge1.52 1.52 1.65 1.62 .. Sweden Sverige3.60 3.74 3.61 3.75 .. EU-15 EU-151.89 1.92 1.93 1.99 ..
Rede01 Source: Eurostat.
Did you know that … 15 per cent of Norway’s cen-tral government R&D expenses are allocated to health. This is much more than in the other Nordic countries.
Visste du att … av Norges statliga utgifter till FoU går 15 procent till hälsa. Det är betydligt mer än i de övriga nordiska länderna.
Foto: ImageSelect

53Science and technology · Vetenskap och teknologi
Focus on climate, energy and the environmentIn 2008, the Nordic Council of Ministers launched a Nordic top class research initiative in climate, energy and the environ-ment. This top class research initiative is currently the largest single research and innovative initiative within the Council of Ministers.
The top class research initiative is a contribution from the Nordic countries to solve the global climate crisis, and at the same time strengthen the Nordic region within research and innovation. The initiatives will focus on the areas of climate and energy research, where the Nordic countries have common interests, and the Nordic countries can contribute with solu-tions internationally.
Klimat, energi och miljö i fokusUnder 2008 igångsatte Nordiska ministerrådet ett nordiskt toppforskningsinitiativ inom klimat, energi och miljö. Topp-forskningsinitiativet är i dag den största enskilda forskningen och det mest nyskapande initiativet inom Nordiska minister-rådet.
Genom toppforskningsinitiativet bidrar de nordiska län-derna till att försöka lösa den globala klimatkrisen och samtidigt stärks Norden som region för forskning och innovationer. Satsningen ska fokusera på de områden inom klimat- och energiforskning där de nordiska länderna har gemensamma intressen och där Norden kan bidra med lösningar internationellt.
Opdateret: Kontrolleret: Government budget appropriations or outlays on R&D by objectives. 2009 Table 3.2 Statlig FoU-finansiering efter ändamål
Denmark Finland Iceland Norway Sweden EU-15
Million euro (PPP) Milj. euro (PPP)
Total 1 512.7 1 554.1 81.6 1 885.0 2 388.3 81 301.8 Totalt
Per cent Procent
Total 100.0 100.0 100.0 100.0 100.0 100.0 TotaltExploration and exploitation of the earth 0.5 1.2 .. 1.9 0.6 1.7 Utforskning och exploatering av jordenEnvironment 2.6 1.5 0.4 2.4 1.8 2.9 MiljönExploration and exploitation of space 1.9 1.6 .. 2.3 0.7 4.5 Utforskning och exploatering av rymdenTransport, telecommunication and other infrastructures
0.8 2.2 3.4 2.5 5.8 3.0
Transport, telekommunikation och annan infrastruktur
Energy 3.1 7.9 2.4 3.4 4.2 3.8 EnergiIndustrial production and technology 9.1 24.5 1.3 7.2 4.3 10.4 Industriell produktion och teknologiHealth 7.6 5.8 8.2 14.9 1.0 8.8 HälsaAgriculture 3.4 5.3 17.8 7.4 1.5 3.8 JordbrukEducation 2.9 0.4 .. 0.7 0.5 1.2 UtbildningCulture, recreation, religion and mass media
1.6 0.6 .. 0.8 0.2 1.1
Kultur, rekreation, religion och massmedia
Political and social systems, structures and processes
2.6 4.3 53.7 5.0 2.1 2.7
Politiska och sociala system, strukturer och processer
General research financed from GUF1)
44.3 25.8 12.8 34.2 61.7 13.4
Allmän vetenskaplig forskning finansierad via universitetsmedel
General research financed from other sources than GUF1)
19.0 17.1 .. 12.6 6.0 13.4
Annan civil forskning finansierad genom andra källor än universitetsmedel
Defence 0.5 1.8 .. 4.7 8.4 11.8 Försvar
Government budget ap-propriations
Rede11 Source: Eurostat. Note: 1) GUF: General university funding. EU-15: 2008-data. Not: 1) GUF: General university funding.EU-15: 2008 års uppgifter.
Opdateret: 16/8-2010
Environment and energy · 21 Miljö och energi

54 Science and technology · Vetenskap och teknologi
Research and development expensesThe R&D-expenses are calculated as euro in purchasing power parities (PPP) per person, which eliminate the impact of price dif-ferencies among the Nordic countries. Sweden and Finland are in the lead with more than 1 000 euro (PPP) per person. The Nordic countries spend more on R&D per person compared to the aver-age spent in Western Europe. The major part of the R&D expenses is paid by private business, from 54 per cent of all R&D expenses in Norway to 74 per cent in Sweden and Finland. The rest of the R&D activities take place at uni ver sities and other institutions of higher education as well as in other public institutions.
FoU-utgifterMan räknar här FoU-utgifterna i euro i köpkraftsparitet (PPP), vilket eliminerar effekten av skillnader i prisnivå i de nordiska länderna. Sverige och Finland är först med mer än 1 000 euro (PPP) per person. Alla nordiska länder spenderar mer på FoU än de övriga västeuropeiska länderna. Det privata näringslivet står för den största delen av FoU-ut gifterna, från 54 procent av samt-liga FoU-utgifter i Norge till 74 procent i Sverige och Finland. Övriga FoU-aktivi teter äger rum på universiteten och andra högre läroanstalter samt i offentlig regi i övrigt.
Opdateret: Kontrolleret:
Environment and energy · Miljö och energi 20
R&D expenditure. 2008 Figure 3.1FoU-utgifter
0
200
400
600
800
1 000
1 200
Denmark Finland Iceland Norway Sweden EU-15
Total Business and enterprise sector Government Higher education
Euro PPP per person
Rede01 Source: Eurostat.
Foto: ImageSelect

55Science and technology · Vetenskap och teknologi
Information and communication technologyIn an international context, the Nordic countries are in the lead when it comes to using modern information and communica-tion technology. This is true of both the business sector and private individuals. In only six years – from 1995 to 2001 – total employment in the Nordic countries within the information and communication technology sector (the ICT sector) increased by more than 60 per cent to a total of almost 600 000 employees. This equals about 9 per cent of total private sector employment in the Nordic countries.
However, in 2001 the ICT sector experienced a worldwide crisis with a dramatic decline in the price of technology shares. This also led to a decrease in the number of ICT companies and in the number of persons employed in the ICT sector. Consequently, total employment in the Nordic ICT sector fell by 22 per cent from 2001 to 2003. The decrease was especially severe in the wholesale trade of ICT products. Here, employment was almost halved during these two years. Today (2006/2007 data), about 460 000 persons are employed in the overall Nordic ICT sector, and about 25 per cent of these employees are found in the manufacturing of ICT goods.
Finland and Sweden have the relatively largest ICT sector in the Nordic countries. This sector accounts for 8 per cent of total em-ployment in the private business sector, while the corresponding figure is 7 per cent in Denmark and 4–5 per cent in Norway. Fin-land and Sweden are leading in manufacturing ICT goods, while trade and service in ICT plays a relatively greater role in Denmark and Norway. In Iceland, the consultancy sector accounts for the relatively largest proportion of total ICT employment.
Informations- och kommunikationsteknologiDe nordiska länderna ligger i internationella sammanhang långt framme när det gäller användning av modern informa-tionsteknologi. Det gäller både näringslivet och privatper-soner. På endast sex år, från 1995 till 2001, ökade den totala sysselsättningen i de nordiska länderna inom informations-teknologisektorn (IKT-sektorn) med drygt 60 procent till totalt nästan 600 000 sysselsatta. Det motsvarar ca 9 procent av den sammanlagda sysselsättningen i den privata sektorn i Norden.
År 2001 inträffade emellertid en världsom fattande kris i IKT-sektorn med kraftiga kursfall på IKT-aktierna. Det ledde även till en minskning av antalet IKT-företag och antalet sysselsatta inom IKT-sektorn. Från 2001 till 2003 sjönk den totala syssel-sättningen i den nordiska IKT-sektorn således med 22 procent. Nedgången var särskilt stor inom handeln med IKT-produkter. Under dessa två år skedde nästan en halvering av sysselsätt-ningen. I dag (2006/2007 års uppgifter) är ca 460 000 syssel-satta inom hela IKT-sektorn i Norden, varav ca 25 procent arbe-tar med produktion av IKT-utrustning.
Finland och Sverige har i dag den relativt största IKT-sektorn i Norden. Den står för 8 procent av den totala sysselsättningen i det privata näringslivet, medan den i Danmark är 7 procent och i Norge 4–5 procent. Det är i synnerhet Finland och Sverige som producerar IKT-utrustning, medan handel med IKT och service kring IKT spelar en förhållandevis större roll i Danmark och Norge. På Island utgör telekommunikationssektorn den relativt största andelen av den totala IKT-sysselsättningen.
Foto: ImageSelect

56 Science and technology · Vetenskap och teknologi
Opdateret: 16/8-2010 Kontrolleret:
Employment in the ICT sector. 2008 Table 3.3 Anställda inom IKT-sektorn
Denmark Finland Iceland Norway Sweden
Persons Personer
ICT sector total 95 470 107 436 6 120 82 428 213 331 IKT-sektorn totaltManufacturing Tillverkning14 667 39 959 90 11 697 42 652Telecommunications Telekommunikation18 625 14 664 1 606 13 626 25 079Consultancy services Konsulttjänster43 325 45 533 2 692 44 706 96 662Wholesale Grossistverksamhet18 853 7 280 1 822 12 399 48 938
Private sector total Privata företag totalt1 406 915 1 346 254 .. .. 2 224 520
Per cent of private sector Procent av privata företag
ICT sector total 6.8 8.0 .. .. 9.6 IKT-sektorn totaltManufacturing Tillverkning1.0 3.0 .. .. 1.9Telecommunications Telekommunikation1.3 1.1 .. .. 1.1Consultancy services Konsulttjänster3.1 3.4 .. .. 4.3Wholesale Grossistverksamhet1.3 0.5 .. .. 2.2
Private sector total 100.0 100.0 . . Privata företag totalt100.0
Info01 Source: National statistical institutes. Note: Denmark: 2006 data. Not: Danmark: 2006 års uppgifter.
Environment and energy · 21 Miljö och energi Did you know that … the number of enterprises within telecommunication in Sweden has increased by 27 per cent from 2005 to 2008.
Visste du att … antalet företag inom telekommunikation i Sverige har ökat med 27 procent från 2005 till 2008.
Foto: ImageSelect

57Science and technology · Vetenskap och teknologi
ICT access of enterprisesToday, almost all companies in the Nordic countries have Inter-net access. In Norway, 97 per cent of all companies have Internet access, in Iceland and Finland the corresponding figure is as high as 100 per cent. Four in every five companies in the Nordic countries have broadband access. Broadband access is most prevalent within business services and least in the hotel and res-taurant sector where, however, more than half of the companies have broadband access. Approximately 80 per cent of the Nordic companies also have their own website today – in Norway 88 per cent have their own website.
Företagens tillgång till IKTNästan alla företag i Norden har i dag tillgång till Internet. I Norge har 97 procent av alla företag Internettillgång, på Island och i Finland hela 100 procent. Fyra av fem nordiska företag har tillgång till bredband. Bredbandstillgången är störst på området företagstjänster och minst inom hotell- och restaurang bran schen, där dock klart mer än hälften har tillgång till bredband. Omkring 80 procent av företagen i Norden har i dag en egen hemsida – i Norge har 88 procent av alla företag en egen hemsida.
22 Environment and energy · Miljö och energi
Enterprises with Internet and broadband access and a website Table 3.4 Företag med tillgång till Internet, bredband och med hemsida
Denmark Finland Iceland Norway Sweden
Per cent of all enterprises Procent av alla företag
Internet access 2008 2009 2008 2009 2009 Tillgång till Internet
All enterprises 98 100 100 97 95 Alla företagManufacturing 100 100 100 98 97 TillverkningConstruction 98 99 100 99 95 ByggsektornTrade 98 100 100 98 96 HandelHotels and restaurants 90 98 100 86 84 Hotell och restaurangTransport and telecom. 92 99 100 95 89 Transport och telekomBusiness services, etc. 99 100 100 98 95 Affärstjänster, etc.
Broadband access 2008 2009 2006 2009 2009 Tillgång till bredband
All enterprises 80 94 95 75 88 Alla företagManufacturing 81 96 93 85 91 TillverkningConstruction 70 91 90 75 83 ByggsektornTrade 83 95 98 65 90 HandelHotels and restaurants 74 95 89 65 72 Hotell och restaurangTransport and telecom. 71 89 98 68 84 Transport och telekomBusiness services, etc. 87 93 98 88 92 Affärstjänster, etc.
Website 2008 2009 2008 2009 2009 Hemsida
All enterprises 87 85 77 88 86 Alla företagManufacturing 90 93 78 92 91 TillverkningConstruction 83 69 53 89 82 ByggsektornTrade 87 85 82 89 89 HandelHotels and restaurants 79 83 72 68 75 Hotell och restaurangTransport and telecom. 71 74 85 87 71 Transport och telekomBusiness services, etc. 87 92 90 92 91 Affärstjänster, etc.
Info05 Source: National statistical institutes.

58 Science and technology · Vetenskap och teknologi
Opdateret: 16. august Kontrolleret:
Internet use Table 3.5 Användning av Internet
Denmark Finland Iceland Norway Sweden
Per cent of 16–74 year old pouplation
Procent av befolkningen 16–74 år
In the last 3 months Under de senaste 3 månaderna
2003 71 66 81 75 77 20032009 86 82 93 91 90 2009
At least once a week Åtminstone en gång i veckan
2003 64 58 75 66 69 20032009 82 79 90 88 86 2009
Info07 Source: Eurostat.
Internet use Table 3.5 Användning av Internet
Environment and energy · 21 Miljö och energi
Opdateret: Kontrolleret:
Access to ICT at home. 2009 Figure 3.2 Tillgång till IKT hemma
0
10
20
30
40
50
60
70
80
90
100
Denmark Finland Iceland Norway Sweden EU-15
Access to Internet Access to broadband
Per cent of households
Info06 Source: Eurostat and national statistical institutes.
Environment and energy · Miljö och energi 21
Access to the Internet and homepagesIceland is in the lead when it comes to access to ICT at home. Al-most nine out of ten have access to PC and the Internet. Finland has the poorest performance with about seven out of ten with access to PC and the Internet.
Tillgång till Internet och hemsidorIsland är i täten när det gäller tillgång till IKT i hemmen. Nästan nio av tio har tillgång till dator och Internet. Finland är sämst med omkring sju av tio som har tillgång till dator och Internet.
Internet useAmong the Nordic countries, especially the Icelandic population are frequent Internet users. 90 per cent of the Icelandic popula-tion aged 16–74 years are regular Internet users, while the least frequent users is the Finnish population.
Användning av Internet Bland de nordiska länderna är det på Island som befolkningen oftast använder Internet. 90 procent av den isländska befolk-ningen mellan 16 och 74 år använder Internet regel bundet, medan det i Finland är 79 procent.
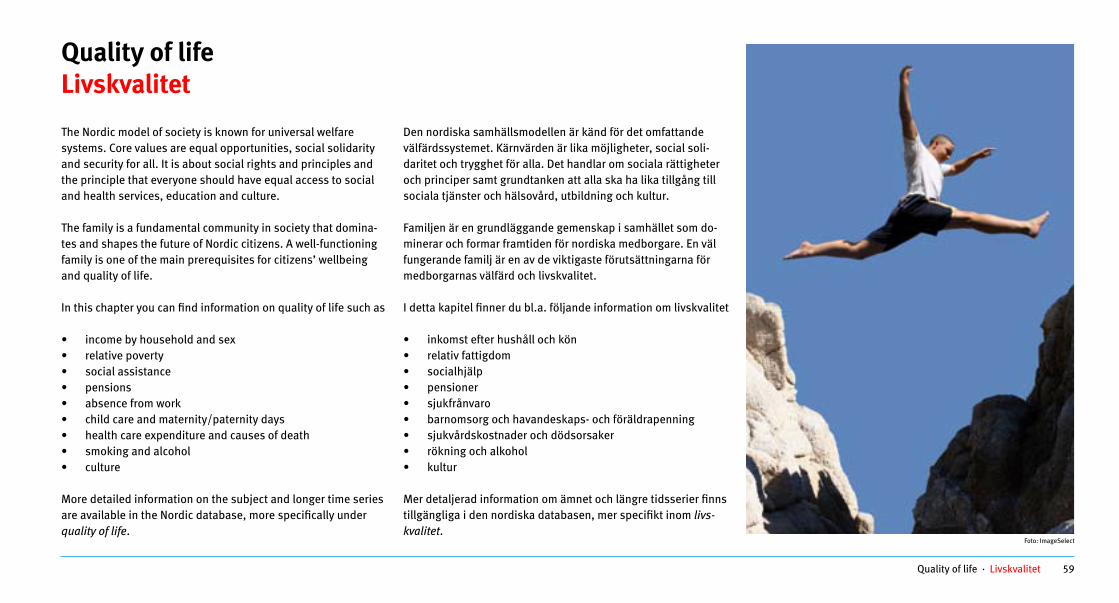
59Quality of life · Livskvalitet
Quality of lifeLivskvalitet
The Nordic model of society is known for universal welfare systems. Core values are equal opportunities, social solidarity and security for all. It is about social rights and principles and the principle that everyone should have equal access to social and health services, education and culture.
The family is a fundamental community in society that domina-tes and shapes the future of Nordic citizens. A well-functioning family is one of the main prerequisites for citizens’ wellbeing and quality of life.
In this chapter you can find information on quality of life such as
• income by household and sex• relative poverty• social assistance• pensions• absence from work• child care and maternity/paternity days• health care expenditure and causes of death• smoking and alcohol• culture
More detailed information on the subject and longer time series are available in the Nordic database, more specifically under quality of life.
Den nordiska samhällsmodellen är känd för det omfattande välfärdssystemet. Kärnvärden är lika möjligheter, social soli-daritet och trygghet för alla. Det handlar om sociala rättigheter och principer samt grundtanken att alla ska ha lika tillgång till sociala tjänster och hälsovård, utbildning och kultur.
Familjen är en grundläggande gemenskap i samhället som do-minerar och formar framtiden för nordiska medborgare. En väl fungerande familj är en av de viktigaste förutsättningarna för medborgarnas välfärd och livskvalitet.
I detta kapitel finner du bl.a. följande information om livskvalitet
• inkomst efter hushåll och kön • relativ fattigdom• socialhjälp• pensioner • sjukfrånvaro• barnomsorg och havandeskaps- och föräldrapenning• sjukvårdskostnader och dödsorsaker• rökning och alkohol• kultur
Mer detaljerad information om ämnet och längre tidsserier finns tillgängliga i den nordiska databasen, mer specifikt inom livs-kvalitet.
Foto: ImageSelect

60 Quality of life · Livskvalitet
IncomeThe Nordic countries differentiate themselves from other coun-tries by combining high standards of living and a relative even distribution of income. However, the financing of the Nordic welfare model entails a heavy tax burden and a major redis-tribution of income, compared to most other countries in the world. The level of income is generally high and differences in the income level relatively small in the Nordic countries com-pared to other OECD countries. Generally, households with the lowest disposable incomes also receive the largest proportion of social benefits in relation to their gross income.
InkomstDe nordiska länderna skiljer sig från andra länder genom att kombinera högt välstånd och en relativt smidig inkomst-fördelning. Men finan sieringen av den nordiska välfärds-modellen medför en tung skattebörda och en väsentlig om-fördelning av inkomsten jämfört med de flesta andra länder i världen. In komstnivån är allmänt sett hög och skillnaderna i inkomstnivå relativt små i de nordiska länderna jämfört med andra OECD-länder. I allmänhet tar hushållen med den lägsta disponibla inkomsten också emot störst andel sociala förmå-ner i relation till sin bruttoinkomst.
Environment and energy · 20 Miljö och energi
Opdateret: 21/7-10 Kontrolleret:
Average equivalised disposable income per household. 2008 Figure 4.1 Genomsnittlig ekvivalerad disponibel inkomst per hushåll
0
5 000
10 000
15 000
20 000
25 000
30 000
35 000
Denmark Finland Iceland Norway Sweden
One adult younger than 64 Couples younger than 64 One adult older than 65 Couples, at least one aged 65 years and over
PPP/euro
Eurostat currency is converted from national currency to euro in Purchasing Power Parities (PPP), which eliminates the impact of differences in price levels among the Nordic countries.
Equivalised disposable income is defined as the household's total disposable income divided by its "equivalent size", to take account of the size and composition of the household, and is attributed to each household member.
Den nationella valutan är konverterad till euro i köpkraftsparitet, vilket eliminerar effekten av skillnader i prisnivå i de nordiska länderna. Ekvivalerad disponibel inkomst definieras som shållets totala disponibla inkomst dividerat med dess "ekvivalenta storlek", för att ta hänsyn till hushållets storlek och sammansättning, och tilldelas varje hushållsmedlem.
Inco02 Source:
TheNote:
Not:hu

61Quality of life · Livskvalitet
Income by sexThe Nordic countries play a leading part with regard to equality of the sexes. This can be ascertained by looking at women’s ac-cess to education, health, political power and economic partici-pation/equal pay. However, there are still differences in the pay for performing a job by men and women respectively.
The greatest difference between men’s and women’s pay is seen in Norway, while the greatest equality of the sexes is accounted for by Iceland, if equivalised disposable income is applied as measurement.
Inkomst efter kön De nordiska länderna spelar en ledande roll när det gäller jäm-ställdhet mellan könen. Detta kan konstateras genom att titta på kvinnors tillgång till utbildning, hälsa, politisk makt och ekono-miskt deltagande/lika lön. Men det finns fortfarande skillnader i mäns respektive kvinnors lön för samma arbete. Mätt i ekvivalerad disponibel inkomst ses den största skill naden mellan mäns och kvinnors löner i Norge, medan Island har den största jämställdheten.
Environment and energy · Miljö och energi 20
Opdateret: 21/7-10 Kontrolleret:
Average equivalised disposable income by sex. 2008 Figure 4.2Genomsnittlig ekvivalerad disponibel inkomst efter kön
0
5 000
10 000
15 000
20 000
25 000
30 000
Denmark Finland Iceland Norway Sweden
Total Men Women
PPP/euro
Inco03 urce: Eurostat.
Note: The currency is converted from national currency to euro in Purchasing Power Parities (PPP), which eliminates the impact of differences in price levels among the Nordic countries. Not: Den nationella valutan är konverterad till euro i köpkraftsparitet, vilket eliminerar effekten av skillnader i prisnivå i de nordiska länderna.
So
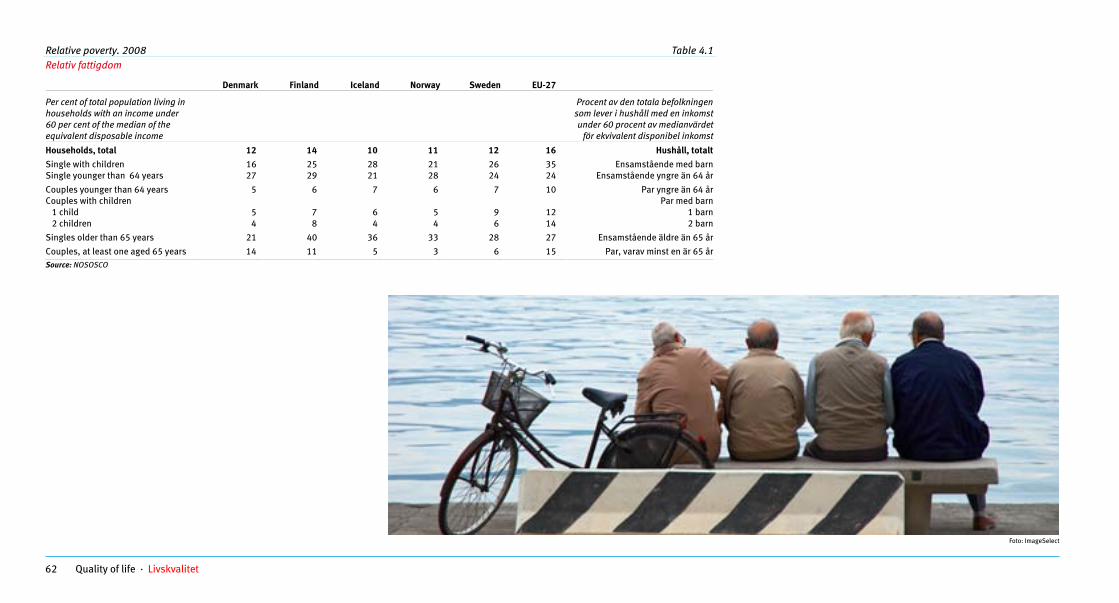
62 Quality of life · Livskvalitet
Environment and energy · 20 Miljö och energi
Opdateret: 9/9-10 Kontrolleret: Relative poverty. 2008 Table 4.1 Relativ fattigdom
Denmark Finland Iceland Norway Sweden EU-27
Per cent of total population living in households with an income under 60 per cent of the median of the equivalent disposable income
Procent av den totala befolkningen som lever i hushåll med en inkomst under 60 procent av medianvärdet
för ekvivalent disponibel inkomst
Households, total 12 14 10 11 12 16 Hushåll, totaltSingle with children 16 25 28 21 26 35 Ensamstående med barnSingle younger than 64 years 27 29 21 28 24 24 Ensamstående yngre än 64 årCouples younger than 64 years 5 6 7 6 7 10 64 år
5 7 6 5 9 12 1 barnildren 4 8 4 4 6 14 2 barn
years 14 11 5 3 6 15 r 65 år
Par yngre än Couples with children
1 child Par med barn
2 ch Singles older than 65 years 21 40 36 33 28 27 Ensamstående äldre än 65 årCouples, at least one aged 65 Par, varav minst en ä Source: NOSOSCO
Foto: ImageSelect
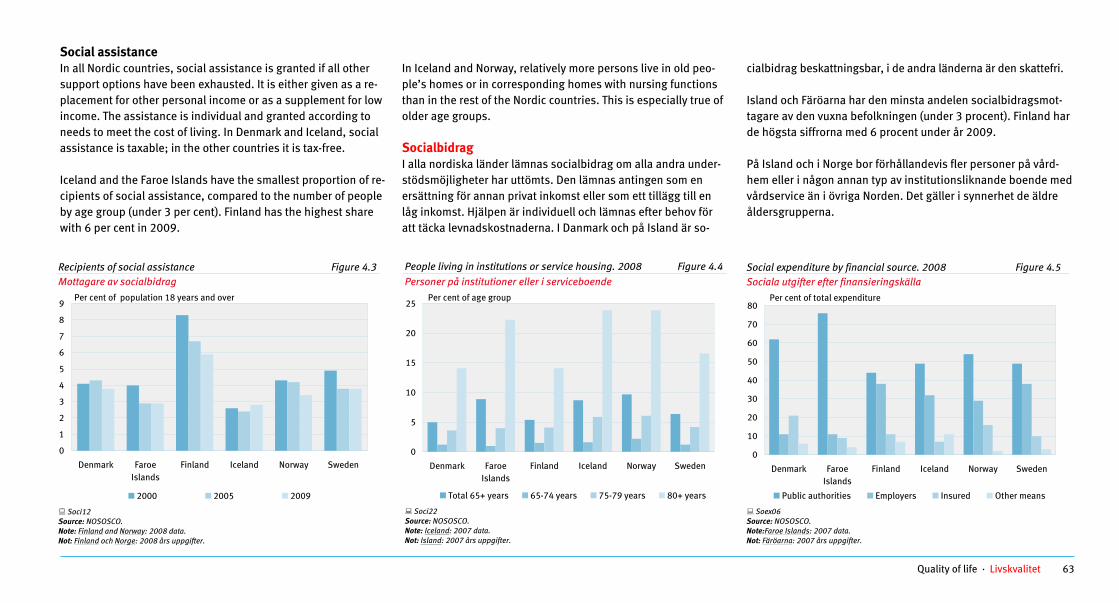
63Quality of life · Livskvalitet
Social assistanceIn all Nordic countries, social assistance is granted if all other support options have been exhausted. It is either given as a re-placement for other personal income or as a supplement for low income. The assistance is individual and granted accor ding to needs to meet the cost of living. In Denmark and Iceland, so cial assistance is taxable; in the other countries it is tax-free.
Iceland and the Faroe Islands have the smallest proportion of re-cipients of social as sistance, compared to the number of people by age group (under 3 per cent). Finland has the highest share with 6 per cent in 2009.
In Iceland and Norway, relatively more persons live in old peo-ple’s homes or in corresponding homes with nursing functions than in the rest of the Nordic countries. This is especially true of older age groups.
SocialbidragI alla nordiska länder lämnas socialbidrag om alla andra under-stödsmöjligheter har uttömts. Den lämnas antingen som en ersättning för annan privat inkomst eller som ett tillägg till en låg inkomst. Hjälpen är individuell och lämnas efter behov för att täcka levnadskostnaderna. I Danmark och på Island är so-
cialbidrag beskattningsbar, i de andra länderna är den skatte fri.
Island och Färöarna har den minsta andelen socialbidragsmot-taga re av den vuxna befolkningen (under 3 procent). Finland har de högsta siffrorna med 6 procent under år 2009.
På Island och i Norge bor förhållandevis fler personer på vård-hem eller i någon annan typ av institutionsliknande boende med vårdservice än i övriga Norden. Det gäller i synnerhet de äldre åldersgrupperna.
Opdateret
Recipients of social assistance Figure 4.3
Environment and energy · 20 Miljö och energi
: 7/9-10 Mottagare av socialbidrag
Kontrolleret:
0
1
2
3
4
5
6
7
8
9
Denmark FaroeIslands
Finland Iceland Norway Sweden
2000 2005 2009
Per cent of population 18 years and over
Soci12 urce: NOSOSCO.
Note:
So
Finland and Norway: 2008 data. Not: Finland och Norge: 2008 års uppgifter.
Opdateret: 7/9-10 Kontrolleret:
Environment and energy · 20 Miljö och energi
People living in institutions or service housing. 2008 Figure 4.4 Personer på institutioner eller i serviceboende
0
5
10
15
20
25
Denmark FaroeIslands
Finland Iceland Norway Sweden
Total 65+ years 65-74 years 75-79 years 80+ years
Per cent of age group
Soci22
NOSOSCO.
Source:Note: Iceland: 2007 data. Not: Island: 2007 års uppg ifter.
People livor sFiguPer
ing in institutions ervice housing. 2008 re 4.4
soner på institutioner eller i serviceboende
Per cent of age group
20
25
Opdateret: 7/9-10
Figure 4.5
Environment and energy · 20 Miljö och energi
Kontrolleret:
Social expenditure by financial source. 2008 Sociala utgifter efter finansieringskälla
0
10
Denmark FaroeIslands
Finland Iceland Norway Sweden
20
30
40
50
60
70
80
Public authorities Employers Insured Other means
Soex06 urce: NOSOSCO.
Note:Faroe Islands
Per cent of total expenditure
So: 2007 data.
Not: Färöarna: 2007 års uppgifter.
Social expenditure by financial source. 2008 Figure 4.5
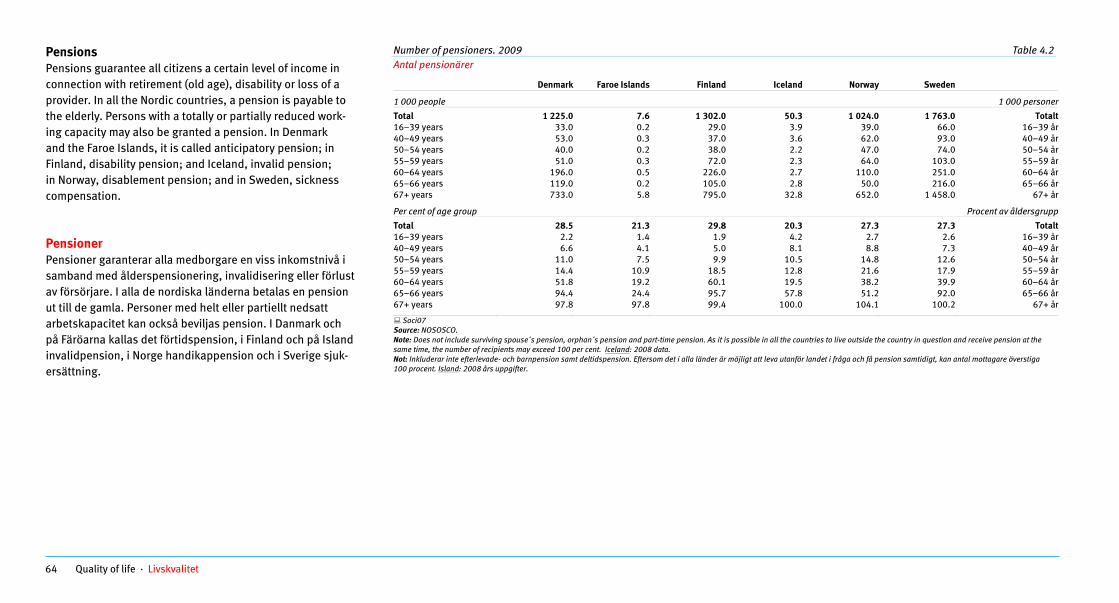
64 Quality of life · Livskvalitet
PensionsPensions guarantee all citizens a certain level of income in connection with retirement (old age), disability or loss of a pro vider. In all the Nordic countries, a pension is payable to the elderly. Persons with a totally or partially reduced work-ing capacity may also be granted a pension. In Denmark and the Faroe Islands, it is called anticipatory pension; in Finland, disability pension; and Iceland, invalid pension; in Norway, disablement pension; and in Sweden, sickness compensation.
PensionerPensioner garanterar alla medborgare en viss inkomstnivå i samband med ålderspensionering, invalidisering eller förlust av försörjare. I alla de nordiska länderna betalas en pension ut till de gamla. Personer med helt eller partiellt nedsatt arbets kapacitet kan också beviljas pension. I Danmark och på Färöarna kallas det förtidspension, i Finland och på Island invalidpension, i Norge handikappension och i Sverige sjuk-ersättning.
Opdateret: 07/9-10 Kontrolleret:
Number of pensioners. 2009 Table 4.2Antal pensionärer
Denmark Faroe Islands Finland Iceland Norway Sweden
1 000 people 1 000 personer
Total 1 225.0 7.6 1 302.0 50.3 1 024.0 1 763.0 Totalt16–39 years 33.0 0.2 29.0 3.9 39.0 66.0 16–39 år40–49 years 53.0 0.3 37.0 3.6 62.0 93.0 40–49 år50–54 years 40.0 0.2 38.0 2.2 47.0 74.0 50–54 år55–59 years 51.0 0.3 72.0 2.3 64.0 103.0 55–59 år60–64 years 196.0 0.5 226.0 2.7 110.0 251.0 60–64 år65–66 years 119.0 0.2 105.0 2.8 50.0 216.0 65–66 år67+ years 733.0 5.8 795.0 32.8 652.0 1 458.0 67+ år
Per cent of age group Procent av åldersgrup p
Total 28.5 21.3 29.8 20.3 27.3 27.3 Totalt16–39 years 2.2 1.4 1.9 4.2 2.7 2.6 16–39 år40–49 years 6.6 4.1 5.0 8.1 8.8 7.3 40–49 år50–54 years 11.0 7.5 9.9 10.5 14.8 12.6 50–54 år55–59 years 14.4 10.9 18.5 12.8 21.6 17.9 55–59 år60–64 years 51.8 19.2 60.1 19.5 38.2 39.9 60–64 år65–66 years 94.4 24.4 95.7 57.8 51.2 92.0 65–66 år67+ years 97.8 97.8 99.4 100.0 104.1 100.2 67+ år
Soci07 Source: NOSOSCO.
: Does not include surviving spouse´s pension, orphan´s pension and part-time pension. As it is possible in all the countries to live outside the country in question and receive pension at the same time, the number of recipients may exceed 100 per cent. Note
Iceland: 2008 data. Not: Inkluderar inte efterlevade- och barnpension samt deltidspension. Eftersom det i alla länder är möjligt att leva utanför landet i fråga och få pension samtidigt, kan antal mottagare överstiga 100 procent. Island: 2008 års uppgifter.
Environment and energy · Miljö och energi 21

65Quality of life · Livskvalitet
Absence from work due to sicknessIn principle, everyone with gainful employment is entitled to daily cash benefits in the event of sickness. The structures vary considerably from country to country. In Denmark and Iceland, the majority of people are entitled to full salary during illness. In Denmark, this only includes people employed in the public sec-tor and some private sector employees. Benefits paid in connec-tion with illness are taxable in all countries.
Absence from the workplace due to sickness for more than one week is markedly higher in Norway and Sweden, compared with the other Nordic countries. Denmark has the lowest absence due to sickness in 2009 (Iceland has no figures for 2005 and 2009). Women’s absence due to sickness is generally higher than that of men.
SjukfrånvaroI princip har alla med inkomst av anställning rätt till dagligt understöd vid sjukdom. Strukturerna varierar väsentligt från land till land. I Danmark och på Island har de flesta rätt till full lön vid sjukdom. I Danmark gäller detta endast personer som är anställda inom den offentliga sektorn och vissa anställda i den privata sektorn. Förmåner som betalas ut i samband med sjuk-dom beskattas i alla länder.
Sjukfrånvaro som varar mer än en vecka är mycket vanligare i Norge och Sverige än i de andra nordiska länderna. För 2009 finner man den lägsta sjukfrånvaron i Danmark (siffror från Is-land fôr 2005 och 2009 saknas). I samtliga länder är kvinnornas sjukfrånvaro högre än männens.
Opdateret: 7/9-10 Kontrolleret:
Absence from work for at least a week due to illness å grund av sjukdom
Figur 4.6Arbetsfrånvaro minst en vecka p Percentage of all people employed
Environment and energy · 20 Miljö och energi
By sex. 2009
0.0
0.5
1.0
1.5
2.0
2.5
3.0
3.5
4.0
4.5
5.0
Denmark Finland Iceland Norway Sweden
1990 1995 2000 2005 2009
Total
1.5
2.0
2.5
3.0
3.5
4.0
4.5
5.0
0.0
0.5
1.0
Denmark Finland Iceland Norway Sweden
Men Women
Soci02 urce: NOSOSCO.
Note: The figures have been calculated on the basis of labour force surveys as an average of the censuses. Denmark
So
: 15-66 years. Finland: 15-64 years. Iceland: 1990 figures refer to 1991. Most recent data are from 2000. Not: Uppgifterna har beräknats utifrån arbetskraftsundersökningar som ett genomsnitt för hela antalet. Danmark . Senaste uppgifterna är från 2000. : 15-66 år. Finland: 15-64 år. Island: 1990 års uppgifter avser 1991

66 Quality of life · Livskvalitet
Child care A characteristic feature in the Nordic countries is the high rate of women participating in the labour force. This increases the need for child care options during working hours.
Thus, most children between the ages of 3 and 5 are in institu-tions. In Sweden, 98 per cent of all children between the ages of 3 and 5 are in kindergartens or similar institutions. Finland has the lowest share of children in institutions in that age group (around 73 per cent). The percentage is generally much lower for children between 0 and 2.
BarnomsorgEtt utmärkande drag i de nordiska länderna är den höga andelen kvinnor som ingår i arbetskraften. Detta ökar behovet av barntill-synsmöjligheter under arbetstid.
De flesta barn mel lan 3 och 5 år finns således inom barnom-sorgen. I Sverige är 98 procent av alla barn mellan 3 och 5 år på förskola eller liknan de inrättningar. Finland har den lägsta andelen barn inom barn omsorgen i den åldersgruppen (omkring 73 procent). Procentandelen är generellt mycket lägre för barn mellan 0 och 2 år.
Opdateret: 27/7-10 Kontrolleret:
3–5-year-old children in day care Figure 4.73–5-åriga barn i barnomsorg
Environment and energy · 20 Miljö och energi
50
55
60
65
1991 1993 1995 1997 1999 2001 2003 2005 2007 2009
ark
Finland
Norway
Sweden
70
75
80
85
90
95
100
DenmIceland
Per cent of age group
Åland
Faroe Isl.
Chil03 and Popu02 urce: National statistical institutes and National Institute for Health and Welfare, Finland.
Note: See Table 4.3. Not: Se Table 4.3.
So
Opdateret: 27/7-10 Kontrolleret:
Children in day care. 2009 Table 4.3 Barn i barnomsorg
Denmark Faroe Islands Finland Åland Iceland Norway Sweden Nordic total
ocent iPer cent of age group
Pr åldersgruppen
0 years 15.1 18.5 0.9 0.0 7.2 4.4 0.0 4.4 0 år1 years 88.0 80.7 29.0 21.1 67.5 69.8 49.5 58.4 1 år2 years 92.4 89.6 50.3 49.7 93.8 85.8 90.9 82.3 2 år3 years 97.6 88.9 67.1 79.6 95.3 96.1 95.0 91.1 3 år4 years 97.5 96.6 73.5 90.9 95.7 97.0 97.7 92.8 4 år5 years 95.1 95.3 77.1 94.2 91.4 97.9 98.0 93.6 5 år
Chil03 Source: National statistical institutes and National Institute for Health and Welfare, Finland. Note: Includes children in publicly funded private day-care. Denmark: Care should be taken when comparing data from 2004 onwards with previous data due to new data collection. Norway: Includes children in private kindergarten. Finland: Includes Åland. Iceland: 2008 data. Nordic total: Greenland not included. Not: Inkluderar barn i offentligt finansierad barnomsorg med enskild utförare. Danmark: Uppgifterna för 2004 och framåt är inte direkt jämförbara med 2003 och tidigare, då basen för upp- gifterna är ändrad. Finland: Inkluderar Åland. Norge: Inkluderar barn i privata förskolor. Island: 2008 års uppgifter. Norden totalt: Grönland är inte inkluderat.
Children in daycare. 2008 Barn ibarnomsorg
Environment and energy · Miljö och energi 20
Foto: ImageSelect

67Quality of life · Livskvalitet
Maternity day benefitsMore and more men make use of the leave schemes in con nect ion with childbirth or adoption. However, both the number of recipients and the number of days in which maternity benefit is payable vary considerably from one country to another.
Ice land is in the lead with 34 per cent of the number of days taken by the father. In Ice land new legislation on parental leave took effect in 2001, granting fathers, like mothers, an independ ent entitlement to paternity leave for 13 weeks.
Havandeskaps- och föräldrapenningFler och fler män tar tjänstledigt i samband med sina barns fö-delse eller vid adoption. Men både antalet mot tagare och antalet dagar då havandeskaps- och föräldra pen ning tas ut varierar avsevärt från land till land.
När det gäller andel dagar uttagna av fadern ligger Island i täten med 34 procent. På Island trädde en ny lagstiftning om föräldra-ledighet i kraft 2001, vilken innebar att pappor, liksom mammor, beviljades rätt till 13 veckors föräldraledighet.
New table.
Text has been revised. New table.
Text has been revised.
Opdateret: Kontrolleret:
Maternity and paternity day benefits in the event of pregnancy, childbirth or adoption Table 4.4Havandeskaps- och föräldrapenning vid graviditet, förlossning och adoption
Denmark Finland Iceland Norway Sweden
Number of recipients Antal mottagare
Environment and energy · 20 Miljö och energi
2000 2000 Men 45 559 42 294 1 421 33 806 166 661 MänWomen 82 657 97 359 5 097 80 368 275 214 Kvinnor
2008 2008
2000 2000
Men 51 247 54 000 6 672 42 255 288 716 MänWomen 105 449 101 174 7 441 85 389 367 274 Kvinnor
Number of days (1 000s) with maternity /paternity day benefits
Antal dagar (1 000-tal) med föräldra- och havandeskapspenning
Total number of days 13 150 15 232 698 11 152 37 100 Totalt antal dagarPercentage taken by men 5.5 4.1 3.3 7.2 13.7 Procent uttagna av män
2009 2009 Total number of days 21 475 16 534 1 282 12 647 49 561 Totalt antal dagarPercentage taken by men 7.3 6.7 33.9 11.6 23.1 Procent uttagna av män
Soci04 and Soci09 urce: NOSOSCO.
Note: IcelandSo
: Number of recipients = 2009 data. Entitlement to cash benefit during maternity leave will lapse if a mother is entitled to full pay from her employer. Not: Island: Antal mottagare = 2009 års uppgifter. Rätten till föräldrapenning upphör om modern har rätt till full ersättning från sin arbetsgivare.
Did you know that ... the number of days with maternity/paternity benefits in the Nordic countries has increased by 30 per cent in the last ten years. In Iceland it has almost doubled.
Visste du att ... antalet dagar med föräldra- och havan-deskapspenning i de nordiska länderna har ökat med 30 procent under de senaste tio åren. På Island har antalet nästan fördubblats.
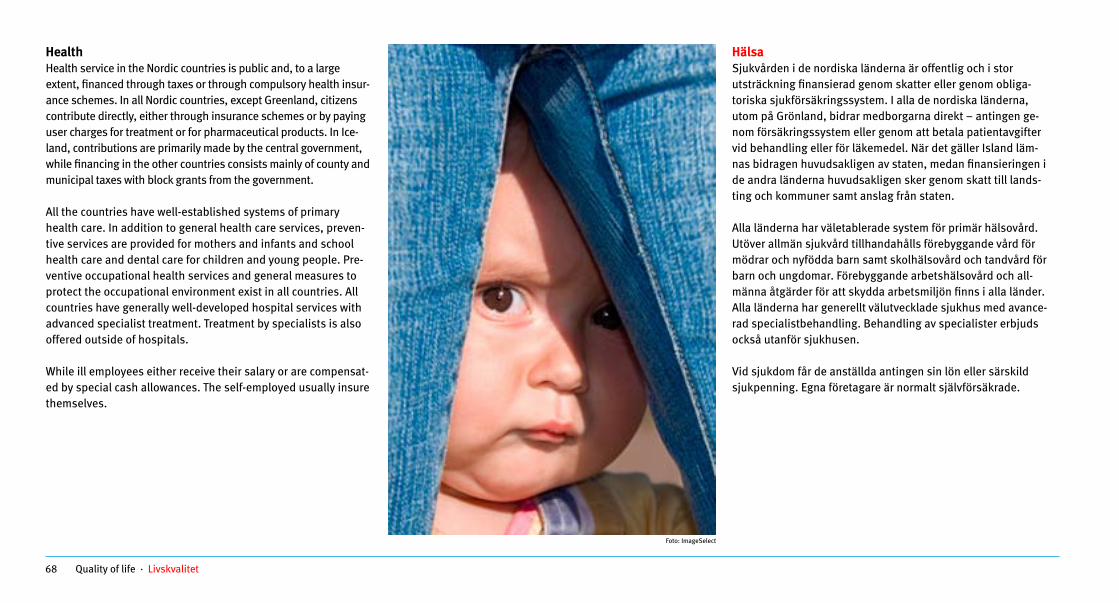
68 Quality of life · Livskvalitet
HealthHealth service in the Nordic countries is public and, to a large extent, financed through taxes or through compulsory health insur-ance schemes. In all Nordic countries, except Greenland, citizens contribute directly, either through insurance schemes or by paying user charges for treatment or for pharmaceutical products. In Ice-land, contributions are primarily made by the central government, while financing in the other countries consists mainly of county and municipal taxes with block grants from the government.
All the countries have well-established systems of primary health care. In ad dition to general health care services, preven-tive services are provided for mothers and infants and school health care and dental care for children and young people. Pre-ventive occupational health services and general measures to protect the occu pational environment exist in all countries. All countries have generally well-de veloped hospital services with advanced specialist treatment. Treatment by spe cialists is also offered outside of hospitals.
While ill employees either receive their salary or are compensat-ed by special cash allowances. The self-employed usually insure themselves.
HälsaSjukvården i de nordiska länderna är offentlig och i stor utsträckning finansie rad genom skatter eller genom obliga-toriska sjukförsäkringssystem. I alla de nord iska länderna, utom på Grönland, bidrar medborgarna direkt – antingen ge-nom för säkringssystem eller genom att betala patientavgifter vid behandling eller för läke medel. När det gäller Island läm-nas bidragen huvudsakligen av staten, medan fi nansieringen i de andra länderna huvudsakligen sker genom skatt till lands-ting och kommuner samt anslag från staten.
Alla länderna har väletablerade system för primär hälsovård. Utöver allmän sjukvård tillhandahålls förebyggande vård för mödrar och nyfödda barn samt skol hälsovård och tandvård för barn och ungdomar. Förebyggande arbetshälsovård och all-männa åtgärder för att skydda arbetsmiljön finns i alla länder. Alla länderna har generellt välutvecklade sjukhus med avance-rad specialistbehandling. Behandling av specialister erbjuds också utanför sjukhusen.
Vid sjukdom får de anställda antingen sin lön eller särskild sjukpenning. Egna företagare är normalt självförsäkrade.
Foto: ImageSelect

69Quality of life · Livskvalitet
Health care expenditureThe major part of health care expenditure is paid by the public sector. Data on health care expenditure are based on data from the OECD, and its definition of health care expenditure differs somewhat from national definitions. The structural dif-ferences in the health care services of the individual countries also affect what is defined as a health cost.
In all Nordic countries, health and treatment expenditure ac-count for 8–10 per cent of the gross domestic product, GDP.
SjukvårdskostnaderDen absolut största delen av sjukvårdskostnaderna betalas av den offentliga sektorn. Uppgifterna om sjukvårdskostnader är baserade på uppgifter från OECD, och deras definition av sjuk-vårdskostnader skiljer sig något från de nationella definitionerna. Strukturskillnaderna i sjukvårdssystemen i de enskilda länderna påverkar också vad som inkluderas i sjukvårdskostnaderna.
Utgifterna för hälso- och sjukvård utgör i alla de nordiska län-derna 8–10 procent av bruttonationalprodukten, BNP.
Environment and energy · 20 Miljö och energi
Opdateret: 7/9-10 Kontrolleret:
Health care expenditure. 2008 Table 4.5Sjukvårdskostnader
Denmark Faroe Islands
Greenland Finland Iceland Norway Sweden
Euro per capita Euro per person
Total health care expenditure 3 712 .. 2 533 2 908 2 539 5 392 3 286 Totala sjukvårdskostnaderPublic consumption 3 096 .. 2 469 2 159 2 097 4 529 2 675 Offentlig konsumtionPrivate consumption 616 .. 64 749 442 863 601 Privat konsumtion
Per cent of total health care expenditure
Procent av totala sjukvårdskostnader
Public consumption 83.4 .. 97.5 74.2 82.6 84.0 81.4 Offentlig konsumtionPrivate consumption 16.6 .. 2.5 25.8 17.4 16.0 18.3 Privat konsumtion
Per cent of GDP Procent av BNP
Total health care expenditure 8.9 8.9 9.6 8.4 9.2 8.5 9.1 Totala sjukvårdskostnader
Heal12 Source: NOMESCO. Note: Denmark, Faroe Islands, Norway and Sweden: 2007 data. Not: Danmark, Färöarna, Norge och Sverige: 2007 års uppgifter. Foto: ImageSelect

70 Quality of life · Livskvalitet
Hospitals and health staffThere is a general tendency in the Nordic countries to close down smaller hospitals and concentrate resources in fewer, but larger, hospitals. The Faroe Islands, Finland and Åland have a higher number of beds per inhabitant than the other countries – primarily because, for these countries, beds in small hospitals are included in the figures under Other.
There are quite significant differences among the countries with respect to staff, both as to the total and within the individual categories of staff.
Sjukhus och sjukvårdspersonalDet finns en allmän tendens i de nordiska länderna att stänga mindre sjukhus och att koncentrera resurserna till färre men större sjukhus. Färöarna, Finland och Åland har ett större antal vårdplatser på sjukhus per invånare än de andra länderna, vilket huvudsakligen beror på att dessa länders vårdplatser på hälso-centraler är inkluderade i deras siffror under Övrigt.
Det finns väsentliga skillnader mellan länderna i fråga om mäng-den anställd per sonal, både totalt och inom enskilda kategorier av personal.
Opdateret: 7/9-10 Kontrolleret:
Active physicians and dentists. 2008Aktiva läkare och tandläkare
Figure 4.8
Environment and energy · 20 Miljö och energi
Per 100 000 inhabitants
150
200
250
300
350
400
450
0
50
100
Denmark Faroe Is. Greenland Finland Åland Iceland Norway Sweden
Physicians Dentists
Heal10 urce: NOMESCO.
Note: Faroe Islands
So
, Finland, Åland and Sweden: 2007 data. Not: Färöarna, Finland, Åland och Sverige: 2007 års uppgifter.
Opdateret:7/9-10 Kontrolleret: Hospital beds by speciality . 2008 Table 4.6 Antal vårdplatser på sjukhus efter specialitet
Denmark Faroe Islands
Greenland Finland Åland Norway Sweden
Hospital beds per 100 000 inhabitants
Vårdplatser på sjukhus per 100 000
invånare
Total 317 765 584 651 614 309 284 Totalt Medicine 142 153 71 102 130 136 150 Medicin Surgery 119 157 117 88 95 114 86 Kirurgi Psychiatry 57 145 21 85 64 53 48 Psykiatri Other .. .. 397 376 325 7 .. Övrigt
Heal17 Source: NOMESCO.
: Note Denmark and Faroe Islands: 2007 data. Finland: Includes Åland. Not: Danmark och Färöarna: 2007 års uppgifter. Finland: Inkluderar Åland.
Hospital beds by speciality . 2008 Table 4.5 Antal vårdplatser på sjukhus efter specialitet
Denmark Faroe Islands
Greenland
H i l b d
Environment and energy · Miljö och energi 20

71Quality of life · Livskvalitet
Deaths In all countries, the mortality rate is higher for men than women. Among causes of deaths, circulatory diseases and cancer ac-count for the majority of deaths in all age groups – except for children – for both men and women.
The figures for the autonomous areas, the Faroe Islands (49 000 inhabitants), Greenland (56 000 inhabitants) and Åland (28 000 inhabitants) must be viewed with caution, because of their small populations in which just a few deaths significantly boost rates per 100 000 persons.
DödsfallI alla länderna är dödlighetstalen högre för män än kvinnor. Bland dödsorsakerna står hjärt- och kärlsjukdomar och cancer för huvuddelen av dödsfallen i alla ålders grupper – utom för barn – för både män och kvinnor.
Uppgifterna för de självstyrande områdena Färöarna (med 49 000 invånare), Grönland (med 56 000 invånare) och Åland (med 28 000 invånare) måste tas med försiktighet, eftersom områdenas låga folkmängd gör att några få dödsfall drar upp siffrorna per 100 000 invånare väsentligt.
Environment and energy · Miljö och energi 20
Opdateret: Kontrolleret:
Causes of deaths per 100 000 people. 2008 Table 4.7 Dödsorskaker per 100 000 personer
Denmark Faroe Islands
Greenland Finland Åland Iceland Norway Sweden
Age-group 35–44 years Åldersgrupp 35–44 år Men Män
r 8 18 19 Ca
Cance
23
28
39 22 21
ncer Cardiovascular diseases 21 .. 77 37 10 8 18 17
38 .. 23 25 .. 32 29 32
Hjärt- och kärlsjukdomar
Women Cancer
Kvinnor Cancer
Cardiovascular diseases 14 .. 45 10 .. 14 6 6 Hjärt- och kärlsjukdomar
r 11 101 75 21 61 88 76 Ca
Age-group 45–54 years Åldersgrupp 45–54 år Men Cance
0
..
Män ncer
Cardiovascular diseases 73 31 101 127 95 66 68 69 Hjärt- och kärlsjukdomar
130 66 152 86 80 105 104 101 Women Cancer
Kvinnor Cancer
Cardiovascular diseases 30 .. 76 34 10 14 21 23 Hjärt- och kärlsjukdomar Heal03 and Heal04
Source: NOMESCO. : Note Finland: Includes Åland.
Not:. Finland: Inkluderar Åland..

72 Quality of life · Livskvalitet
Opdateret: 7/9-10 Kontrolleret:
ases of cancer by sex. 2008 Figure 4.9 l av cancer efter kön
Environment and energy · 20 Miljö och energi
Deaths caused by cancer and confirmed new cDödsfall orsakade av cancer och bekräftade fal
0
50
Denmark Faroe Islands Greenland
100
150
200
Finland Åland Iceland Norway Sweden
Men 35-44 years Men 45-54 years Women 35-44 years Women 45-54 years
Deaths per 100 000
Deaths caused by cancer and confirmed new cases of cancer by sex. 2007 Figure 4.9
d f ll k d
400
500
600
700
800
900
1 000
0
100
200
300
Denmark Faroe Islands Greenland Finland Åland Iceland Norway Sweden
Men WomenHeal03, Heal18 and Heal19 urce:
Note:
Confirmed new cases per 100 000
So NOMESCO. Faroe Islands: Deaths = 2006 data. New cases = 2007 data. Finland: New cases = 2007. Includes Åland. Åland: New cases = 2006.
Not: Färöarna: Döda = 2006 års uppgifter. Nya fall = 2007 års uppgifter. Finland: Nya fall = 2007 års uppgifter. Inkluderar Åland. Åland: Nya fall = 2006 års uppgifter.
Foto: Ojo Images

73Quality of life · Livskvalitet
SuicidePractices for coding “suicide, accidents and self-inflicted injury” differ from one country to another and, thus, care should be taken in comparing figures. The annual variation by age is also considerable.
Sub ject to uncertainties in the statistics on suicides, the figures reveal that Greenland (2008) have the highest suicide rate for both men (100.5) and women (22.7) in the Nordic countries. Distributed by age groups (disregarding Greenland), there seems to be considerably more suicides among older men in Finland and among older women in Denmark, than in the rest of the Nordic countries. Finland has the highest suicide rate among the 20–24 year-old, for both men and women.
SjälvmordPrinciperna för att koda ”självmord, olyckshändelser och själv-förvållade skador” skiljer sig från ett land till ett annat, varför man måste vara försiktig när man jämför siffrorna. Den årliga variationen i åldersgrupperna är också betydande.
Med förbehåll för en viss osäkerhet i självmordsstatistiken visar siffrorna att Grönland (2008) har den högsta självmords siffran för både män (100,5) och kvinnor (22,7) i Norden. Åldersfördelat (bortsett från Grönland) verkar det som betydligt fler äldre män i Finland och äldre kvinnor i Danmark begår självmord än i övriga Norden. Finland has den högsta självmordsfrekvensen bland de 20–24-åriga, både för män och kvinnor.
Deaths caused by sui
Dödsfall orsakade av själv
cide by sex. 2008 Figure 4.10
mord efter könOpdateret: 7/9-10 Kontrolleret:
Environment and energy · 20 Miljö och energi
0
5
10
Denmark F
15
20
25
30
35
40
45
inland Iceland Norway Sweden
10-19 years 20-24 years 25-64 years 65+ years
Deaths per 100 000 men
0
5
10
15
20
25
30
35
40
45
Denmark Finland Iceland Norway Sweden
10-19 years 20-24 years 25-64 years 65+ years
Deaths per 100 000 women
Heal05 urce: NOMESCO.
So
Foto: Ojo Images

74 Quality of life · Livskvalitet
AlcoholSeveral of the Nordic countries have restrictions on sale of alco-hol in order to keep consumption low. The level of consumption should be viewed with some caution as it only includes sale of beer, wine and alcohol. The figures indicate that the largest con-sumption is to be found in Denmark and Greenland, followed by Finland.
AlkoholFlera av de nordiska länderna har restriktioner på försäljning av alkohol för att hålla konsumtionen låg. Konsumtionsnivån bör ses med viss försiktighet, eftersom den endast omfattar försälj-ning av öl, vin och sprit. Siffrorna visar att den största konsum-tionen finns i Danmark och Grönland, följt av Finland.
Smoking Although the number of smokers in the Nordic countries has been decreasing during recent years, there continues to be large differences in the number of smokers, both for men and for women and some differences between countries. In general, more women than men smoke in the Nordic countries, only in Denmark and Finland more men than women are smoking.
Rökning Även om antalet rökare i de nordiska länderna har minskat under senare år är det fortfarande stora skillnader mellan antalet kvinn-liga och manliga rökare och en del skillnader mellan länderna. Generellt röker fler kvinnor än män i de nordiska länderna, endast i Danmark och Finland finns det fler män än kvinnor som röker.
Opdateret: 7/9-10 Kontrolleret: Non daily smokers Table 4.8 Personer som inte röker dagligen
Denmark Faroe Is. Finland Iceland Norway Sweden
Per cent
Procent
Men 1995
56 .. 71 68 67 78
Män1995
2000 69 .. 73 77 69 83 20002005 72 72 74 80 73 86 20052008 76 79 74 84 79 88 2008
61 .. 81 67 68 76Women 1995
Kvinnor1995
2000 74 .. 80 78 68 79 20002005 77 73 82 80 76 82 20052008 78 73 83 84 79 84 2008
Non daily smokers Heal01
Source: NOMESCO. :
Personer Note Denmark: 2000 refers to 2001 data and 2005 refers to 2004 data. Faroe Islands and Finland: 2008 refers to 2007 data. Finland: Includes Åland. Not: Danmark: Uppgifterna för 2000 avser 2001 och uppgifterna för 2005 avser 2004. Färöarna och Finland: Uppgifterna för 2008 avser 2007. Finland: Inkluderar Åland.
som inte röker
Causes of deaths. 2007 Orskakar till dödsfall
Environment and energy · Miljö och energi 20
Opdateret: 7/9-10 Kontrolleret:
Sale of alcoholic beverages, litres pure alcohol Figure 4.11 Forsäljning av alkokolhaltiga drycker, liter ren alkohol per person
4
6
8
1990 1992 1994 1996 1998 2000 2002 2004 2006 2008
Faroe Is.
Greenland
ÅlandIceland
NorwaySweden
Finland10
12
14
16Litres pure alcohol per person
Denmark
Heal02
Source: NOMESCO. Note: Includes only the sale of dutiable alcohol in each individual country. Consequently, the consumption of alcohol bought in another country is not included. Litres pure alcohol per person 15 years of age or more. Denmark: 14 years of age or more. Finland: Includes Åland. Not: Inkluderar endast försäljning av avgiftspliktiga alkoholhaltiga drycker i varje enskilt land. Konsumtion av alkohol köpt i ett annat land ingår sålunda inte i siffrorna. Liter ren alkohol per person i åldern 15 år och äldre. Danmark: 14 år och äldre. Finland: Inkluderar Åland.
Sale of alcoholic beverages, litres pure alcohol. 2007 Figure 4.11
Forsäljning av
Environment and energy · 21 Miljö och energi

75Quality of life · Livskvalitet
Culture and leisureThe policies of the Nordic countries with respect to cultural life, mass media and religion have many features in common. Howev-er, some differences may be pointed out – for instance, cultural institutions arising from historical circum stances.
Denmark has the most museums, a total of 240, but it is people in Åland and Iceland who most often visit museums, an averagge of 5 visits per person.
Kultur och fritidDe nordiska länderna har en ganska likartad inställning till kul-turellt liv, massmedier och religion. Vissa skillnader kan emel-lertid urskiljas, exempelvis när det gäller kulturella institutioner som har sin grund i historiska förhållanden.
Danmark har flest museer, totalt 249, men det er människor på Åland och Island, som oftast besöker museer, i genomsnitt 5 besök per person.
Sale of musicSince 2000 the total sale of music has declined by almost 50 per cent in all the Nordic countries, at the same time the digital sale has increased. In Denmark the sale of digital music has quad-rupled since 2006 and represents 23 per cent of the total sale in 2009. In Norway and Sweden the digital sale has respectively trippled and dubbled and now represents 15 and 16 per cent of the total sale of music.
MusikförsäljningSedan 2000 har den totala försäljningen av musik minskat med nästan 50 procent i samtliga nordiska länder, samtidigt har den digitala försäljningen ökat. I Danmark har försäljningen av digital musik fyrdubblats sedan 2006 och representerar 23 procent av den totala försäljningen under 2009. I Norge och Sverige har den digitala försäljningen tredubblats respektive fördubblats och utgör 15 och 16 procent av den totala försäljningen av musik.
Opdateret: 22/7-10 Kontrolleret:
Number of visits to museums. 2008 Figure 4.12
Antal museibesök
0
1
2
3
4
5
6
Denmark Faroe Islands Greenland Finland Åland Iceland Norway Sweden
Visits per person
Note
Cult16
Source: National statistical institutes. : Iceland: 2006 data.
Not: Island: 2006 års uppgifter.
Number of visits to museums. 2008 Figure 4.12
Antal museibesök
Visits per person
Environment and energy · 20 Miljö och energi
Sale of music. 2009Salg av musik
Opdateret: 22/7-10 Kontrolleret: Sale of music. 2009 Table 4.9 Musikförsäljning
Denmark Finland Iceland Norway Sweden
1 000 euro 1 000 euroTotal sale 71 889 41 767 4 645 67 938 81 104 Total försäljningDigital sale 16 523 2 802 .. 10 196 13 228 Digital försäljning
Cult19 Source: National statistical institutes and Swedish Film Institute. Note: Denmark: Includes Faroe Islands and Greenland. Iceland: 2008 data. Not: Danmark: Inkluderar Färöarna och Grönland. Island: 2008 års uppgifter.
Environment and energy · Miljö och energi 20

76 Quality of life · Livskvalitet
Libraries and books Traditionally, libraries lent out volumes of books, which was fairly easy to tabulate. Today, libraries function as infor mation centres with a wide variety of services and access to all kinds of printed and electronic media.
In the last 10 years the Nordic countries have had a decline in stock and lending of books in public libraries. Only the Faroe Islands have had an increase – 73 per cent on stock and 28 per cent on lending of books. Despite the general decline in stock and loans, all the Nordic countries have had an increase in regards to other media than books.
Since 2000 the stock of other medias has increased by 35 and 62 per cent in Denmark and Norway – the lending of books by 34 and 45 per cent.
The Finnish population are the most eager to borrow on public li-braries. In 2009, every Finn borrowed 18.5 books or other media.
Bibliotek och böcker Bibliotek har traditionellt lånat ut böcker, vilket har varit ganska enkelt att räkna. I dag fungerar bibliotek som informationscen-tra med ett brett utbud av tjänster och tillgång till alla typer av tryckta och elektroniska medier.
Under de senaste 10 åren har de nordiska länderna haft en ned-gång i bestånd och utlåning på folkbibliotek. Endast Färöarna har haft en ökning – 73 procent på beståndet och 28 procent på ut-låningen. Trots den allmänna nedgången i bestånd och utlåning, har alla de nordiska länderna haft en ökning av andra medier än böcker.
Sedan 2000 har beståndet av andra medier ökat med 35 respek-tive 62 procent i Danmark och Norge – utlåningen med 24 respek-tive 45 procent.
Den finska befolkningen är mest angelägen om att låna på folk-bibliotek. År 2009 lånade varje finländare 18,5 böcker eller andra medier.
Opdateret: 28/7-10 Kontrolleret:
Total lending in public libraries Figure 4.13 Utlåning på folkbiblioteken
02468
10121416182022
1991 1993 1995 1997 1999 2001 2003 2005 2007 2009
Per person
Denmark
Faroe Island
Finland
Åland
Iceland
Norway
Sweden
Cult01 and Popu02
Source: Nordicom and national statistical institutes.
Volumes lent in Public libraries Figure 4.13 Utlåning av böcker på Folkbiblioteken
Environment and energy · 20 Miljö och energi
1 800
2 000
2 200
2 400Per person
6
Opdateret: 22/7-10; LLh Kontrolleret: Public libraries, stock and lending. Table 4.10 Folkbibliotekens bokbestånd och utlåning
Denmark Faroe Is. Finland Åland Iceland Norway Sweden
Per persons Per personStock, total 2000
Bestånd, totalt20005.8 7.7 7.9 12.9 7.6 4.9 5.2
2005 5.3 8.0 7.8 12.0 .. 4.8 4.8 20052008 4.5 13.4 7.6 12.2 .. 4.4 4.7 2008
13.5 3.1 19.6 18.9 7.6 5.2 9.0
Loans, total 2000
Utlåning, totalt2000
2005 13.5 3.7 19.8 17.8 .. 5.4 7.9 20052008 13.4 4.0 18.6 17.3 .. 5.0 7.5 2008
10.6 .. 14.9 .. 7.0 4.1 7.9Books lent 2000
Utlåning av böcker2000
2005 9.6 .. 14.5 .. .. 3.9 6.7 20052008 9.7 .. 13.5 14.1 .. 3.5 6.2 2008
Cult01 and Cult10 : National statistSource
ical institutes and Nordicom.
Public libraries, stock and lending.
Table 4.10
Environment and energy · Miljö och energi 20

77Education · Utbildning
EducationUtbildningThe Nordic education system differs among the countries in a number of ways. Comprehensive schools are compulsory in all Nordic countries and local authorities finance them with general grants from the state. In Denmark and Finland, education does not necessarily have to take place in a school. It may, for example, take place at home. After 9–10 years of compulsory schooling most students will pursue some form of continuing training.
In this chapter you can find information on education such as
• enrolled students • graduated students • education level in the Nordic countries • grants and student loans
More detailed information on the subject and longer time series are available in the Nordic database, more specifically under education.
Data on Nordic students abroad can be found in the Globalisation chapter.
De nordiska ländernas utbildningssystem skiljer sig åt på en rad områden. Grundskolan är obligatorisk i alla nordiska län der och de kommunala myndigheterna bekostar den med allmänna anslag från staten. I Danmark och Finland behöver utbildningen inte nödvändigtvis äga rum i en skola, utan den kan till exempel organiseras av föräldrarna i hemmet. Nästan alla elever fortsätter att studera efter den 9–10 år långa grundskoleutbildningen.
I detta kapitel finner du bl.a. följande information om utbildning:
• inskrivna elever/studenter • examinerade elever/studenter• utbildningsnivå i den nordiska befolkningen• studiestöd Mer detaljerad information om ämnet och längre tidsserier finns tillgängliga i den nordiska databasen, mer specifikt inom utbildning.
Data om nordiska studerande i utlandet finns i kapitlet Globalisering.
Foto: ImageSelect

78 Education · Utbildning
Enrolled studentsThe total number of students enrolled at upper secondary or tertiary level education (ISCED levels 3–6) in the Nordic countries is approximately 2.6 million and represents 14 per cent of the age group 15–74.
Students aged 15–39 cover 90 per cent of the enrolment and represent approximately 29 per cent of the entire population between the ages of 15 and 39.
Women constitute the majority of students at upper secondary and tertiary levels in all age groups.
Inskrivna studenter Det totala antalet inskrivna elever/studenter på gymnasie, universitets och högskolenivå (ISCEDnivå 3–6) i de nordiska länderna är 2,6 miljoner och utgör 14 procent av åldersgruppen 15–74 år. Elever/studenter i åldern 15–39 år representerar 90 procent av de inskrivna och ungefär 29 procent av hela befolk ningen mellan 15 och 39 år.
Kvinnor utgör den största andelen av de inskrivna studenterna på gymnasie, universitets och högskolenivå i alla åldersgrupper.
Opdateret: 25/9-10 Kontrolleret: Students enrolled aged 15–74. 2009/2010 Table 5.1 Inskrivna elever/studenter i åldern 15–74 år
Total Totalt
(ISCED 1-6)
Primary levelGrundskola (ISCED 1-2)
Secondary levelGymnasium
och yrkesutbildning(ISCED 3-4)
Tertiary levelUniversitet
och högskola (ISCED 5-6)
Per cent of total population aged 15–74 years
Procent av total befolkning I åldern 15–74 år
Denmark 13.6 2.8 5.8 5.0 DanmarkFinland 18.9 1.8 9.7 7.4 FinlandÅland 10.2 1.7 6.3 2.3 ÅlandIceland 21.3 1.9 11.7 7.7 IslandNorway 15.5 1.8 7.5 6.2 NorgeSweden 17.7 3.6 8.0 6.2 Sverige
Educ02 Source: National statistical institutes. Note: Finland: Includes Åland. 2008 data. Sweden: 2007 data. Not: Finland: Inkluderar Åland. 2008 års uppgifter. Sverige: 2007 års uppgifter. Students enrolled
aged 15–74. 2009/2010
Inskrivna elever/studenter i åldern 15–74 år.
Environment and energy · 20 Miljö och energi
Foto: ImageSelect
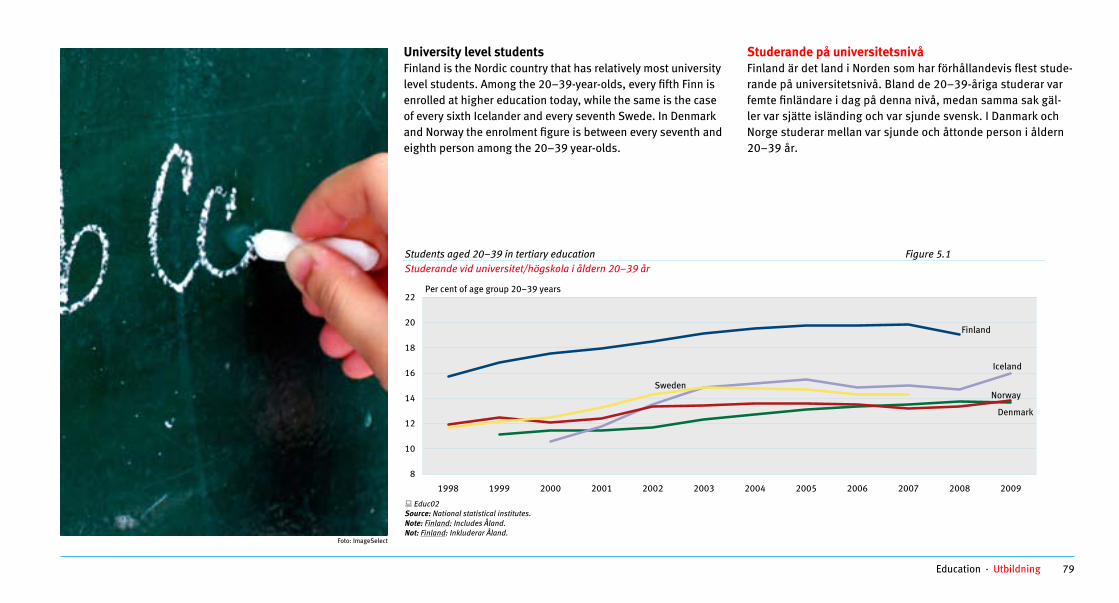
79Education · Utbildning
University level studentsFinland is the Nordic country that has relatively most university level students. Among the 20–39yearolds, every fifth Finn is enrolled at higher education today, while the same is the case of every sixth Icelander and every seventh Swede. In Denmark and Norway the enrolment figure is between every seventh and eighth person among the 20–39 yearolds.
Studerande på universitetsnivåFinland är det land i Norden som har förhållandevis flest studerande på universitetsnivå. Bland de 20–39åriga studerar var femte finländare i dag på denna nivå, medan samma sak gäller var sjätte isländing och var sjunde svensk. I Danmark och Norge studerar mellan var sjunde och åttonde person i åldern 20–39 år.
Opdateret: 25/9-10 Kontrolleret:
Environment and energy · Miljö och energi 20
Students aged 20–39 in tertiary education Figure 5.1Studerande vid universitet/högskola i åldern 20–39 år
8
10
12
14
16
18
20
22
1998 1999 2000 2001 2002 2003 2004 2005 2006 2007 2008 2009
Denmark
Finland
Iceland
NorwaySweden
Per cent of age group 20–39 years
Educ02 Source: National statistical institutes. Note: Finland: Includes Åland. Not: Finland: Inkluderar Åland.
Foto: ImageSelect

80 Education · Utbildning
Environment and energy · 20 Miljö och energi
Opdateret: 25/9-10 Kontrolleret:
Graduates at tertiary level, aged 15–74 by field of education. 2009/2010 Table 5.2 Examinerade på universitets- och högskolenivå i åldern 15–74 år efter utbildningsinriktning
Denmark Finland Åland Iceland Norway Sweden
Number of graduated students Antal examinerade studenter
Total 45 714 60 075 45 3 631 35 201 60 428 Totalt Men, per cent 42.1 36.0 53.3 33.9 38.7 36.5 Män, procent Women, per cent 57.9 64.0 46.7 66.1 61.3 63.6 Kvinnor, procent
Per cent Procent
Total 100.0 100.0 100.0 100.0 100.0 100.0 Totalt General programmes - - - - 0.2 - Allmänna program Teacher training, education science 7.8 7.9 - 22.8 17.4 18.4 Lärarutbildning, pedagogik Arts, humanities and religion 14.1 17.1 - 10.7 8.8 5.4 Estetiska och humanistiska program samt religion Social science, business and law 27.4 26.1 13.3 37.3 28.7 23.8 Samhällsvetenskap, ekonomi och juridik Natural science, mathematics and computing 7.2 11.7 - 6.6 7.2 6.7 Naturvetenskap, matematik och datavetenskap Engineering, manufacturing and construction 13.7 15.1 24.4 7.0 8.1 16.8 Maskinteknik, tillverkning och byggteknik Agriculture, forestry and fishery 2.4 2.3 - 0.4 0.9 1.2 Jordbruk, skogsbruk och fiske Health and social services 24.0 15.1 17.8 13.7 24.2 24.9 Hälsa och socialvård Services and defence 3.5 4.8 44.4 1.6 4.5 2.8 Serviceyrken och försvar Not specified - - - - 0.0 0.1 Ospecificerat
Educ03 Source: National statistical institutes. Note: Finland and Iceland: 2008/2009 data. Sweden: 2007/2008 data. Finland: Includes Åland. Not: Finland och Island: 2008/2009 års uppgifter. Sverige: 2007/2008 års uppgifter. Finland: Inkluderar Åland.
GraduatesIn all the Nordic countries the majority of graduates at tertiary level are women. Men constitute approximately 40 per cent of those graduating. Female graduates dominate within fields such as health and social services, whereas men dominate in fields such as engineering, manufacturing and construction.
Among university level students, there are far more individuals in Finland who study natural sciences, information technology or engineering than in the other Nordic countries.
In Denmark and Sweden a relatively high number is enrolled for studies in the fields of social and health services, while a relatively high number of individuals in Norway and Iceland study economics, law and social sciences.
ExamineradeI alla de nordiska länderna är kvinnorna i majoritet av de som tar examen på universitets och högskolenivå. Männen utgör ungefär 40 procent av de exami nerade. Kvinnorna dominerar inom t.ex. hälsa och socialvård, medan männen är i majoritet
när det gäller t.ex. maskinteknik, tillverkning och byggteknik. Bland de studerande på universitets och högskolenivå har Finland långt fler som läser naturvetenskap, IT eller ingenjörsrelaterade ämnen än de övriga nordiska länder na. I Danmark och Sverige studerar relativt många inom området hälsa och socialvård, medan Norge och Island har förhållandevis många som läser ekonomi, juridik och samhällsvetenskap.

81Education · Utbildning
Level of educationWhen comparing the Nordic countries with respect to level of education one must take into account the different educational systems in the Nordic countries. Some types of education are difficult to classify, e.g. at either lower or upper secondary level, and practices may differ among the Nordic countries. This might also account for some of the differences in the share of population attaining a certain level of education.
The majority of the Nordic population in the age group 25–74 years, who have achieved an education are men, but it is the women who have the highest level of education. In 2009, 56 per cent of people who achieved a higher education on the tertiary level were women.
UtbildningsnivåerNär man jämför utbildningsnivåer i de nordiska länderna måste man ta hänsyn till att länderna har olika utbildnings system. Vissa typer av utbildningar är svåra att klassificera och praxis kan variera mellan de nordiska länderna. Detta kan också vara orsaken till en del av skillnaderna i fråga om hur stor del av befolkningen som uppnår en viss utbildningsnivå.
Majoriteten av den nordiska befolkningen i åldersgruppen 25–74 år som har uppnått en utbildning är män, men det är kvinnorna som har den högsta utbildningsnivån. Under 2009 var 56 procent av alla som uppnått en högre utbildning på högskolenivå kvinnor.
Opdateret: 25/9-10 Kontrolleret:
Environment and energy · Miljö och energi 20
Level of education achieved, people aged 25–74 years. 1 January 2009 Figure 5.2Uppnåss utbildningsnivå, personer i åldern 25–74 år
0
10
20
30
40
50
60
70
80
90
100
Denmark Faroe Islands Finland Åland Iceland Norway Sweden
Primary Secondary Tertiary Not specified
Per cent of age group 25–74 years
Educ01 Source: National statistical institutes. Note: Faroe Islands: 2007 data. Finland: 2008 data. Includes Åland. Sweden: Fields not specified include fields not known and level not known includes level not specified. Not: Färöarna: 2007 års uppgifter. Finland: 2008 års uppgifter. Inkluderar Åland. Sverige: Ospecificerad utbildningsinriktning inkluderar okänd utbildningsinriktning och okänd nivå inkluderar ospecificerad nivå.
Did you know … that within the fields of social science, business and law, the number of graduated men and women are almost the same – 27 per cent for male and 26 per cent for female graduates in 2009.
Visste du att … inom områdena samhällsvetenskap, ekonomi och juridik är andelen examinerade kvinnor och män likadana – 26 procent för män och 27 procent för kvinnor 2009.
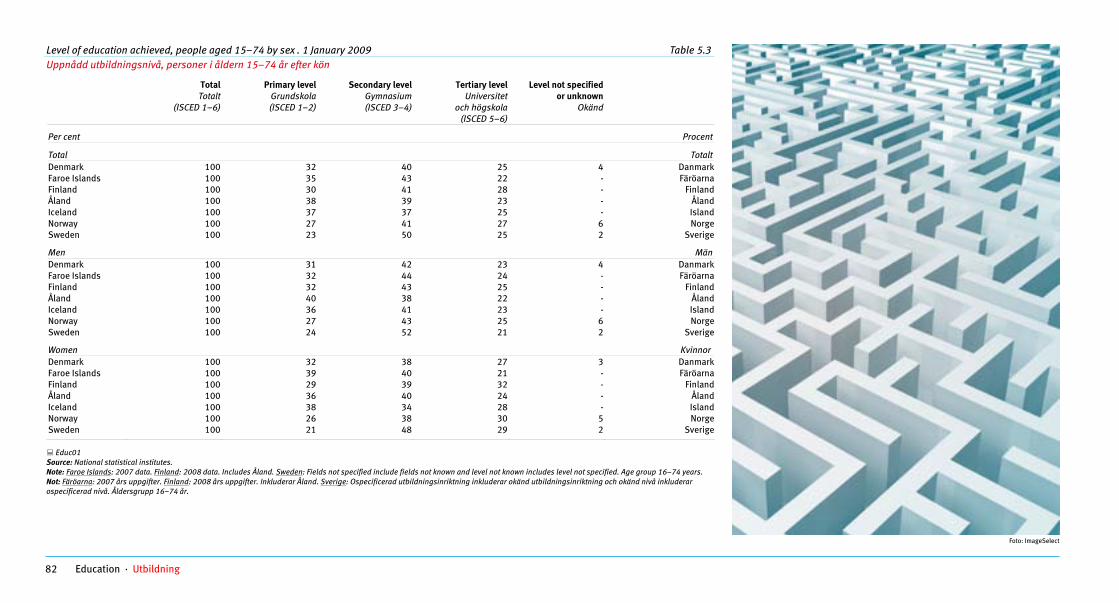
82 Education · Utbildning
Level of education achieved, people aged 15–74 by sex . 1 January 2009 Table 5.3
Environment and energy · 20 Miljö och energi
Uppnådd utbildningsnivå, personer i åldern 15–74 år efter kön Opdateret: 25/9-10
TotalTotalt
(ISCED 1–6)
Primary levelGrundskola (ISCED 1–2)
Secondary levelGymnasium (ISCED 3–4)
Tertiary levelUniversitet
och högskola(ISCED 5–6)
Level not specified or unknown
Okänd
Kontrolleret: Per cent Procent
Total Totalt Denmark 100 32 40 25 4 Danmark Faro
Fine Islands 100 35 43 22 - Färöarna
land 100 30 41 28 - FinlandÅland 100 38 39 23 - ÅlandIceland 100 37 37 25 - IslandNorway 100 27 41 27 6 Norge
Denmark 100 31 42 23 4 Danmark
Sweden 100 23 50 25 2 Sverige Men Män
Faro Fin
e Islands 100 32 44 24 - Färöarnaland 100 32 43 25 - Finland
Åland 100 40 38 22 - ÅlandIceland 100 36 41 23 - IslandNorway 100 27 43 25 6 Norge
Denmark 100 32 38 27 3 Danmark
Sweden 100 24 52 21 2 Sverige
Women Kvinnor
Faro Fin
e Islands 100 39 40 21 - Färöarnaland 100 29 39 32 - Finland
Åland 100 36 40 24 - ÅlandIceland 100 38 34 28 - IslandNorway 100 26 38 30 5 Norge
Sweden 100 21 48 29 2 Sverige
Educ01 Source: National statistical institutes. Note: Faroe Islands: 2007 data. Finland: 2008 data. Includes Åland. Sweden: Fields not specified include fields not known and level not known includes level not specified. Age group 16–74 years. Not: Färöarna: 2007 års uppgifter. Finland: 2008 års uppgifter. Inkluderar Åland. Sverige: Ospecificerad utbildningsinriktning inkluderar okänd utbildningsinriktning och okänd nivå inkluderar ospecificerad nivå. Åldersgrupp 16–74 år.
Foto: ImageSelect

83Education · Utbildning
Opdateret: 25/9-10 Kontrolleret:
Environment and energy · 21 Miljö och energi
Tertiary education achieved by field of education, people aged 15–74. 1 January 2009 Table 5.4 Uppnådd utbildning på universitets- och högskolenivå efter utbildningsinriktning, personer i åldern 15–74 år
Denmark Faroe Islands Finland Åland Iceland Norway Sweden
Number of persons Antal personer
Total 1 021 751 7 750 1 143 638 4 772 56 700 961 592 1 717 517 Totalt Men, per cent 46.0 56.8 43.3 48.4 45.9 45.5 42.7 Män. procent Women. per cent 54.0 43.2 56.7 51.6 54.0 54.5 57.3 Kvinnor. procent
Per cent Procent
Total 100.0 100.0 100.0 100.0 100.0 100.0 100.0 Totalt General programmes - - - 0.0 .. 3.3 - Allmänna program Teacher training. education science 12.4 22.7 6.9 7.6 .. 19.3 21.7 Lärarutbildning. pedagogik Arts. humanities and religion 9.9 4.9 8.3 6.4 .. 7.9 6.3 Estetiska och humanistiska program samt religion Social science. business and law 19.5 18.8 31.8 34.3 .. 23.5 22.1 Samhällsvetenskap. ekonomi och juridik Natural science. mathematics and computing 4.2 - 5.7 2.9 .. 7.5 6.0 Naturvetenskap. matematik och datavetenskap Engineering. manufacturing and construction 17.0 9.4 22.4 18.8 .. 11.0 15.0 Maskinteknik. tillverkning och byggteknik Agriculture. forestry and fishery 3.2 - 2.8 2.6 .. 1.2 1.4 Jordbruk. skogsbruk och fiske Health and social services 29.1 18.7 17.0 17.0 .. 21.9 21.8 Hälsa och socialvård Services and defence 4.7 20.0 5.0 10.1 .. 4.1 4.4 Serviceyrken och försvar Not specified - - 0.1 0.1 .. 0.2 1.3 Ospecificerat
Educ01 Source: National statistical institutes Note: Faroe Islands
Opdateret: 25/9-10 Kontrolleret:
: 2007 data. Finland: 2008 data. Includes Åland. Sweden: Fields not specified include fields not known and level not known includes level not specified. Age group 16–74 years. Not: Färöarna: 2007 års uppgifter. Finland: 2008 års uppgifter. Inkluderar Åland. Sverige: Ospecificerad utbildningsinriktning inkluderar okänd utbildningsinriktning och okänd nivå inkluderar ospecificerad nivå. Åldersgrupp 16–74 år.
Did you know … that 26 per cent of the Nordic population aged 15–74 years has a higher education on the tertiary level.
Visste du att … 26 procent av den nordiska befolkningen i åldern 15–74 år, har en utbildning på universitets- och högskolenivå.

84 Education · Utbildning
Student financial aidIn all the Nordic countries students have the opportunity to receive financial aid during their studies. The financial aid consists of grants and student loans.
Students in Denmark and in the Faroe Islands receive the most financial aid in the form of grants. Students in Iceland only receive financial aid in the form of a student loan, but are able to borrow more money than any other Nordic country.
In the Faroe Islands 90 per cent of the financial aid is given as grants to students styding in the Faroe Islands. Faroese students styding elsewhere than the Faroe Islands recieve financial aid from Denmark.
In Denmark and Finland, two thirds of the total financial aid is generally given as grants. In Norway and Sweden, the grant usually covers one third of the total financial aid. In Denmark and in the Faroe Islands, the student financial aid is typically granted for 11 to 12 months annually, while the other Nordic countries normally grant it for the 9 to 10 months of actual period of study. Grants are taxable income in Denmark, Finland and Åland. In Sweden, Norway, Iceland, and the Faroe Islands they are taxfree. Detailed rules have been established on the terms for receiving grants as well as for payment of interest and the repayment of loans.
StudiemedelI alla nordiska länder har studerande möjlighet att få ekonomiskt studiestöd under sin studietid. Studiestödet består av bidrag och lån.
Studiemedlens bidragsdel är störst i Danmark och på Färöarna. På Island ges hela studiestödet som lån. Möjligheterna att få stora studielån är å andra sidan störst på Island.
På Färöarna ges 90 procent av det finansiella stödet som bidrag till studerande på Färöarna. Färöiska studerande som inte studerar på Färöarna får studiestöd från Danmark.
I Danmark och Finland ges vanligtvis två tredjedelar av det totala studiestödet som bidrag. I Norge och Sverige utgör bidrags delen något mer än en tredjedel. I Danmark och på Färöarna får en studerande van ligt vis studiemedel under 11 till 12 månader per år, medan man i de övriga nordiska länderna begränsar sig till de 9–10 månad er av året då studierna bedrivs. I Danmark, Finland och på Åland betraktas studiebidraget som skattepliktig inkomst, medan det i Sverige, Norge och på Island och Färöarna är skattefritt. Naturligtvis finns det detal je rade regler för de villkor som gäller för att få studie bidrag samt för betalning av ränta och återbetalning av studie lånen.
Opdateret: 25/9-10 Kontrolleret:
Financial support for students. Autumn 2009 Figure 5.3 Studiestöd ..
0
200
400
600
800
1 000
1 200
Denmark Finland Iceland Norway Sweden
Grant Loan
Euro per month
Educ07 Source: KELA Center for Student Financial Aid, Helsinki and national statistical institutes.
Environment and energy · Miljö och energi 21

85Economic trends · Ekonomiska tendenser
Economic trendsEkonomiska tendenser
The economic slowdown has generally hit all the Nordic coun-tries due to the financial crisis.
In this chapter you can find information on economic trends such as
• economic key figures • factors behind economic growth• the primary sector• manufacturing • the service sector
More detailed information on the subject and longer time series are available in the Nordic database, more specifically under economic trends.
En ekonomisk nedgång har generellt drabbat alla de nordiska länderna på grund av finanskrisen.
I detta kapitel finner du bl.a. följande information om ekono-miska tendenser:
• ekonomiska nyckeltal• faktorer bakom den ekonomiska tillväxten• basnäringarna• industrin• servicesektorn
Mer detaljerad information om ämnet och längre tidseserier finns tillgängliga i den nordiska databasen, mer specifikt inom ekonomiska tendenser.
Foto: ImageSelect

86 Economic trends · Ekonomiska tendenser
Economic key figures2008 marked the beginning of the financial crisis throughout the world. All the Nordic countries have been affected by the global crisis though to varying degrees. GDP growth has been nega-tive in all of the Nordic countries in 2009. However, the Nordic economies are among the countries in the Western World with the best macroeconomic performance in the recent ten years. Denmark, Finland, Norway and Sweden have experienced con-stant and large excess exports in recent years. Iceland is the only country which has balance of payments deficits. At the same
time, unem ployment is low in most of the Nordic countries com-pared with the rest of Europe. As a result of the cyclical down-turn, the public balance is now in deficit, except for Norway.
Ekonomiska nyckeltal 2008 markerade inledningen på den ekonomiska krisen i hela världen. Alla nordiska länder har berörts av den globala krisen om än i olika utsträckning. BNP-tillväxten har varit negativ i alla de nordiska länderna under 2009. De nordiska ekonomierna är
bland de länder i västvärlden med de bästa makroekonomiska resultaten av alla under de senaste tio åren. Danmark, Finland, Norge och Sverige har upplevt varaktiga och betydande export-överskott under de senaste åren. Island är det enda land som har underskott i betalningsbalansen. Samtidigt är arbetslöshe-ten låg i de flesta av de nordiska länderna jämfört med övriga Europa. Som en följd av den cykliska nedgången visar nu de offentliga finanserna ett underskott, med undantag för Norge.
20 Environment and energy · Miljö och energi
Opdateret: Kontrolleret:
Economic key figures. 2009 Table 6.1 Ekonomiska nyckeltal
Denmark Faroe Islands Greenland Finland Åland Iceland Norway Sweden Euro-area
Per cent of GDP Procent av BNP
-2.81) Bytesbalans överskott Balance of payments, current account surplus 4.0 .. 1.3 .. -3.3 13.9 7.4 -0.6
10.61) Utländska tillgångar, netto, 31 dec. 2009 Net foreign assets, 31 Dec. 2009 6.0 .. -7.0 .. -371.0 88.7 -9.0 ..
Offentliga sektorns överskott Public balance, surplus -2.7 .. .. -2.2 .. -9.1 9.7 -0.5 -6.3Offentliga sektorns skulder, 31 dec. 2009 Public gross debt, 31 Dec. 2009 41.6 .. .. 44.0 .. 88.1 43.7 42.1 78.7
Procent Per cent
Unemployment Arbetslöshetstal 6.0 5.2 .. 8.2 3.0 7.2 3.1 8.3 9.4Interest rate 3.6 .. .. 3.7 .. 8.0 4.0 3.3 4.0 Ränta
Per cent change 2008-2009 Procentuell förändring 2008–2009
Inflation rate, consumer prices 1.1 -1.1 0.6 1.6 0.2 16.3 2.3 1.9 0.3 Tillväxt i konsumentpriser Ekonomisk tillväxt -1.5
2) -4.02)Economic growth -4.9 .. -7.8 -6.5 -1.6 -5.1 -4.1
Aktiekursindex Share prices index -26.7 .. .. -32.9 .. -86.3 -24.8 -9.9 -25.4Effektiv nominell valutakursindex Effective nominal exchange rate 3.0 .. .. 1.1 .. .. -1.5 -9.3 ..
Key01 Source: Eurostat, OECD, the Danish central bank and national statistical institutes. Note: Finland: Includes Åland. Harmonized unemployment rates for Denmark, Faroe Islands, Finland, Iceland, Norway and Sweden. Interest rate: 10 year government bond yields, average. Inflation rate: Per cent change from previous year in harmonized indices of consumer prices. 1) 2008 2) Estimated. Not: Finland: Inkluderar Åland. Harmoniserat arbetslöshetstal för Danmark, Färöerna, Finland, Island, Norge och Sverige. Ränta: Avkastning på 10-åriga statsobligationer, genomsnitt. Tillväxt i konsumentpriser: Procentuell förändring i det harmoniserade konsumentprisindexet från förra året. 1) 2008 2) Beräknade.

87Economic trends · Ekonomiska tendenser
Economic growthOver the past ten years, the Nordic countries had a notice-ably larger increase in gross domestic product (GDP) than in Western Europe, (the 15 EU countries before enlargement). The only exception is Denmark, which had a lower growth than the EU-15. However, in 2009, the Nordic countries and the EU-15 had a marked negative growth due to the global financial crisis from 2007 to today. Finland has experienced the steepest decline in GDP, with a downturn in the economy at 7.8 percent in 2009.
Measured by GDP per capita, the Nordic countries have a wealth higher than the EU-15. Norway’s GDP per capita is as high as 60 percent above the EU-15 average, and Norway is actually one of the countries with the highest standard of living.
Ekonomisk tillväxtUnder de senaste tio åren har de nordiska länderna haft en markant kraftigare ökning av bruttonationalprodukten (BNP) än Västeuropa (de 15 EU-länderna före utvidgningen). Det enda undantaget är Danmark, som har haft en lägre tillväxt än EU-15.
Under 2009 hade de nordiska länderna och EU-15 en markant negativ tillväxt till följd av den världsomspännande ekonomiska krisen från 2007 till i dag. Finland har upplevt den brantaste nedgången i BNP med en nedgång i ekonomin på 7,8 procent i 2009.
Men de nordiska länderna har ett högre välstånd än EU-15, om välstånd mäts i BNP per capita. Norges BNP per capita är så mycket som 60 procent över EU-15-genomsnittet, och Norge är faktiskt ett av de länder som har den högsta levnadsstandarden.
Environment and energy · 20 Miljö och energi
Opdateret: 30. juni af Ulla Kontrolleret:
Gross domestic product, real annual growth Figure 6.2Bruttonationalprodukten, årlig realtillväxt
-8.0
-7.0
-6.0
-5.0
-4.0
-3.0
-2.0
-1.0
0.0
1.0
2.0
3.0
Denmark Finland Iceland Norway Sweden EU-15
2008 2009
Per cent
Naac01 and Key01 Source: Eurostat and national statistical institutes.
Environment and energy · 20 Miljö och energi
Opdateret: 30. juni af Ulla Kontrolleret:
Gross domestic product at constant prices Figure 6.1Bruttonationalprodukten i fasta priser
95
100
105
110
115
120
125
130
135
140
2000 2001 2002 2003 2004 2005 2006 2007 2008 2009
Denmark
Finland
Åland
Iceland
Norway
Index 2000=100
Sweden
EU-15
Naac01 Source: Eurostat and national statistical institutes.
Environment and energy · 20 Miljö och energi
Opdateret: 1. juli 2010 af Ulla Kontrolleret:
Gross domestic product in euro (PPP) per person Figure 6.3 Bruttonationalprodukten per person i euro (PPP)
90
100
110
120
130
140
150
160
170
180
2000 2001 2002 2003 2004 2005 2006 2007 2008 2009
Denmark
FinlandSweden
EU-15
Index EU-15=100
Åland
Iceland
Norway
Naac04
Source: Eurostat and national statistical institutes.

88 Economic trends · Ekonomiska tendenser
Factors behind economic growthPrivate consumption has fallen through the crisis – and this has especially been the case for Denmark, Finland and Iceland. Public consumption has, on the other hand, experienced posi-tive growth rates - exept for Iceland. The general rise is due to the many fiscal initiatives to support economic growth and the financial and business sectors – and the need to finance higher social expenses because of the crisis.
From 2008 Iceland has experienced a fall in gross capital forma-tion. This is after many years with an Icelandic growth particu-
larly driven by investments, which have more than tripled in the recent ten years. Iceland also holds a leading position com-pared to the other Nordic countries regarding growth in private and public consumption in the years from 2000 to 2007.
Faktorer bakom den ekonomiska tillväxtenDen privata konsumtionen har minskat på grund av krisen – och detta har framförallt varit fallet för Danmark, Finland och Island. Den offentliga konsumtionen har däremot haft en positiv till-växt – utom på Island. Den allmänna ökningen beror på många
Environment and energy · 20 Miljö och energi
Opdateret: Kontrolleret:
Private consumption at constant prices Figure 6.4 Privat konsumtion i fasta priser
90
95
100
105
110
115
120
125
130
135
140
2000 2001 2002 2003 2004 2005 2006 2007 2008 2009
Denmark
Finland
Iceland Norway
Sweden
Index 2000=100
Åland
Naac01 Source: Eurostat and national statistical institutes.
Environment and energy · 20 Miljö och energi
Opdateret: Kontrolleret:
Public consumption at constant prices Figure 6.5
Offentlig konsumtion i fasta priser
100
105
110
115
120
125
130
135
140
2000 2001 2002 2003 2004 2005 2006 2007 2008 2009
Denmark
Finland
Iceland
Norway
Sweden
EU-15
Index 2000=100
Naac01 Source: Eurostat and national statistical institutes.
Environment and energy · 20 Miljö och energi
Opdateret: Kontrolleret:
Gross fixed capital formation at constant prices Figure 6.6Fasta bruttoinvesteringar i fasta priser
60
80
100
120
140
160
180
200
2000 2001 2002 2003 2004 2005 2006 2007 2008 2009
Denmark
Finland
Iceland
Norway
Sweden
EU-15
Index 2000=100
Naac01 Source: Eurostat and national statistical institutes.
finanspolitiska initiativ för att stödja den ekonomiska tillväxten samt den finansiella sektorn och näringslivet – och behovet av att finansiera högre sociala utgifter på grund av krisen.
Sedan 2008 har Island upplevt en nedgång i bruttoinvestering-arna. Detta är efter många år med en isländsk tillväxt som har drivits av investeringar, vilka har mer än tredubblats de senaste tio åren. Island har också en ledande position i förhållande till de övriga nordiska länderna när det gäller tillväxt i privat och offent-lig konsumtion under åren 2000 till 2007.

89Economic trends · Ekonomiska tendenser
The primary sectorThe primary sector comprising agriculture, forestry, fishery and hunting only accounts for a small part of total employment in the Nordic countries: from nearly 2 per cent of employment in Swe-den, to 5 per cent of employment in Iceland. However, the sector forms indirectly the basis for a considerable part of production and employment. This is partly due to the fact that products from agri culture, forestry, fishery and hunting are used as raw mate-rials in manufacturing and in other industries, and partly that many goods and services are required by the capital-intensive primary sector, such as agricultural machinery, wood-cutting equipment, fishing vessels, etc., and maintenance and services incidental to this machinery and equipment.
The primary sector also – both directly and indirectly – accounts for substantial exports in the Nordic countries. For example, two-thirds of all Danish agricultural products are exported. In Sweden and Finland – and to a smaller extent in Norway – for-estry and the associated industries – wood industry and paper industry – ac count for a considerable share of total exports. In Norway, fishery plays a major role, and in Iceland, the Faroe Islands and Greenland fishery is by far the dominant industry, both with respect to production and exports.
BasnäringarnaBasnäringarna, jordbruk, skogsbruk, fiske och jakt, står i dag för en anspråks lös del av den samlade sysselsättningen i de nordiska länderna: från 2 procent i Sverige till 5 procent på Island. Indirekt utgör emellertid dessa näringar grunden för en mycket betydande produktion och sysselsättning, dels därför att produkterna från jordbruk, skogsbruk, fiske och jakt ingår som råvaror i industrin och andra näringar, dels därför att bas näringarna, som är mycket kapitalkrävande, har behov av många varor och tjänster som t.ex. lantbruksmaskiner, skogs-maskiner, fiskebå tar m.m. samt underhåll och service för all denna utrustning.
Basnäringarna svarar också, både direkt och indirekt, för en ansenlig export i Nor den. I Danmark exporterar jordbruket två tredjedelar av sin produktion till utlandet. I Sverige och Finland, samt i mindre omfattning i Norge, är det skogs bruket och de anknutna näringsgrenarna, trä- och pappersindustri, som utgör en betydande del av den samlade exporten. I Norge spelar fisket en betydande roll, och på Island, Färöarna och Grönland är det den helt dominerande näringen, såväl när det gäller produktion som export.
Environment and energy · 20 Miljö och energi
Opdateret:
Agriculture, forestry and fishery Figure 6.7 Jordbruk, skogsbruk och fiske Kontrolleret:
2
3
4
5
6
7
8
9
10
11
12
1991 1993 1995 1997 1999 2001 2003 2005 2007 2009
Denmark
Finland
Åland
IcelandNorway
Sweden
Per cent of total employment
Naac08
Source: Eurostat and national statistical institutes.
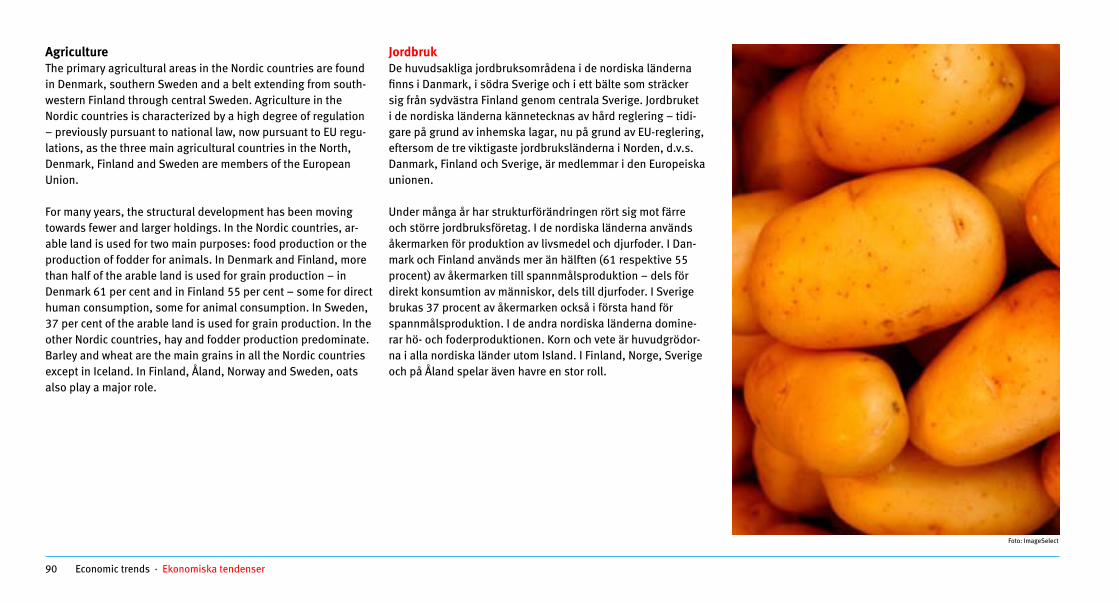
90 Economic trends · Ekonomiska tendenser
AgricultureThe primary agricultural areas in the Nordic countries are found in Denmark, southern Sweden and a belt extending from south-western Finland through central Sweden. Agriculture in the Nordic countries is characterized by a high degree of regulation – previously pursuant to national law, now pursuant to EU regu-lations, as the three main agricultural countries in the North, Denmark, Finland and Swe den are members of the European Union.
For many years, the structural development has been moving towards fewer and larger holdings. In the Nordic countries, ar-able land is used for two main purposes: food produc tion or the production of fodder for animals. In Denmark and Finland, more than half of the arable land is used for grain production – in Denmark 61 per cent and in Finland 55 per cent – some for direct human consumption, some for animal con sumption. In Sweden, 37 per cent of the arable land is used for grain production. In the other Nordic countries, hay and fodder production predominate. Barley and wheat are the main grains in all the Nordic countries except in Iceland. In Finland, Åland, Norway and Sweden, oats also play a major role.
JordbrukDe huvudsakliga jordbruksområdena i de nordiska länderna finns i Danmark, i södra Sverige och i ett bälte som sträcker sig från sydvästra Finland genom centrala Sverige. Jordbruket i de nordiska länderna kännetecknas av hård reglering – tidi-gare på grund av inhemska lagar, nu på grund av EU-reglering, eftersom de tre viktigaste jordbruksländerna i Norden, d.v.s. Danmark, Finland och Sverige, är medlemmar i den Europeiska unionen.
Under många år har strukturförändringen rört sig mot färre och större jordbruks företag. I de nordiska länderna används åkermarken för produktion av livsmedel och djur foder. I Dan-mark och Finland används mer än hälften (61 respektive 55 pro cent) av åkermarken till spannmålsproduktion – dels för direkt konsumtion av människor, dels till djurfoder. I Sverige brukas 37 procent av åkermarken också i första hand för spannmålsproduktion. I de andra nordiska länderna domine-rar hö- och foderproduktionen. Korn och vete är huvudgrödor-na i alla nordiska länder utom Island. I Finland, Norge, Sverige och på Åland spelar även havre en stor roll.
Foto: ImageSelect

91Economic trends · Ekonomiska tendenser
Environment and energy · 21 Miljö och energi
Opdateret: 26. juli 2010 Kontrolleret:
Crop and grain production. 2009 Table 6.2Produktion av grödor och spannmål
Denmark Finland Åland Iceland Norway Sweden
1 000 tonnes 1 000 ton
Crops GrödorPotatoes 1 699 755 19 10 1 387 858 PotatisSugar beets 2 182 559 5 0 398 2 406 SockerbetorFodder beets 324 .. - 0 .. .. FoderbetorLey and other fodder crops
plants23 773 8 370 .. 2 105 2 718 4 820 Vall och andra foderväxter
Oleiferous 635 140 0 0 7 317 växter
grain 233 46 0 0 .. 320 ndsäd
Olje Grain Spannmål
Total 10 200 4 261 20 5 .. 5 242 TotaltWheat 5 996 887 8 0 240 2 278 VeteRye 245 42 1 0 27 218 RågBarley 3 421 2 171 4 5 435 1 681 KornOats 305 1 115 7 0 245 744 HavreMixed Bla
Agri04 and Agri05 Source: National statistical institutes, Information Centre of the Ministry of Agriculture and Forestry, Finland and the Swedish Board of Agriculture. Note: Denmark and Norway: Crops: 2008 figures. Not: Danmark och Norge: Grödor: 2008 års uppgifter.
Did you know that … half the Nordic potato and grain is produced in Denmark.
Visste du att ... hälften av den nordiska potatisen och spannmålen produceras i Danmark.
Foto: ImageSelect

92 Economic trends · Ekonomiska tendenser
ForestryThe forest is a major resource in Finland and Sweden and, to a lesser extent, in Norway. It is only a very limited resource in Denmark. Iceland has very small for ests, and Greenland and the Faroe Islands have no forest because of the climate. There is considerable production of wood for industrial use in Finland and Swe den. For example, Finland and Sweden together represent 13.5 per cent of the world production of wood pulp, which is a major export item for these two countries.
SkogsbrukSkogen är en stor resurs i Finland och Sverige och, i mindre utsträckning, i Norge. I Danmark finns lite skog och i synnerhet på Island är den endast en mycket begränsad resurs. Grönland och Färöarna har ingen skog alls. Orsaken är klimatet.
Det finns en avsevärd produktion av virke för industribruk, sär-skilt i Finland och Sverige. Exempelvis står Finland och Sve rige tillsammans för 13,5 procent av världsproduktionen av pap-persmassa, som är en stor exportprodukt för dessa två länder.
22 Environment and energy · Miljö och energi
Opdateret: 27. juli 2010 Kontrolleret:
Production of forest products. 2008 Table 6.3Produktion av träprodukter
Denmark Finland Norway Sweden
1 000 kubikmeter 1 000 cubic meter
Industrial roundwood 1 680 45 965 8 071 63 100 Industriellt rundvirkeSaw logs and veneer logs 891 19 893 3 969 32 300 Sågtimmer och fanerstockWood-based panels 446 1 680 498 875 Träpanel
1 000 tonnes 1 000 ton
Wood pulp 5 11 624 2 254 12 227 Pappersmassa Paper and paperboard 418 13 549 1 900 12 374 Papper och papp
Per cent of world production Procent av världsproduktionen
Industrial roundwood 0.1 3.0 0.5 4.1 Industriellt rundvirke Sawlogs and veneer logs 0.1 2.2 0.4 3.6 Sågtimmer och fanerstock Wood-based panels 0.2 0.6 0.2 0.3 TräpanelWood pulp 0.0 6.6 1.3 6.9 Pappersmassa
0.1 4.2 0.6 3.8 Paper and paperboard Papper och papp
Fore07 Source: FAO.
Foto: BeeLine

93Economic trends · Ekonomiska tendenser
FisheryIn the three largest Nordic fishing nations, Denmark, Iceland and Norway, cod fish and herring for consumption dominate the catch. Mackerel has always been an important fish for con-sumption in Norway. In Norway and Iceland, a large quantity of capelin is caught, which is used as raw material for the oil and fish meal industry. In Denmark, it is mainly sand eel that is used in the oil and fish meal industry. In Denmark sprat is also used, and in Norway most of the catch of blue whiting goes to the fish meal industry.
For the Faroe Islands, Greenland and Iceland, fishery is the hub of the econ omy, but fishery also has a measurable impact on the national budget in Denmark and Norway. In Greenland, al-most 90 per cent of the export value stems from fishing. In Ice-land, the percentage is 42 and, in Denmark and Norway respec-tively, about 4 per cent and 6 per cent. Cod is the most valuable and import ant catch for Denmark, Iceland and Norway.
Fish farming is especially important in Norway, where the production of salmon is predominant. Rainbow trout is farmed in all the Nordic countries. Eels in greater volumes are only farmed in Denmark.
FiskeI de tre största nordiska fiskenationerna, Danmark, Island och Norge, domineras fångsten av torsk och sill för konsum-tion. Makrill har alltid varit en viktig fisk för konsumtion i Norge. Norge och Island fångar en stor kvantitet lodda, som används som råmaterial i olje- och fiskmjölsindustrin. I Danmark är det huvudsak ligen tobis som används i olje- och fiskmjölsin dustrin. I Danmark används också skarpsill och i Norge används mesteparten av kolmulefångsten till fisk-mjölsproduktion.
För Färöarna, Grönland och Island är fisket basen i ekono-min. Fisket har också en mätbar inverkan på den nationella budgeten i Danmark och Norge. På Grönland kommer nästan 90 procent av exportvärdet från fisket. För Island är procent-talet över 36 procent och i Danmark och Norge 4 respektive 6 procent. Torsk är den mest värdefulla och viktiga fångsten för Danmark, Island och Norge.
Fiskodling är särskilt viktigt i Norge, där laxodling domine-rar. Regnbågslax odlas i alla de nordiska länderna, ål dock i större voly mer endast i Danmark.
Environment and energy · 20 Miljö och energi
Opdateret: Kontrolleret:
Value of catches of fish Figure 6.8
Värde av fiskefångst
25
50
75
100
125
150
175
200
225
250
275
1991 1993 1995 1997 1999 2001 2003 2005 2007 2009
Denmark
Greenland
Finland
Iceland
Norway
Sweden
Index 1990=100
Åland
Fish02
Source: Danish Directorate of Fisheries, Greenland Fisheries Licence Control Authority, Statistics Faroe Islands, Finnish Game and Fisheries Research Institute, Statistics Åland, Fisheries Association of Iceland, Norwegian Directorate of Fisheries and Swedish Board of Fisheries.
Foto: ImageSelect

94 Economic trends · Ekonomiska tendenser
Environment and energy · 23 Miljö och energi
Opdateret: 27. juli 2010. Kontrolleret:
Annual commercial catches of sea fish, value and volume. 2009 Table 6.4Årliga kommersiella fångster av fisk, värde och mängd
Denmark FaroeIslands
Greenland Finland Åland Iceland Norway Sweden
Million national currency Milj. nationell valutaTotal 2 211.2 .. 679.9 23.8 1.7 115 025.8 11 145.3 889.3 TotaltFlat fishes 352.2 .. 150.0 0.1 0.0 9 806.0 267.3 20.2 PlattfiskCodfishes 422.2 .. 85.2 1.0 0.6 64 681.1 5 466.4 182.3 TorskfiskOther sea water fishes 956.2 .. 20.8 15.1 0.3 38 660.2 4 661.4 412.8 Annan havsfiskCrustaceans and molluscs 454.3 .. 423.7 .. 0.1 1 878.5 746.7
Kräftdjur och blötdjur244.2
Freshwater fishes 26.4 .. 0.1 7.6 0.7 0.0 3.3 29.8 Sötvattensfisk
1 000 tonnes 1 000 ton
Total 777.7 351.9 109.7 117.5 2.1 1 121.3 2 526.0 207.1 TotaltFlat fishes 23.7 4.2 19.5 0.1 0.0 28.5 13.5 0.9 PlattfiskCodfishes 57.9 191.1 12.9 0.9 0.5 474.0 847.9 15.2 TorskfiskOther sea water fishes 639.8 144.9 7.9 113.4 1.4 610.6 1 576.7 185.1 Annan havsfiskCrustaceans and molluscs 55.6 11.7 69.3 .. .. 8.2 87.9
Kräftdjur och blötdjur3.9
Freshwater fishes 0.7 .. 0.0 3.2 0.2 0.0 0.4 2.0 Sötvattensfisk Fish02
Source: Danish Directorate of Fisheries, Greenland Fisheries Licence Control Authority, Statistics Faroe Islands, Finnish Game and Fisheries Research Institute, Statistics Åland, Fisheries Association of Iceland, Norwegian Directorate of Fisheries and Swedish Board of Fisheries. Note: Finland: Includes Åland. Greenland: 2008 figures. Not: Finland: Inkluderar Åland. Grönland: 2008 års uppgifter.
Foto: ImageSelect

95Economic trends · Ekonomiska tendenser
Manufacturing’s proportion of the economySince the late 1990s, the Nordic manufacturing industry has ac-counted for a slightly declining proportion of the gross domestic product, with Norway as a distinct exception. Here, the manu-facturing industry’s proportion of GDP has increased from about 30 per cent to 35–40 per cent since 1999 – with a continued increasing trend due to the large oil and natural gas sector.
Despite growing production, the manufacturing industry ac-counts for a decreasing proportion of total employment in the Nordic countries. Among the Nordic countries, Finland is today the number one Nordic industrial country, as the manufacturing industry in Finland accounts for the greatest proportion of the country’s jobs, i.e. 19 per cent. By way of comparison, Norway and Iceland account for 13 per cent of total employment.
Industrins andel av bruttonationalproduktenSedan slutet på 1990-talet har industrin i Norden stått för en svagt vikande andel av bruttonationalprodukten med Norge som ett markant undantag. Där har industrins andel av BNP sedan 1999 ökat från 30 till 35–40 procent – med en fortsatt stigande tendens. Det är den stora olje- och gasproduktionen som här spelar en roll.
Trots ökande produktion utgör industrin en sjunkande andel av den totala sysselsättningen i de nordiska länderna. Finland är i dag Nordens industriland nummer ett såtillvida att industrins andel av arbetsplatserna är högst i Finland, nämligen 19 pro-cent. Som jämförelse står industrin i Norge och på Island för 13 procent av den totala sysselsättningen.
Foto: ImageSelect
Environment and energy · 20 Miljö och energi
Manufacturing Figure 6.9Opdateret: Tillverkningsindustrin
Kontrolleret:
10
15
20
1991 1993 1995 1997
Denmark
25
30
35
40
45
1999 2001 2003 2005 2007 2009
Finland
Iceland
Norway
Sweden
Per cent of total gross value
EU-15
Faroe Islands
8
10
12
1991 1993 1995 1997 1999 2001 2003 2005 2007 2009
Denmark
Finland
Iceland
Norway
Åland
Sweden
t
EU-15
14
16
18
20
22 Per cent of total employmen
Faroe islands
Naac05 and Naac08 Source: Eurostat and national statistical institutes.

96 Economic trends · Ekonomiska tendenser
The service sector’s proportion of the economyThe service sector has increased drastically in all Nordic coun-tries in the last 15 years and today accounts for about three fourths of all employed persons. Denmark, Norway, Iceland, Sweden and Åland have the largest proportion of employed in the service sector, i.e. 75–80 per cent of those employed, while the corresponding figure is 70 per cent in Finland and 71 in the Faroe Islands.
The service sector is a little smaller if its proportion of total gross domestic product is measured compared to the share of employ-ment. In Norway, the service sector accounts for 58 per cent of GDP, in Iceland 67 per cent, in Finland 69 per cent, in Sweden for 73 per cent and in Denmark for 77 per cent.
The service sector includes retail and wholesale trade, hotels, restaurants, transportation, communication, financial services, real estate sale, renting, business services and other services such as teaching and care of children, sick persons and the elderly – services typically rendered by the public sector in the Nordic countries.
Servicesektorns andel av bruttonationalproduktenServicesektorn har växt markant i alla de nordiska länderna un-der de senaste 15 åren och står i dag för cirka tre fjärdedelar av all sysselsättning i Norden. Danmark, Norge, Island, Sverige och Åland har den största andelen sysselsatta inom servicesektorn, nämligen 75–80 procent, medan motsvarande siffra i Finland och på Färöarna är 70 respektive 71 procent.
Servicesektorn är något mindre när man mäter dess andel av den totala bruttonationalprodukten än när man ser på dess andel av sysselsättningen. I Norge svarar servicesektorn för 58 procent av BNP, på Island 67 procent, i Finland 69 procent, i Sverige 73 procent och i Danmark 77 procent.
Servicesektorn omfattar detalj- och grossisthandel, hotell, restauranger, transport, kommunikation, finansiella tjänster, fastighetsmäklarverksamhet, uthyrning, affärsverksamhet samt övriga tjänster som t.ex. undervisning och vård av barn, sjuka och gamla – tjänster som den offentliga sektorn vanligen tar hand om i de nordiska länderna.
Environment and energy · 20 Miljö och energi
Opdateret: The service sector Figure 6.10
Servicenäringarna Kontrolleret:
50
55
60
1991 1993 1995 1997
65
70
75
80
1999 2001 2003 2005 2007 200
Denmark
Finland
Iceland
Norway
Sweden
Per cent of total gross value
EU-15
Faroe Islands
9
62
64
66
68
1991 1993 1995 1997 1999 2001 2003 2005 2007 2009
FinlandIceland
Norway
Sweden
Åland
t
EU-15
Faroe Islands
70
72
74
76
78
80
82
Denmark
Per cent of total employmen
Naac05 and Naac08 Source: Eurostat and national statistical institutes.
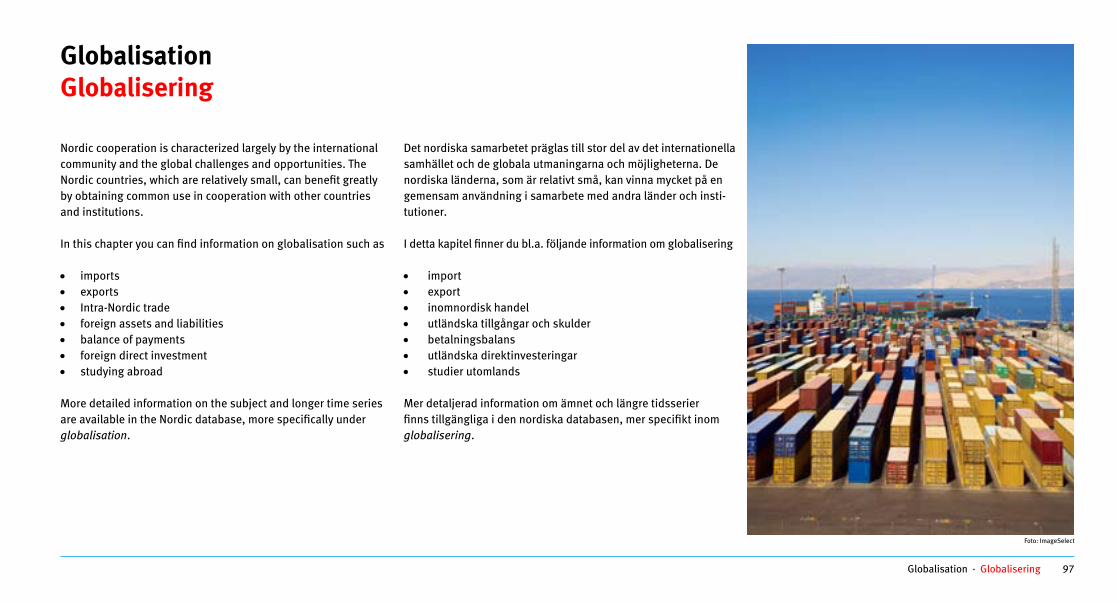
97Globalisation · Globalisering
GlobalisationGlobalisering
Nordic cooperation is characterized largely by the international community and the global challenges and opportunities. The Nordic countries, which are relatively small, can benefit greatly by obtaining common use in cooperation with other countries and institutions.
In this chapter you can find information on globalisation such as
• imports• exports• Intra-Nordic trade• foreign assets and liabilities• balance of payments• foreign direct investment• studying abroad
More detailed information on the subject and longer time series are available in the Nordic database, more specifically under globalisation.
Det nordiska samarbetet präglas till stor del av det internationella samhället och de globala utmaningarna och möjligheterna. De nordiska länderna, som är relativt små, kan vinna mycket på en gemensam användning i samarbete med andra länder och insti-tutioner.
I detta kapitel finner du bl.a. följande information om globalisering
• import• export• inomnordisk handel• utländska tillgångar och skulder• betalningsbalans• utländska direktinvesteringar• studier utomlands
Mer detaljerad information om ämnet och längre tidsserier finns tillgängliga i den nordiska databasen, mer specifikt inom globalisering.
Foto: ImageSelect

98 Globalisation · Globalisering
Small, open economies The Nordic countries are small, open economies and thus export-depending countries. Foreign trade constitutes an impor-tant part of the economic activity. Nordic foreign trade in goods, measured as the average of imports and exports, amounts to more than one fourth of GDP in the Nordic countries. The Nordic economies are on this account hit hard by the severe downturn in the global economy in the recent years.
All the Nordic countries have a surplus in their balance of trade in 2009. Every year since 1995 Denmark, Finland, Norway and Sweden have all had considerably greater exports than imports.
Små och öppna ekonomierDe nordiska länderna är små och därmed exportberoende län-der. Utrikeshandeln är en viktig del av den ekonomiska verksam-heten. Utrikesvaruhandeln, uttryckt som ett medelvärde av import och export, uppgår till mer än en fjärdedel av de nordiska ländernas BNP. De nordiska ekonomierna har därfor drabbats hårt av den kraftiga nedgången i den globala ekonomin under de senaste åren.
Alla nordiska länder hade ett överskott i sin handelsbalans 2009. Sedan 1995 har Danmark, Finland, Norge och Sverige varje år haft en betydligt större export än import.
Environment and energy · 20 Miljö och energi
Opdateret: Kontrolleret:
Exports Figure 7.1Export
60
110
160
210
260
310
360
1995 1997 1999 2001 2003 2005 2007 2009
Greenland
Faroe Islands
Finland
Iceland
Norway
Sweden
Index 1995=100
Denmark
Fotr44 Source: National statistical institutes and Eurostat.
Environment and energy · 20 Miljö och energi
Opdateret: Kontrolleret:
Exports and imports as per cent of GDP. 2009 Figure 7.2Export och import i procent av BNP
0
5
10
15
20
25
30
35
Denmark Finland Iceland Norway Sweden
Exports of goods and services Imports of goods and services
Per cent of GDP
Naac01, Fotr44 and Fotr43 Source: National statistical institutes and Eurostat.
Environment and energy · 20 Miljö och energi
Opdateret: Kontrolleret:
Imports Figure 7.3 Import
60
100
140
180
220
260
300
340
380
1995 1997 1999 2001 2003 2005 2007 2009
Sweden
Norway
Iceland
Finland
Faroe Islands
Greenland
Denmark
Index 1995=100 Fotr43
Source: National statistical institutes and Eurostat.

99Globalisation · Globalisering
Environment and energy · 20 Miljö och energi
Opdateret: Kontrolleret:
Trade balance of goods as per cent of GDP Figure 7.4Handelsbalans för varor i procent av BNP
-20
-15
-10
-5
0
5
10
15
20
1995 1997 1999 2001 2003 2005 2007 2009
Denmark
Finland
Iceland
Norway
Sweden
Per cent of GDP
Fotr41, Fotr42 and Naac01
Source: National statistical institutes and Eurostat.
20 Environment and energy · Miljö och energi
Opdateret: Kontrolleret:
Trade balance of goods Table 7.1Handelsbalans för varor
Denmark Faroe Islands Greenland Finland Iceland Norway Sweden
Million euro Miljoner euro
1990 1990Exports 28 973 328 355 17 041 1 247 26 560 45 192 ExportImports 26 023 265 350 17 327 1 301 21 341 43 067 ImportNet exports 2 951 63 5 - 285 - 54 5 220 2 125 Nettoexport
2009 2009 Exports 66 735 550 262 45 029 2 907 78 162 93 888 ExportImports 59 182 562 500 43 589 2 583 44 424 85 892 ImportNet exports 7 553 -12 -238 1 440 324 33 738 7 996 Nettoexport
Fotr49 Source. National statistical institutes and Eurostat.
Foto: ImageSelect

100 Globalisation · Globalisering
Intra-Nordic tradeThe trade between the Nordic countries is quite considerable. About one fifth of the countries’ foreign trade is trade with other Nordic countries. The total population of the Nordic countries of 25.0 million people makes them to a far greater extent depend-ent on each other with respect to exports and imports, compared to, e.g. Germany with a population of 83 million people. Swedish exports to the other Nordic countries account for a considerably higher share than combined Swedish exports to Germany and France – despite the fact that the total population of Germany and France is 146 million people, while Denmark, Finland, Ice-land and Norway only have a total population of 15 million.
In 2009, 25 and 22 per cent of the total exports from Sweden and Denmark went to other Nordic countries. Other Nordic coun-tries account for 15 per cent of Finnish exports, 11 per cent of Norwegian exports and only 10 per cent of the total exports in Iceland.
Inomnordisk handelDen inomnordiska handeln är tämligen omfattande. Ungefär en femtedel av utrikeshandeln sker med andra nordiska länder. De nordiska länderna med tillsammans 25,0 miljoner invånare är export- och importmässigt mer beroende av varandra än t.ex. av Tyskland med 83 miljoner invånare. Sveriges export till övriga Norden är väsentligt större än den svenska exporten till Tyskland och Frankrike tillsammans trots att den sammanlagda folk-mängden i Tyskland och Frankrike är hela 146 miljoner, medan summan av invånarantalet i Danmark, Finland, Island och Norge endast uppgår till 15 miljoner.
År 2009 gick 25 respektive 22 procent av Sveriges och Danmarks samlade export till andra nordiska länder. För Finlands del upp-går exporten till det övriga Norden till 15 procent, för Norges del till 11 procent, och för Islands del endast till 10 procent av den totala exporten.
Environment and energy · 20 Miljö och energi
Opdateret: Kontrolleret:
Intra-Nordic trade Figure 7.5 Inomnordisk handel
8
10
12
14
2000 2001 2002
16
18
20
22
24
26
2003 2004 2005 2006 2007 2008 2009
Denmark
Finland
Iceland
Norway
Sweden
Per cent of total exports
18
20
22
24
26
28
30
2000 2001 2002 2003 2004 2005 2006 2007 2008 2009
Denmark
Finland
Iceland
Norway
Sweden
Per cent of total imports
Fotr43 and Fotr44
Source: National statistical institutes and Eurostat.
Intra-Nordic trade Figure 7.5Inomnordisk handel
Per cent of total exports26
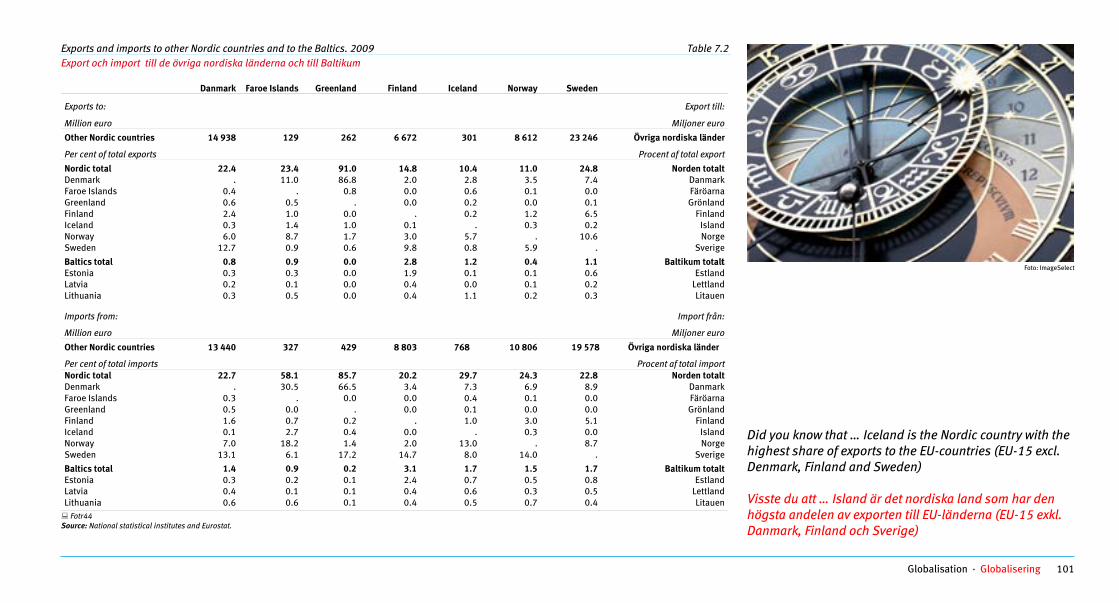
101Globalisation · Globalisering Environment and energy · 21 Miljö och energi
Opdateret: Kontrolleret:
Exports and imports to other Nordic countries and to the Baltics. 2009 Table 7.2 Export och import till de övriga nordiska länderna och till Baltikum
Danmark Faroe Islands Greenland Finland Iceland Norway Sweden
Exports to: Export till:
Million euro Miljoner euro
Other Nordic countries 14 938 129 262 6 672 301 8 612 23 246 Övriga nordiska länder
Per cent of total exports Procent af total export
Nordic total 22.4 23.4 91.0 14.8 10.4 11.0 24.8 Norden totalt Denmark . 11.0 86.8 2.0 2.8 3.5 7.4 Danmark Faroe Islands 0.4 . 0.8 0.0 0.6 0.1 0.0 Färöarna Greenland 0.6 0.5 . 0.0 0.2 0.0 0.1 Grönland Finland 2.4 1.0 0.0 . 0.2 1.2 6.5 Finland Iceland 0.3 1.4 1.0 0.1 . 0.3 0.2 Island Norway 6.0 8.7 1.7 3.0 5.7 . 10.6 Norge Sweden 12.7 0.9 0.6 9.8 0.8 5.9 . Sverige Baltics total 0.8 0.9 0.0 2.8 1.2 0.4 1.1 Baltikum totalt Estonia 0.3 0.3 0.0 1.9 0.1 0.1 0.6 Estland Latvia 0.2 0.1 0.0 0.4 0.0 0.1 0.2 Lettland Lithuania 0.3 0.5 0.0 0.4 1.1 0.2 0.3 Litauen
Imports from: Import från:
Million euro Miljoner euro
Other Nordic countries 13 440 327 429 8 803 768 10 806 19 578 Övriga nordiska länder
Per cent of total imports Procent af total import Nordic total 22.7 58.1 85.7 20.2 29.7 24.3 22.8 Norden totalt Denmark . 30.5 66.5 3.4 7.3 6.9 8.9 Danmark Faroe Islands 0.3 . 0.0 0.0 0.4 0.1 0.0 Färöarna Greenland 0.5 0.0 . 0.0 0.1 0.0 0.0 Grönland Finland 1.6 0.7 0.2 . 1.0 3.0 5.1 Finland Iceland 0.1 2.7 0.4 0.0 . 0.3 0.0 Island Norway 7.0 18.2 1.4 2.0 13.0 . 8.7 Norge Sweden 13.1 6.1 17.2 14.7 8.0 14.0 . Sverige Baltics total 1.4 0.9 0.2 3.1 1.7 1.5 1.7 Baltikum totalt Estonia 0.3 0.2 0.1 2.4 0.7 0.5 0.8 Estland Latvia 0.4 0.1 0.1 0.4 0.6 0.3 0.5 Lettland Lithuania 0.6 0.6 0.1 0.4 0.5 0.7 0.4 Litauen
Exports and importother Nordic countand to the Baltics.
Fotr44 Source: National statistical institutes and Eurostat.
Environment and energy · 20 Miljö och energi
Opdateret: Kontrolleret:
Intra-Nordic trade Figure 7.5 Inomnordisk handel
8
10
12
14
2000 2001 2002
16
18
20
22
24
26
2003 2004 2005 2006 2007 2008 2009
Denmark
Finland
Iceland
Norway
Sweden
Per cent of total exports
18
20
22
24
26
28
30
2000 2001 2002 2003 2004 2005 2006 2007 2008 2009
Denmark
Finland
Iceland
Norway
Sweden
Per cent of total imports
Fotr43 and Fotr44
Source: National statistical institutes and Eurostat.
Intra-Nordic trade Figure 7.5Inomnordisk handel
Per cent of total exports26
Did you know that … Iceland is the Nordic country with the highest share of exports to the EU-countries (EU-15 excl. Denmark, Finland and Sweden)
Visste du att … Island är det nordiska land som har den högsta andelen av exporten till EU-länderna (EU-15 exkl. Danmark, Finland och Sverige)
Foto: ImageSelect

102 Globalisation · Globalisering
Nordic exports to and imports from selected countries. 2009 Table 7.3 Nordisk export till och import från vissa länder och regioner Opdateret:
Denmark Faroe Is-lands
Greenland Finland Iceland Norway Sweden
Pe Kontrolleret:
r cent rocent P
Expo rts to: ort till: Exp
Total 100.0 100.0 100.0 100.0 100.0 100.0 100.0 Totalt Nordic countries 22.4 23.4 91.0 14.8 10.4 11.0 24.8 Norden EU-15 (excl. DK, FI, SE) 46.2 46.1 5.1 35.5 71.2 66.5 39.1 EU-15 (exkl. DK, FI, SE) 12 new EU-countries 5.9 3.5 0.0 8.4 2.6 2.9 5.5 De 12 nya EU-länderna Russia 1.6 4.0 0.0 8.9 1.2 0.8 1.4 Ryssland Other Europe 2.2 1.1 0.0 3.4 1.8 1.4 2.9 Övriga Europa USA and Canada 7.1 8.4 3.9 8.8 4.4 7.1 7.3 USA och Kanada Other America 1.9 3.1 0.0 2.8 0.3 0.9 2.1 Övriga Amerika Japan 2.0 1.3 0.0 1.6 1.9 1.0 1.3 Japan DAEs 3.2 1.7 0.0 3.2 1.0 3.6 2.5 DAE-länderna China 2.3 2.3 0.0 4.1 2.6 2.1 3.1 Kina India 0.4 0.0 0.0 1.0 0.0 0.5 1.3 Indien Rest of the world 4.9 5.0 0.0 7.5 2.6 2.2 8.8 Övriga världen
Imports from: Import från:
Total 100.0 100.0 100.0 100.0 100.0 100.0 100.0 Totalt Nordic countries 22.7 58.1 85.7 20.2 29.7 24.3 22.8 Norden EU-15 (excl. DK, FI, SE) 48.4 17.8 6.7 39.7 31.5 35.9 46.2 EU-15 (exkl. DK, FI, SE) 12 new EU-countries 6.6 4.5 0.8 7.2 4.1 6.9 7.9 De 12 nya EU-länderna Russia 0.8 0.2 0.0 16.1 0.7 1.5 3.6 Ryssland Other Europe 2.3 0.6 0.8 1.4 3.5 2.2 1.8 Övriga Europa USA and Canada 3.8 1.8 1.1 2.8 8.8 8.3 4.1 USA och Kanada Other America 1.9 9.0 0.3 1.7 7.6 2.6 1.4 Övriga Amerika Japan 0.5 1.0 0.9 1.0 3.3 2.5 1.8 Japan DAEs 4.1 1.1 0.6 2.2 2.0 4.2 2.6 DAE-länderna China 6.3 4.3 2.0 5.3 5.0 7.8 4.8 Kina India 0.8 0.4 0.2 0.4 0.8 0.5 0.5 Indien Rest of the world 1.8 1.3 0.9 2.2 3.1 3.2 2.5 Övriga världen
Nordic exports to and imports from selected countries. 2009
Fotr49 Source: National statistical institutes and Eurostat. Note: DAEs (Dynamic Asian Economies): Hong Kong, Malaysia, Singapore, South Korea, Taiwan and Thailand. Not: DAE-länderna (Dynamiska asiatiska ekonomier): Hongkong, Malaysia, Singapore, Sydkorea, Taiwan och Thailand.
22 Environment and energy · Miljö och energi
Environment and energy · 20 Miljö och energi
Opdateret: Nordic exports and imports. 2009 Figure 7.6
Nordisk export och import Kontrolleret:
19%
48%
8%
13%
5%
6%
Nordic countries - 19%
EU-15 (excl. DK,SE and FI) - 48%
EU-12 (new EU-members) - 6%
Other Europe - 5%
United States and Canada - 8%
Rest of the world - 13%
Exports, per cent of total
Imports, per cent of to
6%
23%
45%
7%
5%
14%
Nordic countries - 23%
EU-15 (excl. DK,SE and FI) - 45%
EU-12 (new EU-members) - 6%
Other Europe - 7%
United States and Canada - 5%
Rest of the world - 14%
tal
Fotr49
Source: National statistical institutes and Eurostat.

103Globalisation · Globalisering
Exports EU-15 and the Nordic countries are the largest trade partners when it comes to exports – especially Germany. USA is also a major trading partner.
A common characteristic in the exports of the Nordic countries is a concentration on a few products. The exports of Greenland and the Faroe Islands are entirely dominated by fish and fish prod-ucts, to a lesser extent in Iceland where aluminium exports also contribute significantly. Oil and gas are the predominant prod-ucts exported by Norway, and Finnish exports are dominated by wood, paper and paper products and telecommunication equip-ment. Danish and Swedish exports are more equally distri buted on different products, with processed food, pharmaceuticals and chemical products as the major Danish export products and cars, wood, paper products and telecommunication equipment as predominant in Swedish exports.
Imports Germany is completely dominant when it comes to Nordic imports. However, the Nordic countries also have considerable imports from the Netherlands and the United Kingdom. As something quite new, China is now also among the countries from which the Nordic countries buy goods for large amounts of money. Iceland imports a lot from the United States, and Finland from Russia.
ExportNär det gäller export av varor är handeln störst med EU-15, de nordiska länderna och, framför allt, Tyskland. USA är också en stor handelspartner.
Gemensamt för de nordiska ländernas export är koncentra-tionen på ett begränsat antal produkter. Grönlands och Färö-arnas export domineras helt av fisk och fiskprodukter, något som också, om än mindre uttalat, gäller Island, vars alumi-niumexport bidrar med en ansenlig del av exporten. Norges export domineras av olja och gas, Finlands av trä varor, pap-per och pappersvaror samt telekom utrustning. Dansk och svensk export är mer jämnt fördelad på ett antal huvudsakliga exportvaror, i Danmarks fall livsmedelsprodukter, mediciner och kemiska produkter och i Sveriges fall bilar, trävaror, pap-persprodukter och telekomutrustning.
Import Tyskland dominerar också helt de nordiska ländernas im-port. Norden har emellertid också en betydande import från Nederländerna och Storbritannien. Nytt är att även Kina nu kan räknas till de länder som Norden köper varor från för betydande summor. Island importerar mycket från USA och Finland från Ryssland.
Foto: ImageSelect

104 Globalisation · Globalisering
Exports by commodity. 2009
Opdateret: Kontrolleret: Exports by commodity. 2009 Table 7.4 Export, fördelning på varor
Denmark Faroe Islands Greenland Finland Iceland Norway Sweden
Million euro Miljoner euro
Total 66 735 550 262 45 029 2 907 78 162 93 888 Totalt
Per cent Procent
Total 100.0 100.0 100.0 100.0 100.0 100.0 100.0 Totalt Food and live animals 17.2 88.0 87.8 2.0 41.2 6.3 4.1 Livsmedel och levande djur Beverage and tobacco 0.8 0.0 0.0 0.3 0.1 0.1 0.7 Drycker och tobak Crude materials, inedible 3.2 1.8 5.8 4.8 1.2 1.0 6.1 Råvaror, icke ätbara Mineral fuels, lubricants and related materials 8.9 2.8 0.0 6.4 1.0 64.4 6.4 Mineralbränslen, smörjoljor och tillhörande material Animal and vegetable oils, fats and waxes 0.5 0.1 0.0 0.0 1.9 0.1 0.2 Animaliska och vegetabilska oljor och fetter Chemicals and related products 10.7 0.1 0.0 7.8 2.7 3.3 12.9 Produkter av kemiska och närstående industrier Manufactured goods classified chiefly by material 9.9 0.7 0.2 24.6 38.9 8.0 18.7 Bearbetade varor Machinery and transport equipment 25.0 6.3 0.8 41.0 10.5 11.0 37.3 Mask. och apparater samt transportmedel Miscellaneous manufactured articles 14.8 0.2 0.5 6.0 1.9 2.8 10.0 Diverse färdiga varor Other commodities and transactions 2.6 0.0 4.8 0.3 0.5 3.1 0.6 Övriga varor
Fotr46 Source: National statistical institutes and Eurostat.
Environment and energy · 21 Miljö och energi
Foto: ImageSelect

105Globalisation · Globalisering
Imports by com-modity 2009 Import,
Opdateret: Kontrolleret: Imports by commodity. 2009 Table 7.5 Import, fördelning på varor
Denmark Faroe Islands Greenland Finland Iceland Norway Sweden
Million euro Miljoner euro
Total 59 182 562 500 43 589 2 583 44 424 85 892 Totalt
Per cent Procent
Total 100.0 100.0 100.0 100.0 100.0 100.0 100.0 Totalt Food and live animals 11.9 14.0 21.1 6.1 9.4 6.4 8.5 Livsmedel och levande djur Beverage and tobacco 1.4 1.8 3.8 1.1 1.6 1.1 1.1 Drycker och tobak Crude materials, inedible 2.6 3.6 1.6 6.1 13.7 5.9 3.1 Råvaror, icke ätbara Mineral fuels, lubricants and related materials 6.5 15.8 17.4 14.7 12.3 4.7 11.6 Mineralbränslen, smörjoljor och tillhörande material Animal and vegetable oils, fats and waxes 0.7 1.3 0.1 0.1 0.5 0.7 0.4 Animaliska och vegetabilska oljor och fetter Chemicals and related products 11.7 8.8 6.6 11.4 10.3 10.1 12.7 Produkter av kemiska och närstående industrier Manufactured goods classified chiefly by material 14.1 11.9 14.4 12.3 11.5 15.4 13.6 Bearbetade varor Machinery and transport equipment 33.4 29.9 22.3 34.1 29.3 39.3 36.0 Mask. och apparater samt transportmedel Miscellaneous manufactured articles 15.9 12.8 12.3 10.9 11.3 15.8 12.7 Diverse färdiga varor Other commodities and transactions 1.5 0.1 0.4 0.1 0.1 0.6 0.2 Övriga varor
Fotr45 Source: National statistical institutes and Eurostat.
22 Environment and energy · Miljö och energi
Foto: ImageSelect

106 Globalisation · Globalisering
Foreign assets and liabilitiesRecent years’ large balance-of-payments surplus in Denmark, Finland, Norway and Sweden has reduced the countries’ foreign debt. In addition to a balance-of-payments surplus or deficit, the size of a country’s foreign debt and foreign assets is affected by the exchange rate and the price of securities.
Consequently, Finland’s foreign debt increased noticeably when the price of technology shares increased drastically in the late 1990s due to a large proportion of these shares being owned by persons, funds and companies abroad. In this way, these foreign owners held a greater claim on Finland. When share prices decreased dras-tically in 1999–2001 – especially those of technology shares – it also led to a marked decrease in Finland’s net foreign debt.
Iceland’s foreign debt has increased considerably and today the net debt accounts for more than three and a half times of GDP. This means that Iceland (in net terms) owes the surround-ing world values corresponding to 3.7 times the country’s total production.
Utländska tillgångar och skulderSenare års stora överskott i betalningsbalansen i Danmark, Fin-land, Norge och Sverige har minskat ländernas skuld till utlan-det. Förutom över- eller underskott i betalningsbalansen påver-kas storleken av ett lands utlandsskuld och utländska tillgångar av kurserna på valuta och värdepapper. Därför ökade Finlands utlandsskuld markant, när kurserna på IT-aktier steg våldsamt i
slutet på 90-talet, eftersom en stor del av dessa aktier ägdes av personer, fonder och företag i ut landet. De utländska ägarna fick därmed ett större krav på Finland. När aktiekurserna 1999–2001 sjönk drastiskt – särskilt kurserna på IT-aktier – medförde det på samma sätt en markant nedgång i Finlands nettoskuld till omvärlden. Islands utlandsskuld har ökat avsevärt och i dag står nettoskul-den för mer än tre och en halv gånger BNP. Detta innebär att Islands nettoskuld till omvärlden motsvarar 3,7 gånger landets totala produktion.
Foreign assets and liabilities. End of 2009 Utländska
Opdateret: 20/8-2010 af uag Kontrolleret:
Foreign assets and liabilities. End of 2009 Table 7.6 Utländska tillgångar och skulder
Denmark Faroe Islands Finland Iceland Norway Sweden
Million national currency Miljoner nationell valuta
Assets 4 098 16 440 8 964 6 304 8 726 TillgångarLiabilities 3 998 14 452 14 531 4 175 9 007 SkulderNet assets 100 1 -12 -5 566 2 129 -281 Nettotillgångar
Per cent of GDP Procent av BNPNet assets 6 11 -9 -371 88 -9 Nettotillgångar
Naac10 Source: Bank of Finland, Central Bank of Iceland and national statistical institutes. Note: Faroe Islands: 2008 data. Not: Färöarna: 2008 års uppgifter.
Environment and energy · 23 Miljö och energi
Environment and energy · 20 Miljö och energi
Opdateret: Kontrolleret: Net foreign assets by end of year Figure 7.7 Utländska tillgångar netto vid årets slut
-400
-350
-300
-250
-200
-150
-100
-50
0
50
100
1991 1993 1995 1997 1999 2001 2003 2005 2007 2009
Denmark
Finland
Iceland
Norway
Sweden
Faroe Islands
Per cent of GDP
Naac10 Source: Bank of Finland, Central Bank of Iceland and national statistical institutes.

107Globalisation · Globalisering
Balance of paymentsThe balance of payments is a statement of the values of econom-ic transactions between the domestic economy and the rest of the world over a year. Exports and imports of goods are the larg-est items on the balance of payments, respectively the revenue and expenditure account of the balance of payments. In 2009, all Nordic countries except Iceland had a surplus on the total bal-ance of payments (current account, total). Norway accounts for a substantial foreign exchange surplus, which is due to revenue from exports of oil and gas.
Betalningsbalans Betalningsbalansen är en redovisning av ett lands ekonomiska utbyte med utlandet under loppet av ett år. Exporten och impor-ten av varor utgör de största posterna på intäkts- respektive ut-giftssidan av betalningsbalansen. Med undantag för Island hade de nordiska länderna under 2009 överskott i den sammanlagda betalningsbalansen (bytesbalansen). Det norska valutaöverskot-tet är extremt stort på grund av landets intäkter genom export av olja och gas.
Opdateret: 20/8-2010 af uag Kontrolleret: Balance of payments, current account surplus Table 7.7 Bytesbalansöverskott
Denmark Faroe Islands Finland Iceland Norway Sweden Euro-area Per cent of GDP Procent av BNP
1995 0.7 .. 4.2 0.7 3.6 3.4 0.6 19952000 1.4 9.9 8.1 -10.2 15.0 4.0 -0.7 20002005 4.3 0.4 3.6 -16.1 16.3 6.9 -0.2 20052006 2.9 -0.1 4.5 -25.4 17.2 8.5 -0.4 20062007 0.7 -4.7 4.1 -16.1 15.9 8.6 0.1 20072008 2.0 -2.8 2.0 -34.6 19.5 8.3 -1.7 20082009 4.0 .. 1.3 -3.3 13.9 7.4 -0.6 2009
Key01 and Naac09 Source: Eurostat. Bank of Finland. Central Bank of Iceland. the Swedish Central Bank and national statistical institutes.
Balance of pay-ments, current account surplus Bytesbalansövers
20 Environment and energy · Miljö och energi
Foto: ImageSelect
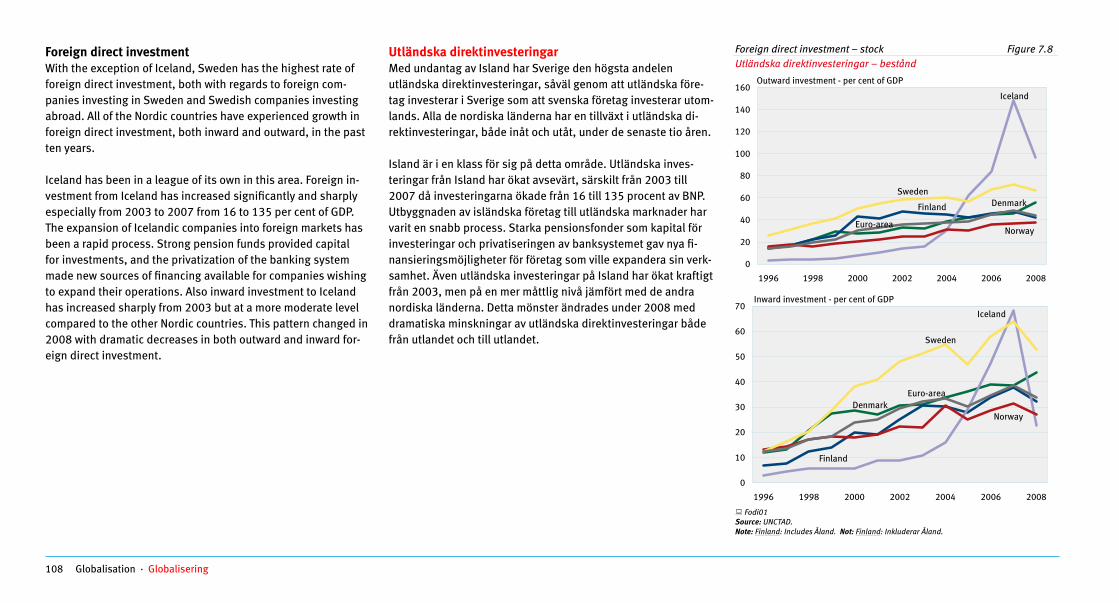
108 Globalisation · Globalisering
Foreign direct investmentWith the exception of Iceland, Sweden has the highest rate of foreign direct investment, both with regards to foreign com-panies investing in Sweden and Swedish companies investing abroad. All of the Nordic countries have experienced growth in foreign direct investment, both inward and outward, in the past ten years.
Iceland has been in a league of its own in this area. Foreign in-vestment from Iceland has increased significantly and sharply especially from 2003 to 2007 from 16 to 135 per cent of GDP. The expansion of Icelandic companies into foreign markets has been a rapid process. Strong pension funds provided capital for investments, and the privatization of the banking system made new sources of financing available for companies wishing to expand their operations. Also inward investment to Iceland has increased sharply from 2003 but at a more moderate level compared to the other Nordic countries. This pattern changed in 2008 with dramatic decreases in both outward and inward for-eign direct investment.
Utländska direktinvesteringar Med undantag av Island har Sverige den högsta andelen utländska direktinvesteringar, såväl genom att utländska före-tag investerar i Sverige som att svenska företag investerar utom-lands. Alla de nordiska länderna har en tillväxt i utländska di-rektinvesteringar, både inåt och utåt, under de senaste tio åren. Island är i en klass för sig på detta område. Utländska inves-teringar från Island har ökat avsevärt, särskilt från 2003 till 2007 då investeringarna ökade från 16 till 135 procent av BNP. Utbyggnaden av isländska företag till utländska marknader har varit en snabb process. Starka pensionsfonder som kapital för investeringar och privatiseringen av banksystemet gav nya fi-nansieringsmöjligheter för företag som ville expandera sin verk-samhet. Även utländska investeringar på Island har ökat kraftigt från 2003, men på en mer måttlig nivå jämfört med de andra nordiska länderna. Detta mönster ändrades under 2008 med dramatiska minskningar av utländska direktinvesteringar både från utlandet och till utlandet.
Environment and energy · 20 Miljö och energi
Opdateret: Kontrolleret:
Foreign direct investment – stock Figure 7.8 Utländska direktinvesteringar – bestånd
0
20
40
60
1996 1998
80
100
120
140
160
2000 2002 2004 2006 2008
DenmarkFinland
Iceland
Norway
Sweden
Outward investment - per cent of GDP
Euro-area
0
10
20
30
40
50
60
70
1996 1998 2000 2002 2004 2006 2008
Denmark
Finland
Iceland
Norway
Sweden
Inward investment - per cent of GDP
Euro-area
Fodi01
Source: UNCTAD. Note: Finland: Includes Åland. Not: Finland: Inkluderar Åland.
Foreign direct investment – stock Utländska direktinvesteringar –

109Globalisation · Globalisering
Studying abroad 43 400 full-time students from the Nordic countries were en-rolled for studies in another country than their own during the study year 2008/2009. The preferred country of study is Great Britain, where almost one-fourth of all Nordic students abroad are found. 14 per cent of the Nordic students abroad are en-rolled for studies in the United States or Canada, while 7 per cent chose Australia or New Zealand. Almost one in four Nordic students enrolled for full-time studies abroad have chosen an-other Nordic country, and Denmark is their preferred country. Nordic countries operate in many ways as a common market of education. If you are resident in a Nordic country, you have the right to seek admission to higher education throughout the Nor-dic region on the same terms as its own applicants.
Studier utomlandsStudieåret 2008/2009 läste 43 400 heltidsstuderande från de nordiska länderna i ett annat land än det egna hem landet. Det mest populära studielandet är Storbritannien, där nästan en fjärdedel av alla nordiska utlandsstuderande vistas. Av de nordiska utlandsstuderande läste 14 procent i USA eller Kanada medan 7 procent valde Australien eller Nya Zeeland. Nästan var fjärde nordisk student som läser på heltid utomlands har valt ett annat nordiskt land, och här är Danmark det vanligaste landet. Norden fungerar på många sätt som en gemensam marknad för utbildning. Om du är bosatt i ett nordiskt land har du rätt att få tillträde till högre utbildning i hela Norden på samma villkor som landets egna sökande.
Opdateret: Kontrolleret:
Miljö och energi 21
Nordic students abroad by destination. 2008/2009 Figure 7.9Nordiska studerande i utlandet efter studieland
0
10
20
30
40
50
60
70
80
90
100
Denmark Finland Åland Iceland Norway Sweden
Nordic Great Britain France, Italy and Spain USA and Canada Australia and New Zealand Other
Per cent of all students abroad
Educ05 Source: National statistical institutes, Social Insurance Institution of Finland and Icelandic Government Student Loan Fund.
Environment and energy ·

110 Public finance and prices · Offentlig ekonomi och priser
Public finance and pricesOffentlig ekonomi och priser
The Nordic countries are often characterized as public welfare societies be cause the public sector takes care of many different tasks in addition to defence and law and public order and safety. Tax rates are also among the highest in the world.
In this chapter you can find information on public finance and prices such as
• general government expenditure and revenue• budget deficit• debt• development aid• consumer prices• real estate prices• price levels• purchasing power• exchange rates• share prices • interest rate development
More detailed information on the subject and longer time series are available in the Nordic database, more specifically under public finance and prices.
De nordiska länderna betecknas ofta som välfärds samhällen, eftersom den of fentliga sektorn sköter många olika uppgifter förutom försvar och rättsväsende. Skatterna är också bland de högsta i världen.
I detta kapitel finner du bl.a. följande information om offentlig ekonomi och priser
• offentliga utgifter och inkomster• budgetunderskott• skuld• internationellt bistånd• konsumentpriser• fastighetspriser• prisnivåer• köpkraft• växelkurser• aktiekurser • ränteutveckling Mer detaljerad information om ämnet och längre tidsserier finns tillgängliga i den nordiska databasen, mer specifikt inom offent-lig ekonomi och priser.
Foto: ImageSelect

111Public finance and prices · Offentlig ekonomi och priser
General government expenditure In all the Nordic countries, a large proportion of government expenditure is spent on social goods, and all the countries share the same pattern of public expenditure – high levels of expendi-ture for social security, health care and education. A minor proportion is spent on investments in public buildings and to subsidize trade and industry.
Offentliga utgifterI alla nordiska länder går en stor del av utgifterna till sociala förmåner och i alla länderna visar de offentliga utgifterna samma mönster – höga utgiftsnivåer för social trygghet, sjukvård och utbildning. En mindre del används till inves-teringar i offentliga byggnader och för att subventionera närings livet.
Environment and energy · 20 Miljö och energi
Opdateret: 11/8-2010 af uag Kontrolleret:
General government expenditure by type of transaction. 2009 Table 8.1Offentliga utgifter efter transaktionstyp
Denmark Faroe Islands
Greenland Finland Iceland Norway Sweden
Million euro Miljoner euro Expenditure, total 130 442 984 1 177 95 015 4 477 126 363 160 620 Utgifter, totaltOf which consumption expenditure 66 090 521 854 42 887 2 268 61 111 81 312 Härav offentlig konsumtionIntermediate consumption 22 508 177 382 18 877 1 089 19 028 28 134 Kostnad för varor och tjänster i produktionenCompensation of employees 43 103 370 472 25 419 1 298 37 519 44 590 PersonalkostnaderTaxes, payable 395 0 .. 133 .. 0 3 488 Utgifter till skatterInterest payments1) Räntor m.m.1)4 776 22 .. 2 437 590 3 895 3 650Subsidies, payable 5 774 21 69 2 486 170 5 814 4 353 SubventionerSocial cash benefits 37 505 164 .. 30 462 712 37 410 47 806 Sociala kontantförmånerSocial transfers in kind 3 465 47 .. 4 524 1 6 337 10 140 Sociala naturaförmånerCurrent transfers to the private sector and the rest of the world
Transfereringar till den privata sektorn och till utlandet6 833 67 176 5 191 210 6 524 6 852
Gross capital formation2) Investeringar, brutto2)4 847 182 45 4 787 339 9 488 10 189Investment grants - - - - - - - InvesteringsbidragCapital transfers to other sectors Kapitaltransfereringar till övriga sektorer1 239 7 30 699 69 349 824
Pubs11 Source: Eurostat and national statistical institutes. Note: 1) Consolidated data = current and capital transfers and interest payments to other general government units eliminated. 2) Includes acquisitions less disposals of non-financial non-produced assets. Faroe Islands and Greenland: 2008 data.Not: 1) Konsoliderade uppgifter = löpande och kapitaltransfereringar samt räntor till andra offentliga myndigheter är eliminerade. 2) Inkluderar anskaffningar reducerade med disponibla icke-finansiella och icke-producerade tillgångar. Färöarna och Grönland: 2008 års uppgifter.

112 Public finance and prices · Offentlig ekonomi och priser
Environment and energy · 20 Miljö och energi
Opdateret: 10/8-2010 Kontrolleret:
General government expenditure by function. 2008 Table 8.2 Offentliga utgifter efter ändamål
Denmark Faroe Islands Greenland Finland Iceland Norway Sweden Per cent Procent
Total 100 100 96 100 100 100 100 Totalt General public services 13 11 11 13 11 11 14 Allmänna offentliga tjänster
Defence 3 0 3 3 0 4 3 FörsvarPublic order and safety 2 2 4 3 3 2 3 Rättsväsen etc. Economic affairs 6 15 11 10 34 9 9 Ekonomiska angelägenheter
Environmental protection 1 2 1 1 1 1 1 Miljöskydd Housing etc. 1 2 4 1 1 2 1 Bostäder etc.
Health 15 13 13 14 14 17 13 Hälsovård Recreation, culture and religion 3 2 4 2 7 3 2 Fritidsverksamhet, kultur och religion Education 14 18 19 12 14 13 13 Utbildning
Social protection 43 35 26 41 15 38 41 Social trygghet Pubs13
Source: Eurostat and national statistical institutes.
Opdateret: 10/8 -kea Kontrolleret: Størrelse: 17,7 x 6 Beskåret med 0,1 top og bund
General government expenditure by function. 2008 Figure 8.1 Offentliga utgifter efter ändamål
Environment and energy · 20 Miljö och energi
0
10
Denmark Faroe Islands Greenland Finland Iceland Norway Sweden
20
30
40
50
60
70
80
Social protection Education, recreation, culture and religionHealth Public order, safety and defenceExpenditure for other purposes
Per cent of GDP
Pubs13
Source: Eurostat.
General government expenditu

113Public finance and prices · Offentlig ekonomi och priser
General government revenueGeneral government expenditure is normally financed by means of taxes and social security contributions, which account for 34 to 48 per cent of GDP in the Nordic countries. The tax rate is highest in Denmark and lowest in Iceland.
In the Nordic countries, taxes and social security contributions account for 81 to 88 per cent of total public revenue. Norway has the lowest proportion. In addition to tax revenues, the Norwe-gian public sector has a relatively large capital reve nue, which may explain the lower tax burden in Norway.
The Nor dic countries have different tax structures. For example, income taxes are more im portant in Denmark than in the other Nordic countries. On the other hand, social security contribu-tions are of less importance in Denmark.
Offentliga inkomsterDe offentliga utgifterna finansieras vanligen med skatter och sociala avgifter, vilka i Norden utgör mellan 34 och 48 procent av BNP. Skattekvoten är högst i Danmark och lägst på Island.
Skatter och sociala avgifter i Norden svarar för 81–88 procent av de totala offent liga intäkterna. Norge har den lägsta ande-len. Förutom skatteinkomster har den norska offentliga sektorn relativt stora kapitalinkomster, vilket kan förklara det lägre skat-tetrycket i Norge.
Skattestrukturen skiljer sig åt mellan de nordiska län derna. Inkomstskatten har t.ex. en större betydelse i Danmark än i de övriga nor diska länderna. Å andra sidan spelar de sociala avgif-terna en mindre roll i Dan mark.
Environment and energy · 20 Miljö och energi
Opdateret: Kontrolleret:
Taxes. 2009 Table 8.3 Skatter
Denmark Faroe Islands Finland Iceland Norway Sweden
Million euro Miljoner euro
General government revenue, total 124 402 935 91 268 3 684 153 255 157 650 Offentliga sektorns inkomst, totalt
Taxes and compulsory social security contributions 107 433 780 79 675 2 971 130 235 138 117 Skatter och obligatoriska lagstadgade sociala avgifter In per cent of GDP 48.2 47.3 43.3 34.2 42.0 47.2 I procent av BNP
Gross domestic product (GDP) 222 890 1 650 184 179 8 688 309 875 292 620 Bruttonationalprodukt (BNP)
Pubs10 and 12 Source: Eurostat and national statistical institutes. Note: Faroe Islands and Norway: 2008 data. Not: Färöarna och Norge: 2008 års uppgifter.
Environment and energy · 20 Miljö och energi
Opdateret: Kontrolleret:
Taxes and compulsory social security contributions Figure 8.2 Skatter och obligatoriska lagstadgade sociala avgifter
30
35
1995 1997 1999 2001 2003 2005 2007 2009
Denmark
Greenland
Iceland
Norway
Finland
Swedene Islands
40
45
50
55Per cent of GDP
Faro
Pubs12
Source: Eurostat and national statistical institutes.

114 Public finance and prices · Offentlig ekonomi och priser
Budget deficitFor a number of years, all the Nordic countries, except Iceland, have had a general government surplus. This changed dra-matically in 2009, where only Norway came out with a surplus amounting to 9.7 per cent of GDP. The other Nordic coun tries had deficits as a result of the financial crisis. Most other West Euro-pean countries had a general government deficit.
In the Nordic countries, general government gross debt varies between 41 and 44 per cent of GDP – except for Iceland (88 per cent). Consequently, all the Nordic countries, except Iceland, meet the so-called con vergence criteria that apply to the EU member countries. The convergence criteria stipulate, among other things, that the member countries must not have a budget deficit of more than 3 per cent of GDP and that the gross debt must not exceed 60 per cent of GDP.
BudgetunderskottUnder ett antal år hade alla de nordiska länderna utom Island ett offenligt överskott. Detta ändrade sig under 2009, då endast Norge kom ut med ett överskott vilket uppgick till 9,7 procent av BNP. De övriga nordiska länderna hade underskott som en följd av den finansiella krisen. De flesta andra västeuropeiska länder hade också ett offentligt underskott.
Den offentliga sektorns bruttoskuld i de nordiska länderna varie-rar mellan 41 och 44 procent av BNP – med undantag för Island (88 procent). Alla de nordiska länderna, utom Island, uppfyller därmed de s.k. kon vergenskriterierna för EU:s medlemsländer. Konvergenskriterierna innebär bland annat att medlemsländer-na inte får ha ett budgetunderskott på mer än 3 procent av BNP och att den offentliga sektorns bruttoskuld inte får överstiga 60 procent av BNP.
Environment and energy · 20 Miljö och energi
Opdateret: 10/8-2010 Kontrolleret:
General government surplus/deficit and debt. 2009 Table 8.4Offentliga sektorns överskott/underskott och skuld
Denmark Finland Iceland Norway Sweden
Gen. gov. surplus: million euro Off. överskott: miljoner euro -6 054.9 -3 682.0 -793.4 26 459 -1 570.5 Per cent of GDP -2.7 -2.2 -9.1 9.7 -0.5 Procent av BNP
Gen. gov. debt: million euro 92 612.4 75 217.0 7 657.6 119 202 126 219.8 Off. skuld: miljoner euroPer cent of GDP 41.6 44.0 88.1 43.7 42.3 Procent av BNP
Million euro 2008 Miljoner euroTotal financial assets 125 746.3 197 553.0 6 284.8 471 899 228 362.2 Totala fin. tillgångarTotal liabilities 115 727.1 90 167.0 10 662.3 146 336 157 224.4 Totala skulderNet debt 10 019.2 107 386.0 -4 377.5 -325 563 71 137.7 Nettoskuld
Net debt as per cent of GDP 4.5 62.8 -50.4 106.4 0.5 Nettoskuld i procent av BNP Pubs14
Source: Eurostat.
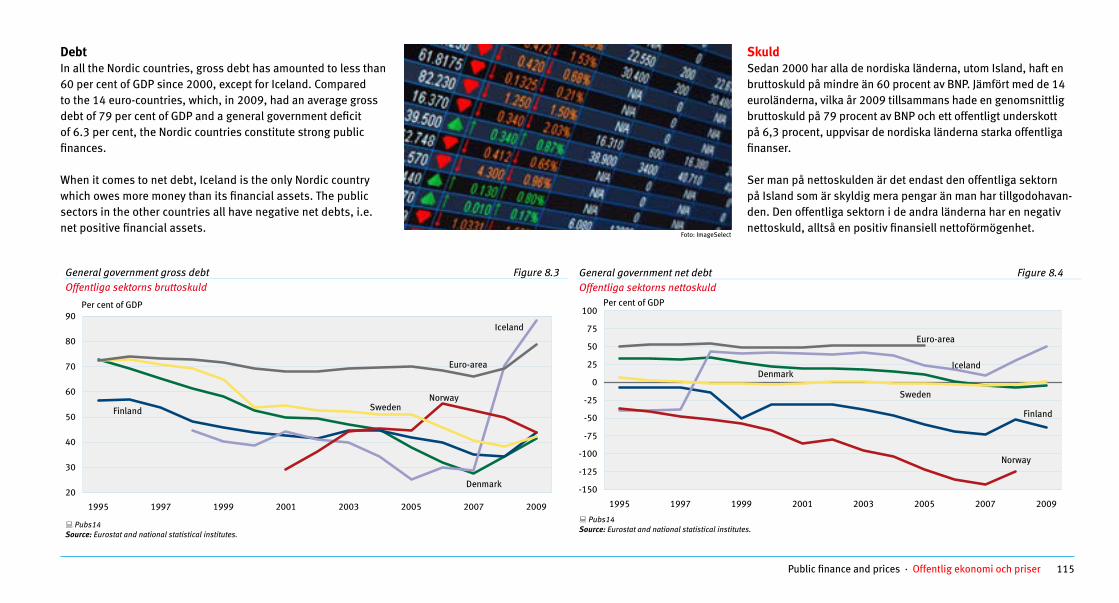
115Public finance and prices · Offentlig ekonomi och priser
DebtIn all the Nordic countries, gross debt has amounted to less than 60 per cent of GDP since 2000, except for Iceland. Compared to the 14 euro-countries, which, in 2009, had an average gross debt of 79 per cent of GDP and a gene ral government deficit of 6.3 per cent, the Nordic countries constitute strong public finances.
When it comes to net debt, Iceland is the only Nordic country which owes more money than its financial assets. The public sectors in the other countries all have negative net debts, i.e. net positive financial assets.
SkuldSedan 2000 har alla de nordiska länderna, utom Island, haft en bruttoskuld på mindre än 60 pro cent av BNP. Jämfört med de 14 eurolän der na, vilka år 2009 tillsammans hade en genomsnittlig bruttoskuld på 79 pro cent av BNP och ett offentligt underskott på 6,3 procent, uppvisar de nordiska länderna starka offentliga finan ser.
Ser man på nettoskulden är det endast den offent liga sektorn på Island som är skyldig mera pen gar än man har tillgodohavan-den. Den offentliga sektorn i de andra länderna har en negativ netto skuld, alltså en positiv finansiell nettoförmögenhet.
General government gross debt Figure 8.3
Opdateret: 10/8 - kea Kontrolleret: Størrelse: 13 x 6 Beskåret med 0,1 top og bund
General government gross debt Figure 8.3 Offentliga sektorns bruttoskuld
20
30
40
1995 1997 1999 2001 2003 2005 2007 2009
Denmark
Iceland
Norway
Euro-area
50
60
70
80
90
Finland Sweden
Per cent of GDP
Pubs14
Source: Eurostat and national statistical institutes.
Environment and energy · 20 Miljö och energi
Opdateret: 10/8 – kea Kontrolleret: Størrelse: 13 x 6 Beskåret med 0,1 top og bund
General government net debt Figure 8.4 Offentliga sektorns nettoskuld
-150
-125
-100
-75
1995 1997 1999 2001 2003 2005 2007 2009
Finland
Norway
Iceland
Euro-area
-50
-25
0
25
50
75
100Per cent of GDP
Denmark
Sweden
Pubs14
Source: Eurostat and national statistical institutes. General
government net debt Figure 8 4
Environment and energy · 20 Miljö och energi
Foto: ImageSelect

116 Public finance and prices · Offentlig ekonomi och priser
Development aidIn 2009, the Nordic countries increased their development aid, measured as a percentage of the gross national income (GNI), except for Iceland. Norway, Sweden and Denmark are among the countries in the world that contribute with the largest develop-ment aid in relation to their national income. As a percentage of gross national income, Finland’s development aid is at the same level as the OECD countries’ average amount of development aid as share of total GNI.
Internationellt biståndDe nordiska länderna ökade 2009 sina internationella bistånd mätt i procent av bruttonational inkomsten (BNI), dock sjönk det isländska biståndet. Danmark, Norge och Sverige hör till de län-der i världen som, i förhållande till nationalinkomsten, ger det största biståndet. Mätt i procent av bruttonationalinkomsten är Finlands internationella bistånd av samma storlek som genom-snittet av OECD-ländernas bistånd räknat som andel av BNI.
Environment and energy · 20 Miljö och energi
Opdateret: 10/8 - kea Kontrolleret: Størrelse: 17,7 x 6 Beskåret med 0,1 top og bund
Government aid to developing countries Figure 8.5 Statligt internationellt bistånd
0.0
0.2
0.4
0.6
0.8
1.0
1.2
1990 1991 1992 1993 1994 1995 1996 1997 1998 1999 2000 2001 2002 2003 2004 2005 2006 2007 2008 2009
Denmark
Finland
Iceland
Percentage of gross national income (GNI)
Sweden
Norway
Ofde02 Source: OECD, Icelandic International Development Agency and national statistical institutes.
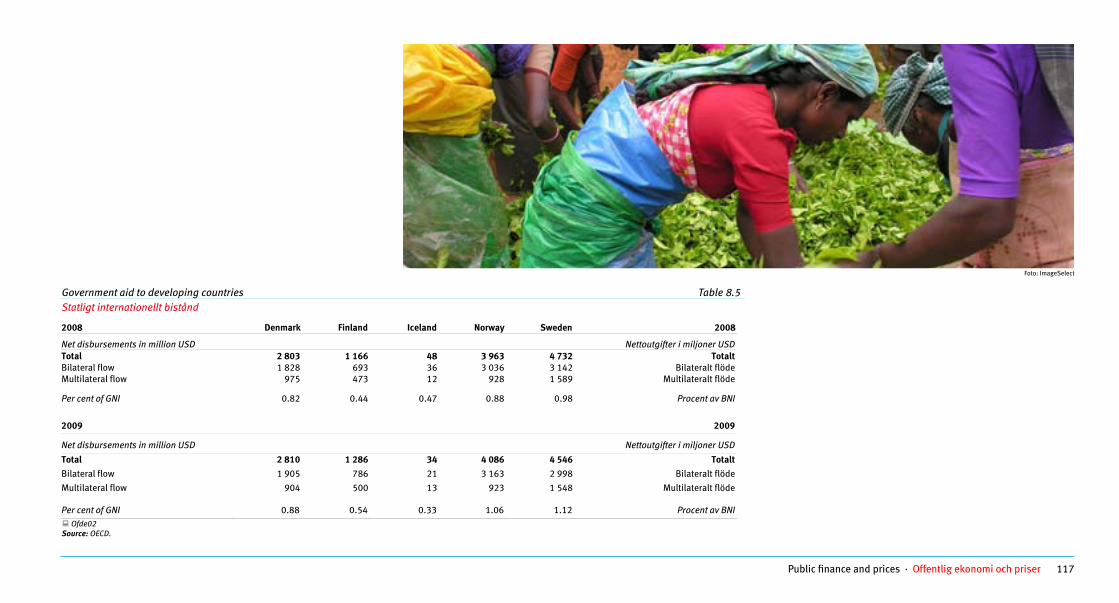
117Public finance and prices · Offentlig ekonomi och priser
Environment and energy · 20 Miljö och energi
Opdateret: 10/8-2010 Kontrolleret:
Government aid to developing countries Table 8.5Statligt internationellt bistånd
2008 Denmark Finland Iceland Norway Sweden 2008
Net disbursements in million USD Nettoutgifter i miljoner USDTotal 2 803 1 166 48 3 963 4 732 TotaltBilateral flow 1 828 693 36 3 036 3 142 Bilateralt flödeMultilateral flow 975 473 12 928 1 589 Multilateralt flöde
Per cent of GNI 0.82 0.44 0.47 0.88 0.98 Procent av BNI
2009 2009
Net disbursements in million USD Nettoutgifter i miljoner USD
Total 2 810 1 286 34 4 086 4 546 TotaltBilateral flow 1 905 786 21 3 163 2 998 Bilateralt flödeMultilateral flow 904 500 13 923 1 548 Multilateralt flöde
Per cent of GNI 0.88 0.54 0.33 1.06 1.12 Procent av BNI Ofde02
Source: OECD.
Foto: ImageSelect
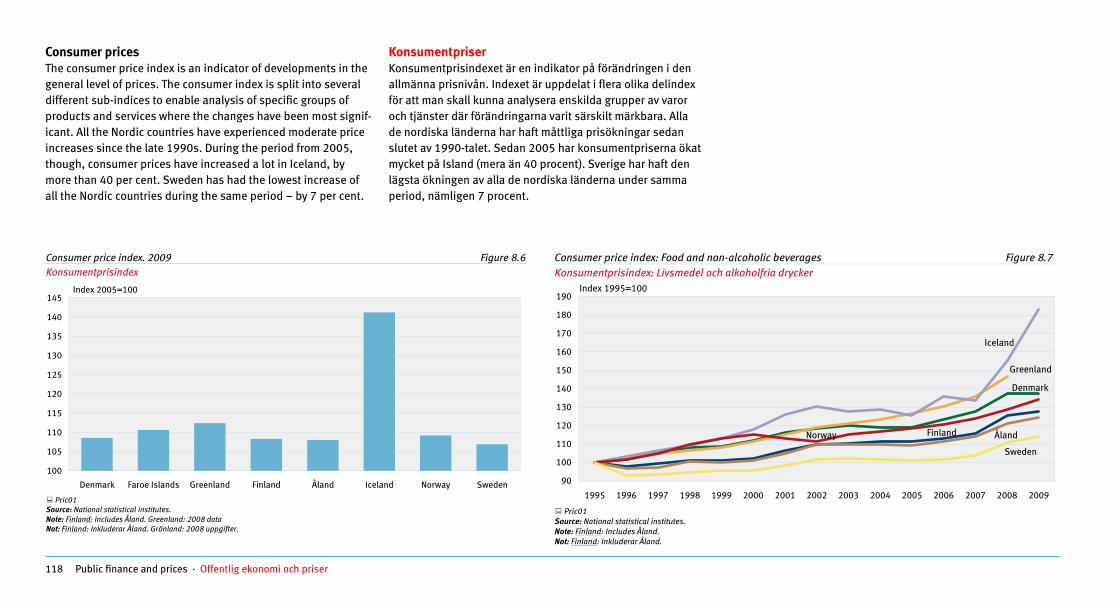
118 Public finance and prices · Offentlig ekonomi och priser
Consumer pricesThe consumer price index is an indicator of developments in the general level of prices. The consumer index is split into several different sub-indices to enable analysis of specific groups of products and services where the changes have been most signif-icant. All the Nordic countries have experienced moderate price increases since the late 1990s. During the period from 2005, though, consumer prices have increased a lot in Iceland, by more than 40 per cent. Sweden has had the lowest increase of all the Nordic countries during the same period – by 7 per cent.
KonsumentpriserKonsumentprisindexet är en indikator på förändringen i den allmänna prisnivån. Indexet är uppdelat i flera olika delindex för att man skall kunna analysera enskilda grupper av varor och tjänster där förändringarna varit särskilt märkbara. Alla de nordiska länderna har haft måttliga prisökningar sedan slutet av 1990-talet. Sedan 2005 har konsument priserna ökat mycket på Island (mera än 40 procent). Sverige har haft den lägsta ökningen av alla de nordiska länderna under samma period, nämligen 7 procent.
Opdateret: 10/8 - kea Kontrolleret: Størrelse: 13 x 6 Beskåret med 0,1 top og bund
Bemærk – der skal indsættes note om at data fra Grønland er 2008 tal!!!!! Consumer price index. 2009 Figure 8.6 Konsumentprisindex
100
105
110
115
Denmark Faroe Islands Greenland Finland Åland Iceland Norway Sweden
120
125
130
135
140
145Index 2005=100
Pric01
Source: National statistical institutes. Note: Finland: Includes Åland. Greenland: 2008 data Not: Finland: Inkluderar Åland. Grönland: 2008 uppgifter.
Consumer price index. 2009 Figure 8.6
Environment and energy · 20 Miljö och energi
Consumer price index: Food and non-alcoholic beverages Figure 8.7Konsumentprisindex: Livsmedel och alkoholfria drycker
90
100
110
120
130
140
150
1995 1996 1997 1998 1999 2000 2001 2002 2003 2004 2005 2006 2007 2008 2009
Greenland
Finland Åland
Sweden
Norway
Denmark
160
170
180
190
Iceland
Index 1995=100
Pric01 Source: National statistical institutes. Note: Finland: Includes Åland.
Environment and energy · 21 Miljö och energi
Opdateret: 10/8 - kea Kontrolleret: Størrelse: 13 x 6 Beskåret med 0,1 top og bund
Not: Finland: Inkluderar Åland.
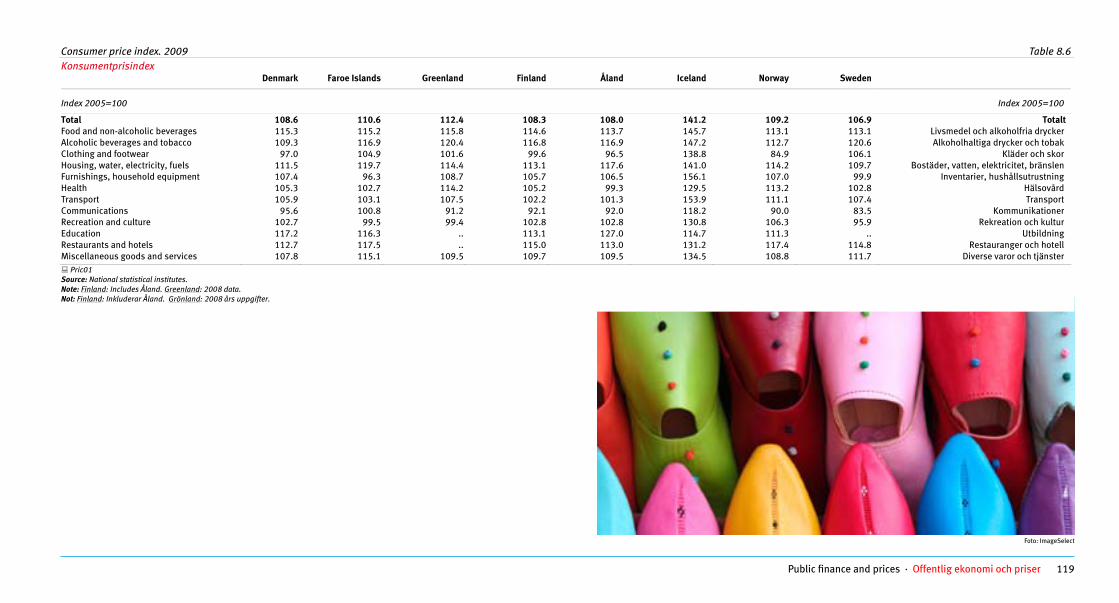
119Public finance and prices · Offentlig ekonomi och priser
Environment and energy · 20 Miljö och energi
Opdateret: 10/8-2010 Kontrolleret:
Consumer price index. 2009 Table 8.6 Konsumentprisindex
Denmark Faroe Islands Greenland Finland Åland Iceland Norway Sweden
Index 2005=100 Index 2005=100 Total 108.6 110.6 112.4 108.3 108.0 141.2 109.2 106.9 Totalt Food and non-alcoholic beverages 115.3 115.2 115.8 114.6 113.7 145.7 113.1 113.1 Livsmedel och alkoholfria drycker Alcoholic beverages and tobacco 109.3 116.9 120.4 116.8 116.9 147.2 112.7 120.6 Alkoholhaltiga drycker och tobak Clothing and footwear 97.0 104.9 101.6 99.6 96.5 138.8 84.9 106.1 Kläder och skor Housing, water, electricity, fuels 111.5 119.7 114.4 113.1 117.6 141.0 114.2 109.7 Bostäder, vatten, elektricitet, bränslen Furnishings, household equipment 107.4 96.3 108.7 105.7 106.5 156.1 107.0 99.9 Inventarier, hushållsutrustning Health 105.3 102.7 114.2 105.2 99.3 129.5 113.2 102.8 Hälsovård Transport 105.9 103.1 107.5 102.2 101.3 153.9 111.1 107.4 Transport Communications 95.6 100.8 91.2 92.1 92.0 118.2 90.0 83.5 Kommunikationer Recreation and culture 102.7 99.5 99.4 102.8 102.8 130.8 106.3 95.9 Rekreation och kultur Education 117.2 116.3 .. 113.1 127.0 114.7 111.3 .. Utbildning Restaurants and hotels 112.7 117.5 .. 115.0 113.0 131.2 117.4 114.8 Restauranger och hotell Miscellaneous goods and services 107.8 115.1 109.5 109.7 109.5 134.5 108.8 111.7 Diverse varor och tjänster
Pric01 Source: National statistical institutes. Note: Finland: Includes Åland. Greenland: 2008 data. Not: Finland: Inkluderar Åland. Grönland: 2008 års uppgifter.
Foto: ImageSelect

120 Public finance and prices · Offentlig ekonomi och priser
Real estate pricesThe evolution of the financial crisis originating from the sub-prime crisis which emerged in the USA in 2007 resulted in difficult economic and financial conditions with real estate prices falling in most European countries. In 2009, real estate prices fell in Denmark and Iceland, stagnated in Sweden and Finland and rose slightly in Norway.
From 2000 to 2007, Danish and Swedish real estate prices have increased by 80 per cent, but the increase in real estate prices breaks all records in Iceland, where they have typically increased by more than 120 per cent in the last five years. In the Faroe Islands real estate prices have almost doubled from 2000–2007.
From 2000 to 2008, Finland and Norway experienced the lowest increase in real estate prices – 50–70 per cent. By European standards, such increases are, however, relatively important.
Fastighetspriser Utvecklingen av den finansiella krisen med ursprung från subprimelånekrisen som uppstod i USA under 2007 har lett till svåra ekonomiska och finansiella villkor med fallande fastighets priser i de flesta europeiska länder. Under 2009 sjönk fastighetspriserna i Danmark och Island, stagnerade i Sverige och Finland och ökade något i Norge. Från 2000 till 2007 steg de danska och svenska fastighets-priserna med 80 procent, men ökningen i fastighetspriserna bryter alla rekord på Island, där de ökade med mer än 120 procent under de senaste fem åren. På Färöarna har fastighe-ternas pris nästan fördubblats under 2000 till 2007. Från 2000 till 2008, Finland och Norge har haft den lägsta ök-ningen i fastighets priserna – 50–70 procent. Med europeisk standard är en sådan ökning dock relativt stor.
House price index. 2008 Figure 8.8 Fastighetsprisin
Opdateret: 10/8 - kea Kontrolleret: Størrelse: 8,5 x 6 Beskåret med 0,1 top og bund House price index Figure 8.8 Fastighetsprisindex
90
110
130
150
170
190
210
230
250
270
2000 2001 2002 2003 2004 2005 2006 2007 2008 2009
Denmark
Faroe Islands
Finland
Iceland
Norway
Sweden
Index 2000 = 100
Pric05
Source: National statistical institutes.
Environment and energy · 22 Miljö och energi
Foto: ImageSelect

121Public finance and prices · Offentlig ekonomi och priser
Price levels The price levels in the five Nordic countries in 2009 for food only and for all goods and services included in the gross domestic product (GDP), respectively, are shown here. In both cases the average price level in the 15 western European countries is fixed at index 100 (EU-15=100). The prices on which the price com-parisons are based are the prices paid by the consumers, i.e. the prices including VAT and other taxes. The price level indices are calculated by means of the PPP exchange rates since the official exchange rates do not typically reflect the real differences in price levels. Specifically, price level indices are calculated as the ratio between PPP exchange rates and the official exchange rates.
Food is particularly expensive in Norway and Denmark. In 2009, the price level of food in these two countries was 43 per cent (Norway) and 26 per cent (Denmark) higher than the EU-15 average. Sweden was the least expensive Nordic country with respect to food.
The price differences between the Nordic countries are smaller in respect of the aggregate price level, i.e. the prices of all goods and services in cluded in GDP. Here, Iceland is the least expen-sive country with a 2009 price level 9 per cent lower than the EU-15 average, while Denmark is the most expen sive with a price level 38 per cent higher than the EU-15 average.
PrisnivåerPrisnivåer i de fem nordiska länderna år 2009 för livsmedel respektive samtliga varor och tjänster som ingår i brutto natio-nalprodukten visas i tabell- och diagramdelen. I båda fallen är den genomsnittliga prisnivån i de 15 ”gamla” EU-länderna satt till 100 (EU-15=100). De priser som ligger till grund för jämfö-relserna är de priser som konsumenterna måste betala, alltså priser inklusive moms och andra avgifter. Prisnivåindexen har beräk nats med hjälp av köpkraftspariteter då de officiella valuta-kurserna inte avspeglar de verkliga skillnaderna i prisnivåerna. Rent konkret har prisnivåindexen beräknats som förhållandena mellan köpkraftspariteterna och de officiella valutakurserna.
Livsmedel är särskilt dyrt i Norge och Danmark. I de två länder-na låg prisnivån på livsmedel år 2009 43 procent (Norge) och 26 procent (Danmark) över EU-15-genomsnittet. Sverige var Nordens billigaste land när det gäller livsmedel.
Prisskillnaderna mellan de nordiska länderna är mindre när det gäller den samlade prisnivån, d.v.s. priserna på samtliga varor och tjänster som ingår i BNP. Här är Island det billigaste landet med en prisnivå år 2009 som ligger 9 procent under EU-15-genomsnittet, medan Danmark är dyrast med en prisnivå 38 procent över EU-15-genomsnittet.
Price levels. 2009 Figure 8.9Prisnivåer
0
20
40
60
80
Denmark Finland Iceland Norway Sweden EU-15
100
120
140
160GDP Food
Index EU-15 =100
Pric03 Source: Eurostat.
Opdateret: 10/8- kea Kontrolleret: Størrelse: 8,5 x 6 Beskåret med 0,1 top og bund
Environment and energy · 23 Miljö och energi

122 Public finance and prices · Offentlig ekonomi och priser
Purchasing power and GDPExchange rates do not adjust for differences in price levels between the countries. Therefore, the GDP of the different coun-tries converted into a common currency using ordinary exchange rates will not only reflect real differences in GDP (and thus also in GDP per capita), but also differences in the price levels be-tween the countries. Converting GDP using ordinary exchange rates thus gives a misleading picture. Such converting overesti-mates the size of the GDP of countries with relatively high price levels and underestimates the GDP of countries with low price levels. If, on the other hand, the PPP exchange rates are used, an adjustment is made for the difference in the price levels of the individual countries. Consequently, the PPP exchange rates should be applied in converting countries’ GDP into a common currency for comparing GDP and GDP per capita.
The differences in GDP per capita between the Nordic countries are reduced significantly when PPP exchange rates are applied rather than the misleading official exchange rates. In 2009, the wealth level of all Nordic countries measured by a PPP-based index for GDP per capita was above the EU-15 average. Norway exceeded the EU average by as much as 60 per cent, Sweden by 9 per cent, Iceland by 8 per cent and Denmark by 6 per cent. Finland was at the same level as EU-15.
Köpkraft och BNPDe vanliga valutakurserna korrigerar, som nämnts, normalt inte skillnaderna i prisnivåer mellan länderna på ett korrekt sätt. Därför kommer de olika ländernas BNP, omräknade till en ge-mensam valuta genom användning av vanliga valutakurser, inte bara att avspegla verkliga skillnader i BNP (och därmed också BNP per invånare), utan också skillnader i prisnivåer mellan länderna. Att räkna om BNP genom användning av vanliga va-lutakurser ger därför en missvisande bild. En sådan omräkning övervärderar storleken av BNP för länder med relativt höga pris-nivåer och undervärderar BNP i länder med låga prisnivåer. An-vänds däremot PPP, korrigeras skillnader i ländernas prisnivåer. Därför bör PPP användas vid omräkning av olika länders BNP till en gemensam valuta när avsikten är att jämföra ländernas BNP och BNP per invånare.
Skillnaderna mellan de nordiska ländernas BNP per invånare blir betydligt mindre när man använder PPP i stället för de officiella valutakurserna. Samtliga nordiska länders välstånds nivå, mätt genom ett PPP-baserat index för BNP per invånare, låg år 2009 över EU-15-genomsnittet. Norge låg hela 60 procent över EU-15-genomsnittet, Sverige 9 procent, Island 8 procent och Danmark 6 procent. Finland låg på samma nivå som EU-15.
Environment and energy · 20 Miljö och energi
Opdateret: 12. august 2010 Kontrolleret:
Gross domestic product per capita. 2009 Table 8.7Bruttonationalprodukten per person
PPP exchange rates
Official exchange rates
Index EU-15=100 Index EU-15=100Denmark Danmark106 147Finland Finland100 117Iceland Island108 99Norway Norge160 207Sweden Sverige109 114
France Frankrike97 108Germany Tyskland105 107Italy Italien92 92Netherlands Nederländerna118 126United Kingdom Storbritannien105 92Poland Polen55 29
Estonia Estland56 37Latvia Lettland44 30Lithuania Litauen48 29
Euro-area Euro-området98 99United States USA132 120
98 85Japan Japan Pric04
Source: Eurostat. Note: Japan: 2007 data. Not: Japan: 2007 års uppgifter.

123Public finance and prices · Offentlig ekonomi och priser
Opdateret: 10/8-2010 af uag Kontrolleret:
Exchange rates. The cost of euro and US dollar in Nordic currencies Table 8.8Växelkurser. Priset på euro och US dollar mätt i de nordiska ländernas valutor
Danish krone
Finnish mark/euro
Icelandic krona
Norwegian krone
Swedish krona
Årligt genomsnitt av 1 euro
Average value of 1 euro
7.8737 4.8640 74.2900 7.9660 7.52021990 19907.2460 5.6440 83.7500 8.2858 9.33191995 19957.4537 1.0000 72.6100 8.1109 8.44652000 20007.4519 1.0000 78.1406 8.0073 9.28492005 2005
2009 7.4463 1.0000 172.6674 8.7285 10.6213 2009
Average value of 1 USD
Årligt genomsnitt av 1 US dollar
1990 6.1853 3.8233 58.3100 6.2544 5.9100 19901995 5.6053 4.3658 64.7800 6.3369 7.1300 19952000 8.0903 0.9236 78.8700 8.8058 9.1718 20002005 6.0034 1.2441 62.8579 6.4450 7.4775 20052009 5.3551 1.3948 123.5943 6.2816 7.6457 2009 Pric02
Source: Central Banks of Denmark, Norway and of Iceland, Bank of Finland and Sweden and Eurostat.
Environment and energy · 21 Miljö och energi
Foto: Ingram

124 Public finance and prices · Offentlig ekonomi och priser
Share pricesThe generally sound economic development of the Nordic coun-tries is also reflected in increased share prices. From 2003 to the spring of 2007, share prices have increased markedly in all Nordic countries – and definitely more than in the remaining West European countries. The price increases occurred after con-siderable decreases from 2000 to 2002, when especially Finnish shares – and especially shares in technological companies – ex-perienced very drastic fluctuations.
From the end of 2007 Nordic shares have decreased drastically as a result of the general crisis in the world economy. However, there was a turning point and rising share prices in 2009.
AktiekurserDen allmänt goda ekonomiska utvecklingen i de nordiska länderna har också resulterat i stigande aktiekurser. Från 2003 och fram till våren 2007 har aktiekurserna gått upp markant i hela Norden – och klart mer än i de övriga västeuropeiska länderna. Kursökningarna kommer efter betydande fall åren 2000–2002, då i synnerhet de finska aktierna – och speciellt aktierna i teknologifö-retag – undergick mycket våldsamma svängningar.
Sedan slutet av 2007 har alla de nordiska aktiekur serna fallit som ett resultat av den ekonomiska krisen. Under 2009 nåddes dock en vändpunkt följd av stigande aktiekurser.
Share prices Figure 8.10Aktiekurser
25
50
75
100
125
150
1990 1991 1992 1993 1994 1995 1996 1997 1998 1999 2000 2001 2002 2003 2004 2005 2006 2007 2008 2009 2010
Denmark
Finland
Iceland
Norway
Sweden
175
200
225
250Index 2005=100
Shar01 Source: OECD Main Economic Indicators.
Opdateret: 10/8 - kea Kontrolleret: Størrelse: 17,7x 6 Beskåret med 0,1 top og bund
Environment and energy · 24 Miljö och energi

125Public finance and prices · Offentlig ekonomi och priser
Interest rate developmentIn recent 15 years, the interest rate has decreased in the Nordic countries – with Iceland as an exception. In 1990, the long-term interest rate, which is of importance to business investments and to the financing of dwellings, had a level of about 11 per cent in Denmark and Norway and one of about 13 per cent in Finland and Sweden. In 2005, the interest rate had dropped to about 3-4 per cent in Denmark, Finland, Norway and Sweden. This is a histori-cally low interest rate. After a few years with a slightly higher interest rate, it is in the beginning of 2009 again 3–4 per cent in these countries. The interest rates are still falling and are in 2010 just below 3 per cent in most of the Nordic countries.
Iceland is the exception, and here the interest rate of non-indexed 5-year bonds reached its lowest level of 6 per cent already in 2003. Since then, the Icelandic interest rates have moved upwards and were in the first quarter of 2008 10.6 per cent. Since then the interest rate has fluctuated drastically as a result of the financial crisis in Iceland. The interest rate was as high as 13.1 per cent in the fourth quarter of 2008 and had fallen to 9.0 per cent the next quarter. In the beginning of 2010 the Icelandic interest rate was 8.0 per cent.
RänteutvecklingenRäntan har de senaste 15 åren fallit i de nordiska länderna – med undantag för Island. Den långa räntan, som är väsentlig för näringslivets investeringar och för finansiering av bostäder, låg 1990 på en nivå omkring 11 procent i Danmark och Norge samt på omkring 13 procent i Finland och Sverige. År 2005 hade räntan fallit till 3–4 procent i Danmark, Finland, Norge och Sve-rige. Det är en historiskt låg ränta. Under de senaste åren har räntan stigit något, men i början av 2009 var den igen ungefär 3-4 procent i dessa länder. Räntorna har fortsatt att falla och är 2010 just under 3 procent i de flesta nordiska länderna.
Island är undantaget, där räntan för icke-indexerade 5-års obligationer nådde sin lägsta punkt på 6 procent redan 2003. Sedan dess har den isländska räntan rört sig uppåt och var för-sta kvartalet 2008 10,6 procent. Sedan dess har räntan varierat kraftigt till följd av den finansiella krisen på Island. Räntan var så hög som 13,1 procent under det fjärde kvartalet 2008 och hade följande kvartal sjunkit till 9,0 procent. I början av 2010 var den isländska räntan 8,0 procent.
Long-term interest rates Figure 8.11Långfristig ränta
0
2
4
6
8
10
1990 1991 1992 1993 1994 1995 1996 1997 1998 1999 2000 2001 2002 2003 2004 2005 2006 2007 2008 2009 2010
DenmarkIceland
Norway
Sweden
12
14Finland
Per cent
Shar02 Source: OECD Main Economic Indicators.
Opdateret: 10/8 - kea Kontrolleret: Størrelse: 17,7x 6 Beskåret med 0,1 top og bund
Environment and energy · 25 Miljö och energi
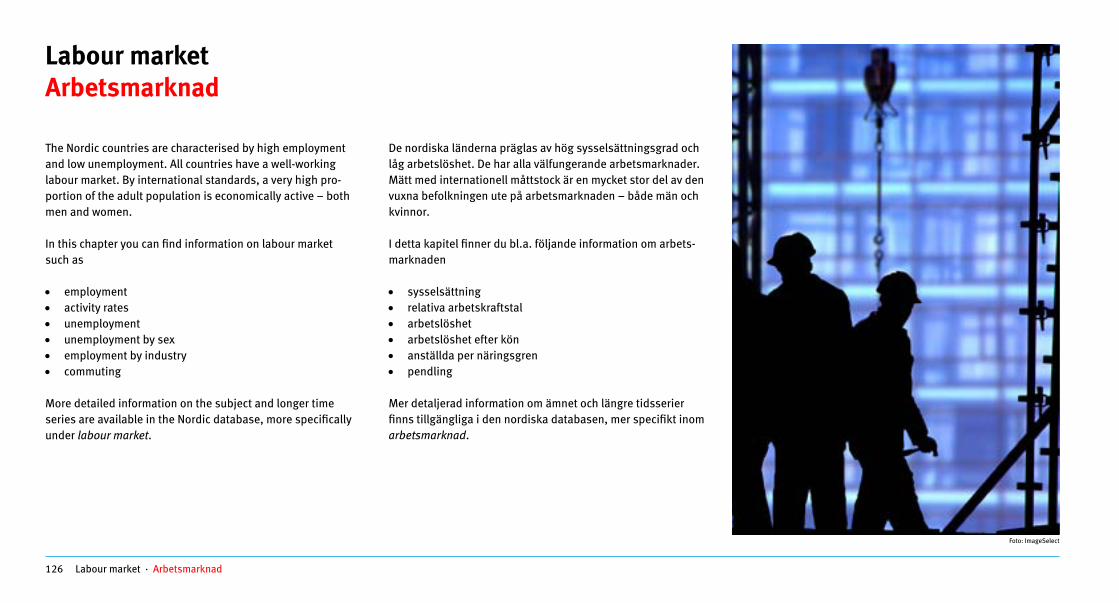
126 Labour market · Arbetsmarknad
Labour marketArbetsmarknad
The Nordic countries are characterised by high employment and low unem ployment. All countries have a well-working labour market. By international standards, a very high pro-portion of the adult population is economically active – both men and women.
In this chapter you can find information on labour market such as
• employment• activity rates• unemployment• unemployment by sex• employment by industry• commuting
More detailed information on the subject and longer time series are available in the Nordic database, more specifically under labour market.
De nordiska länderna präglas av hög sysselsättningsgrad och låg arbetslöshet. De har alla välfungerande arbetsmarknader. Mätt med internationell måttstock är en mycket stor del av den vuxna befolkningen ute på arbetsmarknaden – både män och kvinnor.
I detta kapitel finner du bl.a. följande information om arbets-marknaden
• sysselsättning• relativa arbetskraftstal• arbetslöshet• arbetslöshet efter kön• anställda per näringsgren• pendling Mer detaljerad information om ämnet och längre tidsserier finns tillgängliga i den nordiska databasen, mer specifikt inom arbetsmarknad.
Foto: ImageSelect

127Labour market · Arbetsmarknad
Activity ratesActivity rates are calculated as the number of people in the labour force between the ages of 16 and 64 as a percentage of all those between 16–64 years old. The Nordic countries have a high activity rate in general, compared to other European coun-tries. For both men and women, Finland has the lowest activity rate, the Faroe Islands has the highest for men and Iceland for women. For men, the activity rates range from 76 per cent in Finland to 88 per cent in Iceland – for women, from 73 per cent in Finland to 83 per cent in the Faroe Islands.The Nordic employment rates are also very high compared to the other West European countries.
Relativa arbetskraftstalRelativa arbetskraftstal beräknas som antalet personer i arbets-kraften mellan 16 och 64 år i procent av alla personer mellan 16 och 64 år. De nordiska länderna har ge nerellt höga relativa arbetskraftstal jämfört med övriga europeiska länder. När det gäller både män och kvinnor har Finland det lägsta relativa ar-betskraftstalet, Färöarna det högsta för män och Island för kvin-nor. Relativa arbetskraftstal för män varierar från 76 procent för Finland till 88 procent för Island – och i fråga om kvinnor från 73 procent för Finland till 83 procent för Färöarna.Den nordiska sysselsättningsgraden är också mycket hög jäm-fört med andra västeuropeiska länder.
Environment and energy · 20 Miljö och energi
Opdateret: 6/8-10 llh Kontrolleret:
Activity and employment rates by sex. 2009 Figure 9.1Relativa arbetskrafts- och sysselsättningstal efter kön
0102030405060708090
100
Denmark Faroe Islands Finland Åland Iceland Norway Sweden EU-15
Activity rates, men Activity rates, women Employment rates, men Employment rates, women
Per cent of all 16-64-year-old
Work02 Source: Eurostat and National statistical institutes, Labour force survey. Note: Åland: 2008 data. Finland: Includes Åland. Norway, Finland and EU-15: In per cent of 15-64-year-old. Not: Åland: 2008 års uppgifter. Finland: Inkluderar Åland. Norge, Finland och EU-15: Mellan 15 och 64 år.

128 Labour market · Arbetsmarknad
UnemploymentIn 1990, almost half of all unemployed in the Nordic countries were Danes. How ever, when economic crises hit Sweden and Finland, including Åland, in the early 1990s, the unemploy ment rate increased drastically in these countries and changed the picture. From the mid-1990s and until about 2000, how ever, unemployment has decreased significantly in all the Nordic countries. Today the unemployment rate in Finland and Swe-den is slightly lower than the EU-15 average. Unemployment in the other Nordic countries is lower than the EU-15 average. As a result of the financial crisis, unemployment rates began to increase in the latter half of 2008 till today in all the Nordic countries. Unemploy ment rates are calculated as the number of unemployed people as percentage of the labour force.
ArbetslöshetÅr 1990 var upp emot hälften av alla arbetslösa i Norden dans-kar, men när ekono miska kriser under de första åren av 90-talet drabbade Sverige och Finland, inklu sive Åland, steg arbetslös-heten dramatiskt i bägge länderna och ändrade bilden. Från mit-ten av 90-talet och fram till omkring år 2000 har arbetslösheten dock minskat markant i hela Norden. I dag ligger arbetslöshets-procenten i Finland och Sverige lite under genomsnittet i EU-15-länderna. Arbetslösheten i de övriga nordiska länder na är under genomsnittet för EU-15-länderna. Som en följd av den ekonomis-ka krisen började arbetslösheten öka under andra halvåret 2008 fram till idag i alla nordiska länder. Arbetslöshetstalen beräknas som antalet arbetslösa i procent av arbetskraf ten.
Environment and energy · 20 Miljö och energi
Opdateret: 5/8-10 llh Kontrolleret:
Unemployment rates Figure 9.2 Arbetslöshet
0
2
4
6
8
10
12
14
16
18
1990 1991 1992 1993 1994 1995 1996 1997 1998 1999 2000 2001 2002 2003 2004 2005 2006 2007 2008 2009
Denmark
Faroe Islands
Finland
Åland
Iceland
Norway Sweden
Per cent
EU-15
Key01 and Work02 Source: National statistical institutes and Eurostat. Note: EU-harmonized unemployment rates, except Åland and Iceland. Finland: Includes Åland. Not: EU-harmoniserade arbetslöshetstal med undantag av Åland och Island. Finland: Inkluderar Åland.

129Labour market · Arbetsmarknad
Environment and energy · 20 Miljö och energi
Opdateret: 19/8-10 LLH
Kontrolleret:
Unemployment by sex and age group. 2009 Table 9.1Arbetslöshet efter kön och åldersgrupp
Denmark Faroe Islands Finland Åland Iceland Norway Sweden
1 000 persons 1 000 personer
Total Totalt170.7 1.3 221.0 0.3 12.9 81.0 401.316–19 years 16–19 år21.6 0.4 32.0 0.0 2.3 17.0 67.020–24 years 20–24 år25.6 0.2 38.0 0.0 2.5 17.0 84.725–34 years 25–34 år39.3 0.3 47.0 0.1 3.7 18.0 82.535–44 years 35–44 år33.8 0.1 35.0 0.1 1.8 15.0 63.845–54 years 45–54 år31.2 0.1 41.0 0.1 1.7 10.0 56.455–64 years 55–64 år19.2 0.2 29.0 0.1 1.0 4.0 46.9
Men MänTotal Totalt98.6 0.9 122.0 0.2 8.2 49.0 219.416–19 years 16–19 år11.7 0.4 16.0 0.0 1.3 9.0 33.020–24 years 20–24 år15.3 0.1 23.0 0.0 1.7 10.0 48.925–34 years 25–34 år21.1 0.2 27.0 0.0 2.3 11.0 46.235–44 years 35–44 år18.5 0.0 19.0 0.0 1.1 9.0 32.345–54 years 45–54 år19.6 0.1 23.0 0.0 1.1 7.0 31.455–64 years 55–64 år12.2 0.1 16.0 0.0 0.7 3.0 27.6
Women KvinnorTotal Totalt72.1 0.4 98.0 0.1 4.7 32.0 181.916–19 years 16–19 år9.9 0.1 16.0 0.0 1.0 8.0 34.020–24 years 20–24 år10.2 0.0 15.0 0.0 0.8 6.0 35.825–34 years 25–34 år18.2 0.2 21.0 0.0 1.4 7.0 36.335–44 years 35–44 år15.3 0.0 16.0 0.0 0.7 6.0 31.545–54 years 45–54 år11.5 0.1 18.0 0.0 0.6 4.0 25.055–64 years 55–64 år7.1 0.1 13.0 0.0 0.3 1.0 19.3
Work02 Source: National statistical institutes. Note: Norway and Finland: 15–19 years. Finland: Includes Åland. Åland: 2008 data. Not: Norge och Finland: 15–19 år. Finland: Inkluderar Åland. Åland: 2008 års uppgifter.
Foto: ImageSelect
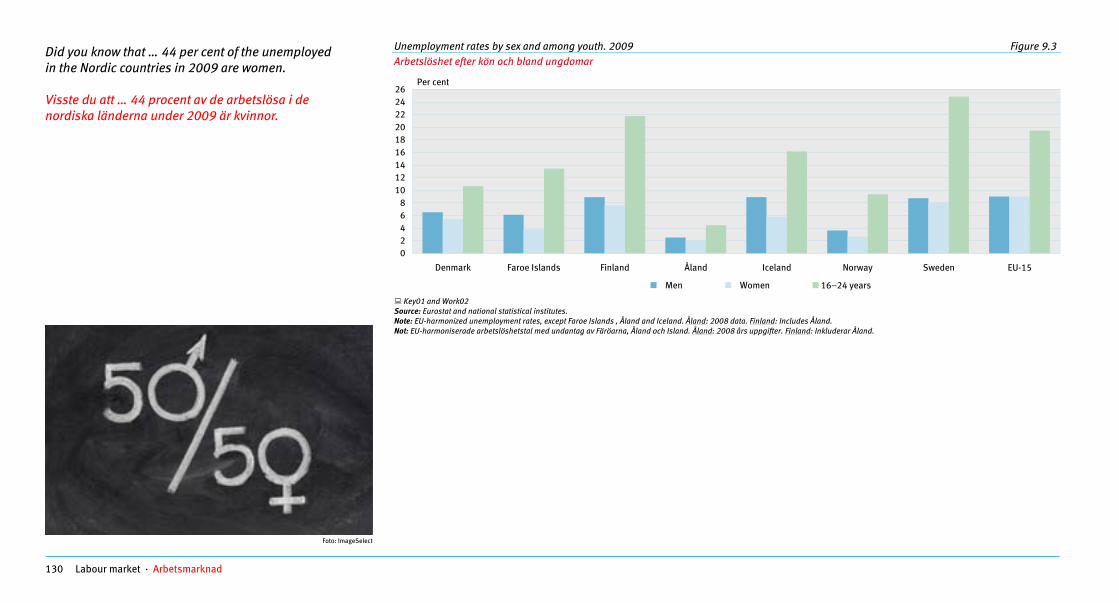
130 Labour market · Arbetsmarknad
Did you know that … 44 per cent of the unemployed in the Nordic countries in 2009 are women.
Visste du att … 44 procent av de arbetslösa i de nordiska länderna under 2009 är kvinnor.
Opdateret: 5/8-10 llh Kontrolleret:
Unemployment rates by sex and among youth. 2009 Figure 9.3Arbetslöshet efter kön och bland ungdomar
02468
101214161820222426
Denmark Faroe Islands Finland Åland Iceland Norway Sweden EU-15
Men Women 16–24 years
Per cent
Key01 and Work02 Source: Eurostat and national statistical institutes. Note: EU-harmonized unemployment rates, except Faroe Islands , Åland and Iceland. Åland
Environment and energy · 20 Miljö och energi
: 2008 data. Finland: Includes Åland. Not: EU-harmoniserade arbetslöshetstal med undantag av Färöarna, Åland och Island. Åland: 2008 års uppgifter. Finland: Inkluderar Åland.
Foto: ImageSelect

131Labour market · Arbetsmarknad
Employment by industryThe labour market structure has changed considerably in re-cent decades. The Nor dic countries have shifted from agrarian and industrial societies into societies dominated by a large service sector. The trend is clear, even when looking only at developments in employment by industry from 1993 onwards.
Employment in the public services (including education and defence) is the most common in the Nordic countries, 32 per cent of all are employed in this sector – women represent 74 per cent of these. The sector with second most employed are wholesale and retail sale, transport, hotels and restaurants – 22 per cent are employed here, 58 per cent of these are men.
Men dominate in sectors as agriculture and constructing where they represent 75 and 92 per cent of all employed. Besides public services women dominate in areas as other services and financial and insurance activity where they represent respec-tively 59 and 54 per cent of all employed in the sectors.
Antalet anställda per näringsgrenArbetsmarknadsstrukturen har ändrats väsentligt under de senaste årtiondena. De nordiska länderna har gått från att vara jordbruks-ekonomier och industrisamhällen till att domineras av en stor tjänstesektor. Även om man endast ser till förändrin gen i antalet an-ställda per näringsgren från 1993 och framåt är tendensen tydlig.
Offentlig förvaltning (inklusive utbildning och försvar) är den största sysselsättningssektorn i de nordiska länderna. 32 pro-cent av alla är anställda i denna sektor - kvinnorna utgör 74 procent av dessa. Sektorn med näst mest anställda är parti- och detaljhandel, transport, hotell och restauranger – 22 procent är anställda här, 58 procent av dessa är män.
Männen dominerar inom sektorer som jordbruk och tillverkning, där de utgör 75 respektive 92 procent av alla sysselsatta. Förut-om offentliga tjänster dominerar kvinnorna ochså inom områden som andre tjänster samt finansiell- och försäkringsverksamhet där de utgör 59 respektive 54 procent av alla anställda.
Opdateret: 12/8-10 LLH Kontrolleret:
Employed in the Nordic countries, men. 2009 Figure 9.4 Sysselsatta i de nordiska länderna, män
4%14%
0%
16%
20%
12%
5%
3%
24%
Agriculture, forestry, hunting and fishing 4%
Manufacturing, mining and other industry 20%
Construction 12%
Wholesale and retaiand hotels 24%
l trade, transport, restaurants
Information and communication 5%
Finance, insurance, real estate and businessservices 3%Public services, incl. defence and education 16%
Other services 14%
Unknown 0% Labo01a
Source: Eurostat and national statistical institutes.
Employed in the Nordic countries, men. 2009
Environment and energy · 20 Miljö och energi
Opdateret: 12/8-10 LLH Kontrolleret:
Employed in the Nordic countries, women. 2009 Figure 9.5 Sysselsatta i de nordiska länderna, kvinnor
1%
19%
0%7%
1%
15%
3%
4%49%
Agriculture, forestry, hunting and fishing 1%
Manufacturing, mining and other industry 7%
Construction 1%
Wholesale and reand hotels 19%
tail trade, transport, restaurants
Information and communication 3%
Finance, insurance, real estate and businessservices 4%Public services, incl. defence and education 49%
Other services 15%
Unknown 0%
Labo01a Source: Eurostat and national statistical institutes.
Employed in the Nordic countries
Environment and energy · 20 Miljö och energi

132 Labour market · Arbetsmarknad
Environment and energy · 21 Miljö och energi
Opdateret: 13/8-10 LLH Kontrolleret:
Employed by industry. 1 January 2009 Table 9.2 Sysselsatta efter näringsgren
Denmark Finland Iceland Norway Sweden EU-15
Per cent Procent
Total Totalt 100 100 100 100 100 100Men Män 52 51 52 52 52 55Women Kvinnor 48 49 48 48 48 45
1 000 persons 1 000 personer
Total Totalt 2 721 2 423 160 2 437 4 391 170 880Agriculture, forestry and fishing Jordbruk, skogsbruk, jakt och fiske 65 104 7 62 84 4 792Manufacturing, mining and other industry Tillverkning, gruvor och annan industri 378 408 19 320 602 28 545 of which: manufacturing varav tillverkning 346 376 18 244 551 25 915Construction Byggsektorn 175 173 11 177 288 13 356Wholesale and retail trade, transport, restaurants and hotels Handel, transport, hotell- och restaurangverksamhet 622 530 37 537 915 40 578Information and communication Information och kommunikation 109 93 8 92 177 5 183Financial and insurance activities Finansiell- och försäkringsverksamhet 94 51 8 53 97 5 647Real estate activities Fastighets- och företagstjänster 25 18 .. 25 61 1 304Professional, scientific, technical, administration and support service activities
Professionella, vetenskapliga, tekniska, administrativa och andra stödtjänster 223 239 13 225 520 16 228
Public administration, defence, education, human health and social work activities
Offentlig förvaltning, försvar, utbildning, hälso- och sociala tjänster 895 664 45 852 1 417 44 454
Other services Övriga servicesektorn 130 133 9 91 215 9 800Unknown .. 9 2 .. 14 994 Okänd
Labo01a Source: Eurostat and national statistical institutes. Note: Finland: Includes Åland. Not: Finland: Inkluderar Åland.
Foto: ImageSelect
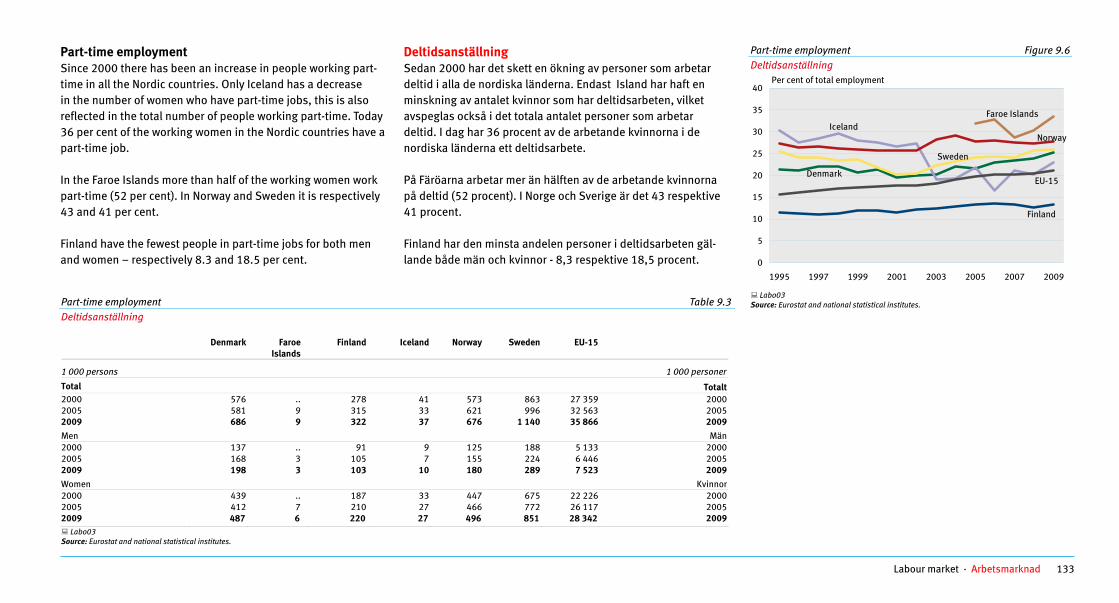
133Labour market · Arbetsmarknad
Part-time employmentSince 2000 there has been an increase in people working part-time in all the Nordic countries. Only Iceland has a decrease in the number of women who have part-time jobs, this is also reflected in the total number of people working part-time. Today 36 per cent of the working women in the Nordic countries have a part-time job.
In the Faroe Islands more than half of the working women work part-time (52 per cent). In Norway and Sweden it is respectively 43 and 41 per cent.
Finland have the fewest people in part-time jobs for both men and women – respectively 8.3 and 18.5 per cent.
DeltidsanställningSedan 2000 har det skett en ökning av personer som arbetar deltid i alla de nordiska länderna. Endast Island har haft en minskning av antalet kvinnor som har deltidsarbeten, vilket avspeglas också i det totala antalet personer som arbetar deltid. I dag har 36 procent av de arbetande kvinnorna i de nordiska länderna ett deltidsarbete.
På Färöarna arbetar mer än hälften av de arbetande kvinnorna på deltid (52 procent). I Norge och Sverige är det 43 respektive 41 procent.
Finland har den minsta andelen personer i deltidsarbeten gäl-lande både män och kvinnor - 8,3 respektive 18,5 procent.
Opdateret: 12/8-10 Llh Kontrolleret:
Part-time employment Figure 9.6 Deltidsanställning
0
5
10
1995 1997 1999 2001 2003 2005 2007 2009
Faroe Islands
Finland
Norway
EU-15
15
20
25
30
35
40
Denmark
Iceland
Sweden
Per cent of total employment
Labo03
Source: Eurostat and national statistical institutes.
Environment and energy · 21 Miljö och energi
Environment and energy · 20 Miljö och energi
Opdateret: 12/8-10 llh Kontrolleret:
Part-time employment Table 9.3 Deltidsanställning
Denmark Faroe Islands
Finland Iceland Norway Sweden EU-15
1 000 persons 1 000 personer
Total Totalt2000 576 .. 278 41 573 863 27 359 20002005 581 9 315 33 621 996 32 563 20052009 686 9 322 37 676 1 140 35 866 2009Men Män2000 137 .. 91 9 125 188 5 133 20002005 168 3 105 7 155 224 6 446 20052009 198 3 103 10 180 289 7 523 2009Women Kvinnor2000 439 .. 187 33 447 675 22 226 20002005 412 7 210 27 466 772 26 117 20052009 487 6 220 27 496 851 28 342 2009
Labo03 Source: Eurostat and national statistical institutes.

134 Labour market · Arbetsmarknad
Commuting between the Nordic countriesCommuting between the Nordic countries is considerable. Com-muters are defined as persons living in one country but earning the major part of their work-related income in another country.
The large commuting flows between the four major Nordic coun-tries in 2007 went, from Sweden to Norway and from Sweden to Denmark. The size of these were 19 000 and 20 000 commut-ers. The smallest commuting flows went from Norway to Den-mark and Finland, 500 and 200 commuters. Several of the com-muting flows were around 2 000 commuters, the case of both flows from Denmark to Norway and Sweden as the commuting flow from Norway to Sweden, and commuting between Sweden and Finland.
Pendling mellan de nordiska ländernaDet sker en betydande arbetspendling mellan de nordiska län-derna. Arbetspendlare definieras som personer som bor i ett land, men förtjänar huvudparten av sin ar betsinkomst i ett annat land.
De stora pendlingsströmmarna mellan de fyra stora nordiska länderna år 2007 gick från Sverige till Norge och från Sverige till Danmark. Storleken på dessa var 19 000 respektive 20 000 ar-betspendlare. De minsta pendling sström marna gick från Norge till Danmark och Finland, 500 respektive 200 arbetspendlare. Flera av pendlingsströmmarna låg runt 2 000 arbetspendlare, det gällde såväl strömmarna från Danmark till Norge och Sverige som pendlingsströmmen från Norge till Sverige samt pendlingen mellan Sverige och Finland. Environment and energy · 20 Miljö och energi
Opdateret: 19/8-10 Kontrolleret: Commuters by commuting direction. 2007 Figure 9.7 Pendlare efter pendlingens riktning
0 5 000 10 000 15 000 20 000 25 000
Norway to Finland
Norway to Denmark
Finland to Norway
Denmark to Sweden
Norway to Sweden
Denmark to Norway
Sweden to Finland
Finland to Sweden
Sweden to Denmark
Sweden to Norway
Comm01 Source: Nordisk pendlingskarta. Note: Denmark and Norway: 2007 no data available on commuting between these countries. Finland: 2006 data. Includes Åland. Not: Danmark and Norge: 2007 inga tillgängliga data för pendling mellom dissa länderna. Finland: 2006 års uppgifter. Inkluderar Åland.
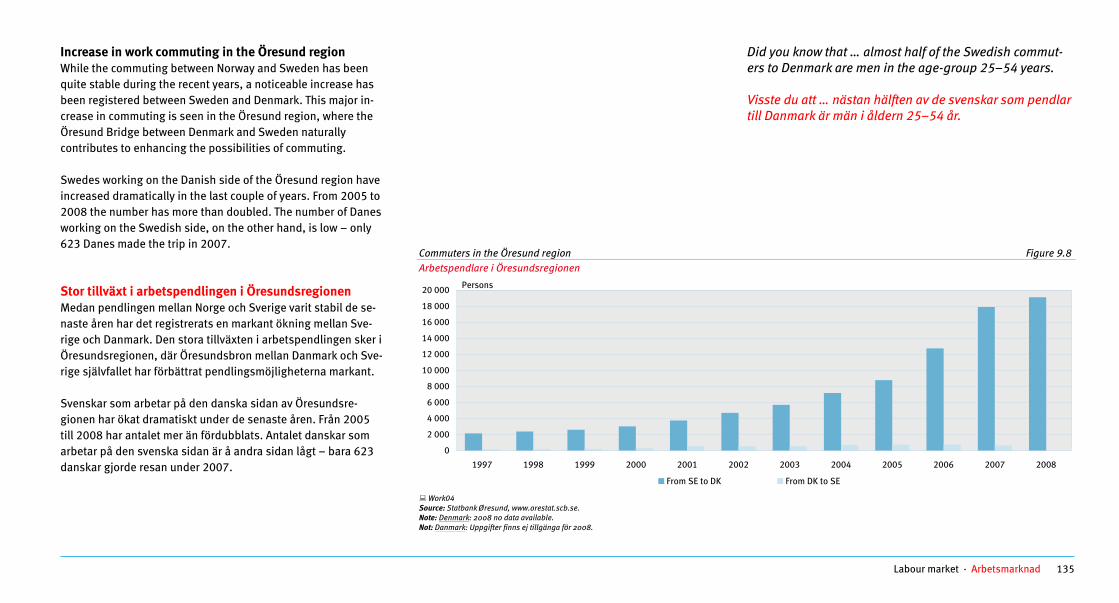
135Labour market · Arbetsmarknad
Increase in work commuting in the Öresund regionWhile the commuting between Norway and Sweden has been quite stable during the recent years, a noticeable increase has been registered between Sweden and Denmark. This major in-crease in commuting is seen in the Öresund region, where the Öresund Bridge between Denmark and Sweden naturally contributes to enhancing the possibilities of commuting.
Swedes working on the Danish side of the Öresund region have increased dramatically in the last couple of years. From 2005 to 2008 the number has more than doubled. The number of Danes working on the Swedish side, on the other hand, is low – only 623 Danes made the trip in 2007.
Stor tillväxt i arbetspendlingen i ÖresundsregionenMedan pendlingen mellan Norge och Sverige varit stabil de se-naste åren har det registrerats en markant ökning mellan Sve-rige och Danmark. Den stora tillväxten i arbetspendlingen sker i Öresundsregionen, där Öresundsbron mellan Danmark och Sve-rige självfallet har förbättrat pendlingsmöjligheterna markant.
Svenskar som arbetar på den danska sidan av Öresundsre-gionen har ökat dramatiskt under de senaste åren. Från 2005 till 2008 har antalet mer än fördubblats. Antalet danskar som arbetar på den svenska sidan är å andra sidan lågt – bara 623 danskar gjorde resan under 2007.
Did you know that … almost half of the Swedish commut-ers to Denmark are men in the age-group 25–54 years.
Visste du att … nästan hälften av de svenskar som pendlar till Danmark är män i åldern 25–54 år.
Opdateret:
Commuters in the Öresund region Figure 9.8 Arbetspendlare i Öresundsregionen
0
2 000
4 000
6 000
8 000
10 000
12 000
14 000
16 000
18 000
20 000
1997 1998 1999 2000 2001 2002 2003 2004 2005 2006 2007 2008
From SE to DK From DK to SE
Persons
Work04 Source: Statbank Øresund, www.orestat.scb.se. Note: Denmark: 2008 no data available. Not: Danmark: Uppgifter finns ej tillgänga för 2008.
Kontrolleret:
Environment and energy · 21 Miljö och energi

136 Labour market · Arbetsmarknad
Environment and energy · 21 Miljö och energi
Opdateret: 19 /8-10 llh
Commuters by sector, home and working country. 2007 Table 9.4Arbetspendlare efter sektor, hjem och arbetsland
Home country Denmark Finland Norway Sweden Hemland
Persons Personer
Working country Arbetsland
Public administration and service Offentlig administration och serviceDe nmark . .. .. 2 793 nmark DaFinland . . .. .. FinlandNorway . 146 . 1 580 NorgeSweden 321 558 247 0 Sverige
Publicly owned enterprises and organizations nmark
Samhällsägda företag och organisationerDe . .. .. 1 477 nmark DaF inland .. . .. .. inlandFNorway .. 21 . 541 NorgeSweden 62 82 39 . Sverige
Industri exklusive offentliga företag och organisationer
Industry excluding public companies and organizations Denmark . .. .. 15 376 DanmarkF inland .. . .. .. inland
. .. .. .. nmark
FNorway .. 827 . 18 248 NorgeSweden 925 2 604 1 087 . Sverige
Unknown sector nmark
OkändDe DaF inland .. . .. .. inlandFNorway .. 16 . .. Norge
SverigeSweden .. .. .. .
Comm05 Source: StatNord. Note: Denmark and Norway: 2007 no data available. Finland: 2006 data. Includes Åland. Not: Danmark and Norge: Uppgifter finns ej tilgängliga för 2007. Finland: 2006 års uppgifter. Inkluderar Åland.
Foto: Johannes Jansson

137·
Appendix 1: User guideTheNordicStatisticalYearbook2010ispublishedbytheNordicCouncilofMinisters.InthecontextoftheyearbookadatabankisalsopublishedonthewebsiteoftheNordicCouncilofMinis-ters.
ThedatabankcontainscomparablestatisticsforDenmark,theFaroeIslands,Greenland,Finland,Åland,Iceland,NorwayandSweden.DatarelatingtoDenmarkdonotincludedataontheFaroeIslandsorGreenland.FiguresforÅlandareincludedintheFinnishfigures,thoughfiguresforÅlandareshownseparately.
LanguagesThebookisbi-lingual–EnglishandSwedish.However,Englishisusedastheprimarylanguage.Forexample,alltableswillhavetwosetsofreferences–oneinEnglishandoneinSwedish–andalltextwillnormallybeinbothlanguages.FollowingtheAnglo-Americantradition,decimalsareseparatedbydecimalpointsinsteadofbyacomma.
The databank: Nordic Statistics – www.norden.orgThe:andthereferencethatappearsbelowatableordia-gramidentifiesthetableinthedatabankthathasservedasitssource.Allthetablesmaybefoundonthedatabase.Therefer-enceafter:alsoworksasalinktothecurrentdatabase-table.Withaclickonthereferenceyougetdirectlyintothedatabase-table.
Itisonlyaselectionofthedatafromthedatabank,thathasbeenincludedinthebook’stablesandgraphs.Inparticular,timeseriesaretobefoundonthedatabase.TodownloaddatafromthedatabaseyoucanchooseexcelorPC-AXIS.IfyouchoosePC-AXIS,youneedtoinstallthePC-AXISsoftware,whichislocatedonthesite.Ifyoualreadyhavetheprograminstalledonyourcomputer,youdonotnecessarilyneedtore-installit,unlessyouwishtobenefitfromthenewestfeatures.
ThePC-AXISprogrammeenablesyoutomanagelargeamountsofstatisticaldata.InPC-AXIS,itispossibletoextractaselectionofdatafromatable,e.g.dataforonlyonecountryor,perhaps,allthecountriesor,perhaps,justdatafromthelatestyear.Theprogrammealsoallowsyoutorearrangetables,e.g.byaggre-gatingvariables,calculatingpercentages,etc.,andtoexportthetablesintoavarietyofdifferentfileformats.
Sources and notesMostfigurescomefromthenationalstatisticalinstitutes(NSIs).Sourcesareneverthelessprovidedbelowalltablesandgraphs.Notesarenormallyonlyprovidedfortablesandgraphs.Alltablesarenumberedasacontinuousserieswithinthespecificchapter,asarethediagrams.Thesubjectindexinthebackofthebookrefersonlytopages.
Data and data collectionMostdataderivefromtheNordicNSIs,astheproductionanddisseminationofstatisticsintheNordiccountriesiscentralized.TheNSIsareresponsibleforproducingorcoordinatingthepro-ductionofofficialstatistics.Theyalloperateindependentlyofgovernmentcontrolandtheiractivitiesareregulatedbylaw.AlthoughexcellentcomparisonsmaybemadebetweentheNor-diccountriesonthebasisofthedataprovided,caremustbetakentoallowfordifferencesinprimarydataandthewaytheyarecollected,organizedandcalculated.Notestoexplaindifferencesincomparabilityandmethodologyarenormallypro-vided.
Appendix1:Userguide·Bilaga1:Användarhandledning
138 ·Appendix1:Userguide·Contactinformation
Contact information ThedecissionofwhichdatatoincludeintheNordicStatisticalDatabankismadebytheWorkingGrouponNordicStatistics.ThegroupischairedbytheeditoroftheNordicStatisticalData-bankandYearbook,UllaAgerskov([email protected]),andincludesrepresentativesoftheNordicnationalstatisticalinstitutes(NSIs):Denmark: LeonØstergaard,[email protected] Islands: SimonaNielsen,[email protected]: BolattaVahl,[email protected]: HansBaumgartner, [email protected].Åland: IrisÅkerberg,[email protected]: SvavaGudjonsdottir [email protected]: IngridModig,[email protected] BjarteMellemstrand,[email protected]: UllaSundberg,[email protected] JohnKling,[email protected]
ToobtainadditionalinformationonstatisticsfromindividualNordiccountries,pleaseusethefollowingcontactaddresses:Statistics DenmarkLibraryandInformationtel.:+4539173030fax:+4539173003e-mail:[email protected],Internet:www.dst.dkStatistics Faroe Islandstel.:+298352800fax:+298352801e-mail:[email protected]:www.hagstova.foStatistics Greenlandtel.:+299362360fax:+299362361e-mail:[email protected]:www.stat.glStatistics FinlandLibraryofStatistics,InformationServicetel.:+358917342220fax:+358917342279e-mail:[email protected]:www.stat.fi
Statistics Ålandtel.:+3581825490fax:+3581819495e-mail:[email protected]:www.asub.axStatistics IcelandInformationServicestel.:+3545281000fax:+3545281099e-mail:[email protected],Internet:www.statice.isStatistics NorwayLibraryandInformationCentretel.:+4721094642fax:+4721094504e-mail:[email protected],Internet:www.ssb.noStatistics SwedenInformationservicetel.:+46850694801fax:+46850694899e-mail:[email protected]:www.scb.se

139·
Bilaga 1: AnvändarhandledningNordiskstatistiskårsbok2010publicerasavNordiskaminister-rådet.IsambandmedårsbokenpublicerasocksåendatabaspåwebbplatsenförNordiskaministerrådet.
DatabaseninnehållerjämförandestatistikförDanmark,Fä-röarna,Grönland,Finland,Åland,Island,NorgeochSverige.UppgiftersomavserDanmarkinkluderarinteuppgifteromFärö-arnaellerGrönland.UppgifterförÅlandingåriuppgifternaförFinlandävenomdeangesseparat.
SpråkBokenärtvåspråkig–påengelskaochsvenska.Engelskaan-vändsemellertidsomhuvudspråk.Allatabellerhartvåuppsätt-ningarreferenser–enpåengelskaochenpåsvenska–ochalltextfinnsnormaltpåbäggespråken.Påanglosaxisktsättangesdecimalermedpunktiställetförmedkomma.
Databasen: Nordic Statistics www.norden.orgSymbolen:underentabellellerettdiagrammarkerarenhän-visningtilldentabellidatabasensomutgörkällan.Allatabel-lerfinnspådatabasen.Hänvisningenefter:länkartilldenaktuelladatabas-tabell.Medettklickpåreferensenkommardudirektirättdatabas-tabell.
Detärbaraetturvalavdatafråndatabasen,somharfunnitsmedibokenstabellerochdiagram.Isynnerhettidsserierfinnsidatabasen.
NärduhämtardatafråndatabasenkanduväljaexcelellerPC-Axis.OmduväljerPC-AxisbehöverduinstalleraPC-Axismjukva-ran,somliggerdär.Omduredanharprogrammetinstalleratpådindatorbehöverduintenödvändigtvisinstalleraomdet,omduintevilldranyttaavdenyastefunktionerna.
MedprogrammetPC-AXISärdetmöjligtatthanterastoramäng-deravstatistiskadata.Mankangöraetturvalavdatafrånenta-bell,t.ex.uppgifterförendastettlandeller,istället,allaländereller,ommansåönskar,barauppgifterfråndetsenasteåret.PC-AXISlåterocksåanvändarengöraomtabellerna,t.ex.genomattaggregeravariablerochberäknaprocenttal,samtexporteratabellernatillenmängdolikafilformat.
Källor och noterHuvuddelenavuppgifternakommerfråndenationellastatistis-kainstituten(NSI),menkällornaangesändåunderallatabellerochdiagram.Allatabellerärnumreradesomenkontinuerligserieinomvarjeenskiltkapitel,liksomdiagrammen.Sakregistretislutetavbo-kenhänvisarendasttillsidor.
Uppgifter och insamling av uppgifterMerpartenavuppgifternaärhämtadefrånnordiskaNSI,efter-somsammanställningenochspridningenavstatistikärcentra-
liseradidenordiskaländerna.NSIsvararförofficiellstatistikantingengenomattsammanställadensjälvellergenomattsamordnaproduktionenavden.Deärallasjälvständigaorganmedlagregleradverksamhet.Ävenomuppgifternaibokengermöjlighettillutmärktajämförelsermellandenordiskaländerna,måstemantahänsyntillskillnaderiprimärauppgifterochdetsättpåvilketdesamlasin,bearbetasochberäknas.Noteromskillnaderijämförbarhetochmetoderlämnasnormalt.
Appendix1:Userguide·Bilaga1:Användarhandledning

140 ·Appendix1:Userguide·Kontactinformation
KontaktinformationArbetsgruppenförNordiskStatistikbestämmervilkauppgiftersomskallinkluderasidennordiskastatistiskadatabasen.Grup-penledsavredaktörenfördennordiskastatistiskadatabasenochårsboken,UllaAgerskov([email protected]),ochinnehållerrepre-sentanterförallaNSI,nämligen:
Danmark: LeonØstergaard,[email protected]äröarna: SimonaNielsen,[email protected]önland: BolattaVahl,[email protected]: HansBaumgartner, [email protected].Åland: IrisÅkerberg,[email protected]: SvavaGudjonsdottir [email protected]: IngridModig,[email protected] BjarteMellemstrand,[email protected]: UllaSundberg,[email protected] JohnKling,[email protected]
Ytterligareinformationomstatistikfråndeenskildanordiskaländernakanfåspåföljandekontaktadresser:
Danmarks StatistikBibliotekogInformationtel.:+4539173030fax:+4539173003e-mail:[email protected],Internet:www.dst.dkHagstova Føroyatel.:+298352800fax:+298352801e-mail:[email protected]:www.hagstova.foGrønlands Statistiktel.:+299362360fax:+299362361e-mail:[email protected]:www.stat.glStatistikcentralen Statistiskabiblioteket,Informationsservicetel.:+358917342220fax:+358917342279e-mail:[email protected]:www.stat.fi
Ålands statistik- och utredningsbyråtel.:+3581825490fax:+3581819495e-mail:[email protected]:www.asub.axHagstofa ÍslandsUpplýsingaþjónustatel.:+3545281000fax:+3545281099e-mail:[email protected],Internet:www.statice.isStatistisk sentralbyrå Bibliotekoginformasjonssenterettel.:+4721094642fax:+4721094504e-mail:[email protected],Internet:www.ssb.noStatistiska centralbyrånInformationochbibliotektel.:+46850694801fax:+46850694899e-mail:[email protected]:www.scb.se

141·
Appendix 2: Geonomenclature
The Nordic countries:Denmark,Finland,Iceland,Norway,Sweden,FaroeIslands,GreenlandandÅland.
The Euro-area:Austria,Belgium,Cyprus,Luxembourg,Finland(inclusiveÅland),France,Germany,Greece,Ireland,Italy,Malta,Netherlands,Portugal,Spain,SlovakiaandSlovenia.
The EU-15:Austria,Belgium,Luxembourg,Denmark(exclusiveGreenlandandFaroeIslands),Finland(inclusiveÅland),France,Germany,Greece,Ireland,Italy,Netherlands,Portugal,Spain,SwedenandUnitedKingdom.
The EU (27 countries = EU-27):EU-15,Bulgaria,Cyprus,CzechRepublic,Estonia,Hungary,Latvia,Lithuania,Malta,Poland,Rumania,Slovakia,Slovenia.
EEA – European Economic Area:EU-27,Norway,IcelandandLiechtenstein.
The Baltics:Estonia,LatviaandLithuania.
Other Europe:Albania,Andorra,Belarus,BosniaandHerzegovina,Croatia,Kosovo,Serbia-Montenegro,FormerYugoslavRepublicofMacedonia,Gibraltar,Moldova,Montenegro,RussianFederation,SanMarin,Schweiz,Turkey,Ukraine,VaticanCity.
Africa:EgyptandSouthAfrica+OPEC-Africa+OtherAfrica.
OPEC-Africa:Algeria,Libya,NigeriaandGabon.
Other Africa:Angola,Benin,Botswana,BritishIndianOceanTerritory,BurkinaFaso,Bu-rundi,Cameroon,CapeVerde,CentralAfricanRepublic,CeutaandMelilla,Chad,Comoros,Congo(Dem.Rep.)Congo(Republic),Djibouti,EquatorialGuinea,Eritrea,Ethiopia,Gambia,Ghana,Guinea,Guinea-Bissau,IvoryCoast,Kenya,Lesotho,Liberia,Madagascar,Malawi,Mali,Mauritania,Mauritius,Mayotte,Morocco,Mozambique,Namibia,Niger,Rwanda,SaoToméandPrincipe,Senegal,Seychellesanddependencies,SierraLeone,Somalia,SaintHelenaanddependencies,Sudan,Swaziland,Tanzania,Togo,Tunisia,Uganda,ZambiaandZimbabwe.
America:UnitedStatesofAmerica(USA),CanadaandBrazil+OPEC-America+OtherAmerica.
OPEC-America:EcuadorandVenezuela.
Other America:Anguilla,AntiguaandBarbuda,Argentina,Aruba,Bahamas,Barbados,Belize,Bermuda,Bolivia,BritishVirginIslands,CaymanIslands,Chile,Colombia,CostaRica,Cuba,Dominica,DominicanRepublic,ElSalvador,FalklandIslands,Grenada,Guatemala,Guyana,Haiti,Honduras,Jamai-ca,Mexico,Montserrat,NetherlandsAntilles,Nicaragua,Panama,Para-guay,Peru,SaintKittsandNevis,SaintLucia,SaintPierreandMiquelon,SaintVincent,Surinam,TrinidadandTobago,TurksandCaicosIslands,UruguayandUSVirginIslands.
Asia:China,India,IsraelandJapan+OPEC-Asia+DAE+OtherAsia.
OPEC-Asia:Iran,Iraq,Indonesia,Kuwait,Qatar,SaudiArabiaandUnitedArabEmirates
DAE (Dynamic Asian Economies):HongKong,Malaysia,Singapore,SouthKorea,TaiwanandThailand.
Other Asia:Afghanistan,Armenia,Azerbaijan,Bahrain,Bangladesh,Bhutan,Brunei,Cambodia,Georgia,Jordan,Kazakhstan,Kyrghyzstan,Laos,Lebanon,Macao,Maldives,Mongolia,Myanmar,Nepal,NorthKorea,Oman,Paki-stan,Philippines,SriLanka,Syria,Tajikistan,Turkmenistan,Uzbekistan,Vietnam,WestBankandGazaStripandYemen.
Oceania:Australia+OtherOceania.
Other Oceania:AmericanSamoa,AustralianOceania,FederatedStatesofMicronesia(Yap,Kosrae,ChuukandPohnpei),Fiji,Kiribati,FrenchPolynesia,Mar-shallIslands,Nauru,NewCaledoniaanddependencies,NewZealand,NewZealandOceania,NorthernMarianaIslands,Palau,PapuaNewGuinea,Pitcairn,PolarRegions,SolomonIslands,Tonga,Tuvalu,Van-uatu,WallisandFutunaIslandsandWesternSamoa.
Other and unknown:Storesandprovisions,othercountriesandterritoriesnotdeterminedordisclosed.
Appendix2:Geonomenclature·Bilaga2:Grupperingaravländer
142 ·Subjectindex–English·Sakregister–engelska
Subject index A abortions40absencefromwork65acidification27–31activityrates7,127activityrates127adoption,cashbenefits67ageburden36,38ageingpopulation36,38agriculture90–91arableland90cropproduction90–91fertilizers30organic32pesticides31agriculture,forestryandfishery89employment88,131–132aidtodevelopingcountries116–117airpollution27–31alcohol74alternativeenergy25–26ammonia(NH)29arableland90areaarableland23–24forests9–16,23icecap9–16,23–24organic32land7,22–24lakes9–16,23–24total7,9–16,22–24water9–16,23–24
assets86,106,114asylumrequests47–49unaccompaniedchildren49citizenship48
Bbalanceofgoods88,99,107balanceofgoodsandservices88,99,107balanceofpayments86,106–107balanceoftrade99,107beds,hospitals70births37,39cashbenefits67broadband,enterprisesaccess57books76libraries76publishing76
Ccancer71–72capital,population9–16,22carbondioxide27–28cashbenefits63,65,67adoption67childbirth67pregnancy67sickness67causesofdeath71–73CH4(methane)27chemicalfertilizers31childbirth,cashbenefits67childrenday–carecentres66familieswith/without41
unaccompaniedsocialassistance67socialexpenditure67climate18–20,27CO2(carbondioxide)27–28commercialfertilizers30commuters134–136constructionemployment131–132consumerpriceindex118–119consumptionenergy25fertilizers30food88,115pesticides31private88public87,111cropproduction91culture75–76currencyreserve86
Dday–carecentres,children66deaths37,71–73cancer71–72cardiovasculardiseases71suicide73debt,public86,106,114–115demographicchange37dentists70developmentaiddevelopment,substainablediseasescancer71–72
143·
cardiovascular71disposableincome,households60sex61divorcedpersons42–43divorces42–43
Eeconomickeyfigures7,86economictrends85–96economicgrowth86–87education76–83graduates80studentsabroad109studentsenrolled78–79educationsystem77educationallevel81–83effectivenominalexchangerateindex86,123elections50electedcandidates50national50validvotes50validvotes50part–time133emigration37,45,46country45emissions7,25,27–29emissions25,27–31employment127,131–133agriculture,forestryandfishery89,131–132byindustry95,131–132construction131–132ICTsector55,131–132manufacturing89,95–96,127R&D131–132
servicesector96,131–132sex127,131emplymentrates7,127employmentrates127energy25–26energyconsumption25percapita7,25energyproduction7,25energysupply26environment18–32exchangerates121–123index86exports97–104balanceoftrade99,107commodity104–105country101–102extra–Nordic101–102goodsandservices88,111index98intra–Nordic100–102externaltradeseeforeigntrade97–105
Ffamilies41income60socialexpenditure63with/withoutchildren41fertility7,39fertilizers30fishery93–94fisheryseealsoagriculture,forestryandfisheryfishing,catches93–94foreigndebt86,106foreignassetsandliabilities86,106
foreignexchangereserve86foreigndirectinvestments108foreigntrade97–105balanceoftrade99,107commodity104–105country101–102extra–Nordic101–102goodsandservices106,107index98intra–Nordic100–102foreigners44–46emigration45,46immigration44,46NordiccitizensinNordiccountries44–46forestry23,89,92forestryseealsoagriculture,forestryandfishery89,92forest9–16,23fungicides31
Ggas25–26generalgovernmentgeneralgovernmentexpenditureR&D52–54generalgovernmentrevenue113geothermalenergy25–26(geo..)25–26globalwarming27globalisation97–109goodsandservices88,107,99balanceof88,107,99foreigntrade88,107,99graduates80grain91
Subjectindex–English·Sakregister–engelska
144 ·Subjectindex–English·Sakregister–engelska
production91greenhousegases25,27–28grossdebt115grossdomesticproduct(GDP)7,86–87,98–99,111,114,122percapita7,87,122grossfixedcapitalformation88grossnationalincome(GNI)116grossvalueadded93,96manufacturing93servicesector96consumption30
Hhealthcare67healthcareexpenditure69,111–112healthstaff70herbicides31homepages,enterpriseswith57house120index120prices120householdsincome60hydropower25–26Iicecaparea9–16,23–24ICTsector55–58employment55–56,131–132illness65absencefromwork65cashbenefits67immigration37,44,46
country44imports97–103,105balanceoftrade99,107commodity104–105country101–102extra–Nordic101–102goodsandservices4,88,107index98intra–Nordic100–102income60–61,113generalgovernment113households60personal60–61sex61incomedistribution60–61indigenousenergyproduction25–26inflation86inhabitantspersqkm27,24insecticides31interestrates86,122Internet56–58enterprisesaccess57privateaccess58use56–58investments,foreigndirect108
Llabourforce126–136labourforce89,95–96,127,131–132labourforceparticipationrate7,127labourmarket126–136landarea9–16,22–24lakes9–16,23–24landuse23
leisure75–76liabilities86,106libraries76stock76volumeslent76lifeexpectancy7,35lifeexpectancy35livebirths37,39longevity35–38
Mmanufacturing95manufacturingemployment95–96131–132grossvalueadded94maritalstatus42–43marriages42–43marriedpersons42–43maternitybenefits67meadows23methane(CH4)27migration37,44–46mortality71–73museums,visits75part–timeemployment133NN2O(nitrousoxide)27–28naturalgas25–26naturalpopulationincrease37,39netexport98–99netmigration37nettaxes111netdebt114–115
145·
netassets106NH(ammonia)29nitrogen(N)30nitrogenoxides(NOx)29nitrousoxide(N2)27non–nationalsemigration45–46immigration44,46NordiccitizensinNordiccountries44–46NordiccitizensinNordiccountries44–46NOx(nitrogenoxides)29keyfigures,economic7,86nuclearpower25–26nursinghomes63–64
Ooil25–26oldage,socialexpenditure63–64oldagepension64oldpeople’shomes63–64organicfarming32ozonedepletion27–28
Ppaper92partnerships,registrered43partnerships,dissolved43science52–54particulates27pastures23pastures23pensioners64pensions64pesticides31
consumption31phosphorus(P)30physicians70pollution27–31air27–31soil27–31water27–31population7,9–16,22,24,33–50capital9–16,22inhabitantspersqkm27,24maritalstatus42–43migration37,44–46non–nationals44–46NordiccitizensinNordiccountries44–46total9–16,25,34populationchange37populationdensity22,24populationprojections38potassium(K)30poverty,relativepregnancy,cashbenefits67priceindexconsumerprices118–119inflation86pricelevels118121pricelevels118121privateconsumptionexpenditure88publicbalance,surplus7,86,114publicconsumptionexpendituredevelopmentaid116–117publicdebt7,86,114–115publicbalance,deficit114publicdebt111–112publicfinanceandprices111–125
publicrevenue113pulp92pupilsseestudentspurchasingpower60–61,87,121–122
Qqualityoflife59–76
RR&D52–54employment131–132governmentappropriations52–54realestate120index120prices120researchanddevelopment(R&D)52–54relativepoverty62realannualgrowth87renewableenergy25–26residentialinstitutions63retirementpension64
Ssami17separatedpersons42–43servicehousing63servicesectoremployment96,131–132grossvalueadded96sharepriceindex86,124shareprices106,124sickness65absencefromwork65cashbenefits67
Subjectindex–English·Sakregister–engelska

146 ·Subjectindex–English·Sakregister–engelska
sicknessbenefits67singlepersons42–43smoking74SO2(sulphurdioxide)29socialassistance63,67,68adoption67childbirth67pensions64pregnancy67recipients63–64,67sicknessbenefits67socialexpenditure63,65socialsecurity111–112soilpollution27–31solidfuels25–26SOx(sulphuroxides)27–28studentsabroad109enrolled78–79financialsupport84graduated80studyallowances84substainabledevelopmentsuicides73sulphurdioxide(SO2)29sulphuroxides(SOx)27supplyanddemand88
Ttaxburden7taxes7,113technology55–58tradebalance99,107
U unemployment7,86,128–130unaccompaniedchildren133ageandsex129unemploymentrates7,86,128sex130unmarriedpersons42–43
V VOC(volatileorganiccompounds)27voting50waterarea9–16,23–24waterpollution27–31waterpower25–26widows/widowers43woodproducts,produktion92workcommuting134–136

147·
Sakregister
A aborter40 aktiekurser106,124 aktiekursindex86,124 alkohol74 alternativenergi25–26 ammoniak(NH3)29 arbetsfrånvaro65 arbetskraft127,131–133 relativaarbetskraftstal7,127 deltidsanställning133 arbetslöshet 7,86,128–130könochålder129 arbetslöshetsprocent7,86,128kön130 arbetsmarknad126–136 areal ekologisk32 glaciärer9–16,23–24 land7,22–24 sjöar9–16,23–24 skog9–16,23 total7,9–16,22–24vatten9–16,23–24 åkermark23–24 asylansökningar47–49 ensamkommandebarn49 medborgarskap48 B barn daghem66
ensamkommande49 familjermed/utan41 socialautgifter67 barnomsorg66 befolkning7,9–16,22,24civilstånd42–43 folkmängd9–16,25,34huvudstäder9–16,22 invånareperkm27,24 migration37,44–46 nordiskamedborgareiannatnordisktland44–46 utländskamedborgare44–46 befolkningsförändringar37 befolkningsprognoser38 befolkningstäthet22,24 befolkningsutvecklingen36–38 bekämpningsmedel31 konsumption31 betalningsbalans86,106–107 betesmark23 bibliotek76 bokbestånd76 utlåning76 biståndtillutvecklingsländer116–117 boende,äldre63 bredband,företagstillgång57 bruttoförädlingsvärde93,96 servicenäringar96 tillverkningsindustri93 bruttonationalinkomst(BNI)116 bruttonationalprodukt7,86–87,98–99,111perperson7,87,122bruttoskuld115 byggindustri
sysselsättning131–132 bytesbalans86,106–107 böcker76 biblioteker76 publicering76 C cancer71–72 CH4(metangas)27 civilstånd42–43 CO2(koldioxid)27–28 D daghem,barn66 deltidsanställning133 dikväveoxid(N2O)27 disponibelinkomst,hushåll60 kön61 döda37,71–73 cancer71–72 hjärt–ochkärlsjukdomar71 självmord73 dödlighet71–73 dödsorsaker71–73 E ekologiskjordbruk32 ekonomiskanyckeltal7,86 ekonomiskatendenser85–96 ekonomisktillväxt86–87 eleversestudenter emigration37,45–46land45
Subjectindex–Swedish·Sakregister–svenska

148 ·Subjectindex–Swedish·Sakregister–svenska
emission7,25,27–29energi25–26 energiförbrukning25 perperson7,25 energiproduktion7,25 energitillgång26 ensamkommandebarn133 export97–104 handelsbalans99,107 index98 land101–102 tillnordiskaländer100–102 utomnordisk101–102 varorochtjänster88,111 varugrupp104–105 F familjer41 inkomst60 med/utanbarn41 socialautgifter63 fastabruttoinvesteringar88 fastabränslen25–26 fastighet120 index120 priser120 fattigdom,relativ62 fertilitet7,39 fiske93–94 fiskeseocksåjordbruk,skogsbrukochfiske fiskefångster93–94 flyktigaorganiskaämnen(VOC)27 folkmängd7,9–16,23–24,33–50befolkningsprognoser38
förändringar37 huvudstad9–16,22 invånareperkm27,24 nordiskamedborgareiannatnordisktland44–46 utländskamedborgare44–46 folkökning37 forskningochutveckling(FoU)52–54 fosfor(P)30 FoU52–54 sysselsättning131–132 utgifter52–54 fritid75–76 fruktsamhet39 födda37,39 förnyelsebaraenergikällor25–26 föroreningar27–31 jord27–31 luft27–31 vatten27–31 försurning27–31 försörjningsbalans88 förväntadlivslängd7,35 föräldrapenning67 G gas25–26 geotermiskenergi25–26 gifta42–43 giftermål42–43 glaciärer,areal9–16,23–24 globaluppvärmning27 globalisering97–109 grödor91 gödningsmedel30
konsumption30 H handelsbalans99,107 handelsgödsel30 havandeskapspenning67 hemsida,företagmed57 hushåll inkomst60 huvudstad,folkmängd9–16,22 befolkning9–16,22 hälso–ochsjukvårdspersonal70 hälsovård68–70,111–112 hållbarutveckling18–20 I icke–medborgare invandring44,46 nordiskamedborgareiannatnordisktland44–46utvandring45–46 immigration37,44,46 land44 import97–103,105 handelsbalans99,107 index98 land101–102 tillnordiskaländer100–102 utomnordisk101–102 varorochtjänster88,107 varugrupp104–105 industri95 inflation86 inhemskenergiproduktion25–26 inkomst97,60–61,113

149·
disponibel60–61 hushåll60 kön61 offentligasektorn113 inkomstfördelning60–61 insektsmedel31 Internet56–58 företagstillgång57 privattillgång58 änvändning56–58 invandring37,44,46 land44 investeringer,utländskadirekt108 invånareperkm27,24 IT–sektorn55–58 sysselsätttning55–56,131–132 J jordbruk90–91 ekologisk32 bekämpningsmedel31 handelsgödsel30 vegetabiliskproduktion90–91 åkermark90 jordbruk,skogsbrukochfiske89 sysselsättning88,131–132 jordföroreningar27–31 jordvärme25–26 K kalium(K)30 klimat18–20,27koldioxid(CO2)27–28
kollektivkonsumtion FoU52–54 konstgödsel30 konsumentprisindex118–119 konsumtion bekämpningsmedel31 energi25 handelsgödsel30 livsmedel88,115 offentligasektorn87,111 privat88 kultur75–76 kväve(N)30 kväveoxider(NOx)29 kärnkraft25–26 köpkraftspariteter(PPP)60–61,87,121–122 L landareal9–16,22–24 levandefödda37,39 livskvalitet59–76 livslängd35–38 luftföroreningar27–31 läkare70 M markanvändning23 medellivslängd35 metangas(CH4)27 migration37,44–46 miljö18–32 museibesök75
N N2O(dikväveoxid)27–28 naturgas25–26 naturligfolkökning37,39 nettoexport98–99 nettomigration37 nettoskatter111 nettoskuld114–115 nettotillgång106 NH3(ammoniak)29 nordiskamedborgareiannatnordisktland44–46 NOx(kväveoxider)29 nyckeltal,ekonomiska7,86 O offentligekonomiochpriser111–125 offentligasektorn inkomster113 skulder7,86,114–115underskott114 utgifter111–112 utgifter,FoU52–54 utgifter,sjukvård69 överskott7,86,114ogifta42–43 ogräsmedel31 olja25–26 ozonuttunnandeämnen27–28 P papper92 partnerskap,registrerade43 partnerskap,avregistrerade43 partiklar27
Subjectindex–Swedish·Sakregister–svenska

150 ·
pendlare134–136 pensionärer64 permanentängsmark23 prisindex inflation86 konsumentpriser118–119 prisnivåer118,121 privatkonsumtion88 produktionsindex,tillverkningsindustrin R realtillväxt87 relativfattigdom62 relativaarbetskraftstal7,127 räntenivå86,122rökning74 röstning50 giltigaröster50 S sami17separerade42–43 serviceboende63 servicenäringar bruttoförädlingsvärde96 sysselsättning96,131–132 sjukdomar cancer71–72 hjärt–ochkärl–71 sjukfrånvaro65 sjukpenning67 sjukvård67 sjukvårdskostnader69,111–112 sjukvårdspersonal70
självmord73 sjöar9–16,23–24 skatter7,113 skattetryck7 skilda42–43 skilsmässor42–43 skog,areal9–16,23 skogsbruk23,89,92skogsbrukseocksåjordbruk,skogsbrukochfiske89,92skulder,offentligasektorn86,106,114–115SO2(svaveldioxid)29 socialtrygghet111–112 socialautgifter63,65 socialbidrag63,65,67föräldrapenning67 havandeskapspenning67 mottagare67 SOx(svaveloxider)27–28 spannmål91 studenter examinerade80 inskrivna78–79 utomlands109 studiestöd84 svampmedel31 svaveldioxid(SO2)29 svaveloxider(SOx)27 sysselsättning89,95–96,127,131–132byggindustri131–132 FoU131–132 IT–sektorn55,131–132 jordbruk,skogsbrukochfiske89,131–132 kön127,131 näringsgren89,95–96,127
servicenäringar96,131–132 tillverkningsindustri95,131–132 sysselsättningsintensitet127 T tandläkare70 teknologi55–58 tillgångar86,106,114tillverkningsindustri bruttoförädlingsvärde94 sysselsättning95–96,131–132 tjänstenäringar bruttoförädlingsvärde97 sysselsättning96,131–132 träprodukter produktion92 U utbildning76–83 examinerade80 studenter77–78 studenter,utomlands109 studiestöd84 utbildningsnivå81–83 utbildningssystem77 utgifter FoU52–54 offentliga86,111–112 sociala60,62–63 utlandsstuderande109 utlandsskuld86,106 utländskamedborgare44–46invandring44,46 nordiskamedborgareiannatnordiskland44–46
Subjectindex–Swedish·Sakregister–svenska

151·
utvandring44,46 utländskadirektinvesteringer108 utländskatillgångarochskulder86,106 utrikeshandel97–105 handelsbalans107,99 index98 inomnordisk100–102 land101–102 utomnordisk101–102 varorochtjänster106,107 varugrupp104–105 utsläpp25,27–31 utsläpptilljord27–31 utsläpptillluft27–31 utsläpptillvatten27–31 utvandring37,44,46land46 utveckling,hållbar18–20 utvecklingsbistånd116–117 V val50 giltigaröster50 invaldaledamöter50 nationella50 valutakurser121–123 valutakursindex86,123 valutareserv86 varorochtjänster,utrikeshandel88,107,99varu–ochtjänstebalans88,99,107vatten,föroreningar27–31 vattenareal9–16,23–24 vattenkraft25–26 vegetabiliskproduktion90–91
vetenskap52–54 VOC(flyktigaorganiskaämnen)27 vårdplatser,sjukhus70 växelkurser123 växthusgaser25,27–28 Å åkermark90 ålderdom serviceboende63–64 socialautgifter63–64 åldrandebefolkning36,38årligrealtillväxt87 Ä äktenskap42–43 äktenskapsskillnader42–43 äldrebörda36,38 ängsmark23 änklingar/änkor43
Subjectindex–Swedish·Sakregister–svenska

NSÅ 2010- omslag101010.indd 2 15-10-2010 11:55:22
Ved Stranden 18DK-1061 Copenhagen K
www.norden.org
Nord 2010:001ISBN 978-92-893-2137-2ISSN 0903-7004
Nordic Statistical Yearbook 2010 is published for the 48th time. It is a reference book containing comprehensive and easily accessible statistics of various aspects of social life in the five Nordic countries, i.e. Denmark, Finland, Iceland, Norway and Sweden. In addition data are also presented on the selfgoverning regions, i.e. the Faroe Islands, Greenland and the Åland Islands. The aim of the yearbook is, as far as possible, to present comparable data on the Nordic countries. Additional tables can be found free of charge on our homepage. Here It is also possible to read and download the Nordic Statistical Yearbook in pdf format free of charge.
Nordisk statistisk årsbok utkommer nu för 48:e gången. Årsboken är en uppslagsbok, som avser vara en samman-fattande och överskådlig redovisning av statistik över sam-hällsförhållandena i de fem nordiska länderna Danmark, Finland, Island, Norge och Sverige. I många av tabellerna redovisas också uppgifter om de självstyrande områdena Färöarna, Grönland och Åland. Syftet med årsboken är att lägga fram sinsemellan jämförbara uppgifter om de nordiska länderna. Ytterligare tabeller finns tillgängliga gratis på vår hemsida. Här är det också möjligt att kostnadsfritt läsa och ladda ner boken i pdf-format
Nordic Statistical Yearbook 2010 Nordisk statistisk årsbok 2010
NSÅ 2010- omslag101010.indd 3 15-10-2010 11:55:22