7.91 / 7.36 / 20.490 / 20.390 / 6.874 / 6.801 / hst.506 c ... · global alignment of protein...
TRANSCRIPT

7.91 / 7.36 / 20.490 / 20.390 / 6.874 / 6.801 / HST.506
C. Burge Lecture #6Feb 13, 2014
Comparative Genomics
1

Global Alignment of Protein Sequences(NW, SW, PAM, BLOSUM)
• Global sequence alignment (Needleman-Wunch-Sellers)• Gapped local sequence alignment (Smith-Waterman) • Substitution matrices for protein comparison
Background: Z&B Chapters 4,5 (esp. pp. 119-125)
2
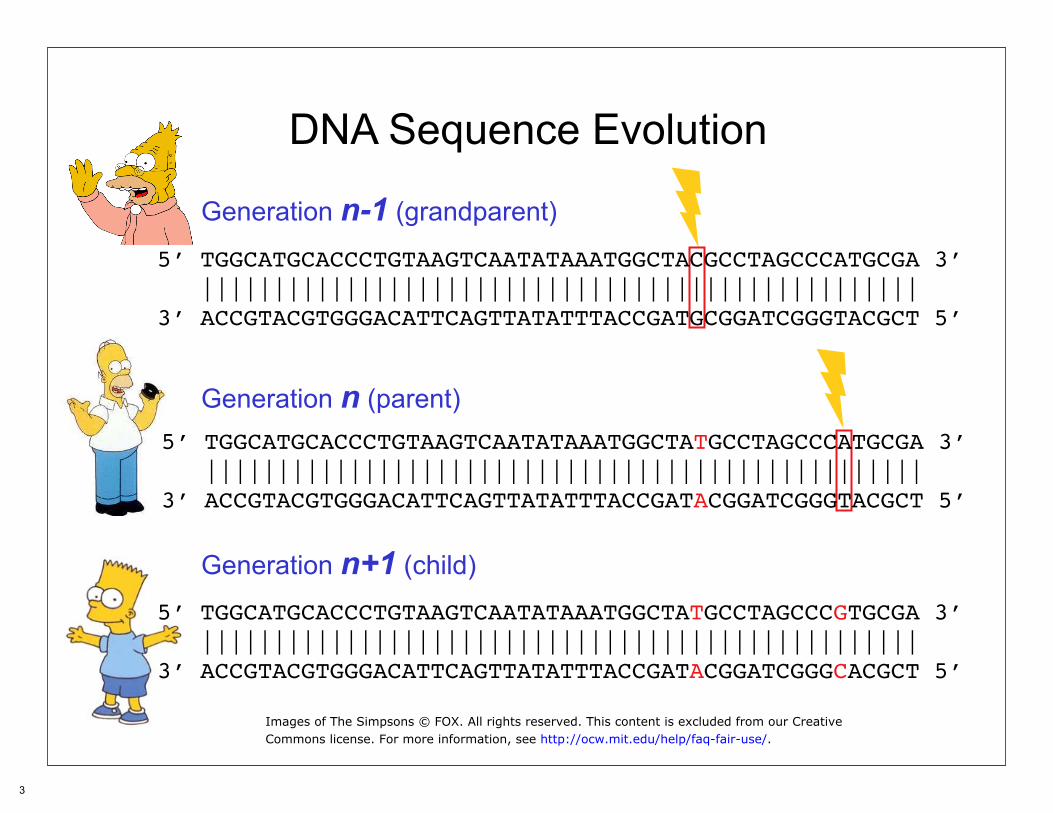
DNA Sequence Evolution
Generation n-1 (grandparent)
Generation n (parent)
5’ TGGCATGCACCCTGTAAGTCAATATAAATGGCTACGCCTAGCCCATGCGA 3’ ||||||||||||||||||||||||||||||||||||||||||||||||||3’ ACCGTACGTGGGACATTCAGTTATATTTACCGATGCGGATCGGGTACGCT 5’
5’ TGGCATGCACCCTGTAAGTCAATATAAATGGCTATGCCTAGCCCATGCGA 3’ ||||||||||||||||||||||||||||||||||||||||||||||||||3’ ACCGTACGTGGGACATTCAGTTATATTTACCGATACGGATCGGGTACGCT 5’
Generation n+1 (child)
5’ TGGCATGCACCCTGTAAGTCAATATAAATGGCTATGCCTAGCCCGTGCGA 3’ ||||||||||||||||||||||||||||||||||||||||||||||||||3’ ACCGTACGTGGGACATTCAGTTATATTTACCGATACGGATCGGGCACGCT 5’
3
Images of The Simpsons © FOX. All rights reserved. This content is excluded from our CreativeCommons license. For more information, see http://ocw.mit.edu/help/faq-fair-use/.

Markov Model (aka Markov Chain)
Classical DefinitionA discrete stochastic process X1, X2, X3, … which has the Markov property:
P(Xn+1 = j | X1=x1, X2=x2, … Xn=xn) = P(Xn+1 = j | Xn=xn )
(for all xi, all j, all n)
In words:A random process which has the property that the future (next state) is conditionally independent of the past given the present (current state)
Andrey Markov, a Russian mathematician (1856 - 1922)
Stochastic Process: • a random process or • a sequence of Random Variables
4
Image is in the public domain.

Markov Model ExampleGrandpaSimpson
Past
HomerMarge
Present
P(Bart = a/a | Grandpa = A/a & Homer = a/a)
Future = P(Bart = a/a | Homer = a/a)
Bart
GrandmaSimpson
Genotype at the Apolipoprotein locus(alleles A and a) in successive generations ofboxed Simpson lineage forms a Markov model
This is because, e.g., Bart’s genotype is conditionally independent of Grandpa Simpson’s genotype given his father Homer’s genotype:
5
Images of The Simpsons © FOX. All rights reserved. This content is excluded from our CreativeCommons license. For more information, see http://ocw.mit.edu/help/faq-fair-use/.
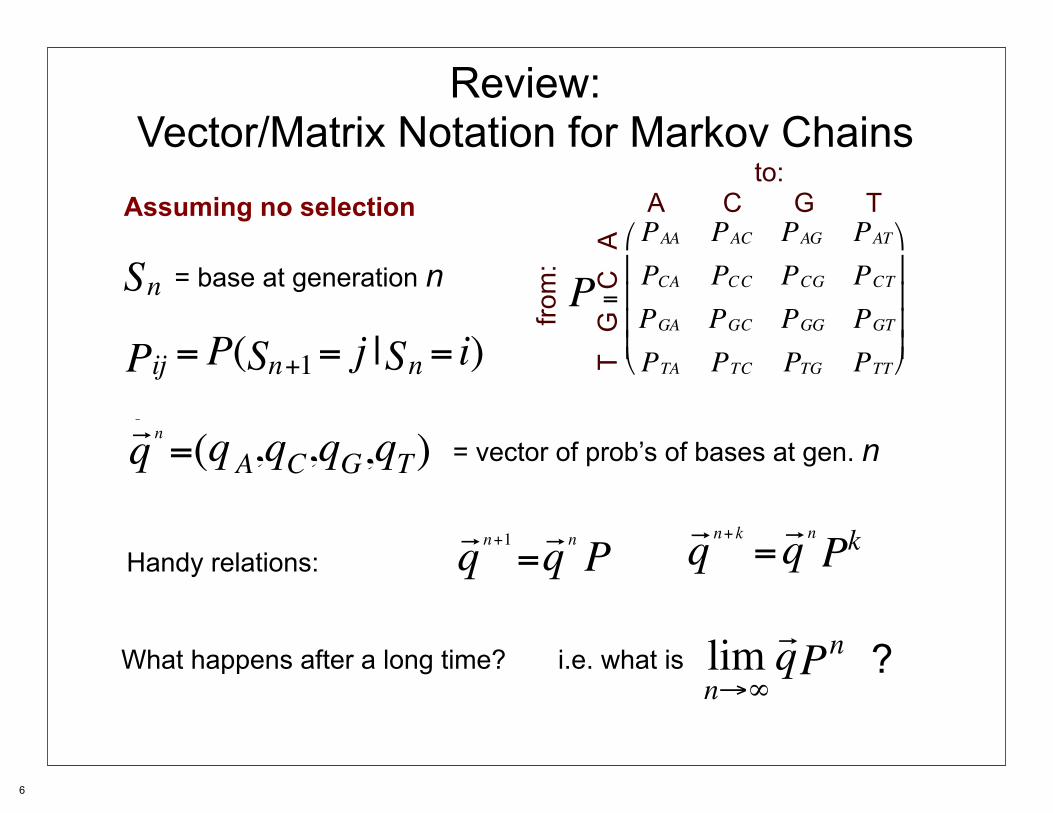
Review:Vector/Matrix Notation for Markov Chains
Assuming no selection
P =
AAP ACP AGP ATPCAP CCP CGP CTPGAP GCP GGP GTPTAP TCP TGP TTP
⎛
⎝
⎜ ⎜ ⎜ ⎜
⎞
⎠
⎟ ⎟ ⎟ ⎟
= base at generation n
ijP =P( n+1S = j | nS = i)nS
= vector of prob’s of bases at gen. n nr q =( Aq C,q G,q , Tq )
n+kr q = nr q kPHandy relations:
nq
nq
n+1r q = nr q P nq
n+1q n+ kq
What happens after a long time? i.e. what is limn→∞
q nP =r?
to:A C G T
from
:
T G
C
A
6

Ma,b = Λ mbΣ Ai,b i
Aa,b
PAM matrix derivationMa,b = mutation prob. matrixAa,b = observed subs of a,bmb = mutability of bfb = frequency of bSet scale factor Λ so thatΛ = a scaling constant
Σ fb Mb,b = 0.99 i.e. chance of mutating is ~ 1% b
This gives a probability matrix for an evolutionary distance of 1 PAM. Use matrix multiplication to calculate prob. matrices for other PAM distances, e.g., 20, 40, 60, 120, 250.
substitution scores for evolutionary distance d:
sa,b = 2 log2 (M da,b /fb) Recall: matrix multiplication
7

Issues with PAM Series?
• Read text about BLOSUM series.
• BLOSUM62 is the most commonly used matrix in practice.
8
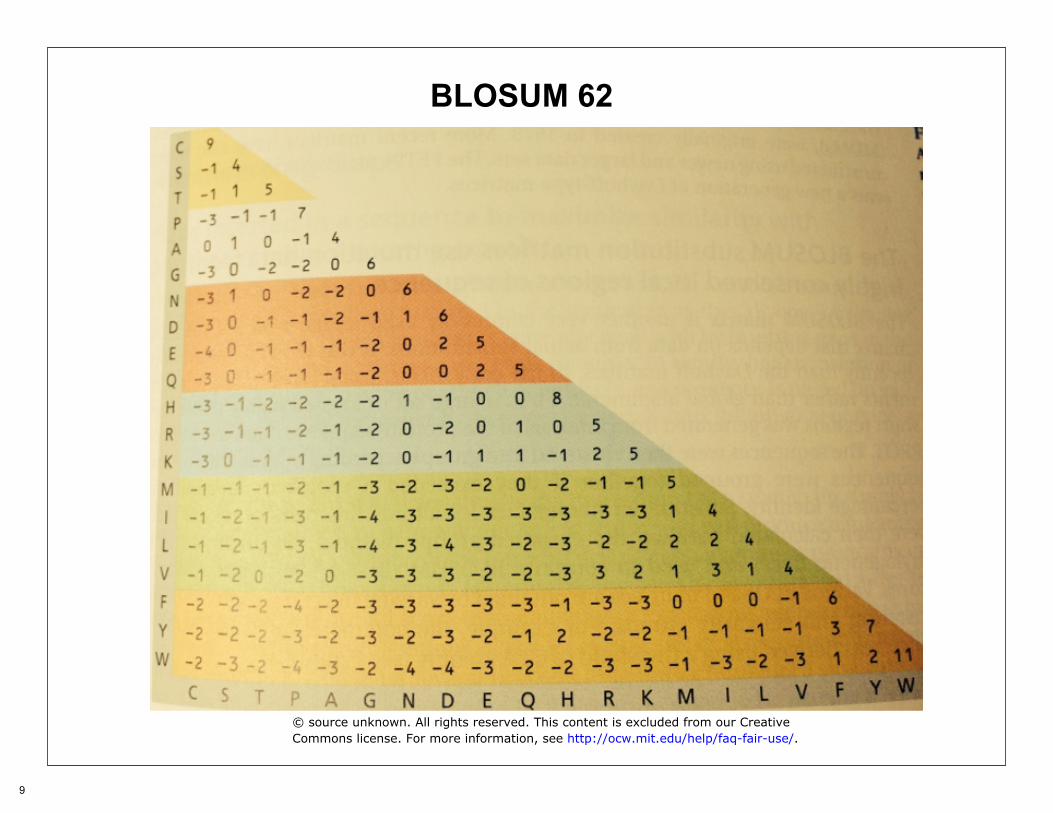
BLOSUM 62
9
© source unknown. All rights reserved. This content is excluded from our Creative Commons license. For more information, see http://ocw.mit.edu/help/faq-fair-use/.

Multiple Sequence Alignments
• Sequences are aligned so as to bring the greatest number of single characters into register, and maximize a score that rewards matches and penalizes mismatches, gaps
10

2 sequence alignment
Gap V D S C Y
0 -8 -16 -24 -32 -40-8
-8 4-16
-24
-32
-40
-48
i =0 1 2 3 4 5
j =
0 41
2
3
4
5
6
-4-3
-8 -12 -20 -28
-6
-14
-22-30
-38
73
-6
-14-22
-30
92 -1
1-7
-15
-9
1
3135
-17-7
03
23
Comp. complexity? O(mn) or O(n2) if both have length n
11

For 3 sequences….Length
ARDFSHGLLENKLLGCDSMRWE m.::. .:::. .:::: :::.GRDYKMALLEQWILGCD-MRWD n.::. ::.: .. :. .:::SRDW--ALIEDCMV-CNFFRWD p
An O(mnp) problemConsider sequences each 300 amino acids2 sequences – (300)2
3 sequences – (300)3
but for k sequences – (300)k
=> Need a more efficient algorithm(e.g., CLUSTALW - see Z&B Ch.6)
12

Comparative Genomics
• Markov models• Jukes-Cantor, Kimura models• Types of Selection: neutral, negative, positive
• Comparative genomics to understand gene regulation - a dozen examples
Readings:
12 papers posted under Comparative Genomics (optional)
Sabeti review (first 3 pages recommended)
13
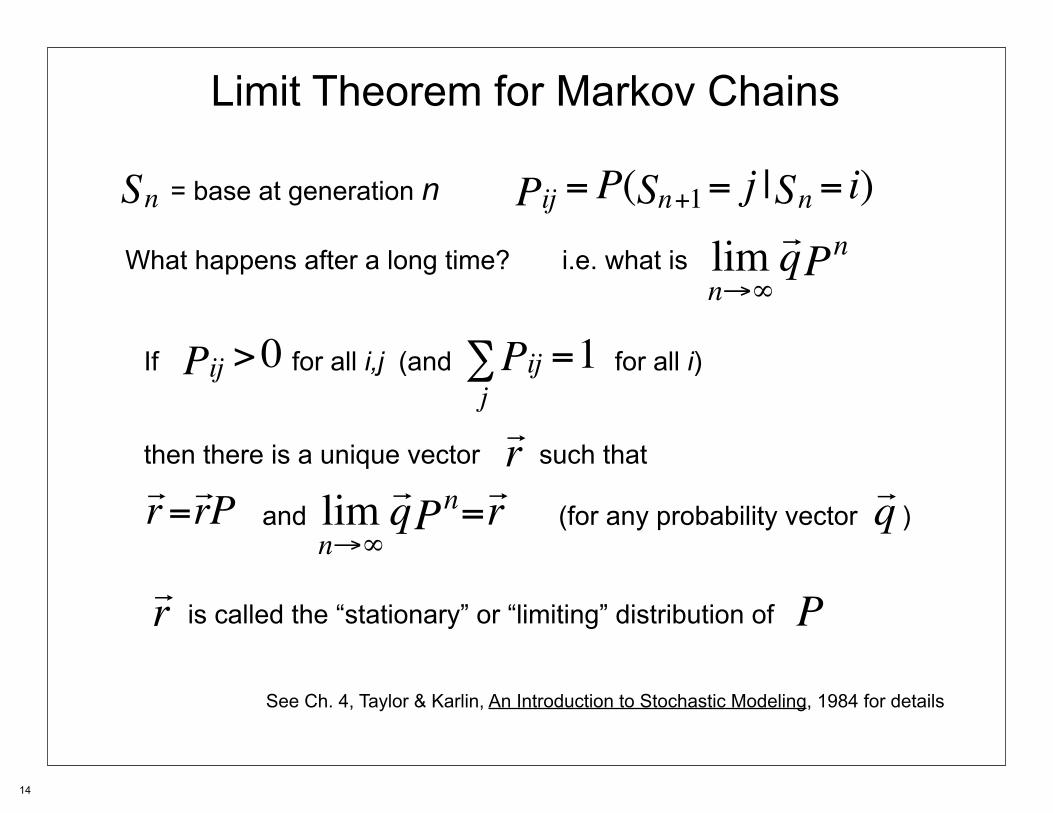
Limit Theorem for Markov Chains
Sn = base at generation n Pij =P(Sn+1= j |Sn = i)
li qWhat happens after a long time? i.e. what is m Pn=?r
n→∞
If for all Pij >0 i,j (and for all ∑Pij =1 i) j
then there is a unique vector such that r r=rP lim qPn=r q and (for any probability vector )
n→∞
r is called the “stationary” or “limiting” distribution of P
See Ch. 4, Taylor & Karlin, An Introduction to Stochastic Modeling, 1984 for details
14
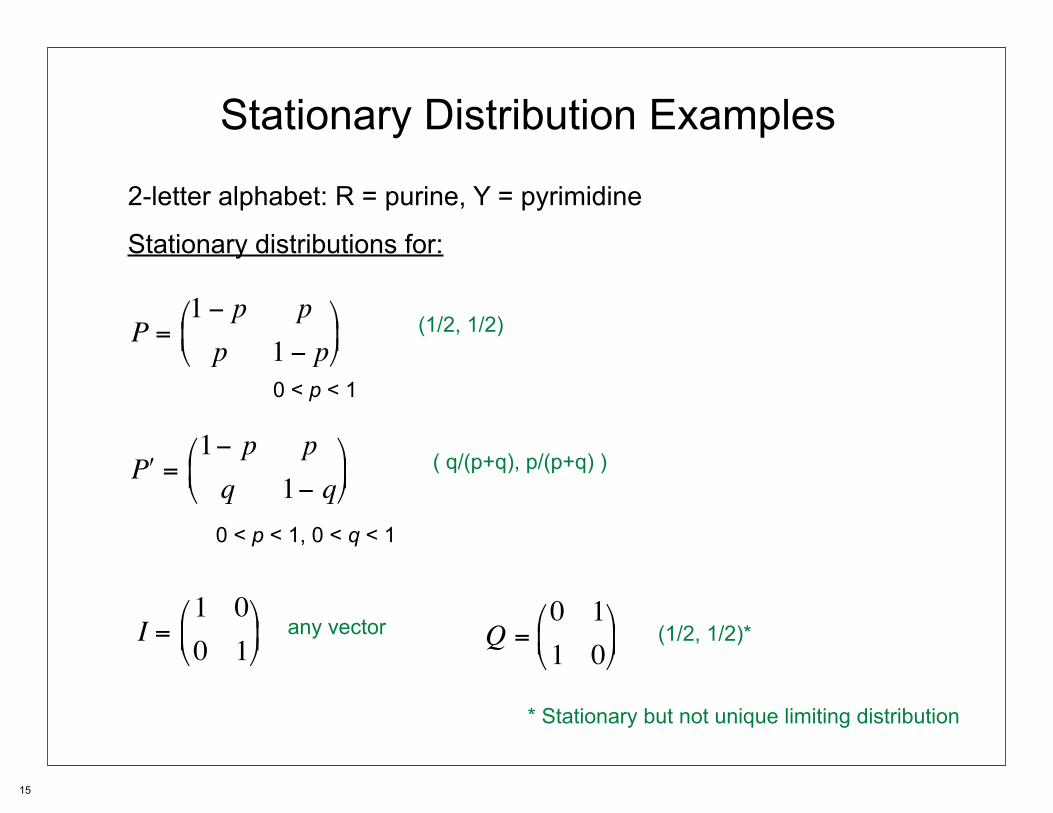
Stationary Distribution Examples
2-letter alphabet: R = purine, Y = pyrimidine
Stationary distributions for:
1 − p pP ⎛ ⎞
= (1/2, 1/2)⎜ p 1 p⎟ ⎝ − ⎠ 0 < p < 1
1− p pP ⎛ ⎞ ʹ′ = ( q/(p+q), p/(p+q) )⎜
⎝ q 1 ⎟ − q⎠
0 < p < 1, 0 < q < 1
⎛ 1 0I ⎞ 0 1
⎜ Q ⎛ ⎞ =⎝ 0 1⎟
any vector = ⎜ ⎝ 1 0⎟
(1/2, 1/2)*⎠ ⎠
* Stationary but not unique limiting distribution
15

Jukes-Cantor Model
G T
A C
Assume each nucleotide equally likely α to change into any other nt,
α with rate of change=α. α αα Overall rate of substitution = 3α
…so if G at t=0, at t=1, PG(1)=1-3αα
and PG(2)=(1-3α)PG(1) +α [1− PG(1) ]
Solving recursion gives PG(t)=1/4 + (3/4)e-4αt
Can show that this gives K = -3/4 ln[1-(4/3)d]
K = true number of substitutions that have occurred,d = fraction of nt that differ by a simple count (d ≤ 3/4)
Captures general behavior…
16
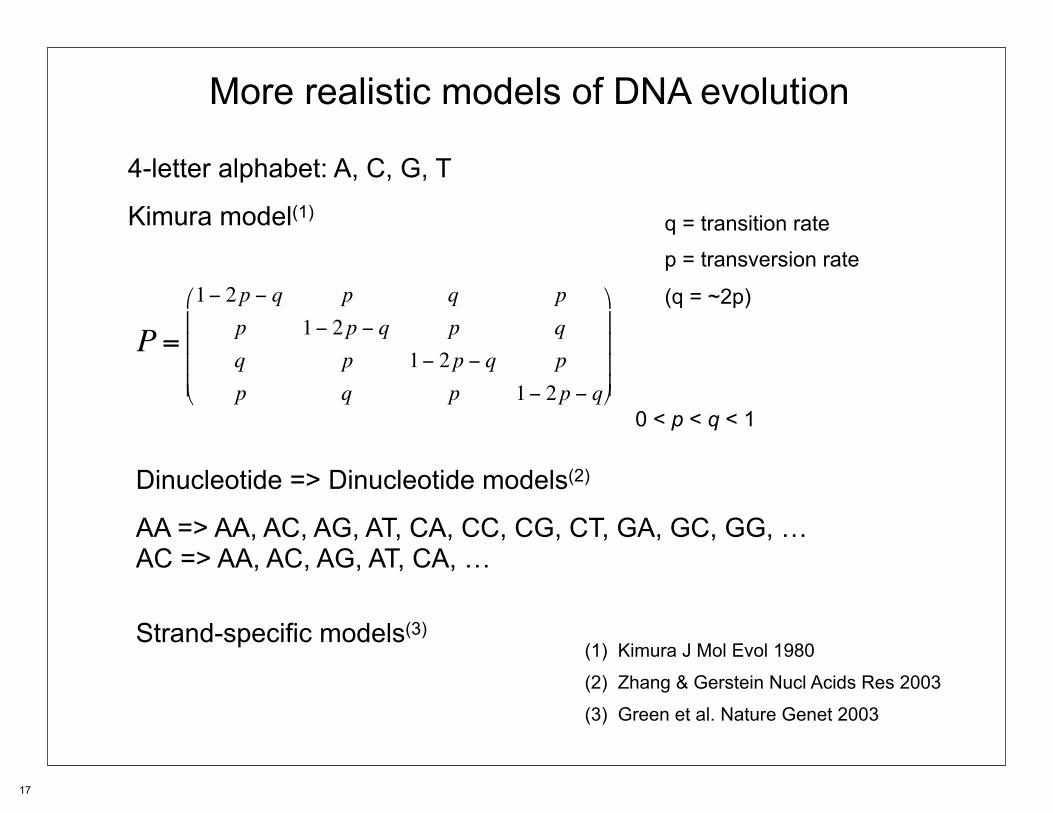
More realistic models of DNA evolution
4-letter alphabet: A, C, G, T
Kimura model(1)
0 < p < q < 1
P =1− 2p − q p q p
p 1− 2p − q p qq p 1− 2p − q pp q p 1− 2p − q
⎛
⎝
⎜⎜⎜⎜
⎞
⎠
⎟⎟⎟⎟
q = transition rate
p = transversion rate
(q = ~2p)
Dinucleotide => Dinucleotide models(2)
AA => AA, AC, AG, AT, CA, CC, CG, CT, GA, GC, GG, …AC => AA, AC, AG, AT, CA, …
Strand-specific models(3) (1) Kimura J Mol Evol 1980
(2) Zhang & Gerstein Nucl Acids Res 2003
(3) Green et al. Nature Genet 2003
17
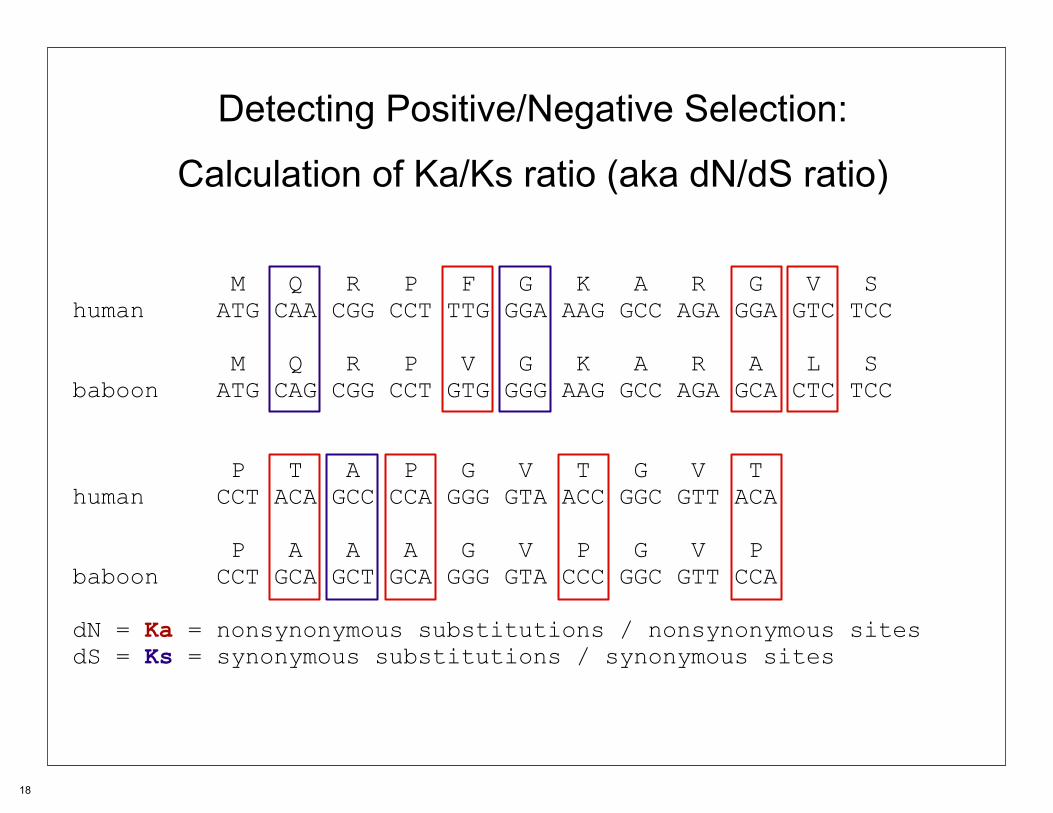
Detecting Positive/Negative Selection:
Calculation of Ka/Ks ratio (aka dN/dS ratio)
M Q R P F G K A R G V Shuman ATG CAA CGG CCT TTG GGA AAG GCC AGA GGA GTC TCC
M Q R P V G K A R A L Sbaboon ATG CAG CGG CCT GTG GGG AAG GCC AGA GCA CTC TCC P T A P G V T G V Thuman CCT ACA GCC CCA GGG GTA ACC GGC GTT ACA P A A A G V P G V Pbaboon CCT GCA GCT GCA GGG GTA CCC GGC GTT CCA dN = Ka = nonsynonymous substitutions / nonsynonymous sitesdS = Ks = synonymous substitutions / synonymous sites
18

Detecting Negative and Positive Selection in Coding Regions
Ka/Ks or dN/dS ratio:
Ka or dN = normalized rate of nonsynonymous changes per position
Ks or dS = normalized rate of synonymous changes per position
Corrected version: dS = 3/4 ln(1 - 4/3 pS), etc. (see Z&B pp. 240-241)
Common applications:
Identify genes or regions with Ka/Ks significantly less than one- These regions are likely to be under selection to conserve amino acid sequence
What kinds of genes or regions would you expect to have Ka/Ks ~ 1?
Identify genes or regions with Ka/Ks significantly greater than one- These regions are likely to be under selection to change amino acid sequence
More sophisticated tests for positive selection: McDonald-Kreitman, etc.
19

A dozen comparative genomics papers
To illustrate some of the types of things we can learn about gene regulation by comparing genomes, often using fairly simple methods
To provide examples of successful computational biology research projects
To gain experience in reading the literature in regulatory genomics
20

Types of comparative genomic analysesIdentification of regulatory elements of unknown functionBejerano et al. 2002...characterization of their functionsPennacchio et al 2006, Visel et al 2008, Lareau et al 2007...exploration of their originsBejerano et al 2006
Inference of the targeting rules for a class of trans-acting factorsLewis et al 2003, 2005
Identification of regulatory targets of a class of trans-acting factorsKheradpour et al 2008, Friedman et al 2009
Identification of new intra-genic interacting regulatory elementsGraveley 2005
Identification of a new class of trans-acting factorsJansen et al 2002
Identification of trans-genomic interacting regulatory elementsBolotin et al 2005
21
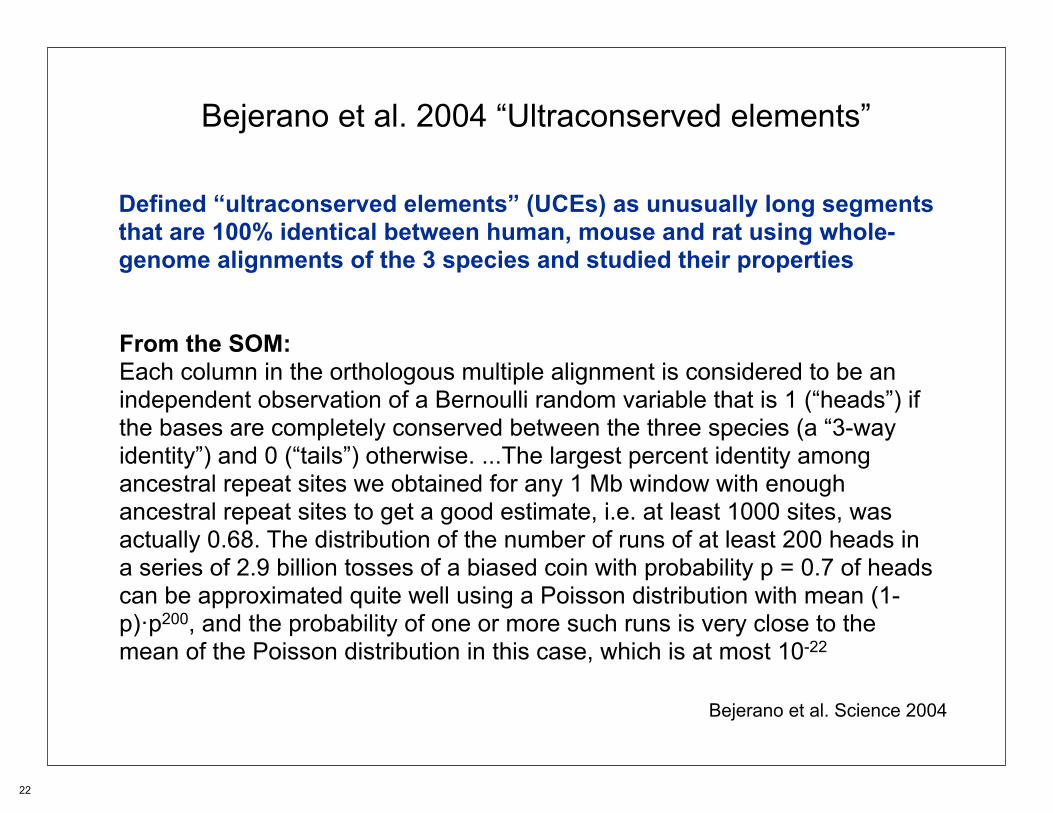
Bejerano et al. 2004 “Ultraconserved elements”
Defined “ultraconserved elements” (UCEs) as unusually long segments that are 100% identical between human, mouse and rat using whole-genome alignments of the 3 species and studied their properties
From the SOM:Each column in the orthologous multiple alignment is considered to be anindependent observation of a Bernoulli random variable that is 1 (“heads”) if the bases are completely conserved between the three species (a “3-way identity”) and 0 (“tails”) otherwise. ...The largest percent identity among ancestral repeat sites we obtained for any 1 Mb window with enough ancestral repeat sites to get a good estimate, i.e. at least 1000 sites, was actually 0.68. The distribution of the number of runs of at least 200 heads in a series of 2.9 billion tosses of a biased coin with probability p = 0.7 of heads can be approximated quite well using a Poisson distribution with mean (1-p)·p200, and the probability of one or more such runs is very close to the mean of the Poisson distribution in this case, which is at most 10-22
Bejerano et al. Science 2004
22

Features of UCEs
481 UCEs (≥ 200 bp):~100 overlap exons of known protein-coding genes ~100 located in introns of known genes~300 intergenic
93 type I genes overlap with exonic ultraconserved elements225 genes that are near the non-exonic elements are called type II genes
Bejerano et al. Science 2004
23
© American Association for the Advancement of Science. All rights reserved. This content is excludedfrom our Creative Commons license. For more information, see http://ocw.mit.edu/help/faq-fair-use/.Source: Bejerano, Gill, Michael Pheasant, et al. "Ultraconserved Elements in the Human Genome."Science 304, no. 5675 (2004): 1321-5.
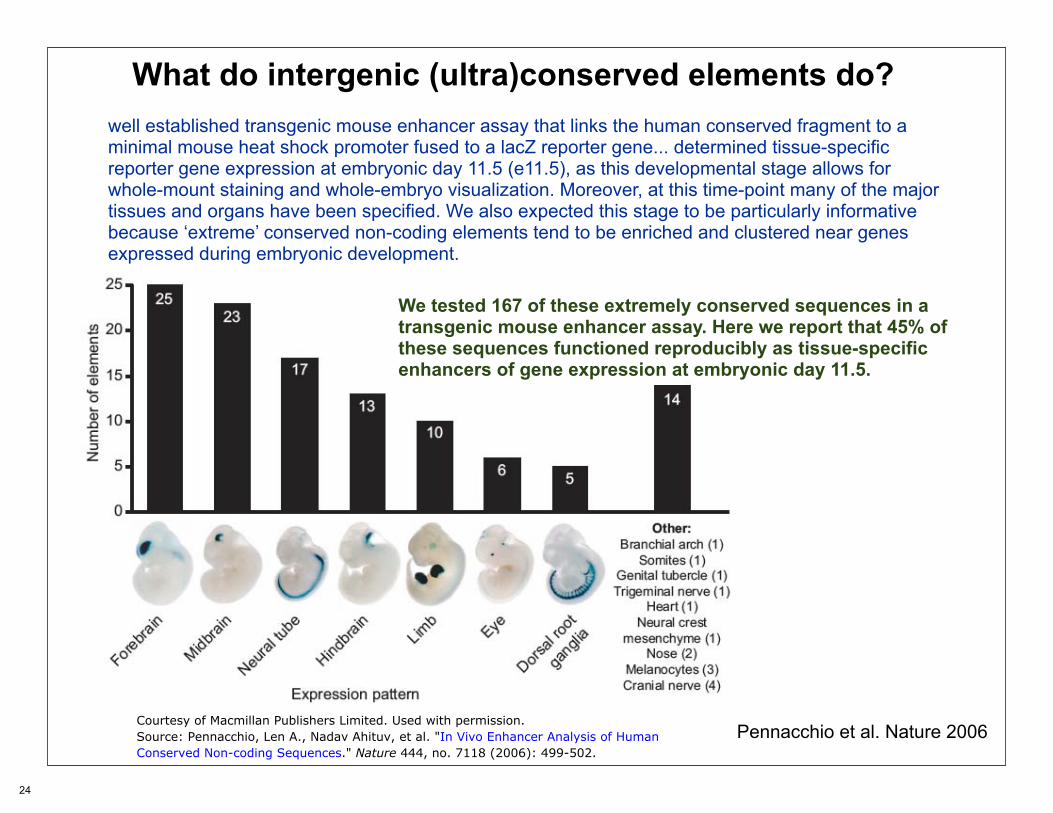
What do intergenic (ultra)conserved elements do?well established transgenic mouse enhancer assay that links the human conserved fragment to a minimal mouse heat shock promoter fused to a lacZ reporter gene... determined tissue-specific reporter gene expression at embryonic day 11.5 (e11.5), as this developmental stage allows for whole-mount staining and whole-embryo visualization. Moreover, at this time-point many of the major tissues and organs have been specified. We also expected this stage to be particularly informative because ‘extreme’ conserved non-coding elements tend to be enriched and clustered near genes expressed during embryonic development.
We tested 167 of these extremely conserved sequences in a transgenic mouse enhancer assay. Here we report that 45% of these sequences functioned reproducibly as tissue-specific enhancers of gene expression at embryonic day 11.5.
Pennacchio et al. Nature 2006
24
Courtesy of Macmillan Publishers Limited. Used with permission.Source: Pennacchio, Len A., Nadav Ahituv, et al. "In Vivo Enhancer Analysis of HumanConserved Non-coding Sequences." Nature 444, no. 7118 (2006): 499-502.

Do ultraconserved differ from highly conserved enhancers?
Visel et al. Nature Genet 2008
25
Courtesy of Macmillan Publishers Limited. Used with permission.Source: Pennacchio, Len A., Nadav Ahituv, et al. "In Vivo Enhancer Analysis of HumanConserved Non-coding Sequences." Nature 444, no. 7118 (2006): 499-502.
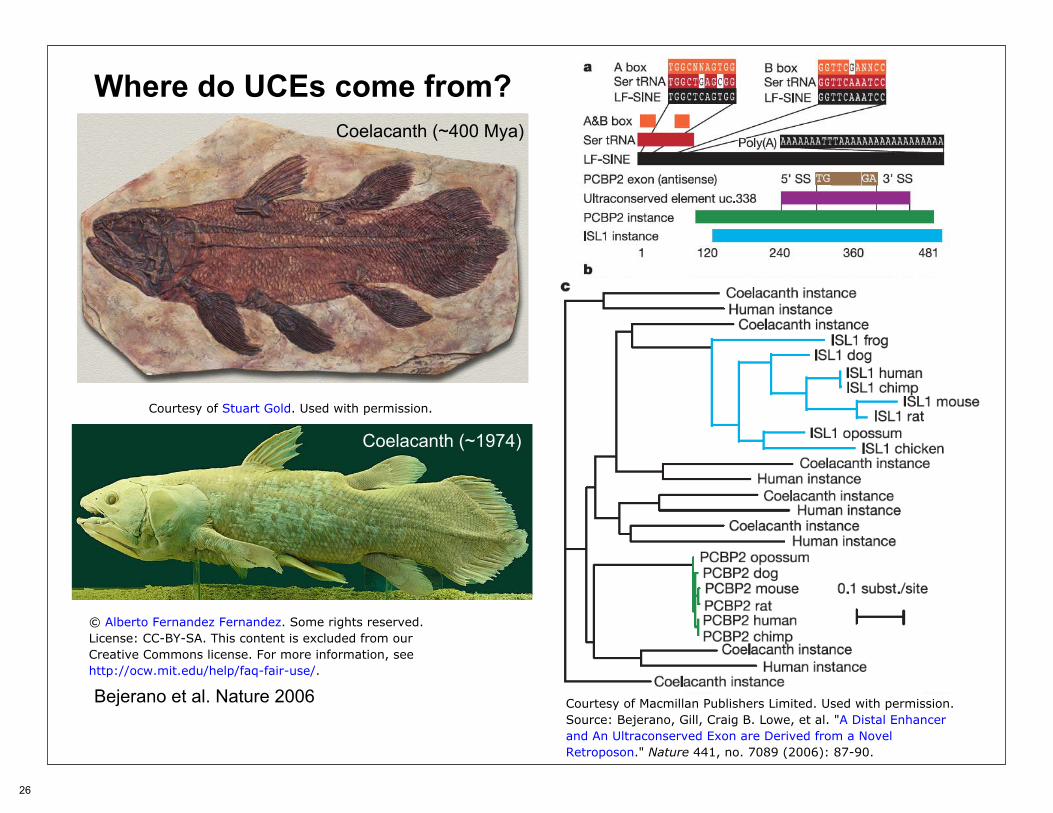
Where do UCEs come from?
Bejerano et al. Nature 2006
Coelacanth (~400 Mya)
Coelacanth (~1974)
26
Courtesy of Stuart Gold. Used with permission.
© Alberto Fernandez Fernandez. Some rights reserved.License: CC-BY-SA. This content is excluded from ourCreative Commons license. For more information, seehttp://ocw.mit.edu/help/faq-fair-use/.
Courtesy of Macmillan Publishers Limited. Used with permission.Source: Bejerano, Gill, Craig B. Lowe, et al. "A Distal Enhancerand An Ultraconserved Exon are Derived from a NovelRetroposon." Nature 441, no. 7089 (2006): 87-90.

Interpretation
After discovering mobile DNA elements, Barbara McClintock suggested that they were fundamentally involved in gene regulation, an idea further developed by Britten and Davidson, who speculated on the benefit of obtaining similar control regions for a ‘battery’ of co-regulated genes through exaptation.
At least 50% of our genome originates from characterized transposon-derived DNA ... it seems possible that, because these elements optimize their interaction with the host machinery under strong, virus-like evolutionary pressures, they are a particularly fecund source of evolutionary innovations, including new gene regulatory elements, and these are at times exapted by the host to improve its own fitness. If so, it is possible that many more of the one million conserved vertebrate genomic elements originated from ancient retroposon families.
Bejerano et al. Nature 2006
27
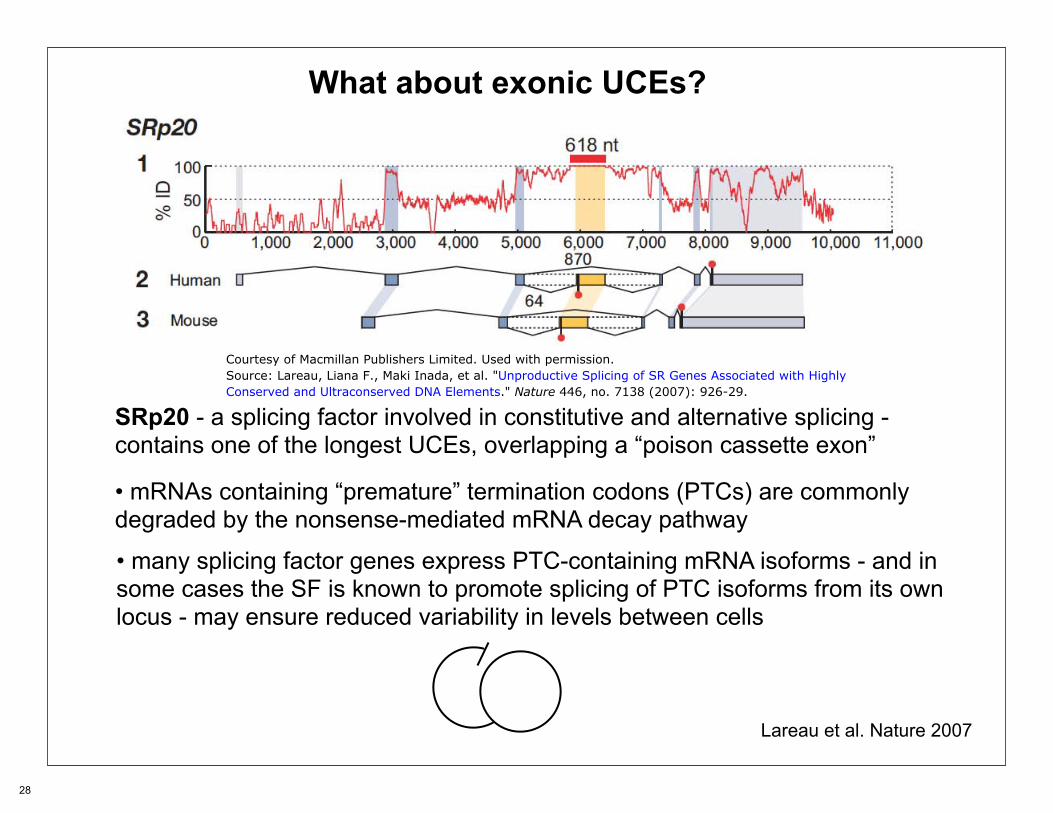
What about exonic UCEs?
SRp20 - a splicing factor involved in constitutive and alternative splicing -contains one of the longest UCEs, overlapping a “poison cassette exon”
• mRNAs containing “premature” termination codons (PTCs) are commonly degraded by the nonsense-mediated mRNA decay pathway
• many splicing factor genes express PTC-containing mRNA isoforms - and in some cases the SF is known to promote splicing of PTC isoforms from its own locus - may ensure reduced variability in levels between cells
Lareau et al. Nature 2007
28
Courtesy of Macmillan Publishers Limited. Used with permission.Source: Lareau, Liana F., Maki Inada, et al. "Unproductive Splicing of SR Genes Associated with HighlyConserved and Ultraconserved DNA Elements." Nature 446, no. 7138 (2007): 926-29.
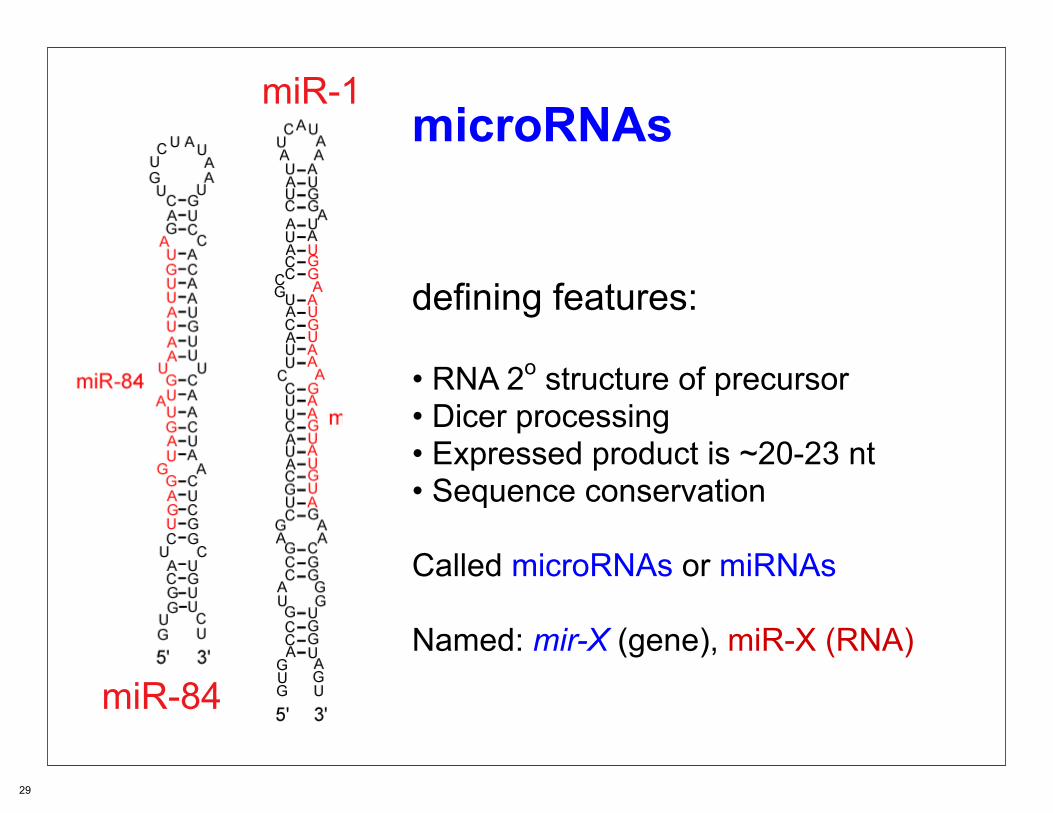
defining features:
• RNA 2o structure of precursor• Dicer processing• Expressed product is ~20-23 nt• Sequence conservation
Called microRNAs or miRNAs Named: mir-X (gene), miR-X (RNA)
miR-84
miR-1microRNAs
29

Dicerpre-miRNA
mature miRNA
microRNA biogenesis/function
microRNA1o transcript
translational repressionand/or mRNA degradation
target mRNA
Drosha
RISCRISC
30

MicroRNAs and apoptosis in Drosophila
Brennecke Curr. Biol. 2003
...
31
Courtesy of Elsevier. Used with permission.
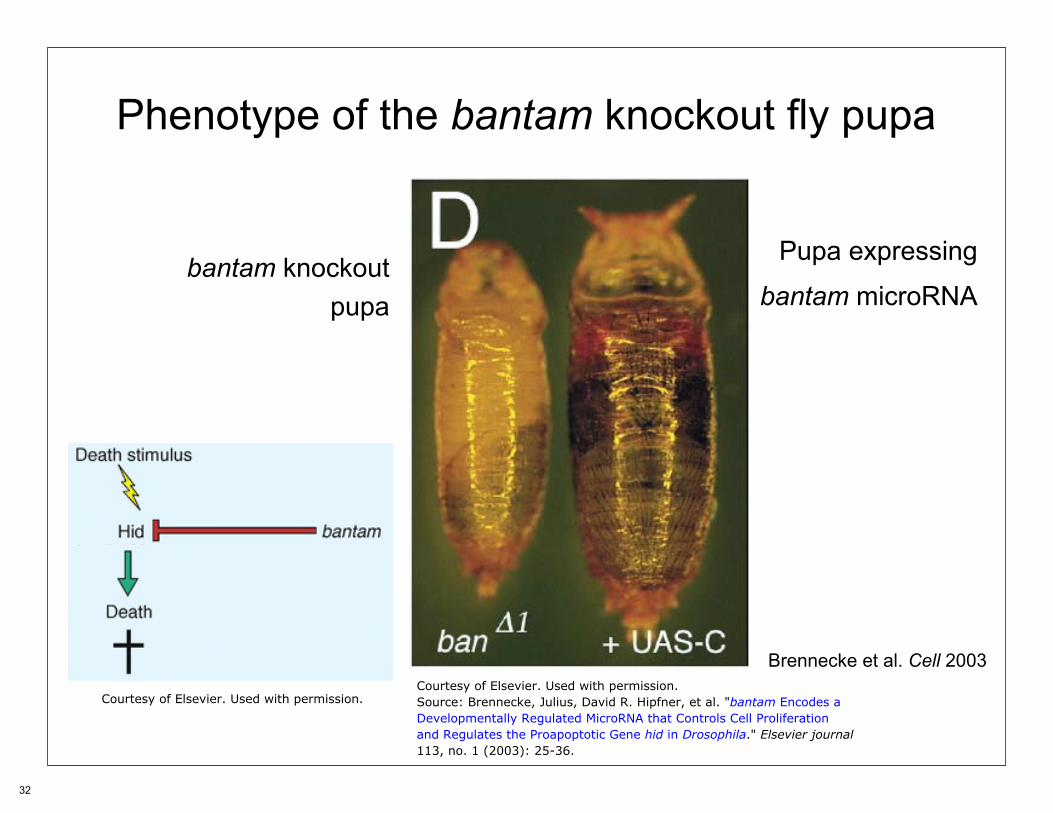
Phenotype of the bantam knockout fly pupa
Pupa expressingbantam knockout bantam microRNApupa
Brennecke et al. Cell 2003...
32
Courtesy of Elsevier. Used with permission.Courtesy of Elsevier. Used with permission. Source: Brennecke, Julius, David R. Hipfner, et al. "bantam Encodes a
Developmentally Regulated MicroRNA that Controls Cell Proliferationand Regulates the Proapoptotic Gene hid in Drosophila." Elsevier journal113, no. 1 (2003): 25-36.

Original TargetScan Algorithm
Example: miR-26a / SMAD-1 Require Watson-Crick pairing to miRNA bases 2-8
1st Site
2nd Site “seed match” “seed”
“seed”SMAD-1 3' UTR
humanmouse
rat
33
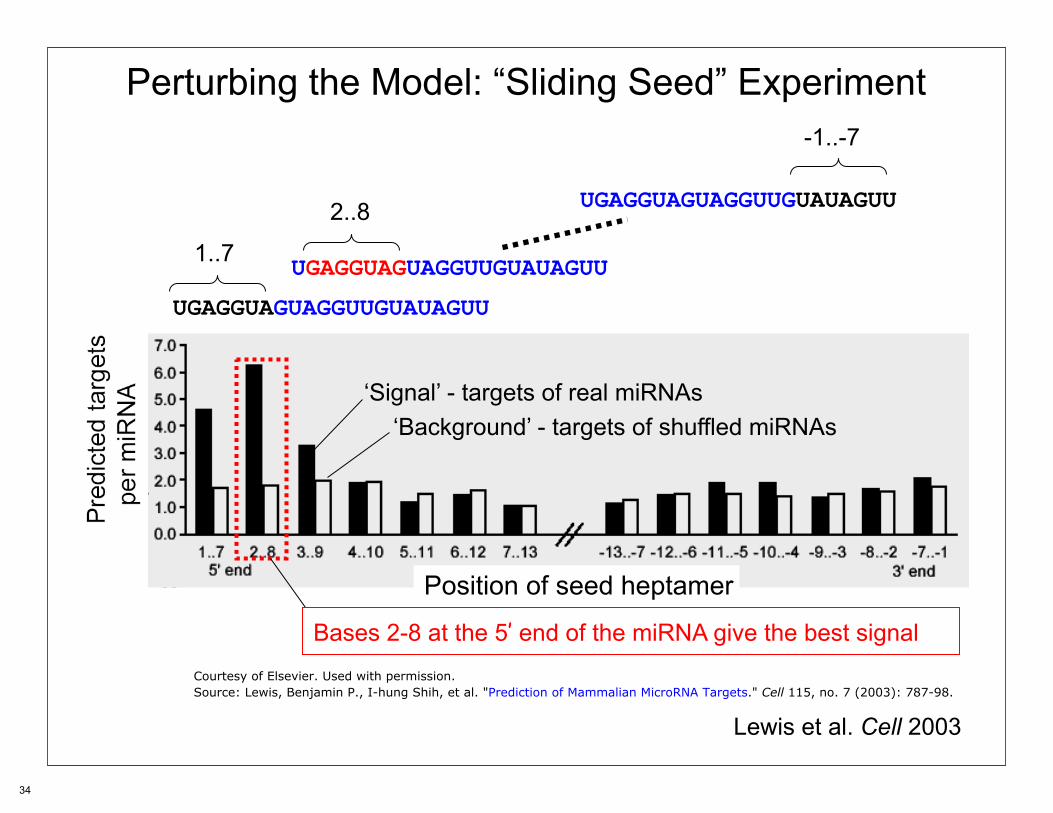
Perturbing the Model: “Sliding Seed” Experiment
UGAGGUAGUAGGUUGUAUAGUU
Position of seed heptamer
UGAGGUAGUAGGUUGUAUAGUU
UGAGGUAGUAGGUUGUAUAGUU
1..7
-1..-7
2..8
Position of seed heptamer
‘Signal’ - targets of real miRNAs
Bases 2-8 at the 5’ end of the miRNA give the best signal
‘Background’ - targets of shuffled miRNAs
Lewis et al. Cell 2003
34
Courtesy of Elsevier. Used with permission.Source: Lewis, Benjamin P., I-hung Shih, et al. "Prediction of Mammalian MicroRNA Targets." Cell 115, no. 7 (2003): 787-98.

mm-let-7c-1 -UGUGUGCAUCCGGGUUGAGGUAGUAGGUUGUAUGGUU--UAGAGUUACACCCUGG----------GAGUUAACUGUACAACCUUCUAGCUUUCCUUGGAGCACACU------hs-let-7c ------GCAUCCGGGUUGAGGUAGUAGGUUGUAUGGUU--UAGAGUUACACCCUGG----------GAGUUAACUGUACAACCUUCUAGCUUUCCUUGGAGC-----------hs-let-7a-2 ------------AGGUUGAGGUAGUAGGUUGUAUAGUU--UAGAAUUACAUCAAGG----------GAGAUAACUGUACAGCCUCCUAGCUUUCCU-----------------mm-let-7a-2 CUGCAUGUUCCCAGGUUGAGGUAGUAGGUUGUAUAGUU--UAGAGUUACAUCAAGG----------GAGAUAACUGUACAGCCUCCUAGCUUUCCUUGGGACUUGCAC-----hs-let-7f-1 ----------UCAGAGUGAGGUAGUAGAUUGUAUAGUU-GUGGGGUAGUGAUUUUACCCUGUUCAGGAGAUAACUAUACAAUCUAUUGCCUUCCCUGA---------------mm-let-7f-1 ---------AUCAGAGUGAGGUAGUAGAUUGUAUAGUU-GUGGGGUAGUGAUUUUACCCUGUUUAGGAGAUAACUAUACAAUCUAUUGCCUUCCCUGAG--------------mm-let-7b ----------GCAGGGUGAGGUAGUAGGUUGUGUGGUU-UCAGGGCAGUGAUGUUGCCCC--UCCGAAGAUAACUAUACAACCUACUGCCUUCCCUGA---------------hs-let-7b -----------CGGGGUGAGGUAGUAGGUUGUGUGGUU-UCAGGGCAGUGAUGUUGCCCC--UCGGAAGAUAACUAUACAACCUACUGCCUUCCCUG----------------hs-let-7i -----------CUGGCUGAGGUAGUAGUUUGUGCUGUUGGUCGGGUUGUGACAUUGCCCGCUGU-GGAGAUAACUGCGCAAGCUACUGCCUUGCUA-----------------mm-let-7i -----------CUGGCUGAGGUAGUAGUUUGUGCUGUUGGUCGGGUUGUGACAUUGCCCGCUGU-GGAGAUAACUGCGCAAGCUACUGCCUUGCUAG----------------mm-let-7g ----------CCAGGCUGAGGUAGUAGUUUGUACAGUUUGAGGGUCUAUGAUACCACCCGGUACAGGAGAUAACUGUACAGGCCACUGCCUUGCCAGG---------------hs-let-7g ------------AGGCUGAGGUAGUAGUUUGUACAGUUUGAGGGUCUAUGAUACCACCCGGUACAGGAGAUAACUGUACAGGCCACUGCCUUGCCA-----------------hs-let-7a-3 -------------GGGUGAGGUAGUAGGUUGUAUAGUU--UGGGGCUCUG-CCCUGCUAU------GGGAUAACUAUACAAUCUACUGUCUUUCCU-----------------mm-let-7c-2 ---ACGGCCUUUGGGGUGAGGUAGUAGGUUGUAUGGUU--UUGGGCUCUG-CCCCGCUCU------GCGGUAACUAUACAAUCUACUGUCUUUCCUGAAGUGGCCGC------mm-let-7d -AAUGGGUUCCUAGGAAGAGGUAGUAGGUUGCAUAGUU-UUAGGGCAGAGAUUUUGCCCAC--AAGGAGUUAACUAUACGACCUGCUGCCUUUCUUAGGGCCUUAUU------hs-let-7d ---------CCUAGGAAGAGGUAGUAGGUUGCAUAGUU-UUAGGGCAGGGAUUUUGCCCAC--AAGGAGGUAACUAUACGACCUGCUGCCUUUCUUAGG--------------hs-let-7a-1 -----------UGGGAUGAGGUAGUAGGUUGUAUAGUU-UUAGGGUCACACCCACCACUG-----GGAGAUAACUAUACAAUCUACUGUCUUUCCUA----------------mm-let-7a-1 ----UUCACUGUGGGAUGAGGUAGUAGGUUGUAUAGUU-UUAGGGUCACACCCACCACUG-----GGAGAUAACUAUACAAUCUACUGUCUUUCCUAAGGUGAU---------hs-let-7f-2 ---------UGUGGGAUGAGGUAGUAGAUUGUAUAGUU-UUAGGGUCAUACCC-CAUCUU-----GGAGAUAACUAUACAGUCUACUGUCUUUCCCACG--------------mm-let-7f-2 ---------UGUGGGAUGAGGUAGUAGAUUGUAUAGUU-UUAGGGUCAUACCC-CAUCUU-----GGAGAUAACUAUACAGUCUACUGUCUUUCCCACG--------------mm-let-7e --CGCGCCCCCCGGGCUGAGGUAGGAGGUUGUAUAGUU---GAGGAAGACACCCGA---------GGAGAUCACUAUACGGCCUCCUAGCUUUCCCCAGGCUGCGCC------hs-let-7e ---------CCCGGGCUGAGGUAGGAGGUUGUAUAGUU---GAGGAGGACACCCAA---------GGAGAUCACUAUACGGCCUCCUAGCUUUCCCCAGG-------------cb-let-7 ---ACUG-GGGUACGGUGAGGUAGUAGGUUGUAUAGUU--UAGAAUAUUACUCUCG------------GUGAACUAUGCAAGUUUCUACCUCACCGAAUACCAGG--------ce-let-7 UACACUGUGGAUCCGGUGAGGUAGUAGGUUGUAUAGUU--UGGAAUAUUACCACCG------------GUGAACUAUGCAAUUUUCUACCUUACCGGAGACAGAACUCUUCGAdm-let-7 ------UCUGGCAAAUUGAGGUAGUAGGUUGUAUAGU----AGUA-AUUACACAUC------------AU--ACUAUACAAUGUGCUAGCUUUCUUUGCUUGA----------
Conservation of let-7 Foldbacks%
7m
ers
iden
tical 100
50
00
25
50
75
100
35

Dscam - an extreme case of alternative splicing
Schmücker et al. Cell 2000
Exon 4 Exon 6 Exon 9 Exon 17
Dscam can potentially express > 38,000 isoforms, which control neuronal wiring
Ig Repeats Fibronectin Domains
Gene
mRNA
Protein
How is splicing regulated?
How is mutually exclusiveinclusion of exons achieved?
36
© source unknown. All rights reserved. This content is excluded from our CreativeCommons license. For more information, see http://ocw.mit.edu/help/faq-fair-use/.
Courtesy of Elsevier. Used with permission.Source: Wojtowicz, Woj M., John J. Flanagan, et al. "Alternative Splicing of DrosophilaDscam Generates Axon Guidance Receptors that Exhibit Isoform-Specific HomophilicBinding." Cell 118, no. 5 (2004): 619-33.

Motif downstream of DSCAM exon 5
Graveley Cell 2005
37
Courtesy of Elsevier. Used with permission.Source: Graveley, Brenton R. "Mutually Exclusive Splicing of the Insect Dscam Pre-mRNA Directed byCompeting Intronic RNA Secondary Structures." Cell 123, no. 1 (2005): 65-73.
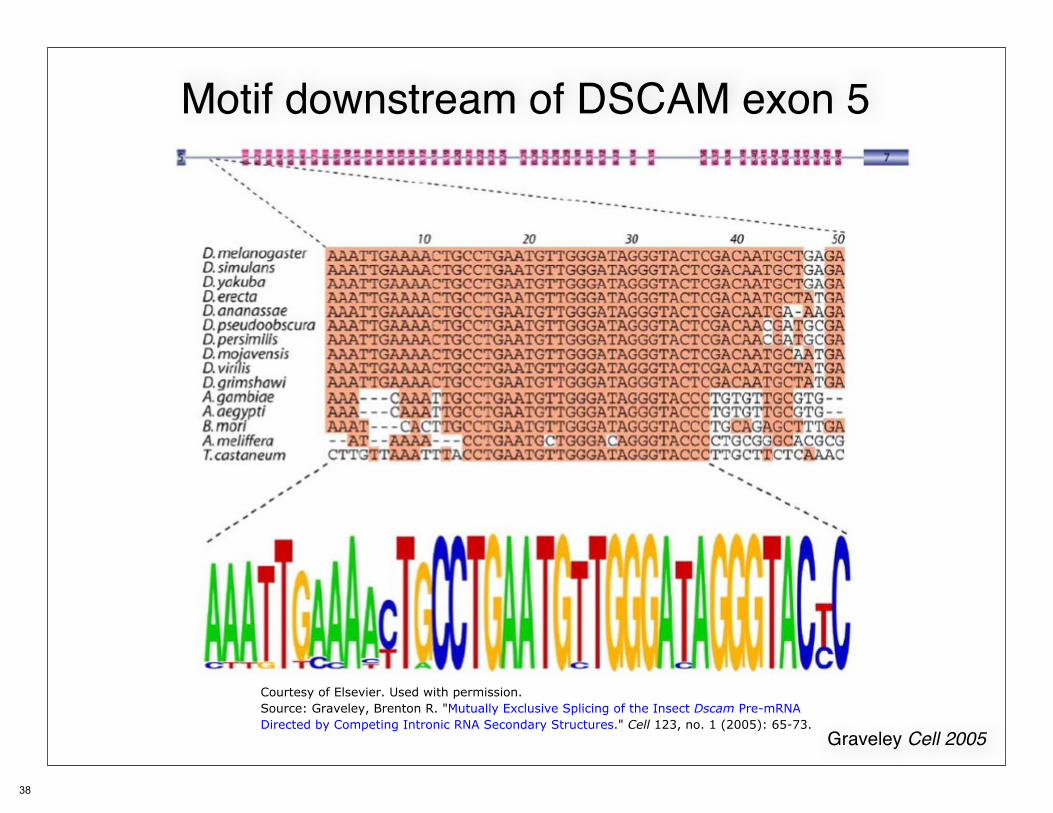
Motif downstream of DSCAM exon 5
Graveley Cell 2005
38
Courtesy of Elsevier. Used with permission.Source: Graveley, Brenton R. "Mutually Exclusive Splicing of the Insect Dscam Pre-mRNADirected by Competing Intronic RNA Secondary Structures." Cell 123, no. 1 (2005): 65-73.

Mutually Exclusive Splicing of the Exon 6 Cluster
Docking Site
Selector SequencesGraveley Cell 2005
39
Courtesy of Elsevier. Used with permission.Source: Graveley, Brenton R. "Mutually Exclusive Splicing of the Insect Dscam Pre-mRNADirected by Competing Intronic RNA Secondary Structures." Cell 123, no. 1 (2005): 65-73.

Defining a Branch Length Score to assess conservation
Kheradpour et al Genome Res 2008
40
© sources unknown. All rights reserved. This content is excluded from our CreativeCommons license. For more information, see http://ocw.mit.edu/help/faq-fair-use/.
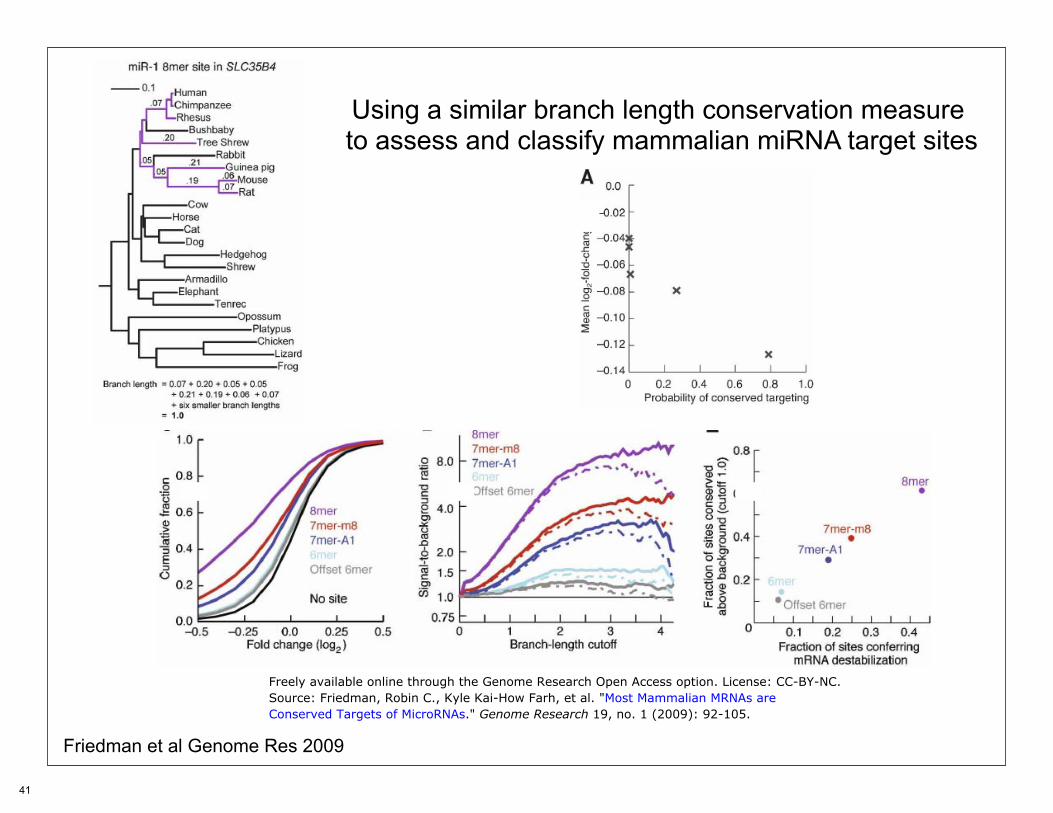
Using a similar branch length conservation measure to assess and classify mammalian miRNA target sites
Friedman et al Genome Res 2009
41
Freely available online through the Genome Research Open Access option. License: CC-BY-NC.Source: Friedman, Robin C., Kyle Kai-How Farh, et al. "Most Mammalian MRNAs areConserved Targets of MicroRNAs." Genome Research 19, no. 1 (2009): 92-105.

Identifying a family of genes (cas) associated with a bacterial repeat
structure (CRISPR)
Jansen et al Mol Microbiol 2002
42
© Society for General Microbiology. All rights reserved. This content is excluded from our Creative Commons license. For more information, see http://ocw.mit.edu/help/faq-fair-use/.Source: Bolotin, Alexander, Benoit Quinquis, et al. "Clustered RegularlyInterspaced Short Palindrome Repeats(CRISPRs) have Spacers of Extra-chromosomal Origin." Microbiology 151, no. 8 (2005): 2551-61.
© Blackwell Science Ltd. All rights reserved. This content is excludedfrom our Creative Commons license. For more information,see http://ocw.mit.edu/help/faq-fair-use/.Source: Jansen, Ruud, Jan Embden, et al. "Identification of Genes that areAssociated with DNA Repeats in Prokaryotes." Molecular Microbiology 43,no. 6 (2002): 1565-75.

CRISPR spacers match phage genomes
Bolotin et al Microbiol 2005
Number of spacers is correlated with resistance to phage
43
© Society for General Microbiology. All rights reserved. This content is excluded from our Creative Commons license.For more information, see http://ocw.mit.edu/help/faq-fair-use/. Source: Bolotin, Alexander, Benoit Quinquis, et al. "Clustered Regularly Interspaced Short Palindrome Repeats(CRISPRs) have Spacers of Extrachromosomal Origin." Microbiology 151, no. 8 (2005): 2551-61.

MIT OpenCourseWarehttp://ocw.mit.edu
7.91J / 20.490J / 20.390J / 7.36J / 6.802J / 6.874J / HST.506J Foundations of Computational and Systems BiologySpring 2014
For information about citing these materials or our Terms of Use, visit: http://ocw.mit.edu/terms.