(800) 236-3724
TRANSCRIPT
(800) 236-3724www.farin.com
FHLB Des Moines --Evaluating & Revising Your Asset-Liability ProcessesTom FarinPresidentFarin & Associates, [email protected]
Originating Profitable Loans © 2003 - Slide 2
Session 2 Outline
Developing an effective ALCO process.Dynamic measurement of interest rate risk
Dynamic Income at Risk
Dynamic Value at Risk
Making decisions on risk/return tradeoffs
Originating Profitable Loans © 2003 - Slide 3
Asset Liability Management Defined
Asset-Liability Management – the management of the relationship between your institution’s risk and its return.
Question – does your institution’s ALCO process provide a framework for making decisions based on risk/return tradeoffs?
Originating Profitable Loans © 2003 - Slide 4
Interest Rate Risk Defined
Income at risk – the potential effect of a change in rates on an institution’s income.
Value at Risk – the potential effect of a change in rates on your institution’s Net Economic Value (NEV)
Economic Value (NEV, NPV, MVPE, EVE) – the market value of your institution’s assets less the market value of the liabilities.
Originating Profitable Loans © 2003 - Slide 5
ALCO Management Process
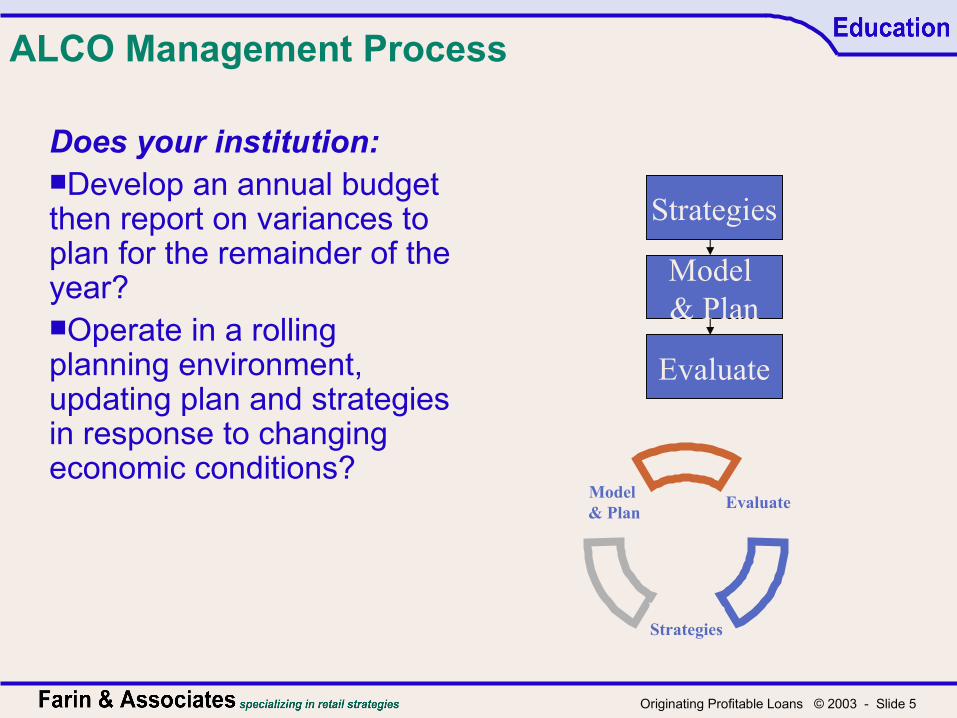
Does your institution:Develop an annual budget then report on variances to plan for the remainder of the year?Operate in a rolling planning environment, updating plan and strategies in response to changing economic conditions?
Evaluate
FormulateStrategies
Model & Plan
Strategies
Model & Plan
Evaluate

Originating Profitable Loans © 2003 - Slide 6
Beginning Of Year Planning
Annual Plan – Base Rate Assumption
Income at Risk Testing
Strategic Horizon

Originating Profitable Loans © 2003 - Slide 7
Beginning of Year Strategies
Investments - Reduce investments as a percentage of earning assets while investing new funds primarily in 2-3 year duration MBS to build collateral for borrowings. Given maturities and other cash flows this should keep investment portfolio duration less than 2 years.
Loans - Continue to portfolio 15-year fixed-rate mortgages while selling conforming 30 year fixed-rate mortgages to continue to build loans to earning assets. Grow other loans where profitable based on internal pricing analysis.
Deposits …Borrowings …Credit risk …Interest Rate Risk …Liquidity Risk …Capital Risk …
Originating Profitable Loans © 2003 - Slide 8
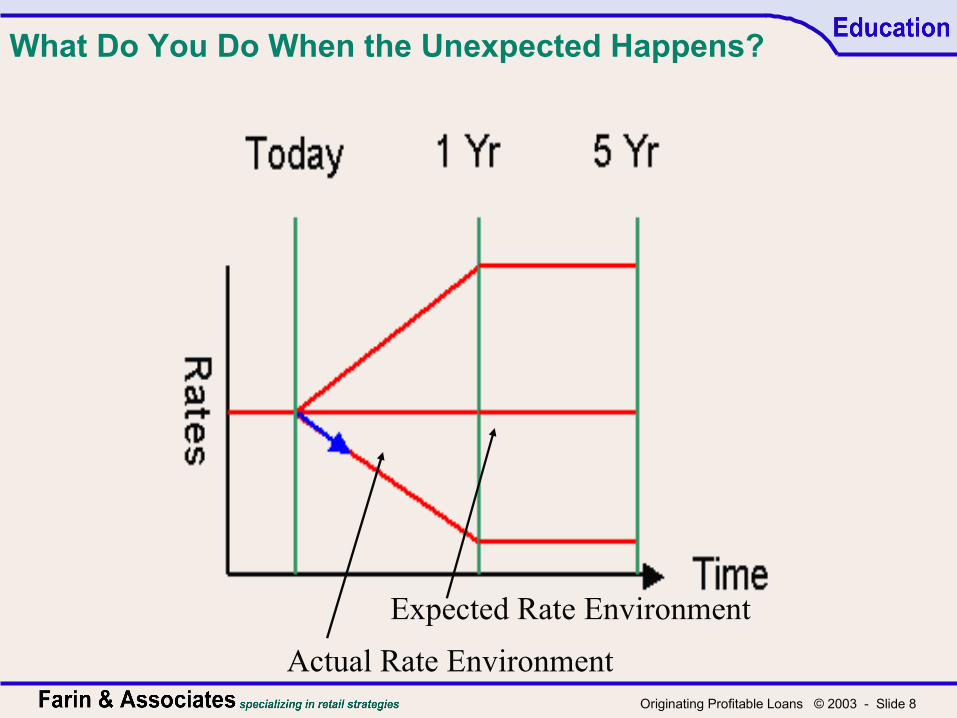
What Do You Do When the Unexpected Happens?
Actual Rate Environment
Expected Rate Environment
Originating Profitable Loans © 2003 - Slide 9
What Accompanies the Unexpected Drop In Rates?
Prepayments are accelerating on mortgages, causing both ARM and fixed-rate mortgages to refinance.
In addition those refinancing are rolling consumer debt (home equity, auto loans, and credit cards) into the refinance.
There is not sufficient 15 year fixed-rate mortgage originations to keep up with the declines in existing loans.
As a result, loans to earning assets are declining with cash building up in an extremely low yielding fed funds account.
Net interest margin, ROA and ROE are all falling.
Originating Profitable Loans © 2003 - Slide 10
Potential Strategy Options
Begin investing the growing investment portfolio into similar duration assets to those already indicated in the current
ALCO strategy or 15 year fixed-rate mortgage-backed securities.
Begin portfolioing all 30 year fixed-rate mortgages in addition to the 15 year fixed-rates already portfolioed. Drop rates on short-term CDs and replace runoff with long-term FHLB Advances that are duration matched to the mortgages. Shorten the investment portfolio purchases to offset the increasing duration of loans.
Sell all 15-year fixed-rate mortgage production as well as all 30 year FRMs, reasoning that nobody should hold fixed-rate mortgages with rates this low. Accept the declines in loan growth, margin, ROA and ROE as inevitable given the rate and economic environment.
Originating Profitable Loans © 2003 - Slide 11
Decision Time
How do you decide between the available strategies? Listen to the urban legends – “Fixed-rate mortgages
are bad financial instruments.” … “Borrowing money is a sign of weakness.”
Throw darts Take a vote Procrastinate – “It was a good strategy when we
developed it. There is no need to change now. Keep the pedal to the metal …”
None of the above is the correct answer.

Originating Profitable Loans © 2003 - Slide 12
Best Practices Approach
Remodel risk/return tradeoffs in alternative solutions.
Strategies developedfor this rateenvironment are nolonger relevant.
Originating Profitable Loans © 2003 - Slide 13
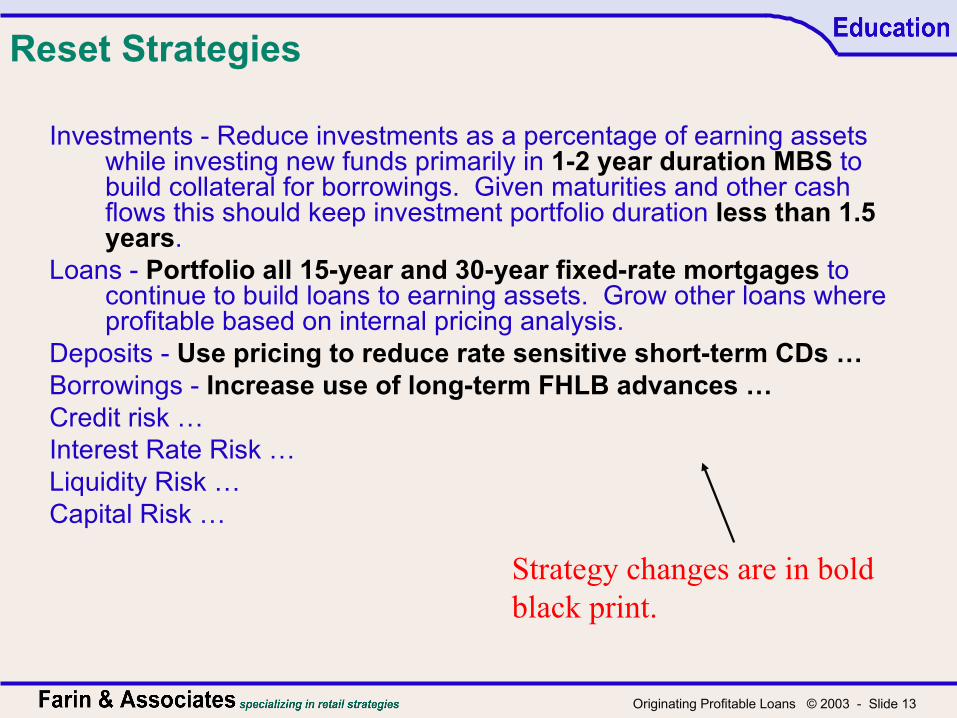
Reset Strategies
Investments - Reduce investments as a percentage of earning assets while investing new funds primarily in 1-2 year duration MBS to build collateral for borrowings. Given maturities and other cash flows this should keep investment portfolio duration less than 1.5 years.
Loans - Portfolio all 15-year and 30-year fixed-rate mortgages to continue to build loans to earning assets. Grow other loans where profitable based on internal pricing analysis.
Deposits - Use pricing to reduce rate sensitive short-term CDs …Borrowings - Increase use of long-term FHLB advances …Credit risk …Interest Rate Risk …Liquidity Risk …Capital Risk …
Strategy changes are in boldblack print.
Originating Profitable Loans © 2003 - Slide 14
Evaluating Risk/Return Tradeoffs
Unless you have a competitive monopoly or are blessed with an unbelievably low cost of funds, you cannot make money without taking on risk. Credit Risk Liquidity Risk Interest Rate Risk Capital Risk
Originating Profitable Loans © 2003 - Slide 15
Risk/Return Tradeoffs
Inappropriate amounts of risk can kill you. As a result you must: Establish table limits at all the risk
management tables of your institution casino.
Measure and monitor your actual exposure in relation to those limits.
Originating Profitable Loans © 2003 - Slide 16
Risk/Return Tradeoffs
But as long as you stay within your limits, it’s OK to take on additional interest rate risk if its consistent with delivering return.
Originating Profitable Loans © 2003 - Slide 17
Risk/Return Tradeoffs
To evaluate risk/return tradeoffs effectively your ALCO System must: Evaluate interest rate risk dynamically
Income at risk
Value at risk
Provide a framework for evaluating risk/return tradeoffs in potential management decisions.

Originating Profitable Loans © 2003 - Slide 18
Static vs. Dynamic IRR Measurement
Static Systems Measure IRR in
Existing Balance Sheet
Fail To Consider Institution Strategy
Can’t Be Used to Evaluate Risk/Return Tradeoffs
Regulatory Systems Are Static
Examples - Gap, Duration, Current VAR
Dynamic SystemsMeasure IRR in Future Balance Sheet
Consider Institution Strategy
Evaluate Risk/Return Tradeoffs
Example - Computer Simulation, Dynamic VAR
Originating Profitable Loans © 2003 - Slide 19
Rate Environment TypesStatic vs Dynamic
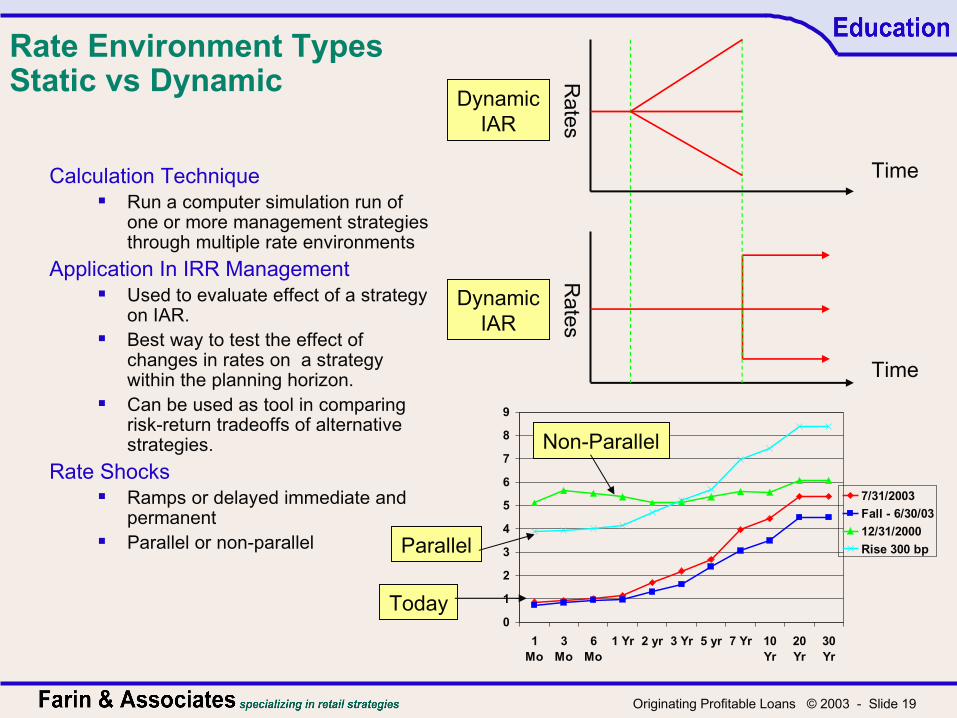
Calculation Technique Run a computer simulation run of
one or more management strategies through multiple rate environments
Application In IRR Management Used to evaluate effect of a strategy
on IAR. Best way to test the effect of
changes in rates on a strategy within the planning horizon.
Can be used as tool in comparing risk-return tradeoffs of alternative strategies.
Rate Shocks Ramps or delayed immediate and
permanent Parallel or non-parallel
Rates
Rates
Time
Time
DynamicIAR
DynamicIAR
0
1
2
3
4
5
6
7
8
9
1Mo
3Mo
6Mo
1 Yr 2 yr 3 Yr 5 yr 7 Yr 10Yr
20Yr
30Yr
7/31/2003
Fall - 6/30/03
12/31/2000
Rise 300 bpParallel
Today
Non-Parallel

Originating Profitable Loans © 2003 - Slide 20
Dynamic ModelingIncome At Risk Comparison of Alternative Strategies
Rate Env Pol Limit Stgy 1 Stgy 2 Stgy 3 Stgy 4
+300 bp -25% 7.2% 7.2% 9.6% 9.2%
Flat Maximum 12.0% 7.2% 11.4% 11.8%
-200 bp -25% 15.6% 7.2% 13.2% 13.8%
“Let’s Make as Much Money As We Can While Betting No More than 25% of the Bottom Line.”
Unacceptable Strategy. ROE Drops 40% from Flat to +300 bp.
Which of the Three Acceptable Strategies Would You Choose?
Income at Risk - ROE
Originating Profitable Loans © 2003 - Slide 21
Setting Income At Risk Limits
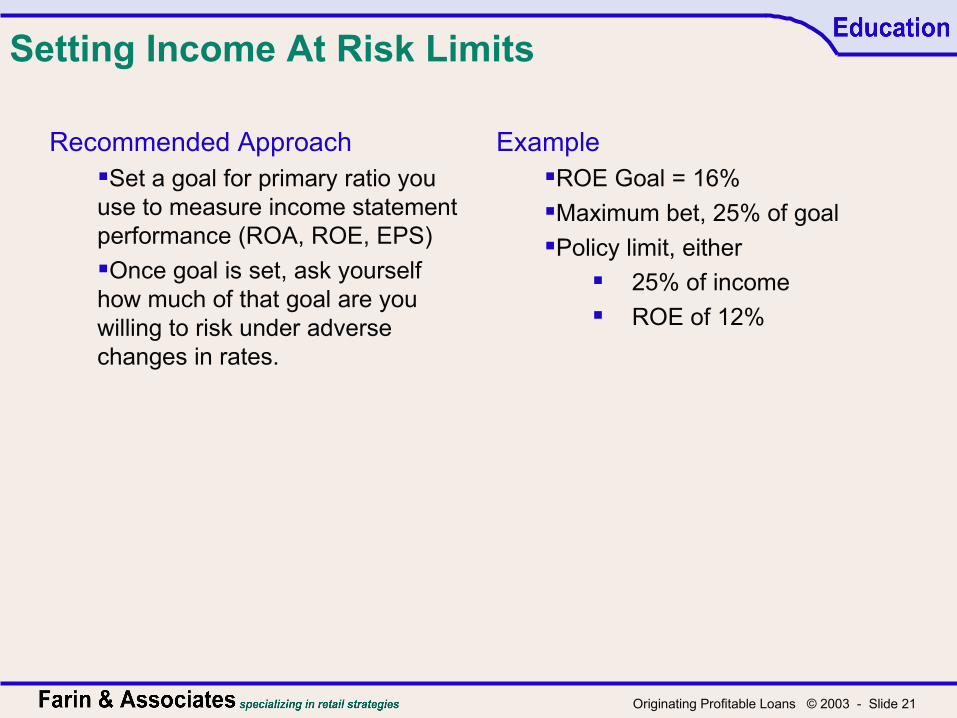
Recommended ApproachSet a goal for primary ratio you use to measure income statement performance (ROA, ROE, EPS)
Once goal is set, ask yourself how much of that goal are you willing to risk under adverse changes in rates.
ExampleROE Goal = 16%
Maximum bet, 25% of goal
Policy limit, either
25% of income
ROE of 12%
Originating Profitable Loans © 2003 - Slide 22
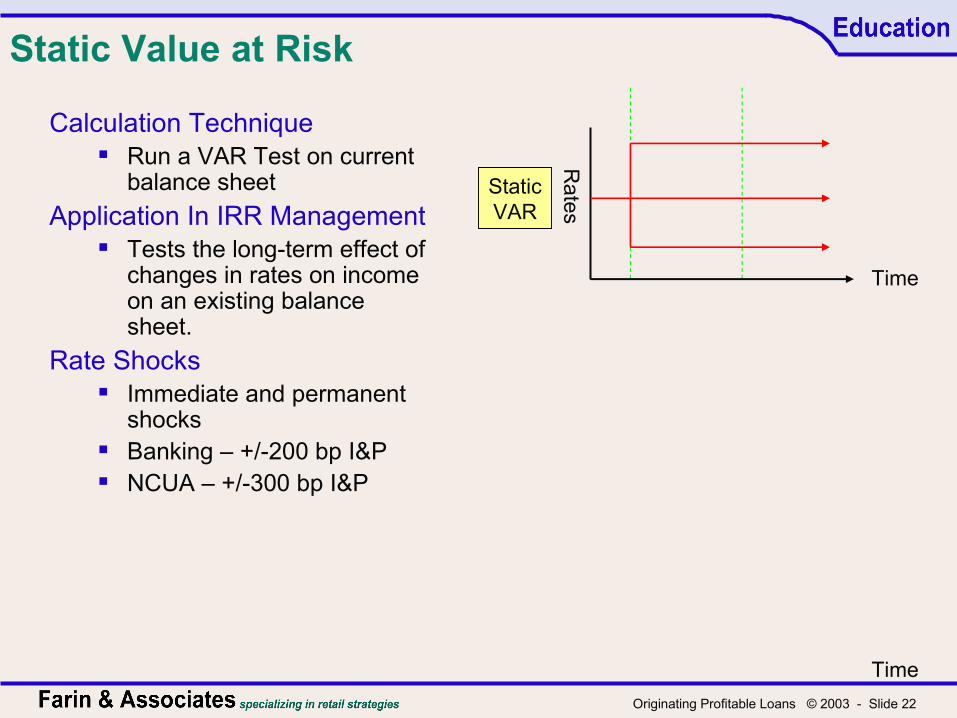
Static Value at Risk
Calculation Technique Run a VAR Test on current
balance sheet
Application In IRR Management Tests the long-term effect of
changes in rates on income on an existing balance sheet.
Rate Shocks Immediate and permanent
shocks Banking – +/-200 bp I&P NCUA – +/-300 bp I&P
Time
Rates
Time
StaticVAR
Originating Profitable Loans © 2003 - Slide 23
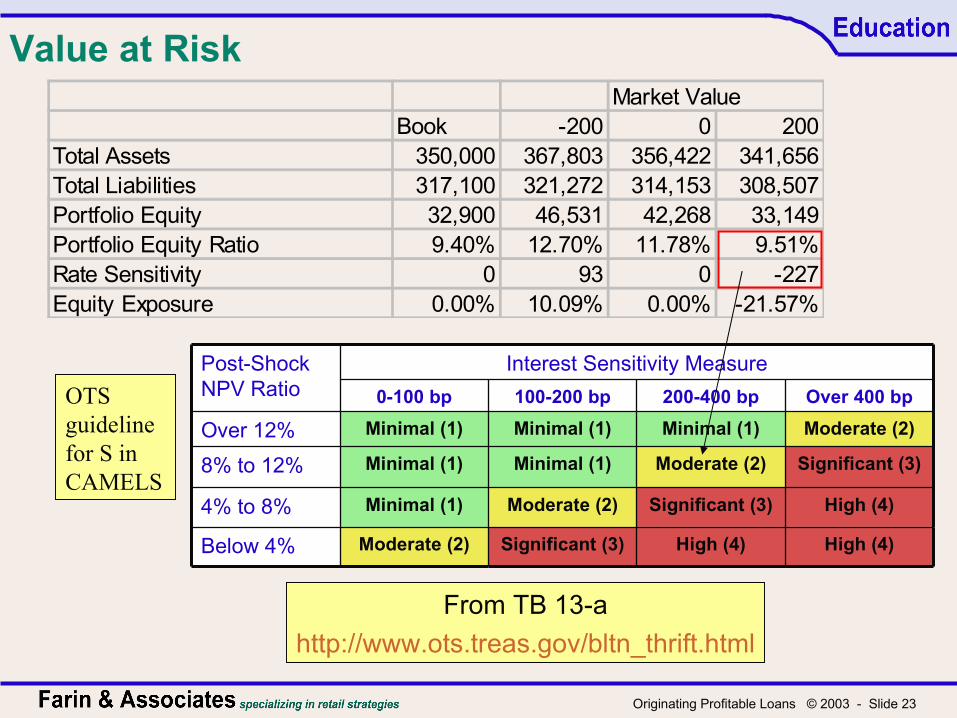
Value at RiskMarket Value
Book -200 0 200Total Assets 350,000 367,803 356,422 341,656Total Liabilities 317,100 321,272 314,153 308,507Portfolio Equity 32,900 46,531 42,268 33,149Portfolio Equity Ratio 9.40% 12.70% 11.78% 9.51%Rate Sensitivity 0 93 0 -227Equity Exposure 0.00% 10.09% 0.00% -21.57%
OTS guideline for S in CAMELS
High (4)High (4)Significant (3)Moderate (2)Below 4%
High (4)Significant (3)Moderate (2)Minimal (1)4% to 8%
Significant (3)Moderate (2)Minimal (1)Minimal (1)8% to 12%
Moderate (2)Minimal (1)Minimal (1)Minimal (1)Over 12%
Over 400 bp200-400 bp100-200 bp0-100 bp
Interest Sensitivity MeasurePost-Shock NPV Ratio
From TB 13-a
http://www.ots.treas.gov/bltn_thrift.html
Originating Profitable Loans © 2003 - Slide 24
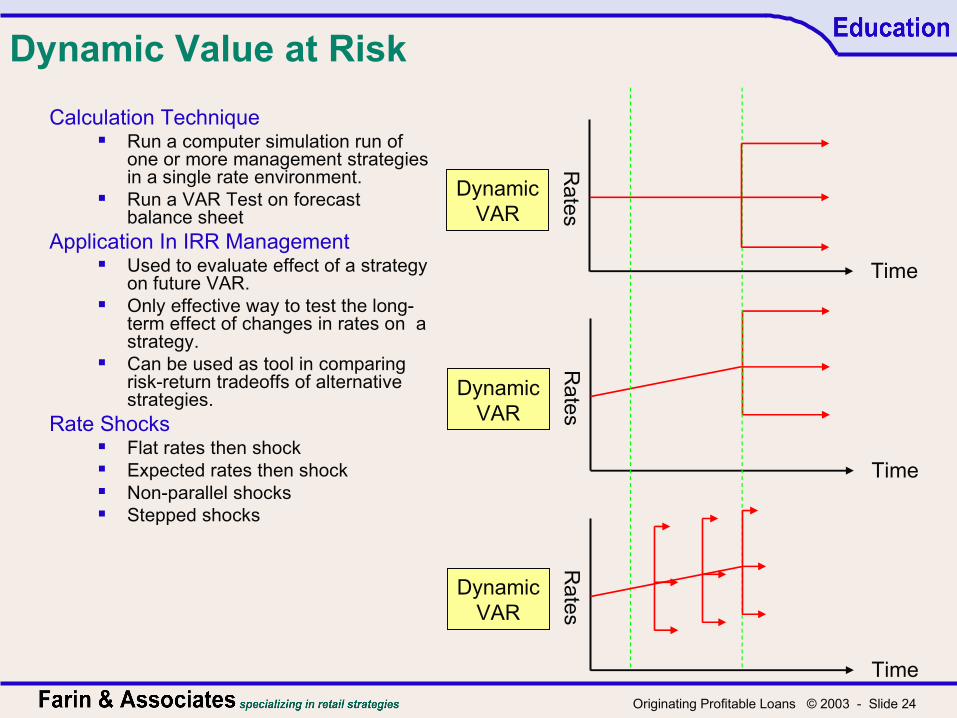
Dynamic Value at Risk
Calculation Technique Run a computer simulation run of
one or more management strategies in a single rate environment.
Run a VAR Test on forecast balance sheet
Application In IRR Management Used to evaluate effect of a strategy
on future VAR. Only effective way to test the long-
term effect of changes in rates on a strategy.
Can be used as tool in comparing risk-return tradeoffs of alternative strategies.
Rate Shocks Flat rates then shock Expected rates then shock Non-parallel shocks Stepped shocks
Rates
Time
DynamicVAR
Rates
Time
DynamicVAR
Rates
Time
DynamicVAR
Originating Profitable Loans © 2003 - Slide 25
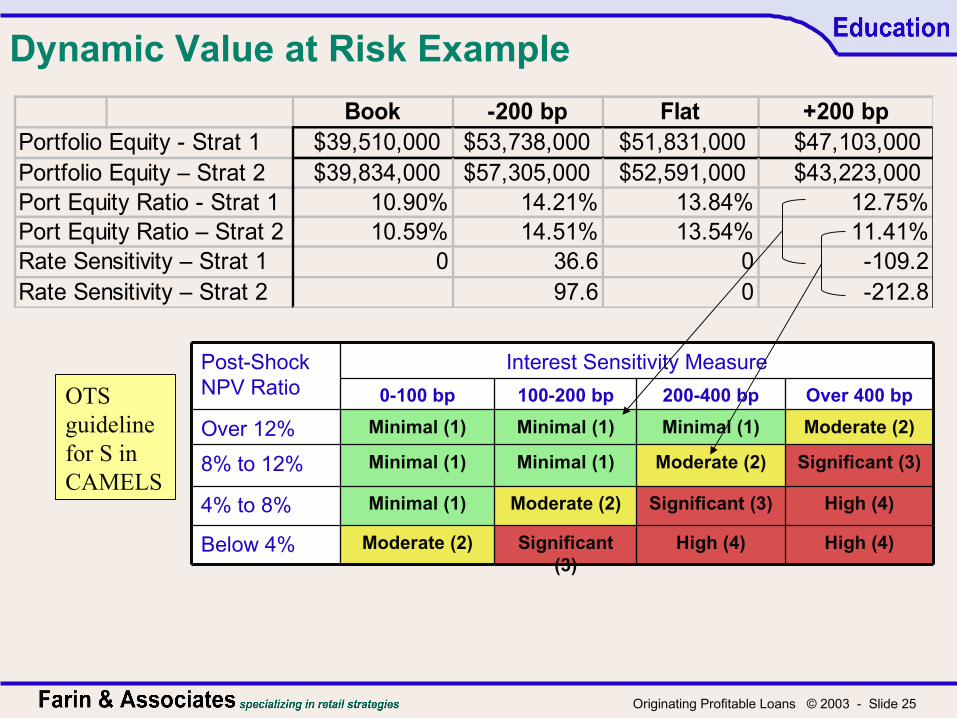
Dynamic Value at Risk Example
OTS guideline for S in CAMELS
High (4)High (4)Significant (3)
Moderate (2)Below 4%
High (4)Significant (3)Moderate (2)Minimal (1)4% to 8%
Significant (3)Moderate (2)Minimal (1)Minimal (1)8% to 12%
Moderate (2)Minimal (1)Minimal (1)Minimal (1)Over 12%
Over 400 bp200-400 bp100-200 bp0-100 bp
Interest Sensitivity MeasurePost-Shock NPV Ratio
Book -200 bp Flat +200 bpPortfolio Equity - Strat 1 $39,510,000 $53,738,000 $51,831,000 $47,103,000Portfolio Equity – Strat 2 $39,834,000 $57,305,000 $52,591,000 $43,223,000
10.90% 14.21% 13.84% 12.75%10.59% 14.51% 13.54% 11.41%
Rate Sensitivity – Strat 1 0 36.6 0 -109.2Rate Sensitivity – Strat 2 97.6 0 -212.8
Port Equity Ratio - Strat 1Port Equity Ratio – Strat 2

Originating Profitable Loans © 2003 - Slide 26
A/L Process Summary
Resetting plans annually may not be often enough in times of rapidly changing economic conditions
You need to evaluate interest rate risk dynamically in order to optimize the relationship between risk and return. Income at risk
Value at risk
Establish effective interest rate risk limits Choose the strategy that optimizes the relationship
between risk and return while staying within the institution’s policy limits.