8800db1401 us three steps for reducing tco in pump systems
TRANSCRIPT
Executive summary Energy costs have become an increasing contributor to
pumping systems Total Cost of Ownership (TCO). In
fact, energy cost represents 40% of the TCO of a
typical pump. It is possible to reduce the electrical
consumption by at least 30% utilizing Variable Speed
Drives while decreasing maintenance costs associated
with the mechanical driven system. This paper explains
how to reduce TCO with a limited investment focused
on three key areas: energy efficiency management,
asset management, and energy cost management.
by Lionel Gaudrel and Arnaud Savreux
(Adapted and revised for US readership by Tom Lowery and Jack Creamer)
998-2
095-0
2-1
9-1
4A
R0
-US
Three Steps for Reducing Total Cost of Ownership (TCO) in Pumping Systems
Schneider Electric White Paper Revision 0 Page 2
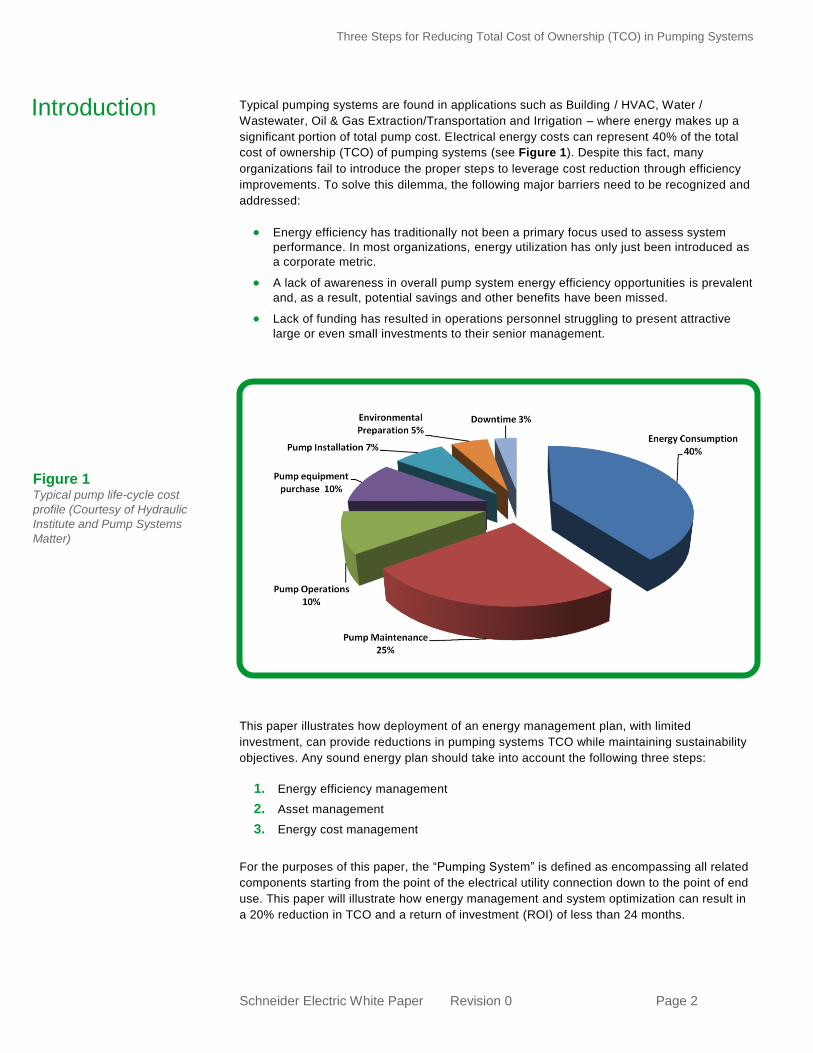
Typical pumping systems are found in applications such as Building / HVAC, Water /
Wastewater, Oil & Gas Extraction/Transportation and Irrigation – where energy makes up a
significant portion of total pump cost. Electrical energy costs can represent 40% of the total
cost of ownership (TCO) of pumping systems (see Figure 1). Despite this fact, many
organizations fail to introduce the proper steps to leverage cost reduction through efficiency
improvements. To solve this dilemma, the following major barriers need to be recognized and
addressed:
Energy efficiency has traditionally not been a primary focus used to assess system
performance. In most organizations, energy utilization has only just been introduced as
a corporate metric.
A lack of awareness in overall pump system energy efficiency opportunities is prevalent
and, as a result, potential savings and other benefits have been missed.
Lack of funding has resulted in operations personnel struggling to present attractive
large or even small investments to their senior management.
This paper illustrates how deployment of an energy management plan, with limited
investment, can provide reductions in pumping systems TCO while maintaining sustainability
objectives. Any sound energy plan should take into account the following three steps:
1. Energy efficiency management
2. Asset management
3. Energy cost management
For the purposes of this paper, the “Pumping System” is defined as encompassing all related
components starting from the point of the electrical utility connection down to the point of end
use. This paper will illustrate how energy management and system optimization can result in
a 20% reduction in TCO and a return of investment (ROI) of less than 24 months.
Introduction
Figure 1 Typical pump life-cycle cost
profile (Courtesy of Hydraulic
Institute and Pump Systems
Matter)
Three Steps for Reducing Total Cost of Ownership (TCO) in Pumping Systems
Schneider Electric White Paper Revision 0 Page 3
Energy efficiency has become a global priority. Industry trade and governmental
organizations such as the Department of Energy (DOE), the Air Conditioning, Heating, and
Refrigeration Institute (AHRI), and the American Society of Heating, Refrigeration, Air
Conditioning Engineers (ASHRAE) have introduced standards to mandate minimum
efficiency requirements for motors and variable speed drives (VSDs). These standards
impact pumping systems. DOE EPACT and ASHRAE 90.1 are examples of some of these
standards. In addition, the DOE is currently developing minimum efficiency standards for
pumping systems. Organizations such as Hydraulic Institute (HI) are representing the
pumping industry to assist in the development of these standards.
Along with the industry and governmental organizations referenced above, numerous utilities
have implemented rebate programs aimed at encouraging investment that will reduce energy
consumption across all sectors including Irrigation, Industry and Buildings. The great majority
of these programs focus on pumping applications and provide rebates that support using
more efficient motors and VSDs to drive system optimization.
There is tremendous variation in pumping applications across water/wastewater, industry and
buildings environments and this represents part of the energy management challenge. In
addition, variables exist within process demand changes, weather conditions, and local
regulations. As a result, plant and building operators need to understand how and when
energy is used in order to minimize consumption and related costs.
The pump system energy management approach discussed in this paper reviews the nature
of efficiency loss for individual components within the system, and also considers losses for
the whole, integrated system entity when the various components are all operating together.
In pumping systems, most inefficiency comes from:
A mismatch between the pump deployed and the actual system requirement (i.e.,
undersized or oversized)
The improper use of throttling valves and flow-restriction technologies to control the
volume and pressure of liquids
These two elements imply that the way pumping systems are controlled plays a major role
regarding how efficiency can be improved. Control systems themselves are composed of both
hardware and software components. On the hardware side, variable speed drives are a
primary enabler of high efficiency performance.
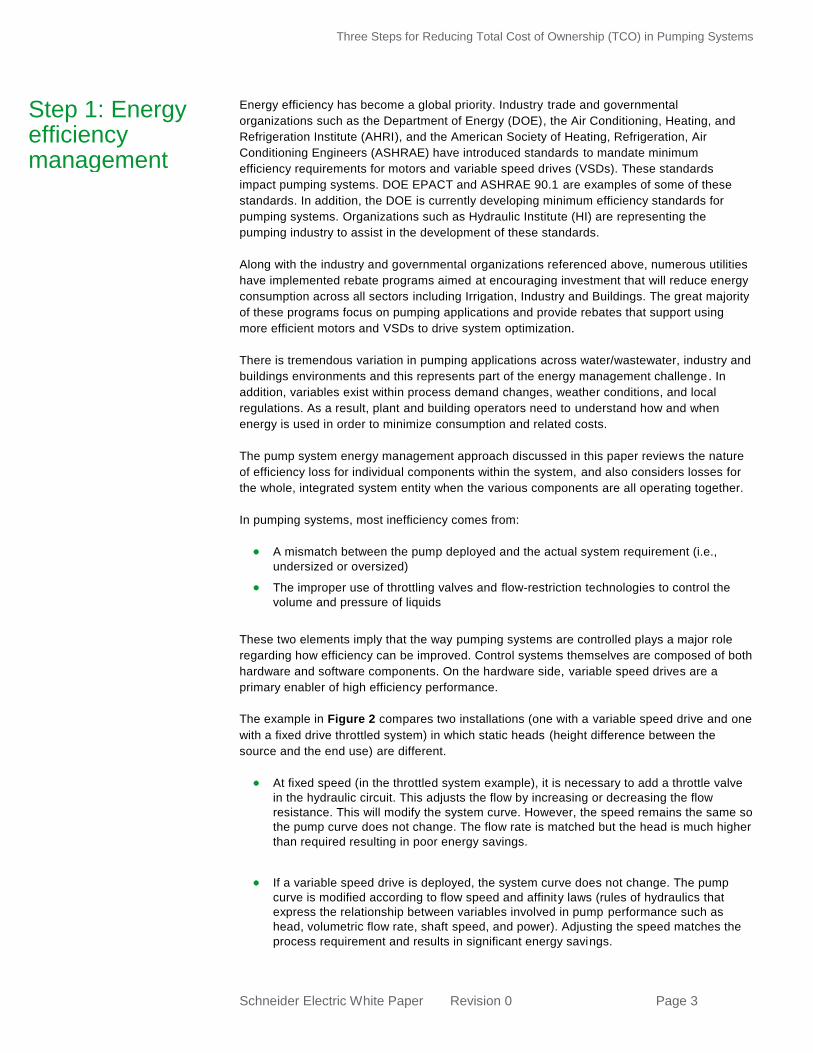
The example in Figure 2 compares two installations (one with a variable speed drive and one
with a fixed drive throttled system) in which static heads (height difference between the
source and the end use) are different.
At fixed speed (in the throttled system example), it is necessary to add a throttle valve
in the hydraulic circuit. This adjusts the flow by increasing or decreasing the flow
resistance. This will modify the system curve. However, the speed remains the same so
the pump curve does not change. The flow rate is matched but the head is much higher
than required resulting in poor energy savings.
If a variable speed drive is deployed, the system curve does not change. The pump
curve is modified according to flow speed and affinity laws (rules of hydraulics that
express the relationship between variables involved in pump performance such as
head, volumetric flow rate, shaft speed, and power). Adjusting the speed matches the
process requirement and results in significant energy savings.
Step 1: Energy efficiency management
Three Steps for Reducing Total Cost of Ownership (TCO) in Pumping Systems
Schneider Electric White Paper Revision 0 Page 4
Energy savings depend on the static head: the lower the static head, the bigger the energy
savings (and speed variation range). In order for a pumping action to occur, it is necessary to
generate enough power to overcome the static head. The friction head is the amount of head
required to push the liquid through the pipe and fittings. It depends on flow rate, pipe size,
pipe length, and viscosity.
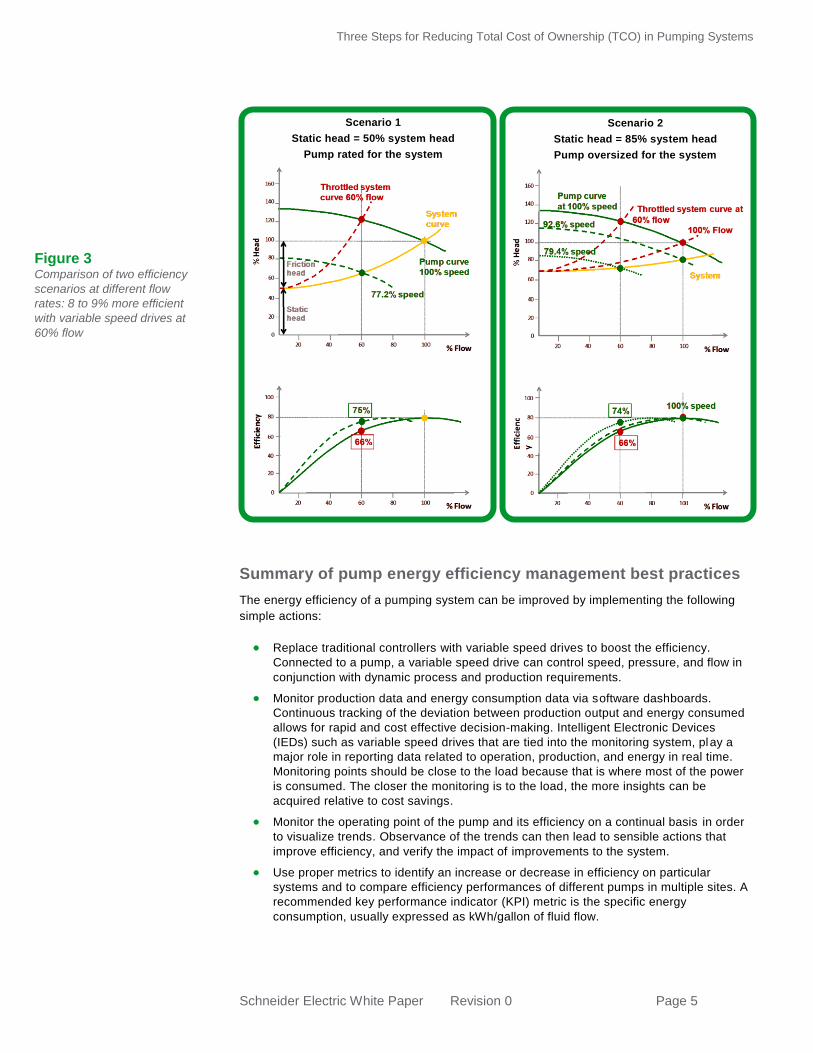
Scenario 1 (Figure 2): the static head represents 50% of the system head, and the
pump is rated for the head and flow of the system. At 100% flow, the power consumed
by the pump is the same at both fixed speed and with a variable speed drive. At 60%
flow, the energy savings resulting in the variable speed drive use is 46%.
Scenario 2 (Figure 2): the static head represents 85% of the system head, and the
pump is oversized by 20%. In real world scenarios, 75% of pumps are oversized (by
10% to 30%) in order to meet anticipated lifetime peak production, to anticipate future
needs, or to rationalize spare parts inventory. Therefore, a variable speed drive saves
20% of energy at 100% flow and saves 36% energy at 60% flow.
Changing the operating point on the pump curve also changes the efficiency of the pump
itself. The pump performs at maximum efficiency at its full capacity. This corresponds to what
is referred to as the Best Efficiency Point (BEP). In terms of installation design and operation,
the objective is to work as closely as possible to the BEP. By varying the speed, the pump
efficiency remains roughly the same but is applied to a new flow rate. At fixed speed,
reducing the flow rate quickly deteriorates the pump efficiency (because it works far from the
BEP) while adjusting the speed keeps the efficiency close to the BEP (see Figure 3).
Determining pump efficiency is only a first step in identifying system performance levels.
Monitoring efficiencies locally or remotely can detect operating points that are not suitable for
the pump. Access to such data can improve both system energy efficiency and reliability.
Figure 2 Energy saved with variable
vs. fixed speed drives at
100% and 60% flow,
according to the static head
and pump sizing. The
operating point is
represented as the
intersection of the pump
curve with the system curve
Scenario 1
Static head = 50% system head
Pump rated for the system
Scenario 2
Static head = 85% system head
Pump oversized for the system
Three Steps for Reducing Total Cost of Ownership (TCO) in Pumping Systems
Schneider Electric White Paper Revision 0 Page 5
Summary of pump energy efficiency management best practices
The energy efficiency of a pumping system can be improved by implementing the following
simple actions:
Replace traditional controllers with variable speed drives to boost the efficiency.
Connected to a pump, a variable speed drive can control speed, pressure, and flow in
conjunction with dynamic process and production requirements.
Monitor production data and energy consumption data via software dashboards.
Continuous tracking of the deviation between production output and energy consumed
allows for rapid and cost effective decision-making. Intelligent Electronic Devices
(IEDs) such as variable speed drives that are tied into the monitoring system, play a
major role in reporting data related to operation, production, and energy in real time.
Monitoring points should be close to the load because that is where most of the power
is consumed. The closer the monitoring is to the load, the more insights can be
acquired relative to cost savings.
Monitor the operating point of the pump and its efficiency on a continual basis in order
to visualize trends. Observance of the trends can then lead to sensible actions that
improve efficiency, and verify the impact of improvements to the system.
Use proper metrics to identify an increase or decrease in efficiency on particular
systems and to compare efficiency performances of different pumps in multiple sites. A
recommended key performance indicator (KPI) metric is the specific energy
consumption, usually expressed as kWh/gallon of fluid flow.
Figure 3 Comparison of two efficiency
scenarios at different flow
rates: 8 to 9% more efficient
with variable speed drives at
60% flow
Scenario 1
Static head = 50% system head
Pump rated for the system
Scenario 2
Static head = 85% system head
Pump oversized for the system
Three Steps for Reducing Total Cost of Ownership (TCO) in Pumping Systems
Schneider Electric White Paper Revision 0 Page 6
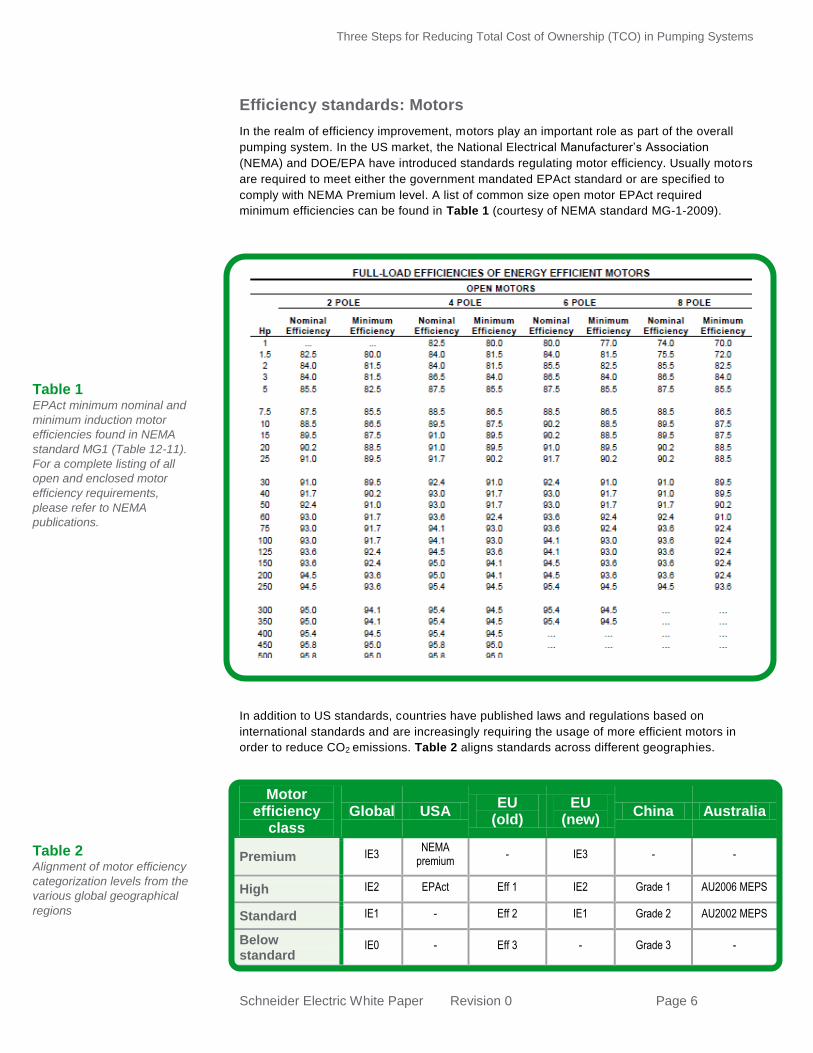
Efficiency standards: Motors
In the realm of efficiency improvement, motors play an important role as part of the overall
pumping system. In the US market, the National Electrical Manufacturer’s Association
(NEMA) and DOE/EPA have introduced standards regulating motor efficiency. Usually motors
are required to meet either the government mandated EPAct standard or are specified to
comply with NEMA Premium level. A list of common size open motor EPAct required
minimum efficiencies can be found in Table 1 (courtesy of NEMA standard MG-1-2009).
In addition to US standards, countries have published laws and regulations based on
international standards and are increasingly requiring the usage of more efficient motors in
order to reduce CO2 emissions. Table 2 aligns standards across different geographies.
Motor efficiency
class Global USA
EU (old)
EU (new)
China Australia
Premium IE3 NEMA
premium - IE3 - -
High IE2 EPAct Eff 1 IE2 Grade 1 AU2006 MEPS
Standard IE1 - Eff 2 IE1 Grade 2 AU2002 MEPS
Below standard
IE0 - Eff 3 - Grade 3 -
Table 1 EPAct minimum nominal and
minimum induction motor
efficiencies found in NEMA
standard MG1 (Table 12-11).
For a complete listing of all
open and enclosed motor
efficiency requirements,
please refer to NEMA
publications.
Table 2 Alignment of motor efficiency
categorization levels from the
various global geographical
regions
Three Steps for Reducing Total Cost of Ownership (TCO) in Pumping Systems
Schneider Electric White Paper Revision 0 Page 7
Efficiency standards: Pump Systems
While efficiency standards for pump systems do not yet exist in the United States, the DOE
has issued a Notice of Intent for Federal Standards regarding the energy efficiency of
commercial/ industrial pumps. The DOE has published a rulemaking framework and has
shared documents regarding commercial and industrial pumps with manufacturers, consumer
groups, federal agencies, and states in order to gather feedback.
However, the European Commission (EC) has already adopted regulation n°547/2012 under
Directive 2009/125/EC in regard to eco-design requirements for water pumps. Some
highlights include:
Definition of a Minimum Efficiency Index (MEI) for affected pumps.
As of January 1, 2013, pumps must have attained an MEI of higher than 0.1. This
affects the manufacturers of pumps because 10% of their configurations have been
rendered obsolete.
As of January 1, 2015, new pumps being sold to end users must attain an MEI of 0.4 or
higher. That means that 40% of manufacturers’ current inventory will be rendered
obsolete.
In order to further expand efficiency gains, the European Union has requested a new
directive which defines a broader view of the pumping system. Moving forward for
efficiency measurement purposes, a pumping system will include the pump, the motor,
the load profile, and the variable speed drives. This will result in a potential savings of
30% compared to 3.6% under the current “pump only” approach.
The IEC regulation n°547/2012 does not yet include fire fighting pumps, self priming
pumps, displacement pumps, pumps for private and public wastewater and for fluids
with a high solids content, pumps for swimming pools, pumps for fountains, and clean
water pumps larger than 150 kW.
The Hydraulic Institute is currently engaged with the European Pump Manufacturers
Association (Europump), NEMA, and DOE representatives to harmonize pump system
definitions for required efficiencies. Other regions of the world have defined their own
minimum energy performance for pumps. The calculation method in Brazil is similar to the EU
approach. In China, the regulation GB19762-2007 is applicable for clean water pumps. That
regulation defines 3 grades where grade 1 is used for very high efficiency pumps. Grade 3 is
the minimum efficiency authorized. The method of calculation used to define the grade is
different from the method used by EU regulation.
Physical assets such as pumps need to be maintained on an ongoing basis. Maintenance
costs represent 25% of TCO (see Figure 1) and therefore maintenance practices warrant
examination in terms of contribution to energy-influenced savings. Maintenance costs are
unavoidable due to the wear of components during system operation, and because the cost
of downtime attributed to loss of production will impact overall business performance.
In pumping installations, many moving parts mean that proper maintenance of motors, drives,
pumps, and associated pipes is crucial. Numerous steps can be taken to assure that
maintenance costs are kept at a minimum while integrity of the systems is kept stable.
All pumps should be operated within the parameters of a given pump’s specifications
(referenced in the pump supplier’s instruction manual / data sheet). As discussed, pump
efficiency varies according to operational parameters. The pump is designed for optimal
operation at the Best Efficiency Point (BEP) but 75% of the pumping systems are oversized
by around 30%.
Step 2: Asset management
European Regulation 547/2012 from European Union:
“As of January 1st 2015, pumps must attain an MEI of 0.4 or higher. That means that 40% of manufacturers’ current inventory will be rendered obsolete.”
Three Steps for Reducing Total Cost of Ownership (TCO) in Pumping Systems
Schneider Electric White Paper Revision 0 Page 8
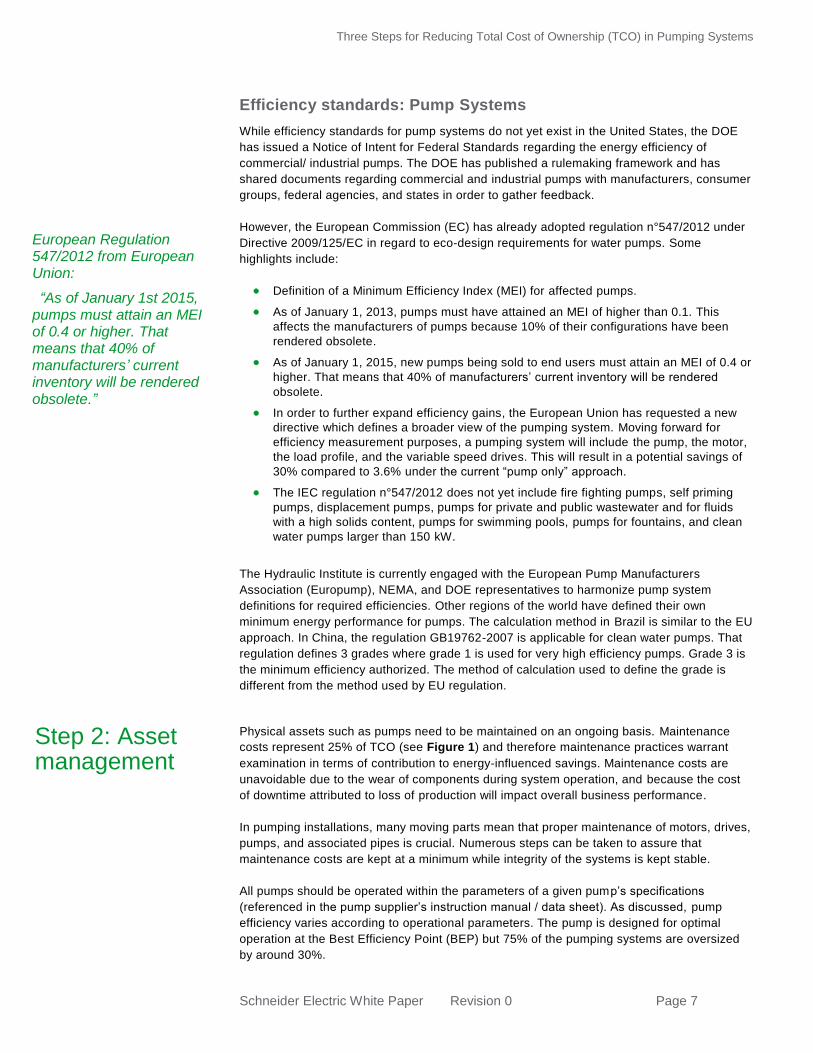
Figure 4 illustrates how pumps begin to waste significant energy when appropriate
maintenance practices are neglected. For example, discharge recirculation can occur if the
pump operates at 65% of the BEP flow rate, causing damage to the impeller, and a damaged
impeller, even if not failed completely, will be less efficient.
Variable speed drives can help to keep the operating point close to the BEP and also protect
the pump against destructive forces generated by inefficiencies. Extreme situations such as
dry running, low flow operation, or cavitation (due to low net positive suction head) which can
cause instantaneous damage are avoided. Monitoring the operating point of the pump and its
efficiency provides diagnostics that help predict when potential system problems will occur.
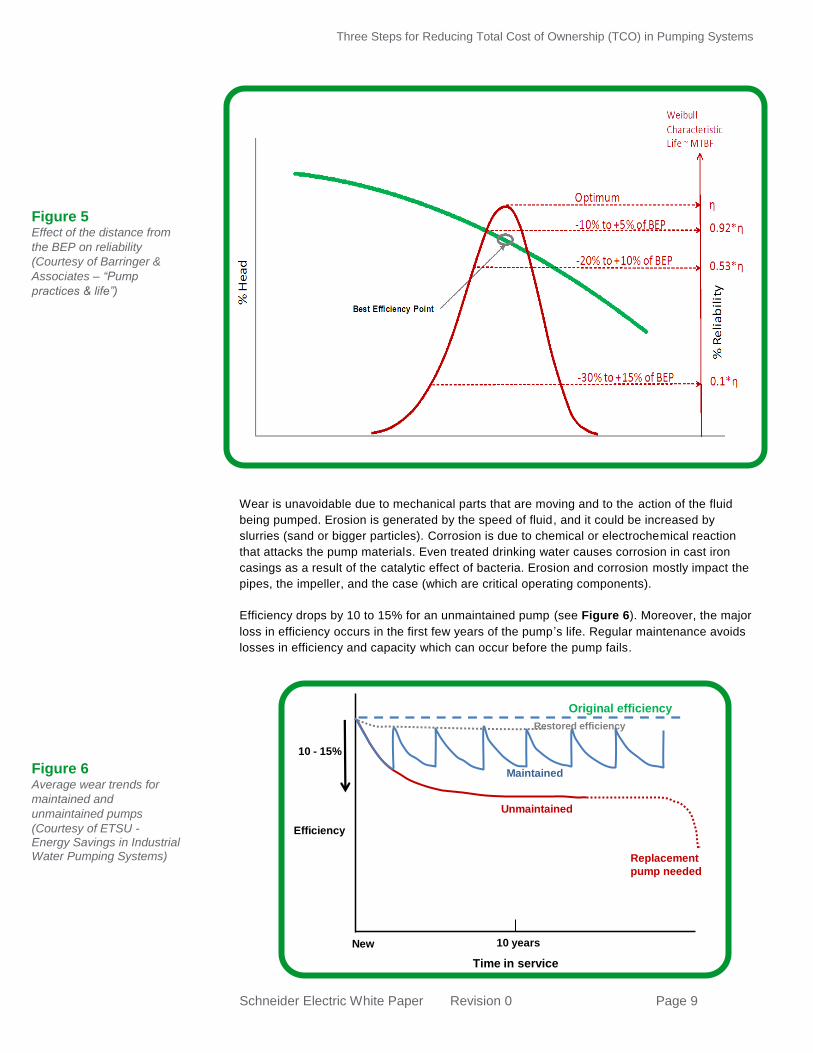
Figure 5 illustrates how operating away from the BEP not only decreases the efficiency but
speeds up the wear and tear on the pump thereby reducing reliability. For example, operating
at 60% of BEP result in:
50% lifetime reduction of seals
20% lifetime reduction of bearings
25% lifetime reduction of casing and impeller
Approximately 100% increase of maintenance cost
% H
ea
d
% Flow
High temperature rise
Best Efficiency Point
Low flow cavitation
Low bearing &
low seal life
Low impeller life
Suction
recirculation
Discharge
recirculation
Low bearing & Low seal Life
Cavitation
Figure 4 Maintenance related issues
that impact pump
performance (Courtesy of
Barringer & Associates-
“Pump practices & life”)
Three Steps for Reducing Total Cost of Ownership (TCO) in Pumping Systems
Schneider Electric White Paper Revision 0 Page 9
Wear is unavoidable due to mechanical parts that are moving and to the action of the fluid
being pumped. Erosion is generated by the speed of fluid, and it could be increased by
slurries (sand or bigger particles). Corrosion is due to chemical or electrochemical reaction
that attacks the pump materials. Even treated drinking water causes corrosion in cast iron
casings as a result of the catalytic effect of bacteria. Erosion and corrosion mostly impact the
pipes, the impeller, and the case (which are critical operating components).
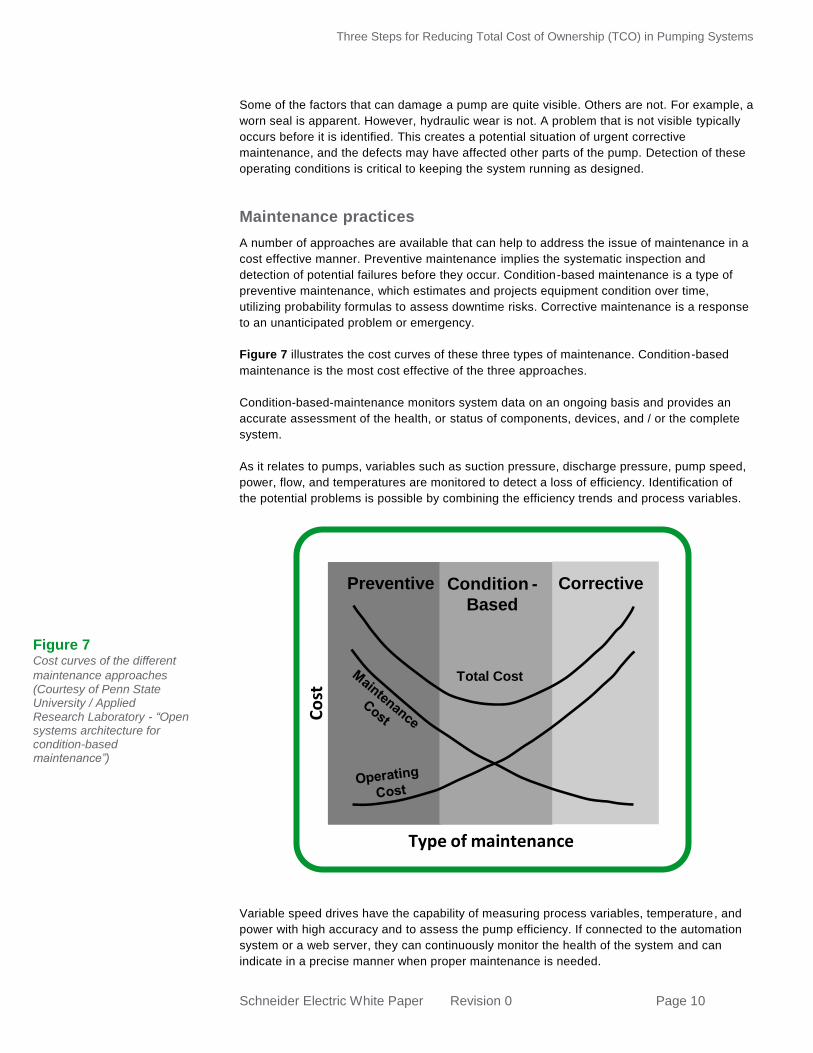
Efficiency drops by 10 to 15% for an unmaintained pump (see Figure 6). Moreover, the major
loss in efficiency occurs in the first few years of the pump ’s life. Regular maintenance avoids
losses in efficiency and capacity which can occur before the pump fails.
Original efficiency
Restored efficiency
Maintained
Unmaintained
Efficiency
Replacement
pump needed
10 - 15%
Time in service
New 10 years
Figure 5 Effect of the distance from
the BEP on reliability
(Courtesy of Barringer &
Associates – “Pump
practices & life”)
Figure 6 Average wear trends for
maintained and
unmaintained pumps
(Courtesy of ETSU - Energy Savings in Industrial Water Pumping Systems)
Three Steps for Reducing Total Cost of Ownership (TCO) in Pumping Systems
Schneider Electric White Paper Revision 0 Page 10
Some of the factors that can damage a pump are quite visible. Others are not. For example, a
worn seal is apparent. However, hydraulic wear is not. A problem that is not visible typically
occurs before it is identified. This creates a potential situation of urgent corrective
maintenance, and the defects may have affected other parts of the pump. Detection of these
operating conditions is critical to keeping the system running as designed.
Maintenance practices
A number of approaches are available that can help to address the issue of maintenance in a
cost effective manner. Preventive maintenance implies the systematic inspection and
detection of potential failures before they occur. Condition-based maintenance is a type of
preventive maintenance, which estimates and projects equipment condition over time,
utilizing probability formulas to assess downtime risks. Corrective maintenance is a response
to an unanticipated problem or emergency.
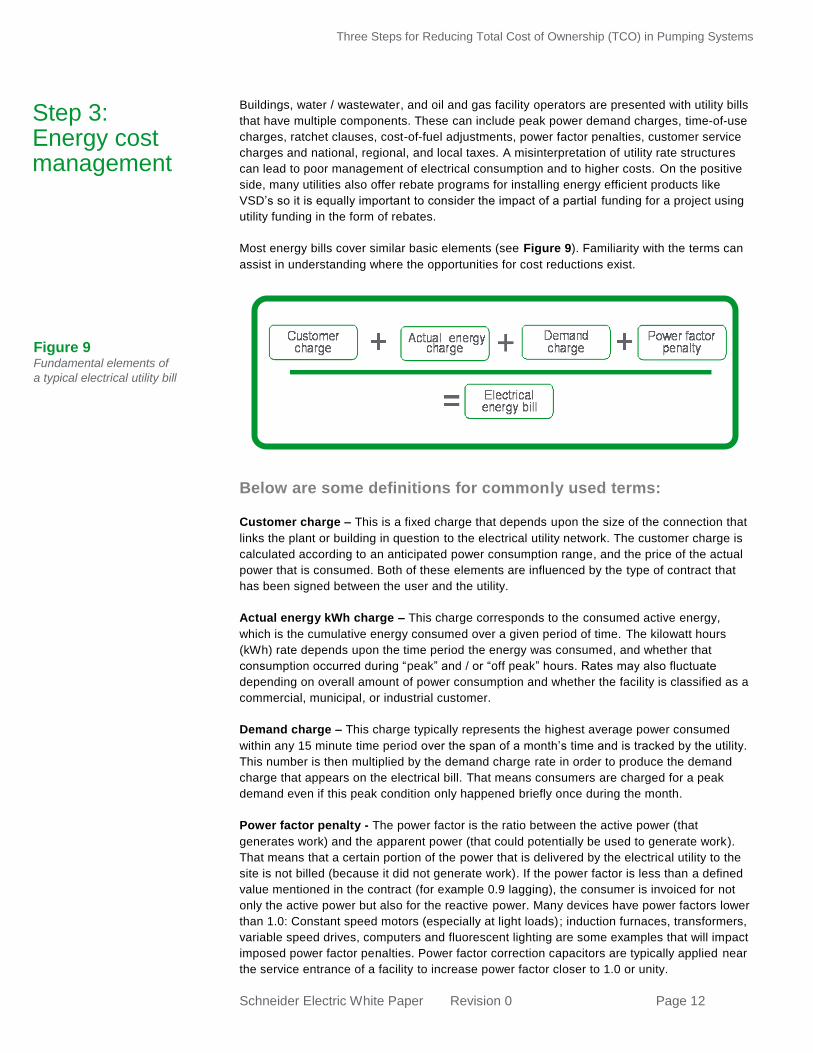
Figure 7 illustrates the cost curves of these three types of maintenance. Condition-based
maintenance is the most cost effective of the three approaches.
Condition-based-maintenance monitors system data on an ongoing basis and provides an
accurate assessment of the health, or status of components, devices, and / or the complete
system.
As it relates to pumps, variables such as suction pressure, discharge pressure, pump speed,
power, flow, and temperatures are monitored to detect a loss of efficiency. Identification of
the potential problems is possible by combining the efficiency trends and process variables.
Variable speed drives have the capability of measuring process variables, temperature, and
power with high accuracy and to assess the pump efficiency. If connected to the automation
system or a web server, they can continuously monitor the health of the system and can
indicate in a precise manner when proper maintenance is needed.
Co
st
Type of maintenance
Preventive Condition -
Based
Corrective
Total Cost
Figure 7 Cost curves of the different
maintenance approaches (Courtesy of Penn State University / Applied Research Laboratory - “Open systems architecture for condition-based maintenance”)

Three Steps for Reducing Total Cost of Ownership (TCO) in Pumping Systems
Schneider Electric White Paper Revision 0 Page 11
Figure 8 illustrates how a worn part can impact the pump efficiency curve.
Pipes
As part of the overall pumping system, pipes are also subject to issues such as overpressure,
leakage, or pipe burst. An overpressure situation can be caused by poor pump control. A
situation called “water hammer” can also occur. Water hammer is caused by a pressure or
shock wave that travels through the pipes, generated by a sudden stop in the velocity of the
water. This sudden acceleration and deceleration on the motor can be avoided with the help
of a variable speed drive (sudden variation in flows is avoided). Leakage can also be reduced
by automatic adjustments to pressure when appropriate.
Motors
Protection against input voltage and frequency fluctuations can help maintain the integrity
and extend the lifetime of motors. In cases where motors are equipped with variable speed
drives, those electrical disturbances are not transmitted to the motor.
Protection against high temperature conditions can also extend the life of the motor assets.
Devices such as thermal relays, PTC or PT100 thermal sensors can help and are
manageable through the variable speed drive.
In cases where long motor cables are used in conjunction with motors and variable speed
drives, it is recommended that filters be installed in order to avoid the dv / dt and motor
voltage surge effects (see the Schneider Electric white paper “An Improved Approach for
Connecting VSD and Electric Motors” for more details on this subject). Note: For submersible
bore hole pumps, it is recommended to verify the peak to peak voltage and the dv / dt at the
motor terminals with the motor-pump supplier.
Figure 8 Worn pump curve vs.
new pump curve
Three Steps for Reducing Total Cost of Ownership (TCO) in Pumping Systems
Schneider Electric White Paper Revision 0 Page 12
Buildings, water / wastewater, and oil and gas facility operators are presented with utility bills
that have multiple components. These can include peak power demand charges, time-of-use
charges, ratchet clauses, cost-of-fuel adjustments, power factor penalties, customer service
charges and national, regional, and local taxes. A misinterpretation of utility rate structures
can lead to poor management of electrical consumption and to higher costs. On the positive
side, many utilities also offer rebate programs for installing energy efficient products like
VSD’s so it is equally important to consider the impact of a partial funding for a project using
utility funding in the form of rebates.
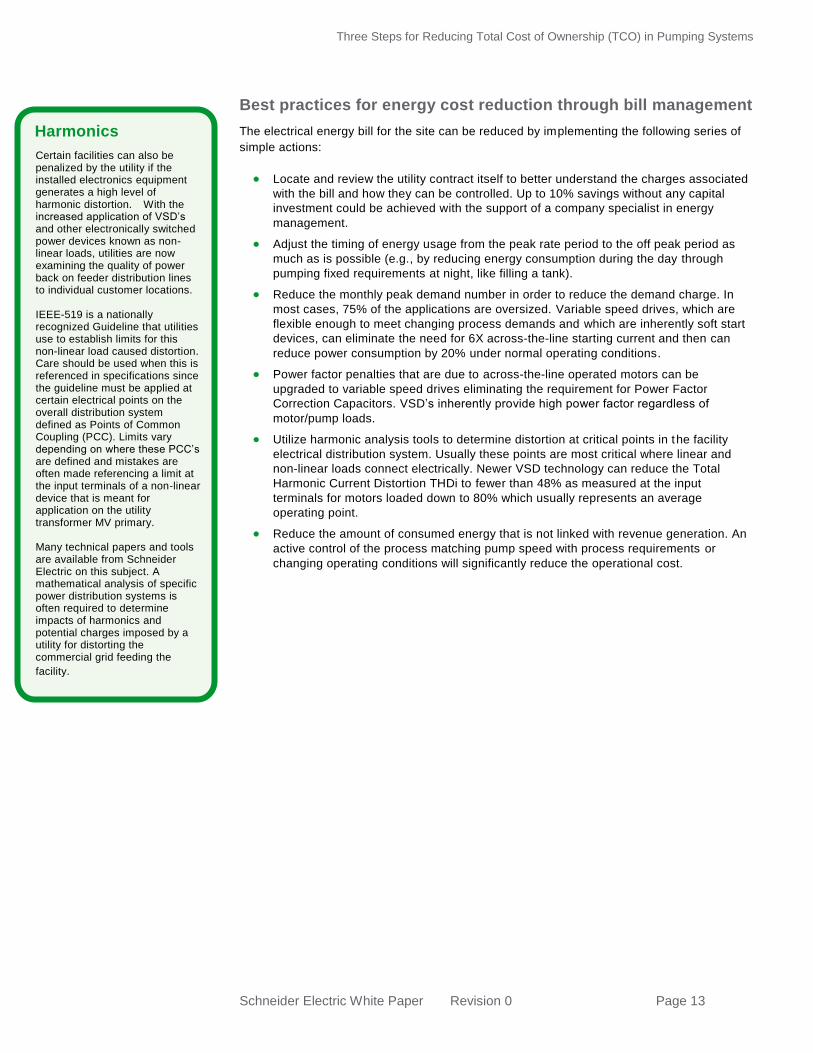
Most energy bills cover similar basic elements (see Figure 9). Familiarity with the terms can
assist in understanding where the opportunities for cost reductions exist.
Below are some definitions for commonly used terms:
Customer charge – This is a fixed charge that depends upon the size of the connection that
links the plant or building in question to the electrical utility network. The customer charge is
calculated according to an anticipated power consumption range, and the price of the actual
power that is consumed. Both of these elements are influenced by the type of contract that
has been signed between the user and the utility.
Actual energy kWh charge – This charge corresponds to the consumed active energy,
which is the cumulative energy consumed over a given period of time. The kilowatt hours
(kWh) rate depends upon the time period the energy was consumed, and whether that
consumption occurred during “peak” and / or “off peak” hours. Rates may also fluctuate
depending on overall amount of power consumption and whether the facility is classified as a
commercial, municipal, or industrial customer.
Demand charge – This charge typically represents the highest average power consumed
within any 15 minute time period over the span of a month’s time and is tracked by the utility.
This number is then multiplied by the demand charge rate in order to produce the demand
charge that appears on the electrical bill. That means consumers are charged for a peak
demand even if this peak condition only happened briefly once during the month.
Power factor penalty - The power factor is the ratio between the active power (that
generates work) and the apparent power (that could potentially be used to generate work).
That means that a certain portion of the power that is delivered by the electrical utility to the
site is not billed (because it did not generate work). If the power factor is less than a defined
value mentioned in the contract (for example 0.9 lagging), the consumer is invoiced for not
only the active power but also for the reactive power. Many devices have power factors lower
than 1.0: Constant speed motors (especially at light loads); induction furnaces, transformers,
variable speed drives, computers and fluorescent lighting are some examples that will impact
imposed power factor penalties. Power factor correction capacitors are typically applied near
the service entrance of a facility to increase power factor closer to 1.0 or unity.
Step 3: Energy cost management
Figure 9 Fundamental elements of
a typical electrical utility bill
Three Steps for Reducing Total Cost of Ownership (TCO) in Pumping Systems
Schneider Electric White Paper Revision 0 Page 13
Best practices for energy cost reduction through bill management
The electrical energy bill for the site can be reduced by implementing the following series of
simple actions:
Locate and review the utility contract itself to better understand the charges associated
with the bill and how they can be controlled. Up to 10% savings without any capital
investment could be achieved with the support of a company specialist in energy
management.
Adjust the timing of energy usage from the peak rate period to the off peak period as
much as is possible (e.g., by reducing energy consumption during the day through
pumping fixed requirements at night, like filling a tank).
Reduce the monthly peak demand number in order to reduce the demand charge. In
most cases, 75% of the applications are oversized. Variable speed drives, which are
flexible enough to meet changing process demands and which are inherently soft start
devices, can eliminate the need for 6X across-the-line starting current and then can
reduce power consumption by 20% under normal operating conditions.
Power factor penalties that are due to across-the-line operated motors can be
upgraded to variable speed drives eliminating the requirement for Power Factor
Correction Capacitors. VSD’s inherently provide high power factor regardless of
motor/pump loads.
Utilize harmonic analysis tools to determine distortion at critical points in the facility
electrical distribution system. Usually these points are most critical where linear and
non-linear loads connect electrically. Newer VSD technology can reduce the Total
Harmonic Current Distortion THDi to fewer than 48% as measured at the input
terminals for motors loaded down to 80% which usually represents an average
operating point.
Reduce the amount of consumed energy that is not linked with revenue generation. An
active control of the process matching pump speed with process requirements or
changing operating conditions will significantly reduce the operational cost.
Harmonics Certain facilities can also be penalized by the utility if the installed electronics equipment generates a high level of harmonic distortion. With the increased application of VSD’s and other electronically switched power devices known as non-linear loads, utilities are now examining the quality of power back on feeder distribution lines to individual customer locations. IEEE-519 is a nationally recognized Guideline that utilities use to establish limits for this non-linear load caused distortion. Care should be used when this is referenced in specifications since the guideline must be applied at certain electrical points on the overall distribution system defined as Points of Common Coupling (PCC). Limits vary depending on where these PCC’s are defined and mistakes are often made referencing a limit at the input terminals of a non-linear device that is meant for application on the utility transformer MV primary. Many technical papers and tools are available from Schneider Electric on this subject. A mathematical analysis of specific power distribution systems is often required to determine impacts of harmonics and potential charges imposed by a utility for distorting the commercial grid feeding the
facility.

Three Steps for Reducing Total Cost of Ownership (TCO) in Pumping Systems
Schneider Electric White Paper Revision 0 Page 14
By pursuing best practices in energy efficiency management, asset management, and energy
cost management, the total cost of ownership for pumping systems can be reduced by up to
20%. One evolving technology, the Variable Speed Drive (VSD) with embedded energy
management functionality, has the capability of being a major contributor to achieving
reductions in TCO for the life of the pump system.
The VSD is now capable of being fully integrated into process systems and drastically impact
users TCO. An energy management plan can be formulated by adopting energy efficient
technologies, implementing condition-based maintenance practices, and optimizing cost
control of the electrical utility costs. Using advanced VSD functions linked to pumping
processes translates into improved business performance through better energy efficiency
management and reduced maintenance costs.
To minimize unnecessary project delay, risk, and expense, organizations that are ill-
equipped to jumpstart an energy efficiency program should seek the assistance of mission-
critical subject matter experts who can take all aspects into account. Unseen variables like
power factor, peak demand charges, pumping inefficiencies, and overall system performance
can then be analyzed. A company that takes into account all these system variables can
greatly assist in providing products and services to help design the most energy efficient
facility.
To achieve operational sustainability, organizations must act quickly to assess their
current programs. By building an operational methodology that emphasizes improvement in
system efficiency, they can influence the Total Cost of Ownership of pumping systems.
© 2
013
Sch
neid
er E
lectric
. All rig
hts
rese
rve
d.
© 2
014
S
chne
ider
Ele
ctric
. All
right
s re
serv
ed.
Conclusion
Tom Lowery is the Product Manager for Variable Torque Drives within Schneider Electric’s
Industry business. He holds a BEE from Villanova University. Tom participates in and holds
various chair positions in key industry organizations – ASHRAE, AHRI, Hydraulic Institute,
NEMA, UL and others.
Jack Creamer is the Market Segment Manager for Pumping Equipment within Schneider
Electric’s Industry business. He holds an MBA from Rensselaer Polytechnic University and a
BSIE from Syracuse University. Jack participates in and holds various officer positions in key
industry organizations – Hydraulic Institute, Submersible Wastewater Pump Association,
National Groundwater Association, American Water Works Association, ASPE and others.
Lionel Gaudrel is a Strategic Marketing Manager within Schneider Electric’s Industry
business. He holds a bachelor degree in electrical engineering and a master degree from
EMLyon Business School. He has over 20 years of experience in the industrial applications
field and holds a patent around variable speed drive automation technologies.
Arnaud Savreux is an Offer Application Expert manager within Schneider Electric’s Industry
business. He holds a postgraduate degree in electronics and automation from the University
of Rouen (France). He has applied his engineering skills to multiple industry automation
projects.
About the authors