95th percentile billing - meet us in denver, co for nanog 73! · outline •internet access usage...
TRANSCRIPT

95th Percentile Billing
Amie Elcan, CenturyLink
Principal Architect, Data Strategy and Development
Nanog53 Philadelphia, PA
October 10, 2011

Outline
• Internet access usage trends and consumption based pricing
• Background on 95th percentile billing
• Conversion from monthly 95th % Mbps to volume
• Traffic ‘peakedness’ and impact on cost per unit volume
• Consequences of billing policy
• Two sided market
2

3
0
20
40
60
80
100
120
140
160
180
Median Mean 95th% 99th%
Gb
yte
s
Monthly Broadband Consumer Usage
2007
2011
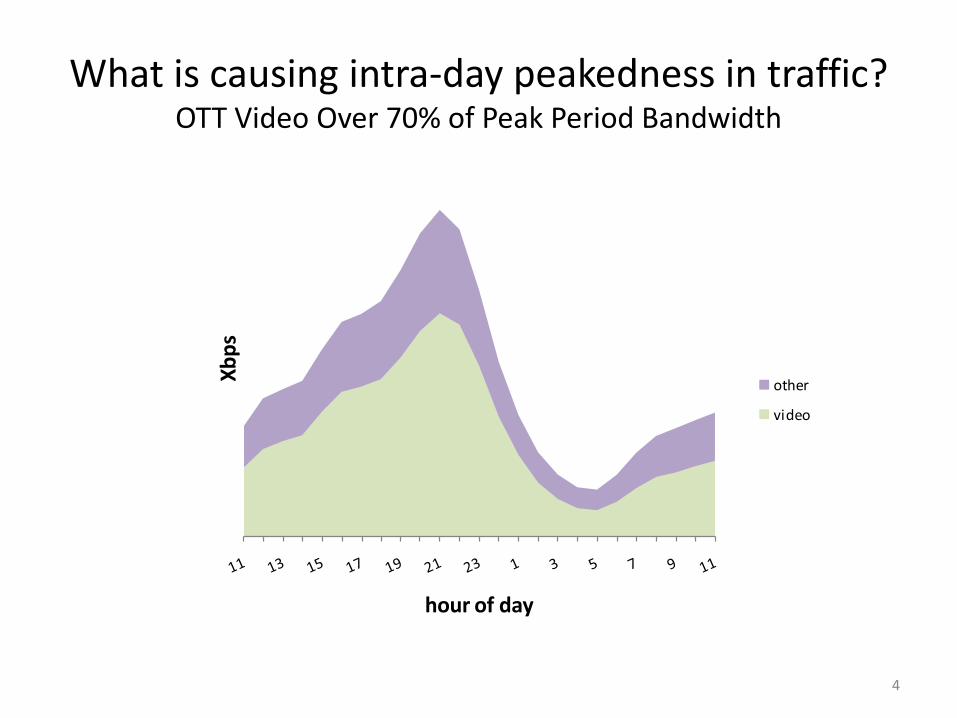
What is causing intra-day peakedness in traffic?
OTT Video Over 70% of Peak Period Bandwidth
4
Xb
ps
hour of day
other
video

95th% Billing Explained
• What is the 95th % billing? How is it computed?
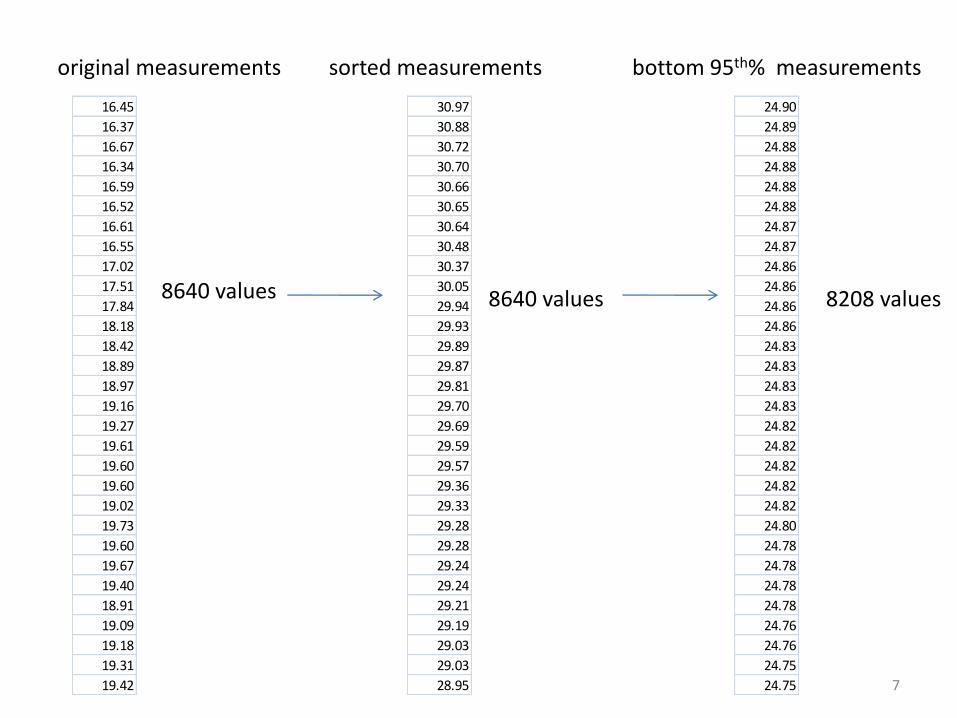
– Measure interface bandwidth every 5 minutes for the month (12 per hour, 288 per day, 8640 for 30 days)
– Sort measurements from largest to smallest
– Throw away top 5% of values (432)
• 36 hours per month or 1.2 hours per day for which there is no billing
– Remaining value is the 95th % in Mbps. Customer charged based on this value
5

Edge
Location of Measurements
6
ISP Backbone Network
Customer
Edge
7
16.45
16.37
16.67
16.34
16.59
16.52
16.61
16.55
17.02
17.51
17.84
18.18
18.42
18.89
18.97
19.16
19.27
19.61
19.60
19.60
19.02
19.73
19.60
19.67
19.40
18.91
19.09
19.18
19.31
19.42
30.97
30.88
30.72
30.70
30.66
30.65
30.64
30.48
30.37
30.05
29.94
29.93
29.89
29.87
29.81
29.70
29.69
29.59
29.57
29.36
29.33
29.28
29.28
29.24
29.24
29.21
29.19
29.03
29.03
28.95
8640 values 8208 values
original measurements sorted measurements
24.90
24.89
24.88
24.88
24.88
24.88
24.87
24.87
24.86
24.86
24.86
24.86
24.83
24.83
24.83
24.83
24.82
24.82
24.82
24.82
24.82
24.80
24.78
24.78
24.78
24.78
24.76
24.76
24.75
24.75
8640 values
bottom 95th% measurements

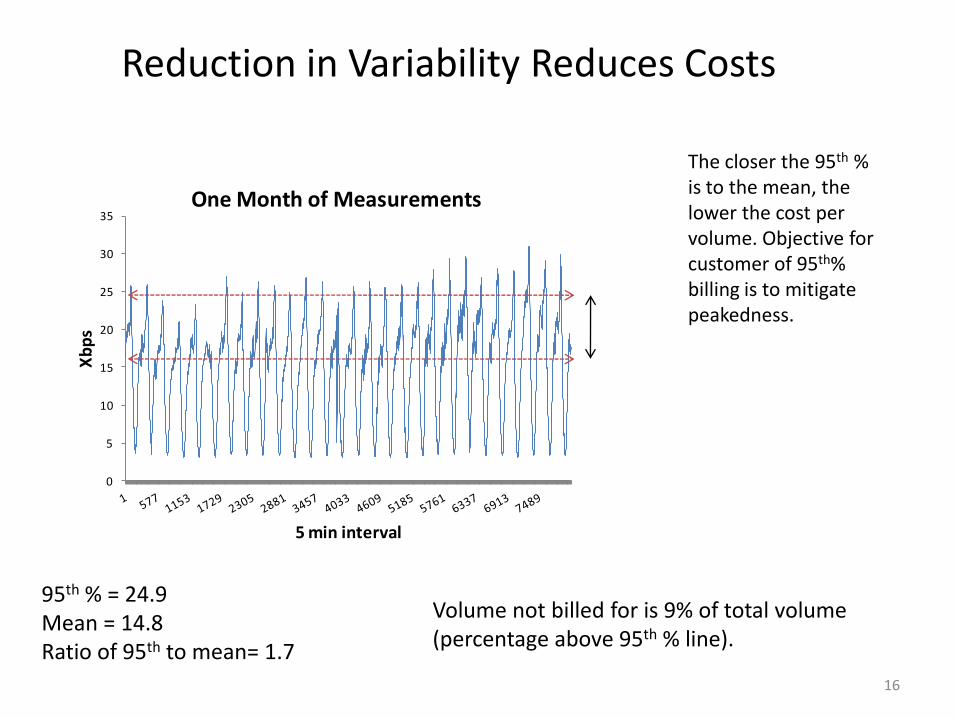
8 95th % is 25, max of 31, average of 15
0
5
10
15
20
25
30
35X
bp
s
5 min interval
One Month of Measurementsvolume not billed

9
Closer Look at One Day
0
5
10
15
20
25
30
Xb
ps
5 minute intervalsMax = 26.3 Mean = 14.6 95th % = 24.1 Ratio of 95th % to mean = 1.6 Max is 1.10% of 95th % value

Estimate Monthly Volume from 95th % Mbps (Reconcile Bandwidth and Volume Measurements)
• Start with 95th % measurement of X Mbps
• Divide by 95th%/mean ratio for that interface, suppose 1.8
• X/1.8 is the average Mbps for entire month
• Divide by 8 (bits per byte), X/1.8/8 is average Mbytes per second
• Multiply by seconds in a month (3600*24*30) 2.592 M
• Volume is (X/1.8/8)*2.592M Mbytes
• Divide by 1024 to compute Gbytes or 1024*1024 for Tbytes
10

Price Conversion Example
• Calculate price paid / volume
• Start with 100 Mbps 95th%
• Average is = 100/1.8 = 55.6 Mbps
• 55.6/ 8 = 6.9 Mbytes per second
• 6.9 * 2.592M = 18000000 Mbytes = 18000000/1024 = 17578 Gbytes = 17.2 Tbytes
• Suppose billed price is $3 per Mbps
• Price charged is 100*$3 = $300
• Price per Gbyte = $300/17578 Gbytes = 1.7 cents
11

Monthly * Volume and Price per Gbyte
12
1 1.25 1.5 1.75 2 2.25
Gbytes 316 253 211 181 158 141
Efficiency 100% 80% 67% 57% 50% 44%
best you can do more typical, less efficient
The price paid per Gbyte (in cents) depends on the ratio of the 95th % to mean and the price paid per monthly 95th% Mbps.
Gbytes delivered per month for 95th % of 1 Mbps. Varies with peakedness.
1 1.25 1.5 1.75 2 2.25
$1 0.32 0.40 0.47 0.55 0.63 0.71
$2 0.63 0.79 0.95 1.11 1.26 1.42
$3 0.95 1.19 1.42 1.66 1.90 2.13
$4 1.26 1.58 1.90 2.21 2.53 2.84
$5 1.58 1.98 2.37 2.77 3.16 3.56
Price Per Meg
Ratio of 95th% to mean

13
0
0.5
1
1.5
2
2.5
hours in day
Same Daily Volume Varying 'Efficiency' due to Peakedness
2:1 ratio
Area (proportional to volume of data transferred in bytes) under blue curve = area of red rectangle

14
0
0.5
1
1.5
2
2.5
hours in day
Approximately Same Daily Volume Varying Peakedness (Price Paid)
2:1 ratio
1.75:1 ratio
1.5:1 ratio

Monthly Volume
15
/ n)
Total volume for the month if n = 8640
average
Xb
ps
5 minute interval
Xi
16
95th % = 24.9 Mean = 14.8 Ratio of 95th to mean= 1.7
The closer the 95th % is to the mean, the lower the cost per volume. Objective for customer of 95th% billing is to mitigate peakedness.
Volume not billed for is 9% of total volume (percentage above 95th % line).
Reduction in Variability Reduces Costs
0
5
10
15
20
25
30
35
Xb
ps
5 min interval
One Month of Measurements

17
One month of data – closer Look at one day. Peak to mean 3:1, typically closer to 2:1 for natural traffic.
time * average bandwidth/8 = volume
Consequences of 95th % Billing Policy
0
5
10
15
20
25
30
Xb
ps
5 minute intervals
Example Bandwidth
0
5
10
15
20
25
30
Xb
ps
5 minute interval
bandwidth
time

Two Sided Market
• Assume a moderately fast internet service at 6-20 Mbps.
• Current pricing (non-promotional) @ $50 per month.
• For a heavy video user customer downloading 150 Gbytes per month, the price paid per consumed Gbyte is 33 cents (5000/150)
• Content provider pays ½ to 3 cents per Gbyte ($1 - $5 per 95th % Mbps)
• Residential internet consumer paying over 95%+ of the price per delivered Gbyte
18

Summary • Content delivery providers must accommodate
bandwidth intensive video with a distinct time of day pattern
• Objective of content provider is to minimize cost per Gbyte delivered
• Objective of internet service and transit providers is to recover costs, maintain profitable service, and maintain predictability in traffic patterns to ensure capacity and performance
• The combination of peaked traffic and billing practices presents a challenge to both content and transit providers
• Is 95th % billing transparent enough and reconcilable with the trend towards per unit volume billing for consumers?
19