980 hdmi 2.0 video generator module application note hdr lab · 2017-03-20 · 980 hdmi 2.0 video...
TRANSCRIPT
980 HDMI 2.0 Video Generator - User Guide Rev. B1
Page 1 March 6, 2017
980 HDMI 2.0 Video Generator Module
Application Note HDR Lab
Rev: B1
980 HDMI 2.0 Video Generator - User Guide Rev. B1
Page 2 March 6, 2017
Testing UHD Displays with HDR Lab Test Patterns
In order to address the HDR needs of the industry from Device Manufacturers to HDR content Post-Production,
Teledyne LeCroy has worked together with industry experts Joe Kane of Joe Kane Productions and Florian
Friedrich to develop this new test option “HDR Lab.” The solutions use the 980 HDMI 2.0 Protocol Analyzer and the
HDMI 2.0 Video Generator modules. There are two test applications:
HDR Display Test Suite – Verifies various HDR attributes such as: peak brightness, native contrast, color
decoding, signal clipping, and color gamut on an HDR-capable UHD TV using a variety of test patterns
(below) while enabling the user to change important signal parameters to test the response of any given
HDR display.
HDR End-to-End Validation in Post Production – Verifies HDR metadata, signal levels and many more
relevant parameters throughout the post production process. Reference images can be compared with
HDR workflow outputs.
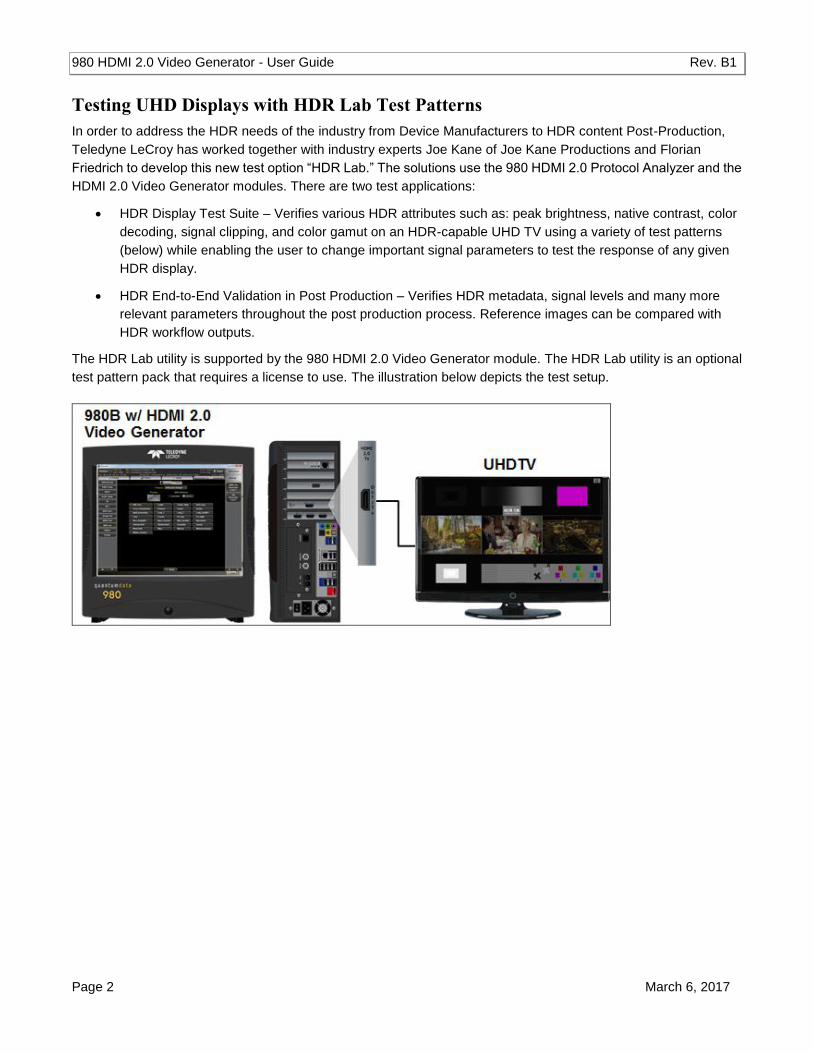
The HDR Lab utility is supported by the 980 HDMI 2.0 Video Generator module. The HDR Lab utility is an optional
test pattern pack that requires a license to use. The illustration below depicts the test setup.
980 HDMI 2.0 Video Generator - User Guide Rev. B1
Page 3 March 6, 2017
The following table describes just some of the Test Patterns and Reference Images that comprise the HDR Lab
utility. Additional test patterns and test images are included and will be described in subsequent versions of this
application note.
HDR Lab Test Patterns
Test Pattern Name Function, Pattern Layout and Use
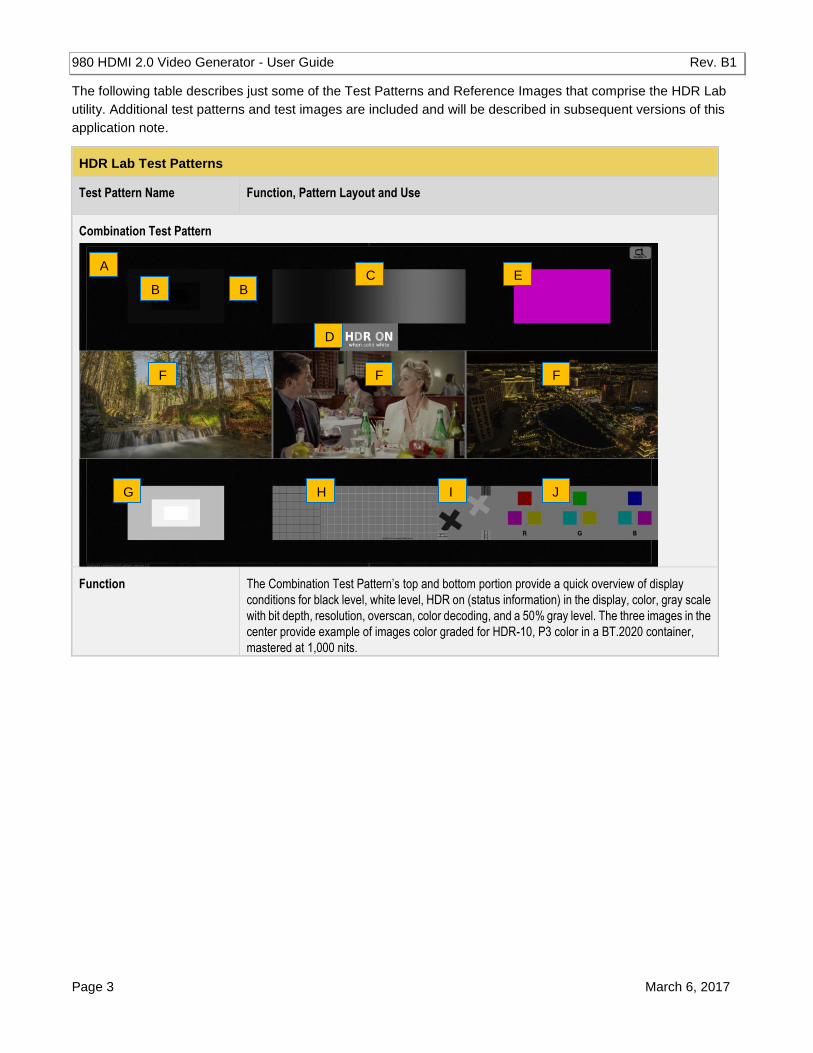
Combination Test Pattern
Function The Combination Test Pattern’s top and bottom portion provide a quick overview of display
conditions for black level, white level, HDR on (status information) in the display, color, gray scale
with bit depth, resolution, overscan, color decoding, and a 50% gray level. The three images in the
center provide example of images color graded for HDR-10, P3 color in a BT.2020 container,
mastered at 1,000 nits.
A
B B C
D
E
F F F
G H I J
980 HDMI 2.0 Video Generator - User Guide Rev. B1
Page 4 March 6, 2017
HDR Lab Test Patterns
Test Pattern Name Function, Pattern Layout and Use
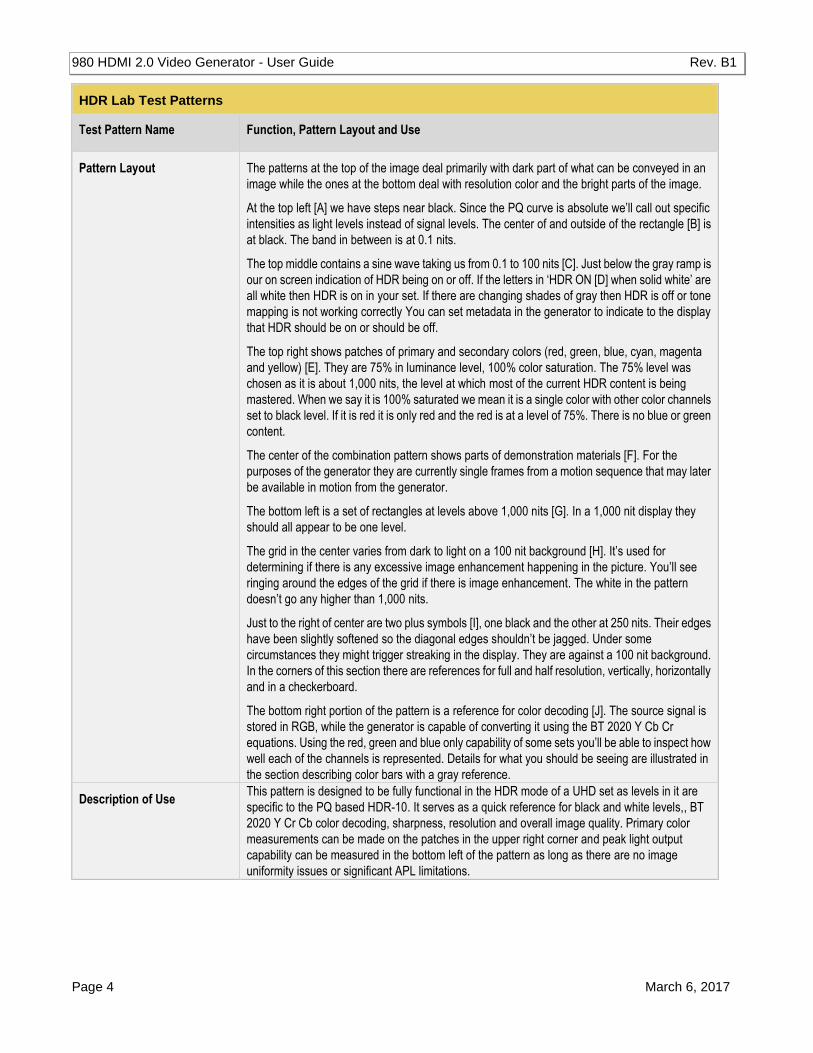
Pattern Layout The patterns at the top of the image deal primarily with dark part of what can be conveyed in an
image while the ones at the bottom deal with resolution color and the bright parts of the image.
At the top left [A] we have steps near black. Since the PQ curve is absolute we’ll call out specific
intensities as light levels instead of signal levels. The center of and outside of the rectangle [B] is
at black. The band in between is at 0.1 nits.
The top middle contains a sine wave taking us from 0.1 to 100 nits [C]. Just below the gray ramp is
our on screen indication of HDR being on or off. If the letters in ‘HDR ON [D] when solid white’ are
all white then HDR is on in your set. If there are changing shades of gray then HDR is off or tone
mapping is not working correctly You can set metadata in the generator to indicate to the display
that HDR should be on or should be off.
The top right shows patches of primary and secondary colors (red, green, blue, cyan, magenta
and yellow) [E]. They are 75% in luminance level, 100% color saturation. The 75% level was
chosen as it is about 1,000 nits, the level at which most of the current HDR content is being
mastered. When we say it is 100% saturated we mean it is a single color with other color channels
set to black level. If it is red it is only red and the red is at a level of 75%. There is no blue or green
content.
The center of the combination pattern shows parts of demonstration materials [F]. For the
purposes of the generator they are currently single frames from a motion sequence that may later
be available in motion from the generator.
The bottom left is a set of rectangles at levels above 1,000 nits [G]. In a 1,000 nit display they
should all appear to be one level.
The grid in the center varies from dark to light on a 100 nit background [H]. It’s used for
determining if there is any excessive image enhancement happening in the picture. You’ll see
ringing around the edges of the grid if there is image enhancement. The white in the pattern
doesn’t go any higher than 1,000 nits.
Just to the right of center are two plus symbols [I], one black and the other at 250 nits. Their edges
have been slightly softened so the diagonal edges shouldn’t be jagged. Under some
circumstances they might trigger streaking in the display. They are against a 100 nit background.
In the corners of this section there are references for full and half resolution, vertically, horizontally
and in a checkerboard.
The bottom right portion of the pattern is a reference for color decoding [J]. The source signal is
stored in RGB, while the generator is capable of converting it using the BT 2020 Y Cb Cr
equations. Using the red, green and blue only capability of some sets you’ll be able to inspect how
well each of the channels is represented. Details for what you should be seeing are illustrated in
the section describing color bars with a gray reference.
Description of Use This pattern is designed to be fully functional in the HDR mode of a UHD set as levels in it are
specific to the PQ based HDR-10. It serves as a quick reference for black and white levels,, BT
2020 Y Cr Cb color decoding, sharpness, resolution and overall image quality. Primary color
measurements can be made on the patches in the upper right corner and peak light output
capability can be measured in the bottom left of the pattern as long as there are no image
uniformity issues or significant APL limitations.
980 HDMI 2.0 Video Generator - User Guide Rev. B1
Page 5 March 6, 2017
HDR Lab Test Patterns
Test Pattern Name Function, Pattern Layout and Use
Clipping Test Pattern
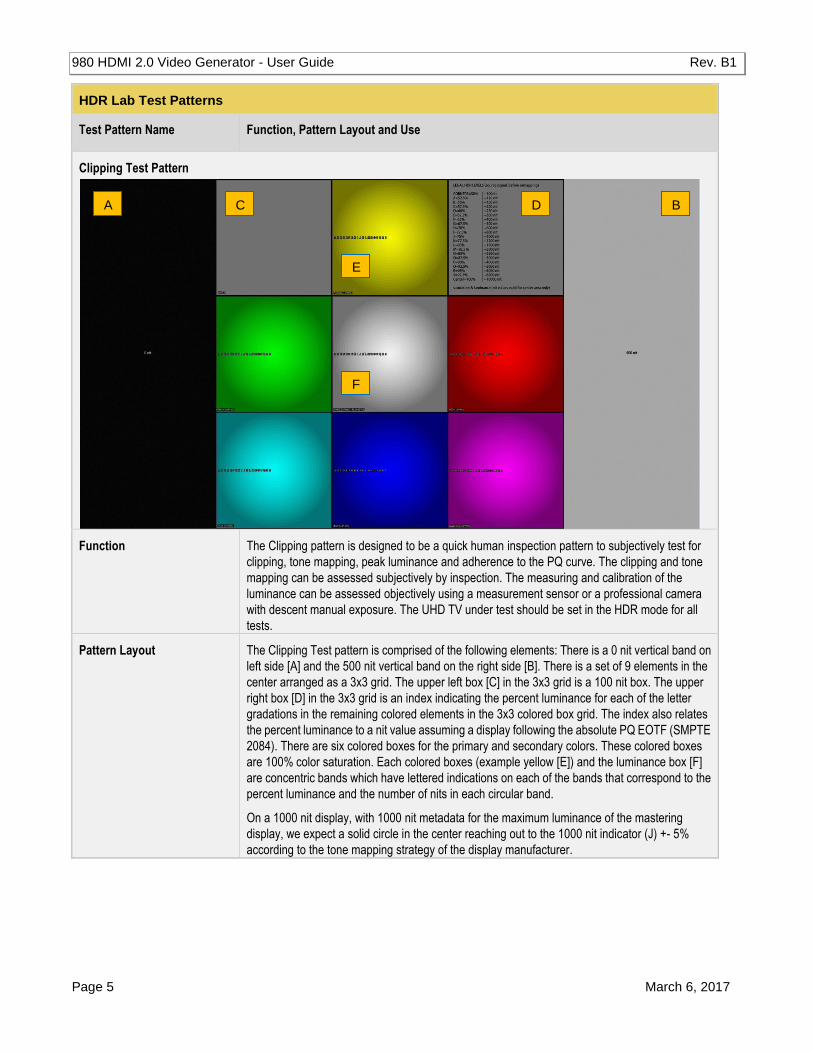
Function The Clipping pattern is designed to be a quick human inspection pattern to subjectively test for
clipping, tone mapping, peak luminance and adherence to the PQ curve. The clipping and tone
mapping can be assessed subjectively by inspection. The measuring and calibration of the
luminance can be assessed objectively using a measurement sensor or a professional camera
with descent manual exposure. The UHD TV under test should be set in the HDR mode for all
tests.
Pattern Layout The Clipping Test pattern is comprised of the following elements: There is a 0 nit vertical band on
left side [A] and the 500 nit vertical band on the right side [B]. There is a set of 9 elements in the
center arranged as a 3x3 grid. The upper left box [C] in the 3x3 grid is a 100 nit box. The upper
right box [D] in the 3x3 grid is an index indicating the percent luminance for each of the letter
gradations in the remaining colored elements in the 3x3 colored box grid. The index also relates
the percent luminance to a nit value assuming a display following the absolute PQ EOTF (SMPTE
2084). There are six colored boxes for the primary and secondary colors. These colored boxes
are 100% color saturation. Each colored boxes (example yellow [E]) and the luminance box [F]
are concentric bands which have lettered indications on each of the bands that correspond to the
percent luminance and the number of nits in each circular band.
On a 1000 nit display, with 1000 nit metadata for the maximum luminance of the mastering
display, we expect a solid circle in the center reaching out to the 1000 nit indicator (J) +- 5%
according to the tone mapping strategy of the display manufacturer.
A B
E
D C
F
980 HDMI 2.0 Video Generator - User Guide Rev. B1
Page 6 March 6, 2017
HDR Lab Test Patterns
Test Pattern Name Function, Pattern Layout and Use
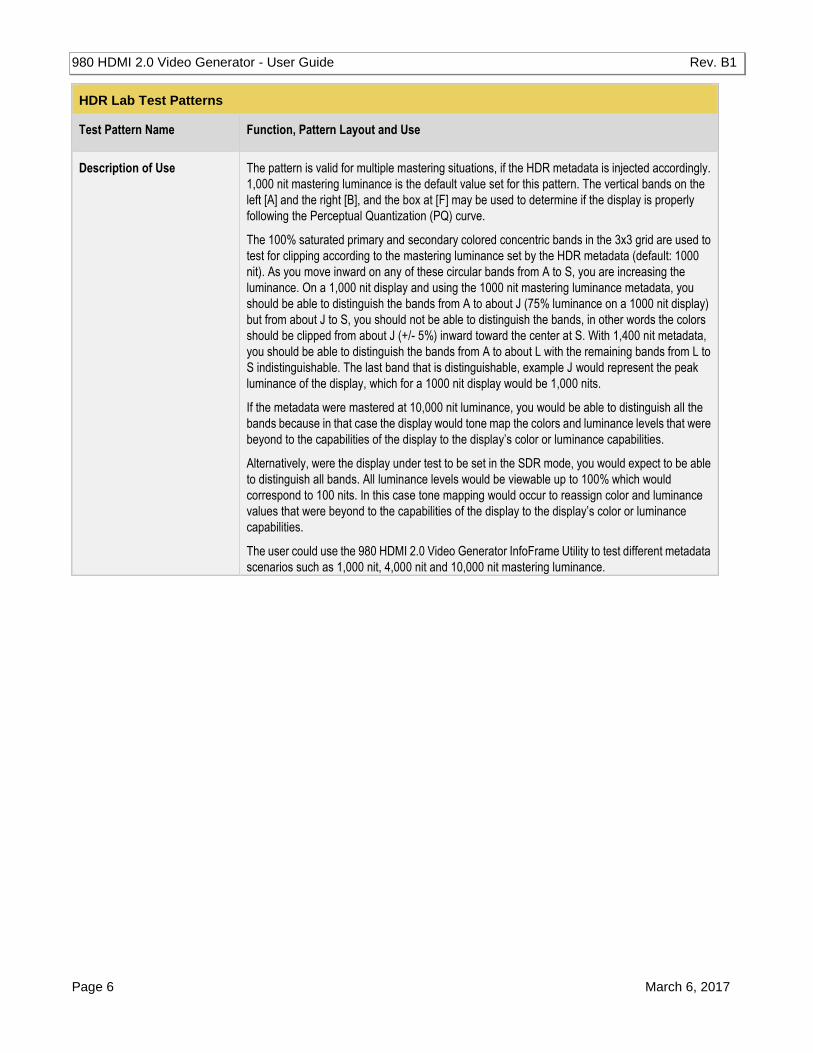
Description of Use The pattern is valid for multiple mastering situations, if the HDR metadata is injected accordingly.
1,000 nit mastering luminance is the default value set for this pattern. The vertical bands on the
left [A] and the right [B], and the box at [F] may be used to determine if the display is properly
following the Perceptual Quantization (PQ) curve.
The 100% saturated primary and secondary colored concentric bands in the 3x3 grid are used to
test for clipping according to the mastering luminance set by the HDR metadata (default: 1000
nit). As you move inward on any of these circular bands from A to S, you are increasing the
luminance. On a 1,000 nit display and using the 1000 nit mastering luminance metadata, you
should be able to distinguish the bands from A to about J (75% luminance on a 1000 nit display)
but from about J to S, you should not be able to distinguish the bands, in other words the colors
should be clipped from about J (+/- 5%) inward toward the center at S. With 1,400 nit metadata,
you should be able to distinguish the bands from A to about L with the remaining bands from L to
S indistinguishable. The last band that is distinguishable, example J would represent the peak
luminance of the display, which for a 1000 nit display would be 1,000 nits.
If the metadata were mastered at 10,000 nit luminance, you would be able to distinguish all the
bands because in that case the display would tone map the colors and luminance levels that were
beyond to the capabilities of the display to the display’s color or luminance capabilities.
Alternatively, were the display under test to be set in the SDR mode, you would expect to be able
to distinguish all bands. All luminance levels would be viewable up to 100% which would
correspond to 100 nits. In this case tone mapping would occur to reassign color and luminance
values that were beyond to the capabilities of the display to the display’s color or luminance
capabilities.
The user could use the 980 HDMI 2.0 Video Generator InfoFrame Utility to test different metadata
scenarios such as 1,000 nit, 4,000 nit and 10,000 nit mastering luminance.
980 HDMI 2.0 Video Generator - User Guide Rev. B1
Page 7 March 6, 2017
HDR Lab Test Patterns
Test Pattern Name Function, Pattern Layout and Use
Luma Resolution Test Pattern
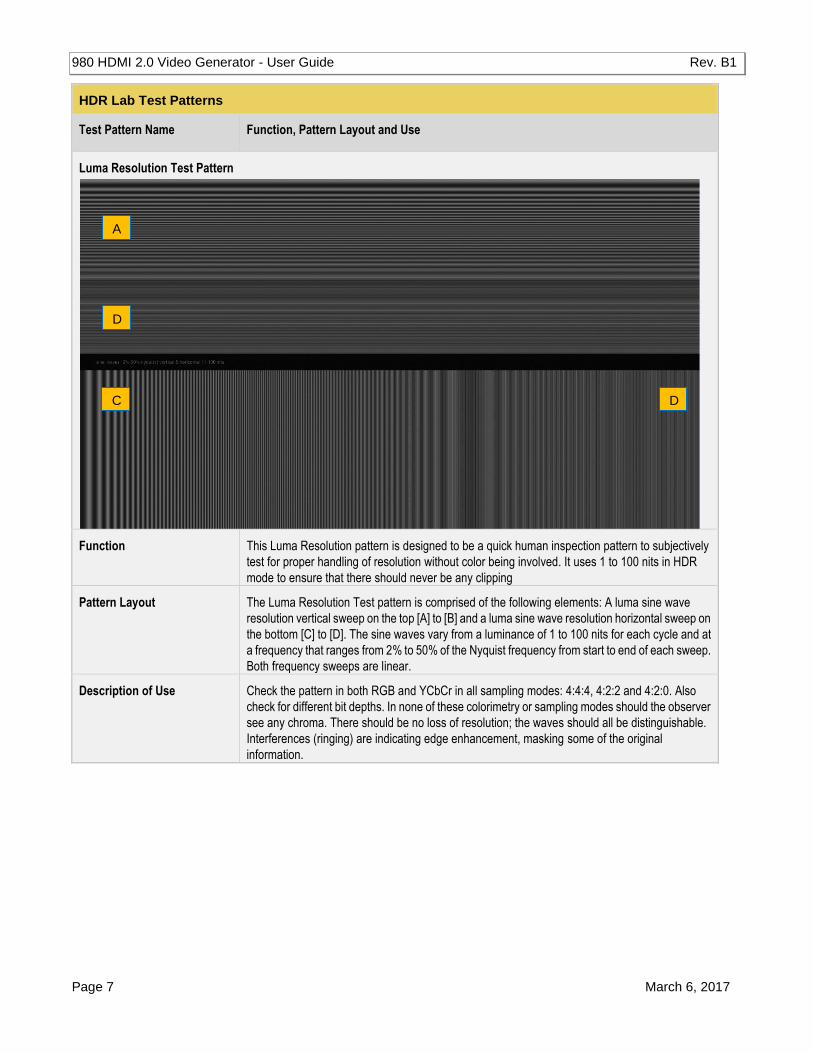
Function This Luma Resolution pattern is designed to be a quick human inspection pattern to subjectively
test for proper handling of resolution without color being involved. It uses 1 to 100 nits in HDR
mode to ensure that there should never be any clipping
Pattern Layout The Luma Resolution Test pattern is comprised of the following elements: A luma sine wave
resolution vertical sweep on the top [A] to [B] and a luma sine wave resolution horizontal sweep on
the bottom [C] to [D]. The sine waves vary from a luminance of 1 to 100 nits for each cycle and at
a frequency that ranges from 2% to 50% of the Nyquist frequency from start to end of each sweep.
Both frequency sweeps are linear.
Description of Use Check the pattern in both RGB and YCbCr in all sampling modes: 4:4:4, 4:2:2 and 4:2:0. Also
check for different bit depths. In none of these colorimetry or sampling modes should the observer
see any chroma. There should be no loss of resolution; the waves should all be distinguishable.
Interferences (ringing) are indicating edge enhancement, masking some of the original
information.
A
D
C D

980 HDMI 2.0 Video Generator - User Guide Rev. B1
Page 8 March 6, 2017
HDR Lab Test Patterns
Test Pattern Name Function, Pattern Layout and Use
Chroma Resolution Test Pattern
Function The Chroma Resolution pattern is designed to be a quick human inspection pattern to subjectively
test for proper handling of chroma resolution and chroma subsampling.
Pattern Layout The Chroma Resolution pattern is comprised of the following elements: A chroma sine wave
resolution vertical sweep on the top [A] to [B] and a chroma sine wave resolution horizontal sweep
on the bottom [C] to [D]. The sine wave’s green and magenta colors are fully saturated at their
peaks at each frequency but vary in dynamic range only up to 50% throughout each sine wave
cycle at their peak. The frequency of the sine wave sweep ranges from 2% to 25% of the Nyquist
frequency from start to end of each sweep. Both frequency sweeps are linear.
Description of Use Check the pattern in both RGB and YCbCr in all sampling modes: 4:4:4, 4:2:2 and 4:2:0. Also
check for different bit depths. In none of these colorimetry or sampling modes should the observer
see any chroma other than magenta or green or something in between. The green and magenta
at their peaks should look equally saturated. There should be no gray, black or highlighted color
between the colors nor should there be any blue or red chroma even in 4:2:2 or 4:2:0. The edges
should not be desaturated, i.e. the area between the peaks should not look grayish or black.
There should be no loss of resolution; the waves should all be distinguishable. Interferences
(ringing) are indicating edge enhancement, masking some of the original information.
A
D
C D

980 HDMI 2.0 Video Generator - User Guide Rev. B1
Page 9 March 6, 2017
HDR Lab Test Patterns
Test Pattern Name Function, Pattern Layout and Use
HDR Pluge Test Pattern
Function To assess/adjust the brightness of a display in HDR
Pattern Layout The pattern consists of a background at video black [A] with a symmetrical PLUGE on the left and
right sides [B] & [C] of the log gray scale in the middle of the pattern [D]. It is based on a pattern
used for adjusting the Brightness control in SDR displays. It has been adapted to meet the needs
of adjusting the Brightness control in the HDR mode of a UHD TV display. The outer part of the
PLUGE contains three bars: a below black bar -0.1 nit [E], 0.05 nit bar [F], 0.1 nit bar [G] on the
video black background. The gray scale in the middle represents steps of 100 nit [H], 50 nit [ I], 25
nit [J] and 12.5 nit [K]. These values were chosen based on the Perceptual Quantization (PQ)
Electro-Optical Transfer Function (EOTF) of an HDR display. There are 10 rectangles on the top
and bottom which range from 0.01 nits [L] to 0.1 nits [M] in 0.01 nit steps.
D B A C
E E F G G F H
I
J
K
L
L M
M

980 HDMI 2.0 Video Generator - User Guide Rev. B1
Page 10 March 6, 2017
HDR Lab Test Patterns
Test Pattern Name Function, Pattern Layout and Use
Description of Use The levels in this PLUGE pattern are specific to the 1,000 nit master using the PQ version of HDR.
The pattern has been designed to function the same way as the SDR version of PLUGE but at
levels specific to 1,000 nit PQ curve. This particular pattern is not correct for use in the SDR mode
of a display.
The PLUGE is on both sides of the center to provide a greater opportunity to set black taking
image uniformity and viewing angle into account when setting the brightness control. There are
two above black steps [F] [G] in the PLUGE, one really close to black and the other a little further
above it. The step below black may or may not be visible depending on where the individual set
clips black.
The HDR-10 system we are using assumes nothing useful in picture information will go below
black. Some sets will accommodate the below black portion of this signal just to make it easier to
properly set the Brightness control. Others won’t and there will be nothing lost in the picture if the
set clips everything below black.
Turn the brightness control up far enough so the strip just above black [G] is clearly visible. Turn
the control down to the point where the just above black stripe disappears into the black
background. Raise the Brightness control just enough for the strip to reappear. This is the correct
setting for black.
If the below black stripe is visible when the Brightness control is turned up, turn the control back
down to the point where the below black [E] stripe disappears into the background with the just
above black strip still being visible.
The pattern has a low average picture level (APL). As much as white levels may change in the
HDR mode depending on APL black level should remain fixed.
In some displays you’ll never actually reach black, an absence of light. What you reach is a digital
cut-off, a point where information in the video signal is no longer displayed. Any information in the
signal above black will be displayed, even if it looks slightly washed out because the set can’t
make an absence of light.
The center grayscale [D] allows for a quick determination of the color of gray. Many calibrators
use this pattern as a reference for quickly adjusting a grayscale as it allows one to see what is
happening to the entire gray scale as adjustments are being made.
980 HDMI 2.0 Video Generator - User Guide Rev. B1
Page 11 March 6, 2017
HDR Lab Test Patterns
Test Pattern Name Function, Pattern Layout and Use
Reverse Ramp Test Pattern
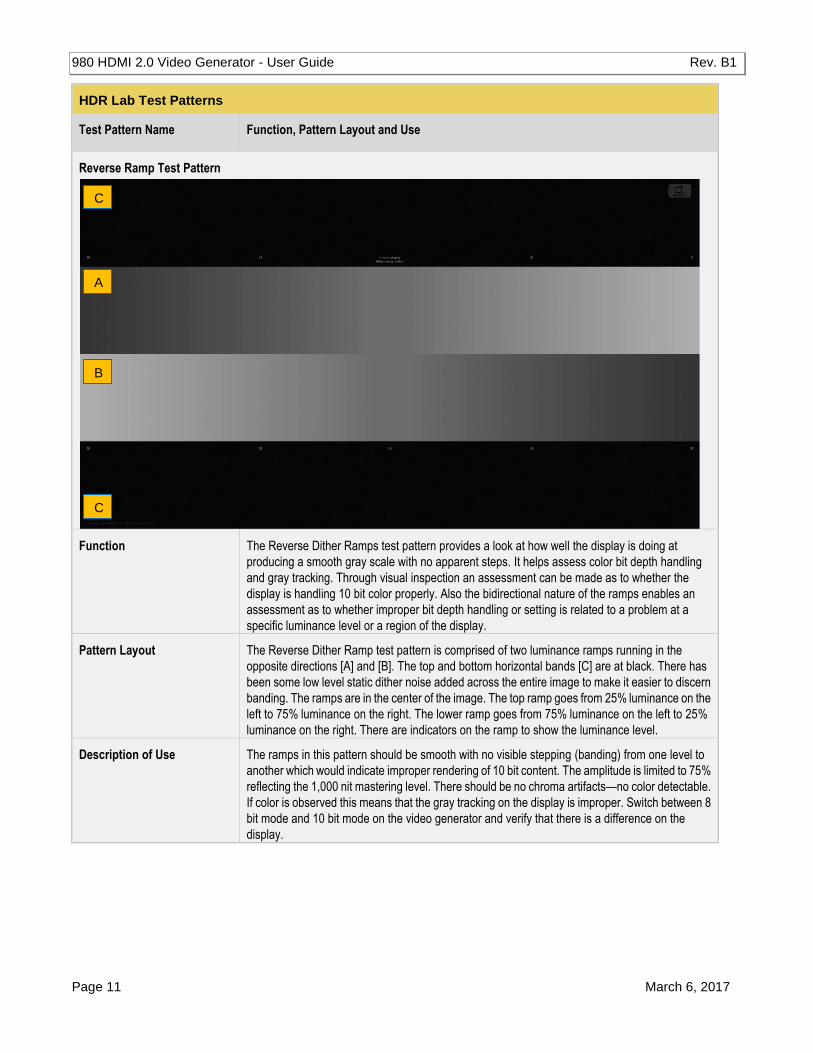
Function The Reverse Dither Ramps test pattern provides a look at how well the display is doing at
producing a smooth gray scale with no apparent steps. It helps assess color bit depth handling
and gray tracking. Through visual inspection an assessment can be made as to whether the
display is handling 10 bit color properly. Also the bidirectional nature of the ramps enables an
assessment as to whether improper bit depth handling or setting is related to a problem at a
specific luminance level or a region of the display.
Pattern Layout The Reverse Dither Ramp test pattern is comprised of two luminance ramps running in the
opposite directions [A] and [B]. The top and bottom horizontal bands [C] are at black. There has
been some low level static dither noise added across the entire image to make it easier to discern
banding. The ramps are in the center of the image. The top ramp goes from 25% luminance on the
left to 75% luminance on the right. The lower ramp goes from 75% luminance on the left to 25%
luminance on the right. There are indicators on the ramp to show the luminance level.
Description of Use The ramps in this pattern should be smooth with no visible stepping (banding) from one level to
another which would indicate improper rendering of 10 bit content. The amplitude is limited to 75%
reflecting the 1,000 nit mastering level. There should be no chroma artifacts—no color detectable.
If color is observed this means that the gray tracking on the display is improper. Switch between 8
bit mode and 10 bit mode on the video generator and verify that there is a difference on the
display.
C
C
B
A
980 HDMI 2.0 Video Generator - User Guide Rev. B1
Page 12 March 6, 2017
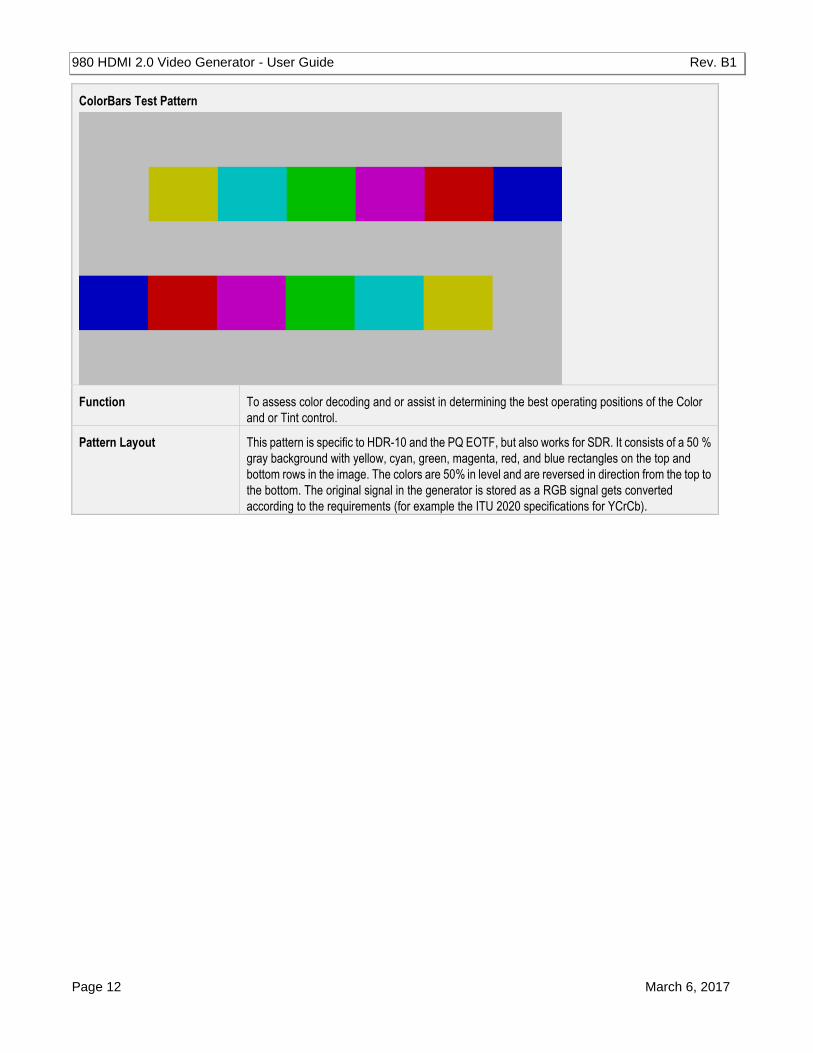
ColorBars Test Pattern
Function To assess color decoding and or assist in determining the best operating positions of the Color
and or Tint control.
Pattern Layout This pattern is specific to HDR-10 and the PQ EOTF, but also works for SDR. It consists of a 50 %
gray background with yellow, cyan, green, magenta, red, and blue rectangles on the top and
bottom rows in the image. The colors are 50% in level and are reversed in direction from the top to
the bottom. The original signal in the generator is stored as a RGB signal gets converted
according to the requirements (for example the ITU 2020 specifications for YCrCb).
980 HDMI 2.0 Video Generator - User Guide Rev. B1
Page 13 March 6, 2017
Description of Use This pattern was designed to better serve the function of checking and adjusting color decoding in
all component video systems. Its larger area of reference gray makes it much easier to use,
especially when dealing with user menu graphics that often cover just the area you want to see in
the conventional color bar pattern. This pattern is particularly useful when trying to evaluate the
conditions of the green and red channels after levels have been properly set while looking at the
blue channel.
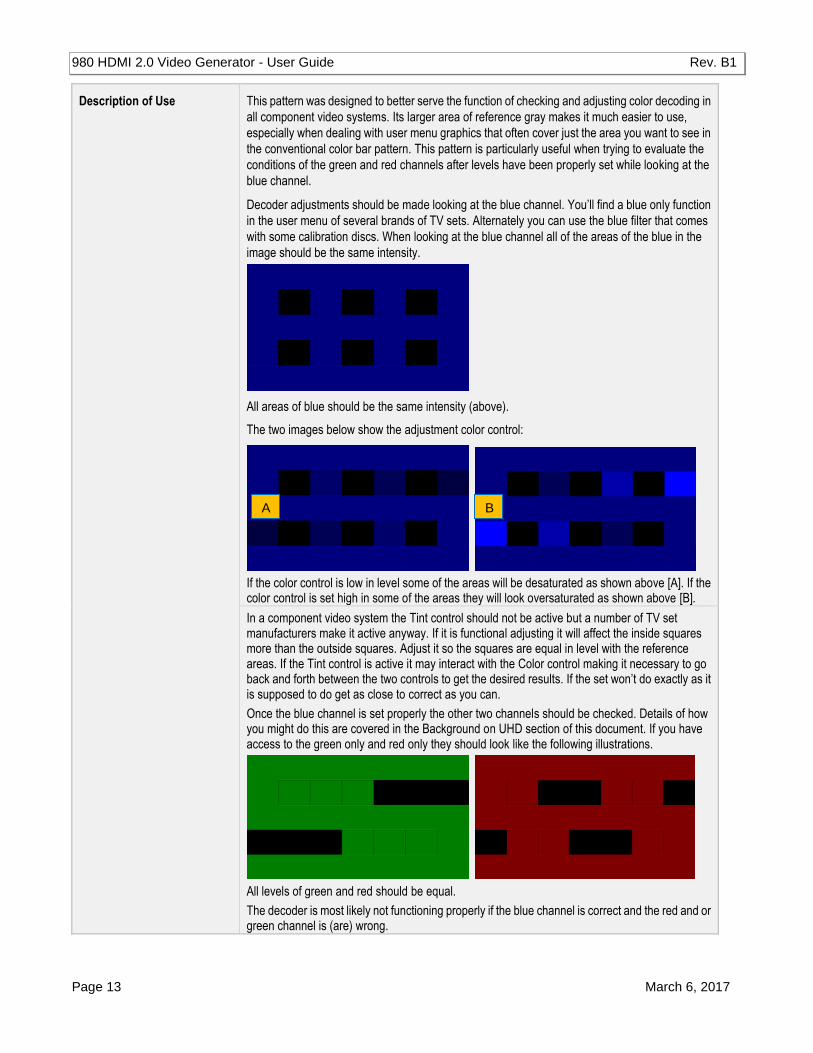
Decoder adjustments should be made looking at the blue channel. You’ll find a blue only function
in the user menu of several brands of TV sets. Alternately you can use the blue filter that comes
with some calibration discs. When looking at the blue channel all of the areas of the blue in the
image should be the same intensity.
All areas of blue should be the same intensity (above).
The two images below show the adjustment color control:
If the color control is low in level some of the areas will be desaturated as shown above [A]. If the color control is set high in some of the areas they will look oversaturated as shown above [B].
In a component video system the Tint control should not be active but a number of TV set manufacturers make it active anyway. If it is functional adjusting it will affect the inside squares more than the outside squares. Adjust it so the squares are equal in level with the reference areas. If the Tint control is active it may interact with the Color control making it necessary to go back and forth between the two controls to get the desired results. If the set won’t do exactly as it is supposed to do get as close to correct as you can.
Once the blue channel is set properly the other two channels should be checked. Details of how you might do this are covered in the Background on UHD section of this document. If you have access to the green only and red only they should look like the following illustrations.
All levels of green and red should be equal.
The decoder is most likely not functioning properly if the blue channel is correct and the red and or green channel is (are) wrong.
A B
980 HDMI 2.0 Video Generator - User Guide Rev. B1
Page 14 March 6, 2017
HDR Lab Reference Images
Reference Image Name Function, Pattern Layout and Use
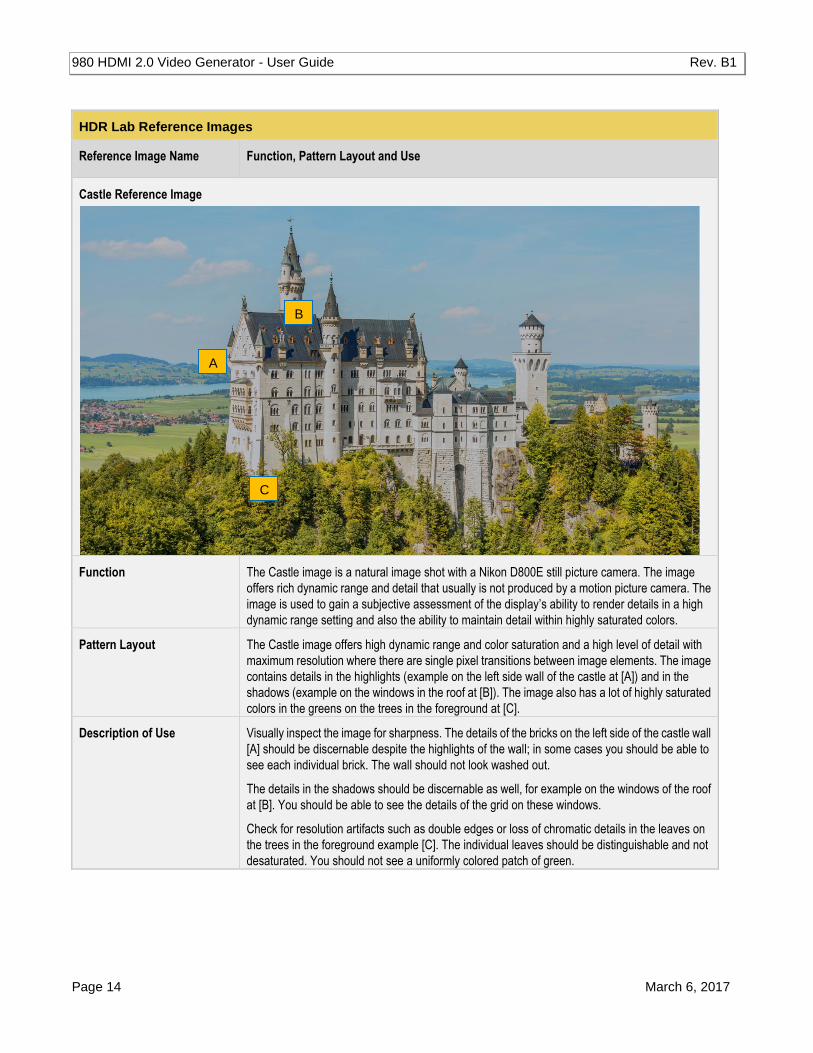
Castle Reference Image
Function The Castle image is a natural image shot with a Nikon D800E still picture camera. The image
offers rich dynamic range and detail that usually is not produced by a motion picture camera. The
image is used to gain a subjective assessment of the display’s ability to render details in a high
dynamic range setting and also the ability to maintain detail within highly saturated colors.
Pattern Layout The Castle image offers high dynamic range and color saturation and a high level of detail with
maximum resolution where there are single pixel transitions between image elements. The image
contains details in the highlights (example on the left side wall of the castle at [A]) and in the
shadows (example on the windows in the roof at [B]). The image also has a lot of highly saturated
colors in the greens on the trees in the foreground at [C].
Description of Use Visually inspect the image for sharpness. The details of the bricks on the left side of the castle wall
[A] should be discernable despite the highlights of the wall; in some cases you should be able to
see each individual brick. The wall should not look washed out.
The details in the shadows should be discernable as well, for example on the windows of the roof
at [B]. You should be able to see the details of the grid on these windows.
Check for resolution artifacts such as double edges or loss of chromatic details in the leaves on
the trees in the foreground example [C]. The individual leaves should be distinguishable and not
desaturated. You should not see a uniformly colored patch of green.
A
B
C
980 HDMI 2.0 Video Generator - User Guide Rev. B1
Page 15 March 6, 2017
HDR Lab Reference Images
Reference Image Name Function, Pattern Layout and Use
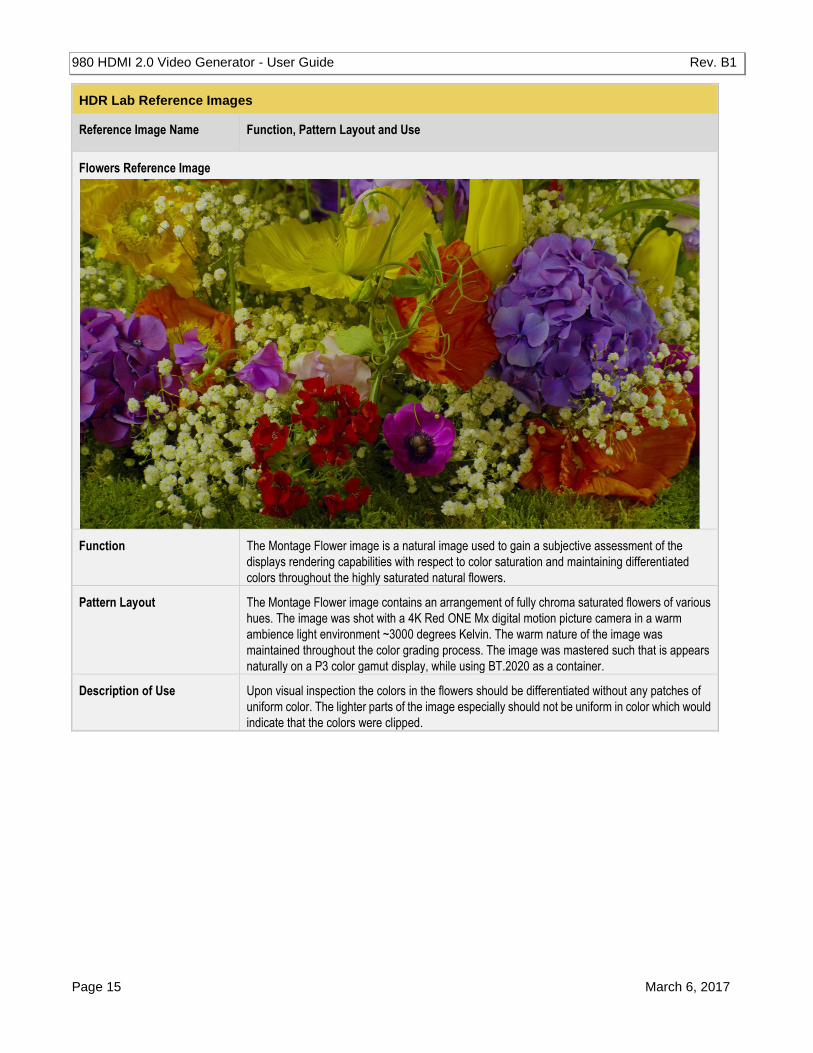
Flowers Reference Image
Function The Montage Flower image is a natural image used to gain a subjective assessment of the
displays rendering capabilities with respect to color saturation and maintaining differentiated
colors throughout the highly saturated natural flowers.
Pattern Layout The Montage Flower image contains an arrangement of fully chroma saturated flowers of various
hues. The image was shot with a 4K Red ONE Mx digital motion picture camera in a warm
ambience light environment ~3000 degrees Kelvin. The warm nature of the image was
maintained throughout the color grading process. The image was mastered such that is appears
naturally on a P3 color gamut display, while using BT.2020 as a container.
Description of Use Upon visual inspection the colors in the flowers should be differentiated without any patches of
uniform color. The lighter parts of the image especially should not be uniform in color which would
indicate that the colors were clipped.
980 HDMI 2.0 Video Generator - User Guide Rev. B1
Page 16 March 6, 2017
HDR Lab Reference Images
Reference Image Name Function, Pattern Layout and Use
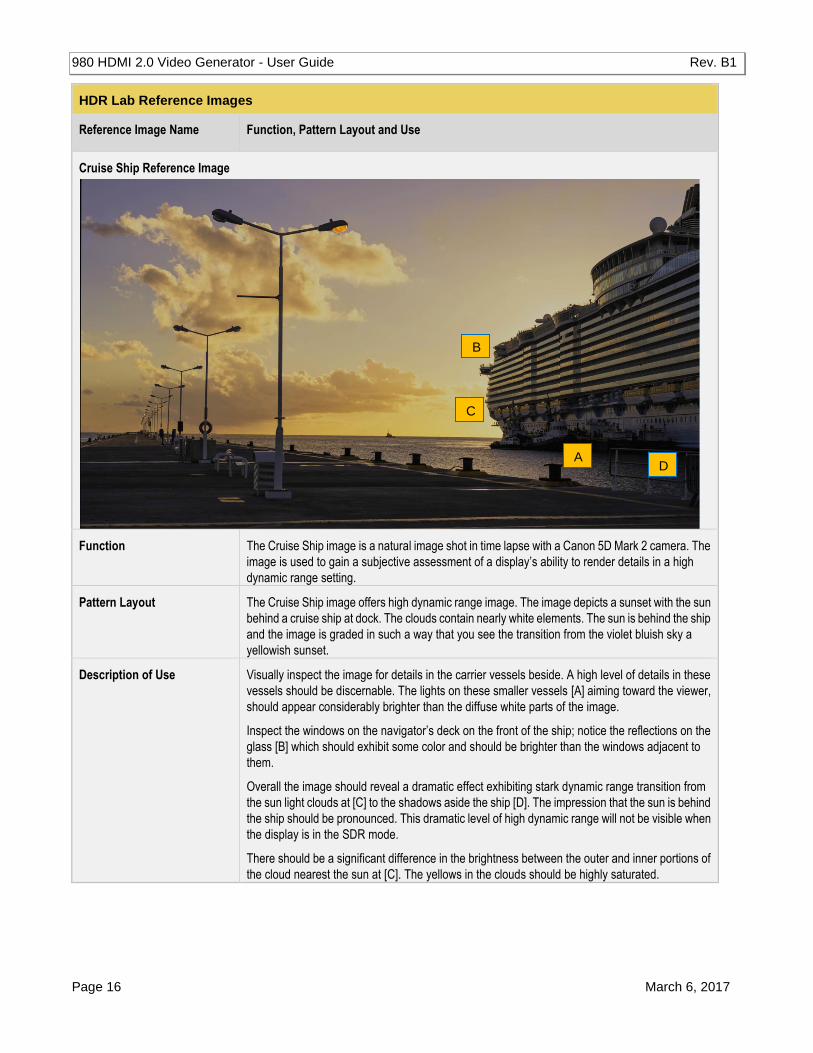
Cruise Ship Reference Image
Function The Cruise Ship image is a natural image shot in time lapse with a Canon 5D Mark 2 camera. The
image is used to gain a subjective assessment of a display’s ability to render details in a high
dynamic range setting.
Pattern Layout The Cruise Ship image offers high dynamic range image. The image depicts a sunset with the sun
behind a cruise ship at dock. The clouds contain nearly white elements. The sun is behind the ship
and the image is graded in such a way that you see the transition from the violet bluish sky a
yellowish sunset.
Description of Use Visually inspect the image for details in the carrier vessels beside. A high level of details in these
vessels should be discernable. The lights on these smaller vessels [A] aiming toward the viewer,
should appear considerably brighter than the diffuse white parts of the image.
Inspect the windows on the navigator’s deck on the front of the ship; notice the reflections on the
glass [B] which should exhibit some color and should be brighter than the windows adjacent to
them.
Overall the image should reveal a dramatic effect exhibiting stark dynamic range transition from
the sun light clouds at [C] to the shadows aside the ship [D]. The impression that the sun is behind
the ship should be pronounced. This dramatic level of high dynamic range will not be visible when
the display is in the SDR mode.
There should be a significant difference in the brightness between the outer and inner portions of
the cloud nearest the sun at [C]. The yellows in the clouds should be highly saturated.
A
B
C
D
980 HDMI 2.0 Video Generator - User Guide Rev. B1
Page 17 March 6, 2017
HDR Lab Reference Images
Reference Image Name Function, Pattern Layout and Use
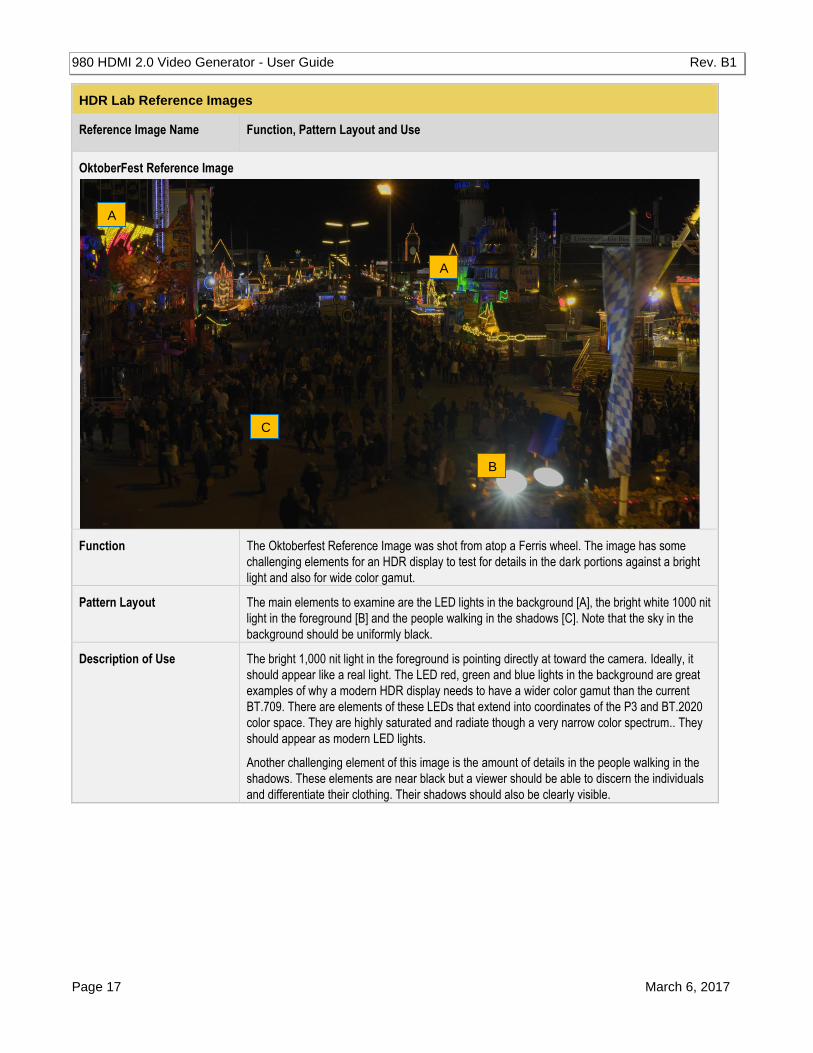
OktoberFest Reference Image
Function The Oktoberfest Reference Image was shot from atop a Ferris wheel. The image has some
challenging elements for an HDR display to test for details in the dark portions against a bright
light and also for wide color gamut.
Pattern Layout The main elements to examine are the LED lights in the background [A], the bright white 1000 nit
light in the foreground [B] and the people walking in the shadows [C]. Note that the sky in the
background should be uniformly black.
Description of Use The bright 1,000 nit light in the foreground is pointing directly at toward the camera. Ideally, it
should appear like a real light. The LED red, green and blue lights in the background are great
examples of why a modern HDR display needs to have a wider color gamut than the current
BT.709. There are elements of these LEDs that extend into coordinates of the P3 and BT.2020
color space. They are highly saturated and radiate though a very narrow color spectrum.. They
should appear as modern LED lights.
Another challenging element of this image is the amount of details in the people walking in the
shadows. These elements are near black but a viewer should be able to discern the individuals
and differentiate their clothing. Their shadows should also be clearly visible.
A
A
B
C
980 HDMI 2.0 Video Generator - User Guide Rev. B1
Page 18 March 6, 2017
HDR Lab Reference Images
Reference Image Name Function, Pattern Layout and Use
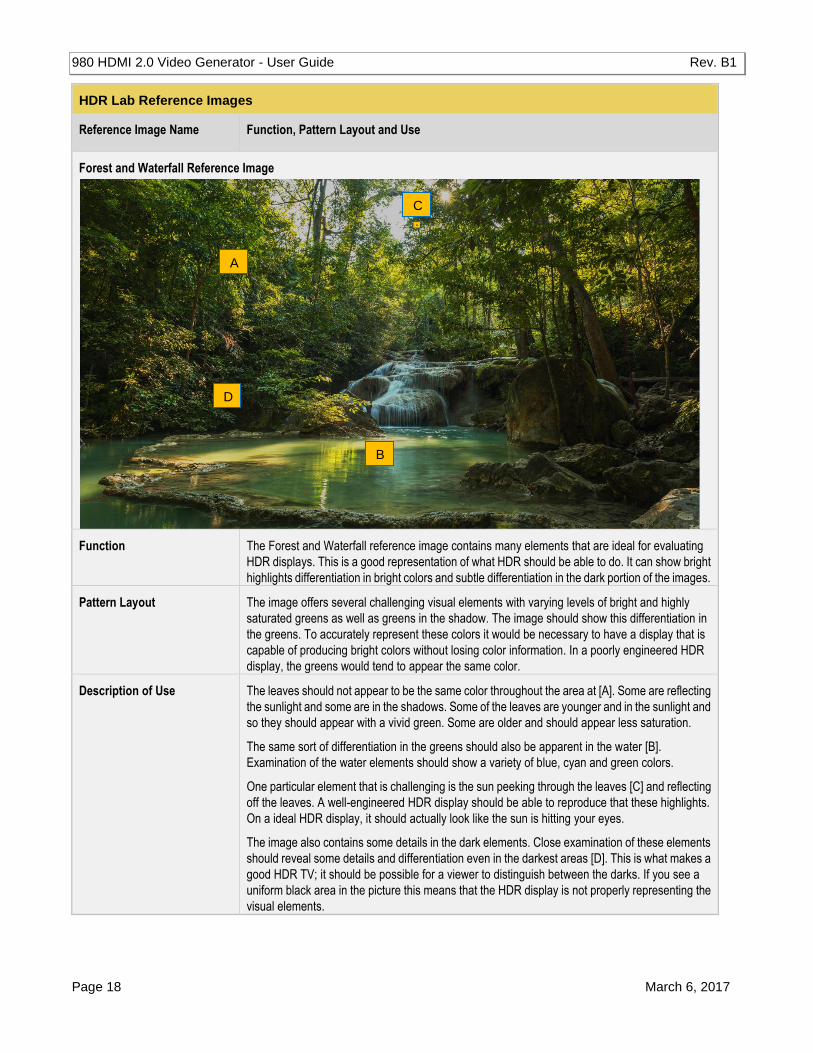
Forest and Waterfall Reference Image
Function The Forest and Waterfall reference image contains many elements that are ideal for evaluating
HDR displays. This is a good representation of what HDR should be able to do. It can show bright
highlights differentiation in bright colors and subtle differentiation in the dark portion of the images.
Pattern Layout The image offers several challenging visual elements with varying levels of bright and highly
saturated greens as well as greens in the shadow. The image should show this differentiation in
the greens. To accurately represent these colors it would be necessary to have a display that is
capable of producing bright colors without losing color information. In a poorly engineered HDR
display, the greens would tend to appear the same color.
Description of Use The leaves should not appear to be the same color throughout the area at [A]. Some are reflecting
the sunlight and some are in the shadows. Some of the leaves are younger and in the sunlight and
so they should appear with a vivid green. Some are older and should appear less saturation.
The same sort of differentiation in the greens should also be apparent in the water [B].
Examination of the water elements should show a variety of blue, cyan and green colors.
One particular element that is challenging is the sun peeking through the leaves [C] and reflecting
off the leaves. A well-engineered HDR display should be able to reproduce that these highlights.
On a ideal HDR display, it should actually look like the sun is hitting your eyes.
The image also contains some details in the dark elements. Close examination of these elements
should reveal some details and differentiation even in the darkest areas [D]. This is what makes a
good HDR TV; it should be possible for a viewer to distinguish between the darks. If you see a
uniform black area in the picture this means that the HDR display is not properly representing the
visual elements.
C B
B
A
D
980 HDMI 2.0 Video Generator - User Guide Rev. B1
Page 19 March 6, 2017
HDR Lab Reference Images
Reference Image Name Function, Pattern Layout and Use
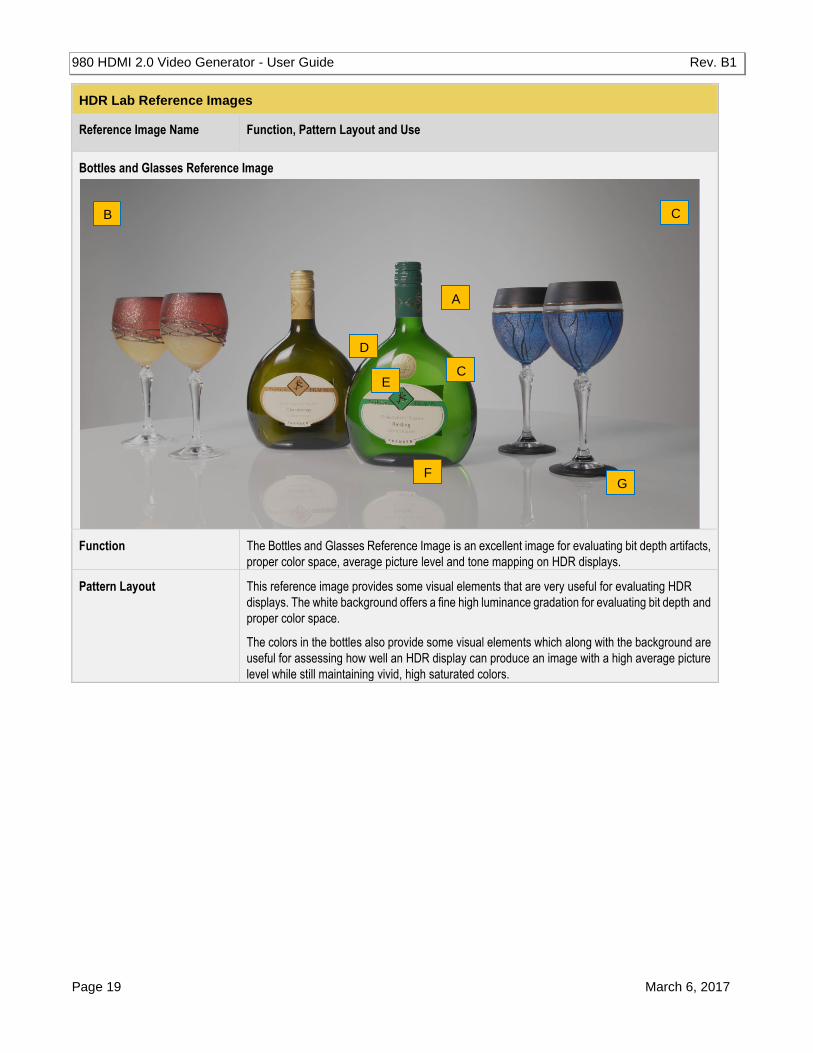
Bottles and Glasses Reference Image
Function The Bottles and Glasses Reference Image is an excellent image for evaluating bit depth artifacts,
proper color space, average picture level and tone mapping on HDR displays.
Pattern Layout This reference image provides some visual elements that are very useful for evaluating HDR
displays. The white background offers a fine high luminance gradation for evaluating bit depth and
proper color space.
The colors in the bottles also provide some visual elements which along with the background are
useful for assessing how well an HDR display can produce an image with a high average picture
level while still maintaining vivid, high saturated colors.
A
B C
C
D
E
F G
980 HDMI 2.0 Video Generator - User Guide Rev. B1
Page 20 March 6, 2017
HDR Lab Reference Images
Reference Image Name Function, Pattern Layout and Use
Description of Use Examine the light background behind the bottles and glasses in the foreground. The background
should be a smooth gradation from the brightest portion in the center [A] to the slightly darker
areas on the edges [B]. There should be no discernable steps or banding. If there is any banding
that is an indication that the display is not handling the color depth properly. Also there should be
no chromatic elements apparent in the background. An appearance of greenish or reddish
chroma elements in the background would be an indication that the wrong color space standard is
being used. For example: If the display would decode YCbCr following the BT.709 matrix
coefficients, while the generator created it with BT.2020 matrix coefficients.
Examine the bottles. The green [C] on the bottle should pop out; some of the elements should be
vivid, highly saturated green. The transitions in the color should look natural with no stark
changes. If the colors do not appear highly saturated this would be indication that the HDR display
cannot produce an image with a high average picture level and still produce saturated colors.
The brightness of the specular highlight on the bottle [D] should be significantly brighter than the
white background [A]. The reflections should not appear as diffuse light. If there is not a significant
difference between the reflections and the diffuse background, then this is a sign that the display
is doing aggressive tone mapping.
The round label on the green bottle at [E] has some structural elements. These structural
elements should be readily discernable.
The bottom of the glasses at [F] and the bottom of the bottle at [G] are near dark but they should
not appear as being completely black. They should appear as a gradation.
980 HDMI 2.0 Video Generator - User Guide Rev. B1
Page 21 March 6, 2017
HDR Lab Reference Images
Reference Image Name Function, Pattern Layout and Use
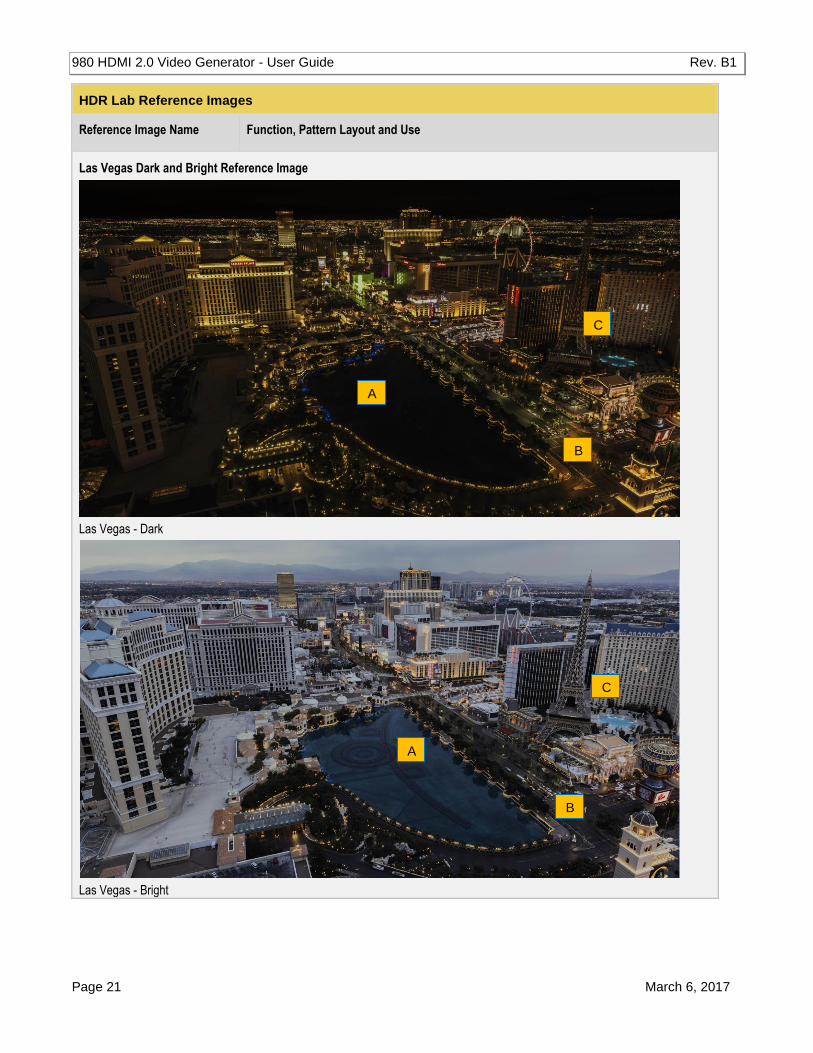
Las Vegas Dark and Bright Reference Image
Las Vegas - Dark
Las Vegas - Bright
A
A
B
B
C
C
980 HDMI 2.0 Video Generator - User Guide Rev. B1
Page 22 March 6, 2017
HDR Lab Reference Images
Reference Image Name Function, Pattern Layout and Use
Function This pair of images is good for evaluating how OLEDs and LCDs handle highlights in differing
Average Picture Levels of brightness. The set of image is also useful for testing projection
system’s ability to reproduce black levels or contrast. The pair of images presents different
challenges for OLED HDR TVs vs LCD HDR TVs because the highlights remain the same
intensity of light but the ambient light changes dramatically. The Las Vegas Dark image starts off
with a very low Average Picture Level (APL) and the Las Vegas Bright Image has a much higher
APL which is challenging an APL dependent TV. Some HDR TVs can produce bright highlights
when the whole scene is dark but they cannot produce these bright highlights when the scene is
getting brighter. As a result some TVs would look less rich in contrast.
Pattern Layout There are two images of the Las Vegas Strip taking from the Cosmopolitan hotel using time lapse
photography. The Las Vegas Dark image was taken in the middle of the night. The Las Vegas
Bright image was taken in the early morning hours.
Description of Use Images with high Average Picture Level are sometimes difficult to reproduce with current OLED
TVs. This technology will result in a loss of contrast where an image has highlights with a high
APL. Therefore the Las Vegas Bright image is challenging for OLEDs.
Images with a low Average Picture Level are sometimes difficult to reproduce with LCD TVs.
When subjectively evaluating these images, you should look out for good differentiation in the
darkest parts of the image, like the underlying structure in the water in the center of the image [A].
Cars on the street [B] should be individually distinguishable while still providing texture.
The individual letters of the Eiffel tower restaurant [C] advertising should be perfectly sharp and
separated. In some of these letters, you should be able to see single pixel transitions, where one
pixel is white and the next is nearly black.
The street lights and hotel lighting should appear like realistic lights, adding depth to the scene.
The image with the higher APL should reveal many more details of the area, while maintaining the
intensity of lights in a realistic way, still reasonably differentiated from the background.
980 HDMI 2.0 Video Generator - User Guide Rev. B1
Page 23 March 6, 2017
HDR Lab Reference Images
Reference Image Name Function, Pattern Layout and Use
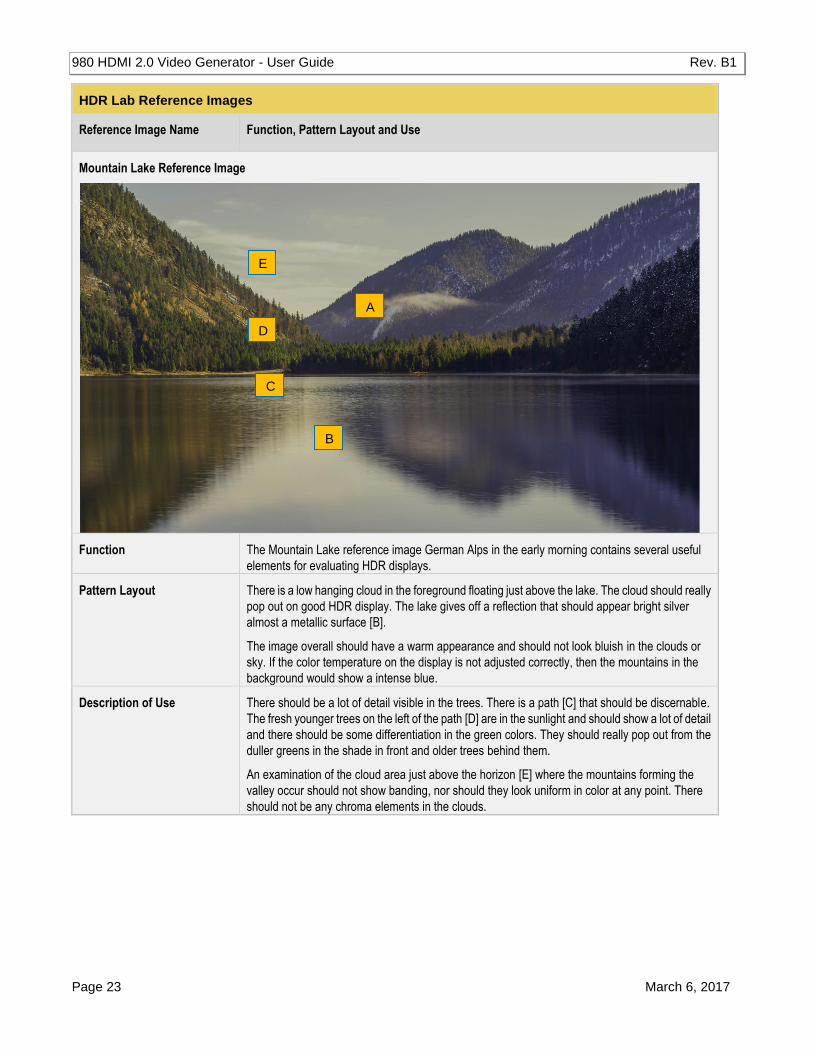
Mountain Lake Reference Image
Function The Mountain Lake reference image German Alps in the early morning contains several useful
elements for evaluating HDR displays.
Pattern Layout There is a low hanging cloud in the foreground floating just above the lake. The cloud should really
pop out on good HDR display. The lake gives off a reflection that should appear bright silver
almost a metallic surface [B].
The image overall should have a warm appearance and should not look bluish in the clouds or
sky. If the color temperature on the display is not adjusted correctly, then the mountains in the
background would show a intense blue.
Description of Use There should be a lot of detail visible in the trees. There is a path [C] that should be discernable.
The fresh younger trees on the left of the path [D] are in the sunlight and should show a lot of detail
and there should be some differentiation in the green colors. They should really pop out from the
duller greens in the shade in front and older trees behind them.
An examination of the cloud area just above the horizon [E] where the mountains forming the
valley occur should not show banding, nor should they look uniform in color at any point. There
should not be any chroma elements in the clouds.
A
B
C
D
E
980 HDMI 2.0 Video Generator - User Guide Rev. B1
Page 24 March 6, 2017
HDR Lab Reference Images
Reference Image Name Function, Pattern Layout and Use
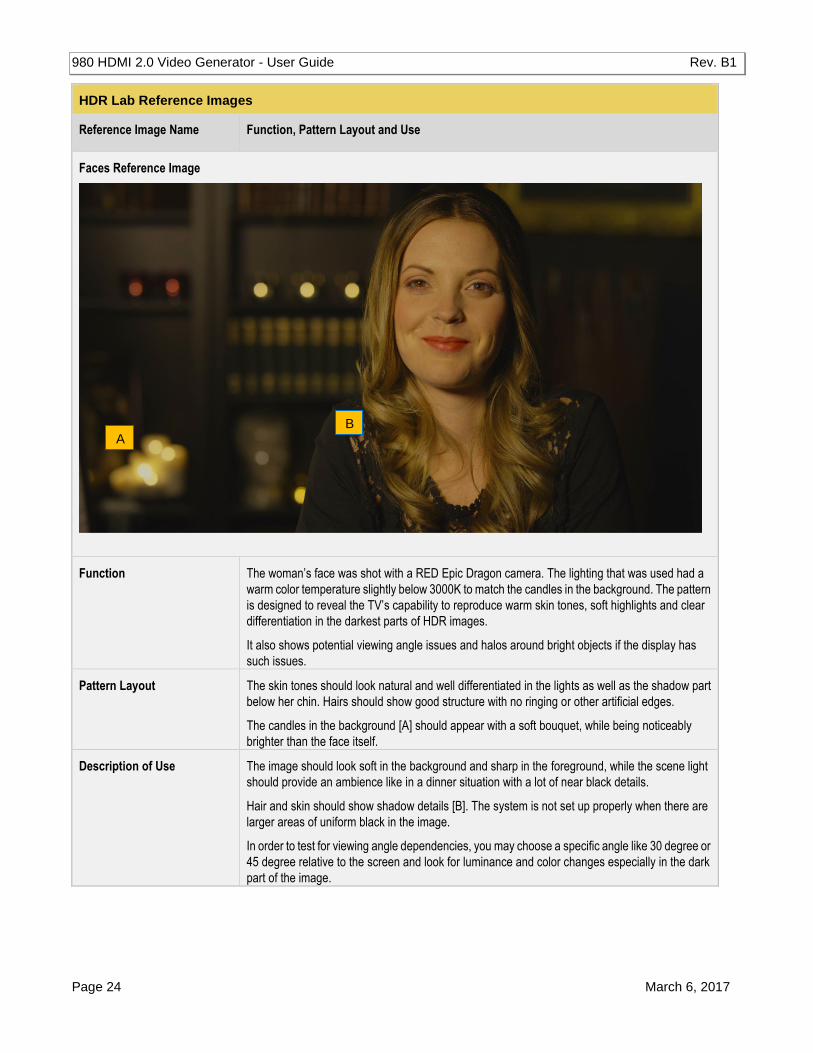
Faces Reference Image
Function The woman’s face was shot with a RED Epic Dragon camera. The lighting that was used had a
warm color temperature slightly below 3000K to match the candles in the background. The pattern
is designed to reveal the TV’s capability to reproduce warm skin tones, soft highlights and clear
differentiation in the darkest parts of HDR images.
It also shows potential viewing angle issues and halos around bright objects if the display has
such issues.
Pattern Layout The skin tones should look natural and well differentiated in the lights as well as the shadow part
below her chin. Hairs should show good structure with no ringing or other artificial edges.
The candles in the background [A] should appear with a soft bouquet, while being noticeably
brighter than the face itself.
Description of Use The image should look soft in the background and sharp in the foreground, while the scene light
should provide an ambience like in a dinner situation with a lot of near black details.
Hair and skin should show shadow details [B]. The system is not set up properly when there are
larger areas of uniform black in the image.
In order to test for viewing angle dependencies, you may choose a specific angle like 30 degree or
45 degree relative to the screen and look for luminance and color changes especially in the dark
part of the image.
A B