a 5.1 : land utilisation particulars (area in lakh … economic...a 5.1 : land utilisation...
TRANSCRIPT

A 5.1 : Land Utilisation Particulars (Area in Lakh Hectares)
Year ForestBarren &
Uncultivable Land
Land put to Non
Agricultural Uses
Permanent pastures and other Grazing
Lands
Misc.Tree crops and Groves not included in Net Area
Sown
Culturable Waste
Other Fallow Lands
Current Fallow
Net Area Sown
Geograp- hical Area
1 2 3 4 5 6 7 8 9 10 111955-56 56.62 29.32 13.51 11.71 2.55 16.67 6.99 19.57 112.91 269.851956-57 55.55 25.87 15.24 12.36 2.33 18.13 8.06 17.85 113.73 269.121957-58 58.99 26.33 15.64 12.31 2.80 18.52 8.87 20.07 110.14 273.671958-59 59.54 23.87 16.48 12.32 2.84 18.32 9.07 21.23 110.50 274.171959-60 59.14 23.32 17.01 12.34 2.75 17.57 9.68 22.27 108.89 272.971960-61 58.47 23.59 18.31 12.04 2.93 16.27 8.96 24.56 107.84 272.971961-62 59.53 23.53 17.69 11.91 2.90 15.70 8.80 21.78 112.91 274.751962-63 61.17 21.58 18.69 11.29 2.74 14.23 8.04 20.57 116.44 274.751963-64 61.17 21.35 19.46 11.67 2.87 13.95 8.11 22.12 114.05 274.751964-65 61.17 21.24 19.42 11.65 2.83 13.92 8.11 21.56 114.85 274.751965-66 61.17 21.21 19.70 11.69 3.11 14.20 9.42 24.30 109.95 274.751966-67 61.17 20.83 20.56 11.57 3.05 13.74 8.66 21.74 113.43 274.751967-68 61.17 20.92 20.66 11.60 3.08 13.73 8.61 21.30 113.68 274.751968-69 61.17 21.27 21.15 11.57 3.09 13.32 9.18 24.82 109.18 274.751969-70 65.09 20.53 20.82 11.52 3.23 12.22 9.10 16.78 115.11 274.401970-71 63.37 21.01 21.22 10.79 2.97 11.16 8.83 17.71 117.34 274.401971-72 62.40 23.12 20.87 10.28 2.74 10.42 8.55 23.33 112.69 274.401972-73 62.95 23.47 20.85 9.76 2.84 10.90 10.50 22.36 110.77 274.401973-74 63.07 23.30 20.60 9.89 2.74 10.56 9.96 17.92 116.36 274.401974-75 63.59 22.47 20.62 9.74 2.86 10.55 9.81 19.84 114.92 274.401975-76 63.60 22.45 20.70 9.64 2.74 9.55 11.51 22.48 111.73 274.401976-77 63.82 22.87 21.04 9.72 2.74 9.56 12.16 26.47 106.02 274.401977-78 62.31 23.37 21.27 9.54 2.65 9.08 10.75 26.25 109.18 274.401978-79 62.22 23.49 21.34 9.48 2.63 8.88 10.53 22.34 113.49 274.401979-80 62.35 23.43 21.49 9.48 2.76 8.83 13.78 26.96 105.32 274.401980-81 62.12 23.40 21.68 9.28 2.69 8.71 13.51 25.63 107.38 274.401981-82 61.61 23.01 21.84 9.24 2.72 8.89 13.19 20.65 113.25 274.401982-83 61.72 22.96 22.16 8.99 2.72 9.01 14.70 21.80 110.34 274.401983-84 62.00 22.98 22.17 9.01 2.76 8.94 13.79 18.40 114.35 274.401984-85 58.36 22.97 22.36 8.95 2.71 8.70 13.85 31.64 104.86 274.401985-86 58.35 22.69 22.48 8.81 2.64 8.65 14.92 31.59 104.27 274.401986-87 58.36 22.69 22.60 8.81 2.64 8.64 14.96 35.23 100.47 274.401987-88 58.36 22.69 22.60 8.81 2.64 8.64 14.51 31.41 104.74 274.401988-89 58.36 22.59 22.78 8.81 2.70 8.47 14.28 26.30 110.11 274.401989-90 62.40 21.44 22.91 8.46 2.68 7.92 13.38 24.27 110.94 274.401990-91 62.68 20.96 23.07 8.43 2.62 7.80 13.78 24.84 110.22 274.401991-92 62.81 20.73 23.52 8.31 2.63 7.66 13.66 24.68 110.40 274.401992-93 62.81 20.58 24.27 8.20 2.58 7.74 14.74 28.82 104.66 274.401993-94 62.46 20.91 24.74 7.79 2.53 7.93 15.67 28.75 103.62 274.401994-95 62.45 20.70 25.00 7.63 2.47 7.79 17.45 27.26 103.65 274.401995-96 61.49 21.46 24.34 7.47 2.36 7.84 16.95 25.38 107.11 274.401996-97 62.45 20.83 24.72 7.63 2.47 7.22 15.47 24..43 109.18 274.401997-98 61.99 21.09 24.96 6.93 2.46 7.52 16.20 33.92 99.33 274.401998-99 61.99 21.09 24.96 6.86 2.41 7.74 15.28 23.33 110.74 274.401999-00 61.99 21.06 25.12 6.82 2.42 7.81 14.52 27.61 107.05 274.402000-01 61.99 21.00 25.19 6.75 2.69 7.28 14.17 23.12 112.21 274.402001-02 61.99 20.84 25.50 6.76 2.77 7.00 14.21 30.08 105.25 274.402002-03 61.99 20.84 25.88 6.76 2.77 7.00 16.79 35.07 97.30 274.402003-04 61.99 20.84 25.96 6.76 2.77 7.00 16.58 30.36 102.14 274.402004-05 61.99 20.84 26.08 6.76 2.78 6.94 16.51 28.19 104.31 274.402005-06 61.99 20.84 26.15 6.76 2.78 6.92 16.23 24.34 108.39 274.402006-07 62.10 20.98 25.91 6.02 3.20 6.95 15.83 31.66 102.39 275.042007-08 62.10 20.59 26.37 5.71 3.06 6.59 15.00 27.19 108.43 275.042008-09 62.10 20.55 26.52 5.69 2.98 6.50 14.88 26.24 109.58 275.042009-10 62.10 20.43 26.72 5.66 2.95 6.47 16.26 33.60 100.85 275.042010-11 62.30 20.26 27.71 5.54 2.90 6.26 14.90 22.29 112.88 275.042011-12 62.30 20.24 28.03 5.52 2.89 6.14 15.59 22.73 111.60 275.04
Source: Directorate of Economics and Statistics, Govt. of AP, Hyderabad.
280

A 5.2 : Season wise and Region wise Rainfall (Rainfall in mm.)
Sl. No. Year
South-West Monsoon North-East Monsoon
(June to September ) (October to December)
Coastal Andhra Rayalaseema Telangana Andhra
PradeshCoastal Andhra Rayalaseema Telangana Andhra
Pradesh
NORMAL 603 378 764 634 318 224 98 206
1 1984-85 523 332 570 510 218 171 99 158
2 1985-86 531 316 585 517 337 218 117 221
3 1986-87 610 301 704 597 342 162 62 189
4 1987-88 407 333 594 475 548 348 285 390
5 1988-89 846 707 1242 994 142 101 41 91
6 1989-90 843 532 1089 896 120 130 43 88
7 1990-91 535 347 869 647 389 299 181 283
8 1991-92 766 440 736 696 393 353 64 243
9 1992-93 569 314 639 555 347 207 114 221
10 1993-94 462 369 611 511 324 335 132 242
11 1994-95 504 213 577 485 470 277 212 324
12 1995-96 651 463 671 627 354 144 321 303
13 1996-97 766 650 740 734 405 379 129 281
14 1997-98 602 368 506 520 302 245 167 233
15 1998-99 787 526 813 753 435 286 185 300
16 1999-00 523 294 641 535 224 159 45 135
NORMAL 620 407 715 624 324 238 129 224
17 2000-01 742 508 875 759 123 186 24 91
18 2001-02 521 373 609 534 359 363 140 264
19 2002-03 390 249 508 417 217 184 89 156
20 2003-04 585 389 693 598 357 181 109 218
21 2004-05 539 336 487 481 206 114 76 133
22 2005-06 665 418 820 690 439 432 172 321
23 2006-07 649 307 734 627 288 157 64 168
24 2007-08 804 647 737 747 250 227 60 163
25 2008-09 667 369 755 641 228 270 39 159
26 2009-10 465 382 506 454 242 212 116 185
27 2010-11 870 533 903 810 559 268 151 333
28 2011-12 578 370 608 539 158 200 27 113
29 2012-13 708 350 713 632 433 212 144 269
Source: Directorate of Economics and Statistics.
281

A 5.3 : District wise Rainfall during South-West Monsoon and North-East Monsoon (in mm.)
Sl. No. District
South-West Monsoon North-East Monsoon
(June to September 2012) (October to December 2012)
Normal Actual % Deviation Normal Actual % Deviation
1 2 3 4 5 6 7 8
1 Srikakulam 706 797 13 276 361 31
2 Vizianagaram 693 718 4 246 400 63
3 Visakapatnam 713 745 5 297 480 61
4 East Godavari 751 911 21 319 511 60
5 West Godavari 785 1031 31 245 483 97
6 Krishna 685 962 40 249 455 83
7 Guntur 526 586 11 229 309 35
8 Prakasam 388 360 -7 394 399 1
9 Nellore 331 262 -21 661 496 -25
Coastal Andhra 620 708 14 324 433 33
10 Chittoor 439 408 -7 395 397 0
11 Kadapa 394 292 -26 251 210 -16
12 Anantapur 338 276 -18 155 135 -13
13 Kurnool 455 424 -7 150 107 -29
Rayalaseema 407 350 -14 238 212 -11
14 Mahabubnagar 447 416 -7 121 99 -18
15 Ranga Reddy 588 602 2 132 120 -9
16 Hyderabad 562 657 17 152 139 -9
17 Medak 676 573 -15 133 136 2
18 Nizamabad 849 717 -16 134 138 3
19 Adilabad 984 983 0 117 79 -32
20 Karimnagar 795 799 1 114 114 0
21 Warangal 799 890 11 120 162 35
22 Khammam 890 1041 17 130 317 143
23 Nalgonda 562 451 -20 140 139 0
Telangana 715 713 0 129 144 12
Andhra Pradesh 624 632 1 224 269 20
Source: Directorate of Economics and Statistics
282

A 5.4 : Area and Production of Foodgrains
Year Area (in Lakh Hects.) Production (in Lakh Tonnes)
1975-76 98.20 94.28
1976-77 88.75 74.76
1977-78 92.55 89.85
1978-79 96.48 106.67
1979-80 88.22 95.28
1980-81 87.56 99.91
1981-82 92.22 114.16
1982-83 87.73 111.73
1983-84 92.20 118.81
1984-85 80.57 96.16
1985-86 78.28 103.74
1986-87 77.05 91.63
1987-88 75.68 99.00
1988-89 80.25 129.00
1989-90 80.48 127.72
1990-91 77.62 123.30
1991-92 74.31 117.05
1992-93 70.02 116.58
1993-94 68.75 122.54
1994-95 68.78 117.83
1995-96 68.94 116.64
1996-97 73.09 136.81
1997-98 65.20 108.22
1998-99 73.71 149.05
1999-2000 71.40 136.97
2000-01 76.74 160.27
2001-02 70.56 148.36
2002-03 62.89 106.55
2003-04 68.07 136.97
2004-05 62.67 133.94
2005-06 71.68 169.50
2006-07 72.74 162.29
2007-08 73.87 198.17
2008-09 74.43 204.21
2009-10 66.67 155.99
2010-11 80.29 203.14
2011-12 72.89 184.02
2012-13* 66.32 170.78
Source : Directorate of Economics and Statistics* As per second advance estimates during 2012-13 as on 05-01-2013
283

A 5.5 : Season-wise Area under Selected Crops (Thousand Hectares)
Sl. No. Crop Season 2003-04 2004-05 2005-06 2006-07 2007-08 2008-09 2009-10 2010-11 2011-12 2012-
13*
1 2 3 4 5 6 7 8 9 10 11 12 13
1 Rice
Kharif 2109 2215 2526 2641 2578 2803 2063 2922 2874 2487
Rabi 866 871 1456 1337 1406 1587 1378 1830 1222 910
Total 2975 3086 3982 3978 3984 4390 3441 4752 4096 3397
2 Jowar
Kharif 275 201 183 163 143 118 185 114 103 103
Rabi 373 299 261 260 188 161 200 140 174 169
Total 648 500 444 423 331 279 385 254 277 272
3 Bajra
Kharif 129 84 69 49 60 50 33 51 32 60
Rabi 9 10 12 12 14 9 12 16 11 7
Total 138 94 81 61 74 59 45 67 43 67
4 Maize
Kharif 558 505 593 535 519 498 502 440 531 565
Rabi 163 152 165 190 267 354 281 304 333 324
Total 721 657 758 725 786 852 783 744 864 889
5 Ragi
Kharif 67 61 57 51 48 45 39 37 37 36
Rabi 11 8 9 8 7 5 6 5 5 4
Total 78 69 66 59 55 50 45 42 42 40
6Other Millets
including Wheat
Kharif 47 47 43 34 35 30 24 28 27 36
Rabi 15 10 12 10 9 14 11 11 10 9
Total 62 57 55 44 44 44 35 39 37 45
7 Pulses
Kharif 1118 878 844 745 859 729 755 989 708 697
Rabi 1067 925 938 1239 1254 1042 1178 1142 1222 1225
Total 2185 1803 1782 1984 2113 1771 1933 2131 1930 1922
Total Food Grains
Kharif 4303 3991 4315 4218 4242 4273 3601 4581 4312 3984
Rabi 2504 2275 2853 3056 3145 3169 3066 3448 2977 2648
Total 6807 6266 7168 7274 7387 7442 6667 8029 7289 6632
8 Groundnut
Kharif 1258 1605 1615 1107 1500 1500 1011 1347 1057 1059
Rabi 235 236 261 227 295 266 290 275 250 255
Total 1493 1841 1876 1334 1795 1766 1301 1622 1307 1314
9 Castor Kharif 291 271 345 202 199 159 148 188 241 202
10 Sesamum
Kharif 114 170 79 80 82 46 47 82 33 26
Rabi 47 40 37 34 31 34 43 43 39 36
Total 161 210 116 114 113 80 90 125 72 62
Total Oil Seeds
Kharif 1875 2266 2268 1637 2004 1958 1603 1834 1632 1466
Rabi 670 652 654 615 672 664 620 534 467 443
Total 2545 2918 2922 2252 2676 2622 2223 2368 2099 1909
Source: Directorate of Economics and Statistics* As per second advance estimates during 2012-13 as on 05-01-2013
284
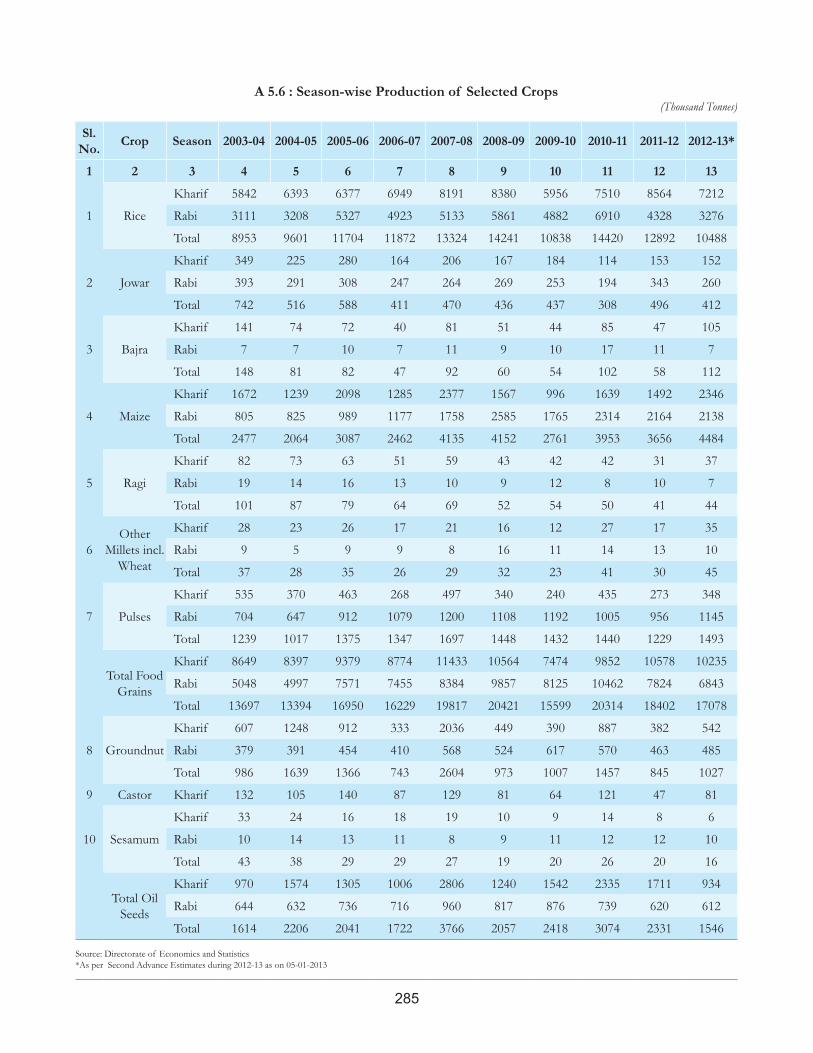
A 5.6 : Season-wise Production of Selected Crops (Thousand Tonnes)
Sl. No. Crop Season 2003-04 2004-05 2005-06 2006-07 2007-08 2008-09 2009-10 2010-11 2011-12 2012-13*
1 2 3 4 5 6 7 8 9 10 11 12 13
1 Rice
Kharif 5842 6393 6377 6949 8191 8380 5956 7510 8564 7212
Rabi 3111 3208 5327 4923 5133 5861 4882 6910 4328 3276
Total 8953 9601 11704 11872 13324 14241 10838 14420 12892 10488
2 Jowar
Kharif 349 225 280 164 206 167 184 114 153 152
Rabi 393 291 308 247 264 269 253 194 343 260
Total 742 516 588 411 470 436 437 308 496 412
3 Bajra
Kharif 141 74 72 40 81 51 44 85 47 105
Rabi 7 7 10 7 11 9 10 17 11 7
Total 148 81 82 47 92 60 54 102 58 112
4 Maize
Kharif 1672 1239 2098 1285 2377 1567 996 1639 1492 2346
Rabi 805 825 989 1177 1758 2585 1765 2314 2164 2138
Total 2477 2064 3087 2462 4135 4152 2761 3953 3656 4484
5 Ragi
Kharif 82 73 63 51 59 43 42 42 31 37
Rabi 19 14 16 13 10 9 12 8 10 7
Total 101 87 79 64 69 52 54 50 41 44
6Other
Millets incl. Wheat
Kharif 28 23 26 17 21 16 12 27 17 35
Rabi 9 5 9 9 8 16 11 14 13 10
Total 37 28 35 26 29 32 23 41 30 45
7 Pulses
Kharif 535 370 463 268 497 340 240 435 273 348
Rabi 704 647 912 1079 1200 1108 1192 1005 956 1145
Total 1239 1017 1375 1347 1697 1448 1432 1440 1229 1493
Total Food Grains
Kharif 8649 8397 9379 8774 11433 10564 7474 9852 10578 10235
Rabi 5048 4997 7571 7455 8384 9857 8125 10462 7824 6843
Total 13697 13394 16950 16229 19817 20421 15599 20314 18402 17078
8 Groundnut
Kharif 607 1248 912 333 2036 449 390 887 382 542
Rabi 379 391 454 410 568 524 617 570 463 485
Total 986 1639 1366 743 2604 973 1007 1457 845 1027
9 Castor Kharif 132 105 140 87 129 81 64 121 47 81
10 Sesamum
Kharif 33 24 16 18 19 10 9 14 8 6
Rabi 10 14 13 11 8 9 11 12 12 10
Total 43 38 29 29 27 19 20 26 20 16
Total Oil Seeds
Kharif 970 1574 1305 1006 2806 1240 1542 2335 1711 934
Rabi 644 632 736 716 960 817 876 739 620 612
Total 1614 2206 2041 1722 3766 2057 2418 3074 2331 1546
Source: Directorate of Economics and Statistics*As per Second Advance Estimates during 2012-13 as on 05-01-2013
285

A 5.7 : Season-wise Productivity of Selected Crops (Kgs./Hectare)
Sl. No. Crop Season 2003-04 2004-05 2005-06 2006-07 2007-08 2008-09 2009-10 2010-11 2011-12 2012-13*
1 2 3 4 5 6 7 8 9 10 11 12 13
1 Rice
Kharif 2772 2886 2524 2631 3178 2989 2887 2570 2980 2900
Rabi 3594 3683 3659 3681 3650 3700 3543 3777 3542 3600
Total 3011 3111 2939 2984 3345 3246 3150 3055 3148 3087
2 Jowar
Kharif 1271 1120 1532 989 1441 1411 996 1000 1487 1475
Rabi 1053 970 1179 952 1400 1677 1266 1383 1977 1541
Total 1145 1030 1324 966 1418 1564 1136 1211 1794 1515
3 Bajra
Kharif 1102 893 1051 816 1363 1030 1301 1652 1466 1749
Rabi 674 663 806 587 791 957 828 1079 1036 938
Total 1072 868 1014 771 1253 1019 1177 1516 1359 1515
4 Maize
Kharif 2996 2451 3538 2398 4581 3148 1986 3729 2811 4152
Rabi 4946 5446 5998 6189 6590 7299 6281 7614 6500 6600
Total 3437 3142 4073 3391 5263 4874 3528 5317 4232 5044
5 Ragi
Kharif 1216 1198 1112 1004 1210 959 1078 1148 844 1019
Rabi 1754 1802 1816 1656 1515 1708 1859 1473 1767 1665
Total 1290 1267 1209 1095 1248 1037 1187 1188 961 1100
8 Groundnut
Kharif 482 778 565 301 1357 300 385 658 361 512
Rabi 1614 1657 1739 1801 1919 1964 2126 2071 1849 1900
Total 660 891 728 557 1449 551 774 898 646 782
9 Castor Kharif 453 388 407 430 654 511 432 646 197 400
10 Sesamum
Kharif 290 141 205 230 231 209 198 169 239 245
Rabi 203 346 343 308 245 267 263 284 309 274
Total 265 180 249 253 235 234 229 209 277 258
Total Oil Seeds
Kharif 517 697 575 615 1400 633 1029 1274 1119 637
Rabi 961 959 1125 1164 1433 1231 1413 1383 1332 1381
Total 634 756 698 765 1408 784 1141 1298 1169 810
Source: Directorate of Economics and Statistics* As per Second Advance Estimates during 2012-13 as on 05-01-2013
286
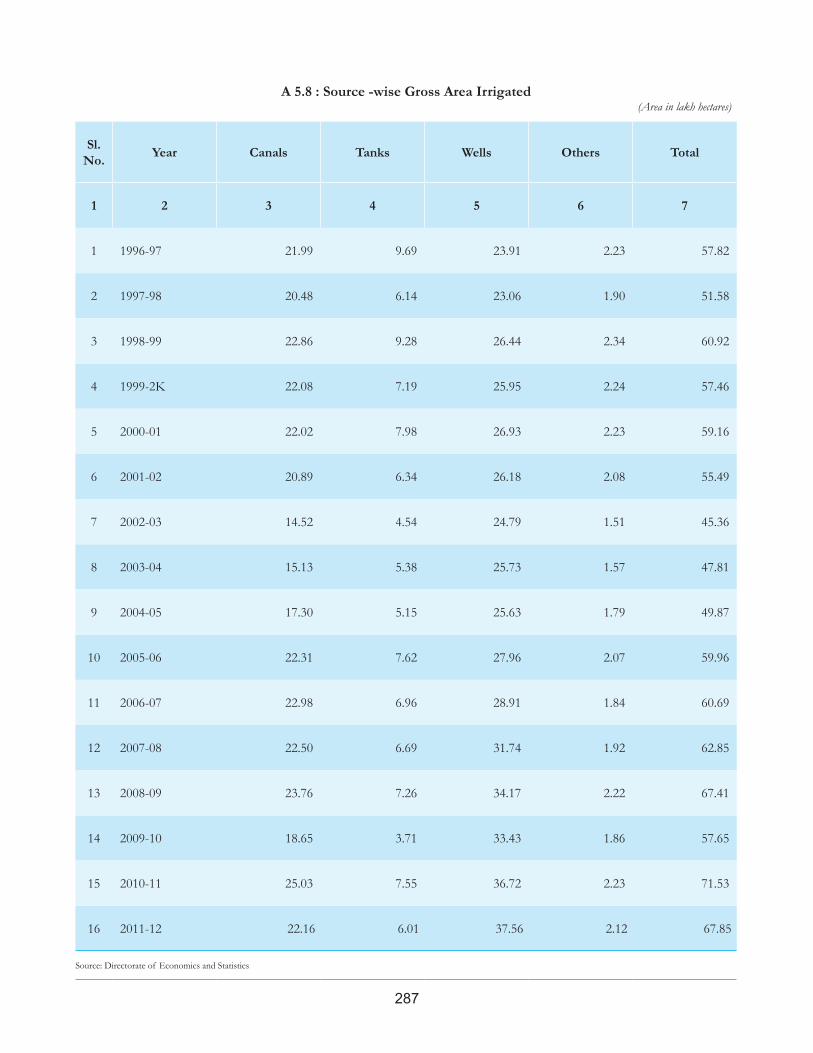
A 5.8 : Source -wise Gross Area Irrigated (Area in lakh hectares)
Sl. No. Year Canals Tanks Wells Others Total
1 2 3 4 5 6 7
1 1996-97 21.99 9.69 23.91 2.23 57.82
2 1997-98 20.48 6.14 23.06 1.90 51.58
3 1998-99 22.86 9.28 26.44 2.34 60.92
4 1999-2K 22.08 7.19 25.95 2.24 57.46
5 2000-01 22.02 7.98 26.93 2.23 59.16
6 2001-02 20.89 6.34 26.18 2.08 55.49
7 2002-03 14.52 4.54 24.79 1.51 45.36
8 2003-04 15.13 5.38 25.73 1.57 47.81
9 2004-05 17.30 5.15 25.63 1.79 49.87
10 2005-06 22.31 7.62 27.96 2.07 59.96
11 2006-07 22.98 6.96 28.91 1.84 60.69
12 2007-08 22.50 6.69 31.74 1.92 62.85
13 2008-09 23.76 7.26 34.17 2.22 67.41
14 2009-10 18.65 3.71 33.43 1.86 57.65
15 2010-11 25.03 7.55 36.72 2.23 71.53
16 2011-12 22.16 6.01 37.56 2.12 67.85
Source: Directorate of Economics and Statistics
287

A 5.9 : Source-wise Net Area Irrigated (Area in lakh hectares)
Sl. No. Year Canals Tanks Wells Others Total
1 2 3 4 5 6 7
1 1996-97 16.29 8.44 17.28 1.94 43.95
2 1997-98 15.37 5.62 16.77 1.68 39.44
3 1998-99 16.34 8.10 18.97 1.98 45.39
4 1999-2K 16.34 6.52 19.00 1.98 43.84
5 2000-01 16.49 7.27 19.54 1.98 45.28
6 2001-02 15.63 5.67 19.28 1.80 42.38
7 2002-03 12.09 4.25 18.43 1.37 36.14
8 2003-04 11.36 4.90 18.70 1.38 36.34
9 2004-05 13.46 4.77 19.03 1.55 38.81
10 2005-06 15.72 6.62 19.87 1.72 43.93
12 2007-08 16.10 5.85 22.87 1.62 46.44
13 2008-09 16.70 6.48 23.23 1.80 48.21
14 2009-10 14.46 3.32 22.84 1.53 42.15
15 2010-11 17.47 6.50 24.61 1.76 50.34
16 2011-12 18.18 5.50 25.44 1.77 50.89
Source: Directorate of Economics and Statistics
288

A 5.10 : Distribution of Land Holdings By Size Classes, 2005-06 and 2010-11
Size Group
No. of Holdings (Lakh)
Percentage to Total Area (Lakh Hect.) Percentage to
TotalAverage Size of
Holdings (Hect.)
2005-06 2010-11 2005-06 2010-11 2005-06 2010-11 2005-06 2010-11 2005-06 2010-11
1 2 3 4 5 6 7 8 9 10 11
Marginal 74.18 84.25 61.59 63.95 32.870 37.27 22.69 26.08 0.44 0.44
Small 26.39 29.18 21.91 22.15 37.30 41.20 25.75 28.82 1.41 1.41
Semi-medium 14.44 13.99 11.99 10.62 38.35 36.85 26.47 25.78 2.66 2.63
Medium 4.87 3.97 4.05 3.02 27.59 22.09 19.04 15.46 5.66 5.56
Large 0.56 0.36 0.47 0.27 8.78 5.52 6.06 3.86 15.66 15.33
Total 120.45 131.75 100.00 100.00 144.89 142.93 100.00 100.00 1.20 1.08
Source: Directorate of Economics and Statistics
289

A 5.11 : Area Covered Under High Yielding Varieties (thousand hectares)
Year CropTarget Achievement
Kharif Rabi Total Kharif Rabi Total1 2 3 4 5 6 7 8
2006-07
Paddy 2277 1061 3338 2641 1337 3978
Wheat 0 11 11 0 10 10
Jowar 244 327 571 163 260 423
Bajra 88 10 98 49 12 61
Maize 482 136 618 535 190 725
Total: 3091 1545 4636 3388 1809 5197
2007-08
Paddy 2450 1350 3800 2578 1406 3984
Wheat 0 10 10 0 9 9
Jowar 140 240 380 143 188 331
Bajra 70 5 75 60 14 74
Maize 490 230 720 519 267 786
Total: 3150 1835 4985 3300 1884 5184
2008-09
Paddy 2553 1331 3884 2803 1584 4387
Wheat 0 10 10 0 14 14
Jowar 162 238 400 118 161 279
Bajra 62 11 73 50 9 59
Maize 490 226 716 498 354 852
Total: 3267 1816 5083 3469 2122 5591
2009-10
Paddy 2805 1560 4365 2063 1378 3441
Wheat 0 8 8 0 0 0
Jowar 150 357 507 185 200 385
Bajra 45 10 55 33 12 45
Maize 550 350 900 502 281 783
Total: 3550 2285 5835 2783 1871 4654
2010-11
Paddy 280 1570 1850 2922 1829 4751
Wheat 0 9 9 0 10 10
Jowar 160 200 360 114 140 254
Bajra 40 5 45 51 16 67
Maize 560 360 920 440 304 744
Total: 1040 2144 3184 3527 2299 5826
2011-12
Paddy 2825 1175 4000 2602 1017 3619
Wheat 0 6 6 0 8 8
Jowar 299 201 500 98 195 293
Bajra 30 20 50 35 27 377
Maize 495 305 800 491 317 808
Total: 3649 1707 5356 3226 1564 5105
Source: Agriculture Department
290

A 5.12 : Consumption of Fertilizers (Lakh MTs.)
Sl. No. Product 2010-11 2011-12 % of change over
prev. year
1 2 3 4 5
1 Urea 29.96 29.33 -2.10
2 Complexes 21.33 22.59 5.91
3 Di-Ammonium Phosphate 9.84 9.74 -1.02
4 Single Super Phosphate 2.80 3.45 23.21
5 Murate of Potash 6.01 3.81 -36.61
6 Others 1.86 1.91 2.69
Total 71.80 70.83 -1.35
Source: Agriculture Department
291

A 5.13 : Consumption of Fertilizers in terms of Nutrients (Lakh MTs.)
Sl. No. Year N P K Total
NPK
1 2 3 4 5 6
1 2001-02 11.84 5.48 2.27 19.59
2 2002-03 10.36 4.34 2.03 16.73
3 2003-04 11.39 4.74 2.40 18.53
4 2004-05 11.57 5.39 2.92 19.88
5 2005-06 15.23 6.90 3.40 25.53
6 2006-07 14.66 6.86 3.32 24.84
7 2007-08 15.61 6.95 4.12 26.68
8 2008-09 17.20 8.52 4.98 30.70
9 2009-10 17.04 8.71 4.79 30.54
10 2010-11 19.53 10.18 4.99 34.70
11 2011-12 19.78 10.43 3.22 33.43
12 2012-13 19.60 9.08 3.92 32.60
Source: Agriculture Department
292

A 5.14 : National Agricultural Insurance Scheme
Sl. No. Year Season
Farmers Covered
(Lakh Nos)
Area Covered
(Lakh Ha.)
Sum Insured (Lakh Rs.)
Premium Collected
(Lakh Rs.)
Compensation Paid
(Lakh Rs.)
Farmers Benefitted
(Lakh Nos. )
1 2 3 4 5 6 7 8 9
1 2002-03
Kharif 16.79 24.14 207999 5607 24936 6.45
Rabi 1.45 2.39 19271 395 1069 0.40
Total 18.24 26.53 227270 6002 26005 6.85
2 2003-04
Kharif 14.99 22.06 203020 5415 20035 3.32
Rabi 2.35 4.08 34043 669 1457 0.47
Total 17.34 26.14 237063 6084 21492 3.79
3 2004-05
Kharif 23.56 36.90 339833 9862 8584 2.85
Rabi 2.36 3.99 35992 736 713 0.28
Total 25.92 40.89 375825 10598 9297 3.13
4 2005-06
Kharif 19.80 34.03 319954 9805 49335 6.61
Rabi 2.67 3.97 45282 922 358 0.10
Total 22.47 38.00 365236 10727 49693 6.71
5 2006-07
Kharif 19.65 31.34 364053 10732 54026 6.47
Rabi 2.94 5.15 57689 1234 1932 0.41
Total 22.59 36.49 421742 11967 55957 6.88
6 2007-08
Kharif 21.10 34.77 420072 12882 726 0.14
Rabi 2.23 3.88 50030 1046 419 0.11
Total 23.33 38.65 470102 13929 1145 0.25
7 2008-09
Kharif 17.04 28.49 335465 11063 80120 7.58
Rabi 4.46 7.88 94440 1999 3660 0.50
Total 21.50 36.37 429905 13063 83781 8.08
8 2009-10
Kharif 30.49 45.58 660581 20907 69948 11.54
WBCIS 0.18 0.12 14306 1159 1734 0.16
Rabi 2.97 4.80 80998 1728 3241 0.83
Total 33.64 50.50 755885 23794 74923 12.53
9 2010-11
Kharif 21.95 33.20 598401 18390 76609 7.84
WBCIS 1.38 1.40 43065 4221 1053 0.58
Rabi 4.70 6.75 126074 2649 6617 0.57
WBCIS 0.00 0.01 357 43 65 0.00
MNIAS 0.54 0.58 19195 1134 70 0.01
Total 28.57 41.94 787092 26438 84414 9.01
10 2011
Kharif 16.94 23.29 491233 14312 92218 3.40
WBCIS 8.82 14.74 311451 31051 20334 6.66
MNIAS 0.40 0.53 16844 872 232 0.05
Total 26.16 38.56 819528 46234 44694 10.11
Source:Agriculture Department
293

A 5.15 : Disbursement of Agricultural Credit(Rs. Crore)
Year Details CBs RRBs Co-op Total1 2 3 4 5 6
1999-2KCrop Loans 2340 514 1434 4288Agrl.Term Loans 393 64 413 870Total 2733 578 1847 5158
2000-01Crop Loans 2343 628 1213 4184Agrl.Term Loans 389 48 249 686Total 2732 676 1462 4870
2001-02Crop Loans 3264 962 1898 6124Agrl.Term Loans 654 137 370 1161Total 3918 1099 2268 7285
2002-03Crop Loans 4332 1239 3029 8600Agrl.Term Loans 1116 279 930 2325Total 5448 1518 3959 10925
2003-04Crop Loans 4417 1023 2462 7902Agrl.Term Loans 624 145 348 1117Total 5041 1168 2810 9019
2004-05Crop Loans 6402 1951 1932 10285Agrl.Term Loans 2455 736 145 3336Total 8857 2687 2077 13621
2005-06Crop Loans 8019 2489 2798 13306Agrl.Term Loans 2018 328 328 2674Total 10037 2817 3126 15980
2006-07Crop Loans 6965 1941 2392 11297Agrl.Term Loans 4960 1382 1705 8047Total 11925 3323 4096 19344
2007-08Crop Loans 10994 2901 3405 17300Agrl.Term Loans 3400 896 1054 5350Total 14394 3797 4459 22650
2008-09Crop Loans 10300 2889 3280 16469Agrl.Term Loans 2042 409 418 2869Total 12342 3298 3698 19338
2009-10 Crop Loans 16364 4134 4347 24845Agrl.Term Loans 11454 995 281 12730Total 27818 5129 4628 37575
2010-11Crop Loans 19167 5564 5498 30229Agrl.Term Loans 15920 1360 421 17701Total 35087 6924 5919 47930
2011-12 Crop Loans 25981 5771 4699 36451Agrl.Term Loans 19369 2178 513 22060Total 45350 7949 5212 58511
2012-13 (upto Dec.2012)
Crop Loans 25746 5970 5597 37313Agrl.Term Loans 10362 2403 2253 15018Total 36108 8373 7850 52331
Source: Finance (IF) DepartmentCBs: Commercial Banks, RRBs: Regional Rural Banks, Co-op: Co-operative Institutions.
294

A 5.16 : Area and Production of Major Horticulture Crops (Area in Hectares & Production in Tonnes)
Sl. No. Crop 2011-12 2012-13(A)
Area Production Area Production1 2 5 6 5 6I Fresh Fruits 671685 9841072 745570 109235901 Mango 408692 3514753 453648 39013762 Mosambi&Orange 86619 1169358 96147 12979883 Banana 82847 2899629 91960 32185894 Lemon / Lime 47836 717533 53097 7964615 Papaya 14874 1189927 16510 13208196 Grapes 1374 28855 1525 320297 Sapota 12757 127569 14160 1416018 Guava 8933 133989 9915 1487289 Others 7753 59459 8608 65999II Plantation Crops 320737 1348927 333566 14027041 Cashew 78917 53664 82074 558102 Coconut 142025 21304 (Lakh Nos) 147706 21304 (Lakh Nos)3 Oilpalm 85484 1282257 88903 13335484 Cocoa 8992 4496 9352 44965 Arecanut 5319 8510 5531 8850
III Vegetables 660970 12025276 680799 123847031 Tapioca 3090 61799 3183 636532 Potato 4919 98384 5067 1013363 Sweet Potato 482 9640 496 99294 Tomato 300755 6015103 309778 61955565 Onion 48516 824773 49972 8495166 Brinjal 76246 1524920 78533 15706677 Beans 19384 232613 19966 2395928 Gourds 48319 724793 49769 7465379 Cucumber 14452 289040 14886 29771210 Cabbage 28927 433910 29795 44692711 Others 115880 1810301 119354 1863278IV Spices 841193 3670296 874841 38171081 Chillies 501000 1689762 521039 17573522 Turmeric 293698 1820925 305445 18937624 Tamarind 3572 27503 3715 286035 Ginger 3434 68680 3571 714276 Garlic 3727 37274 3877 387657 Others 35762 26152 37194 27199V Flowers 64152 389008 66062 4006771 Jasmine 33354 166768 34354 1717712 Crossandra 1453 4649 1496 47883 Marigold 4539 34042 4675 350634 Chrysanthemum 10609 121998 10927 1256585 Others 11819 61551 12175 633976 Rose:Cut Flowers 2364 7092 (lakh Nos) 2435 36525(Nos)7 Gladiolus 14 7.07(lakh Nos) - -
VI Aromatic Plants 256 3837 263 3952Total Horticulture Crops 2558993 27278416 2701101 28932734
Source: Horticulture DepartmentA : Advance EstimatesNote: Total Production excludes Coconut and Cut flowers.
295
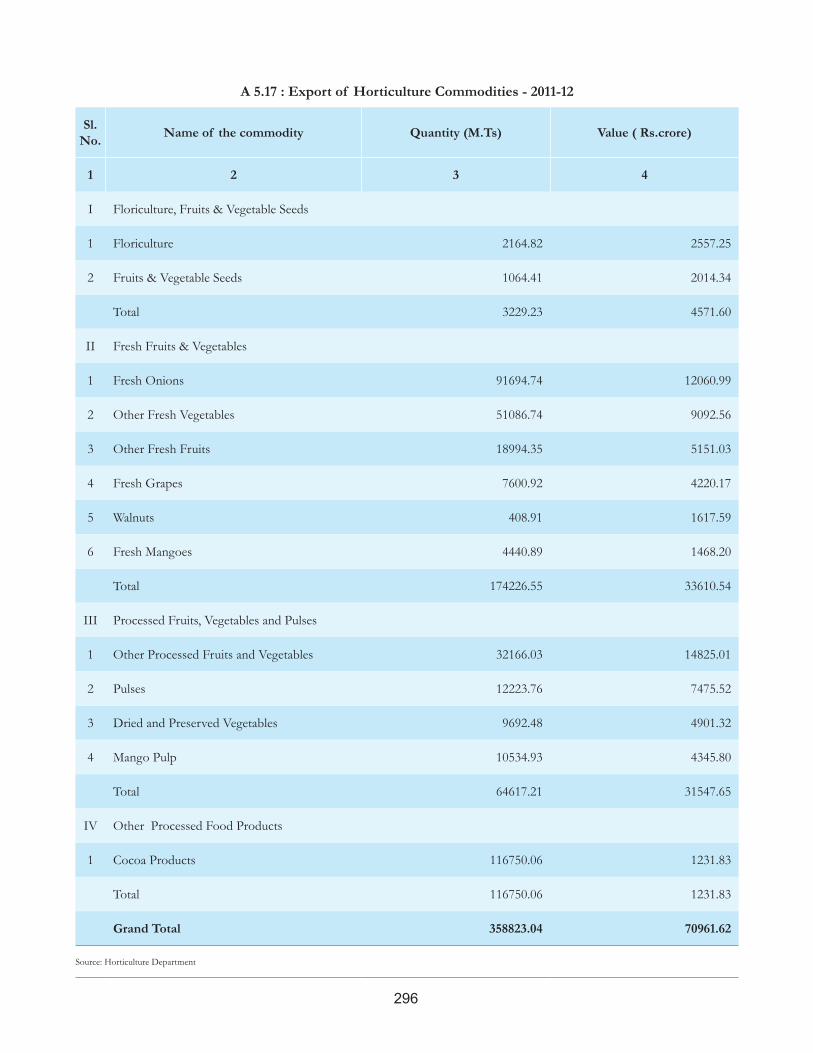
A 5.17 : Export of Horticulture Commodities - 2011-12
Sl. No. Name of the commodity Quantity (M.Ts) Value ( Rs.crore)
1 2 3 4
I Floriculture, Fruits & Vegetable Seeds
1 Floriculture 2164.82 2557.25
2 Fruits & Vegetable Seeds 1064.41 2014.34
Total 3229.23 4571.60
II Fresh Fruits & Vegetables
1 Fresh Onions 91694.74 12060.99
2 Other Fresh Vegetables 51086.74 9092.56
3 Other Fresh Fruits 18994.35 5151.03
4 Fresh Grapes 7600.92 4220.17
5 Walnuts 408.91 1617.59
6 Fresh Mangoes 4440.89 1468.20
Total 174226.55 33610.54
III Processed Fruits, Vegetables and Pulses
1 Other Processed Fruits and Vegetables 32166.03 14825.01
2 Pulses 12223.76 7475.52
3 Dried and Preserved Vegetables 9692.48 4901.32
4 Mango Pulp 10534.93 4345.80
Total 64617.21 31547.65
IV Other Processed Food Products
1 Cocoa Products 116750.06 1231.83
Total 116750.06 1231.83
Grand Total 358823.04 70961.62
Source: Horticulture Department
296

A 5.18 : Livestock Population (Livestock census) (Number in Lakh)
Sl. No. Year Cattle Buffaloes Sheep Goat Pigs Poultry &
Others
1 2 3 4 5 6 7 8
1 1956 112.76 59.67 78.46 36.93 6.20 147.37
2 1961 123.45 69.48 83.63 42.46 5.90 162.48
3 1966 123.41 67.90 80.03 37.58 5.82 147.14
4 1972 125.07 70.56 83.43 43.80 6.90 190.47
5 1977 120.40 71.62 70.64 43.69 7.55 216.08
6 1983 132.20 87.03 75.15 54.59 7.86 323.91
7 1987 123.74 87.57 68.71 48.75 7.24 390.50
8 1993 109.47 91.53 77.87 43.29 6.48 498.83
9 1999 106.02 96.58 97.43 52.13 7.48 650.95
10 2003 94.24 107.68 210.15 64.27 5.49 1005.80
11 2007 112.23 132.72 255.39 96.26 4.39 1239.85
Source: 1. Directorate of Economics and Statistics, 2. Animal Husbandry Department
297

A 5.19 : Production estimates@ of Milk, Eggs and Meat
Sl. No. Year Milk
(‘000 M.Ts.) Eggs (Million Nos.) Meat (‘000 M.Ts.)
1 2 3 4 5
1 1999-2000 5122 11200 268
2 2000-01 5521 11800 291
3 2001-02 5814 13310 333
4 2002-03 6583 14862 398
5 2003-04 6959 14993 447
6 2004-05 7257 15804 451
7 2005-06 7624 16453 459
8 2006-07 7935 15941 484
9 2007-08 8926 17588 556
10 2008-09 9569 18344 604
11 2009-10 10430 19396 680
12 2010-11 11204 20128 747
12 2011-12 12087 21210 824
13 up to Sep. 2012 3444 5736 226
Source: Animal Husbandry Department @ Estimates based on sample surveys; Eggs includes both commercial and desi and Meat includes chicken meat
298

A 5.20 : Animal Husbandry Institutions (Numbers)
Sl. No. Institution 2005-06 2006-07 2007-08 2008-09 2009-10 2010-11 2011-12
1 2 3 4 5 6 7 8 9
Health Sector
1 Veterinary Poly Clinics 22 22 22 22 20* 20 20
2 Veterinary Hospitals 281 281 281 281 281 281 281
3 Veterinary Dispensaries 1794 1813 1815 1826 1826 1823 2202
4 Rural Livestock Units 2916 3006 3030 3110 3110 3110 2736
5 Animal Health Centres 22 22 22 22 22 22 22
6 Mobile Clinics 41 42 42 42 42 42 42
7 Vety. Biological Research Institutes 2 2 2 2 2 2 2
Production Sector
1 Frozen Semen Banks 4 4 4 4 4 4 4
2 Semen Depots. 21 21 21 21 22 22 22
3 LN2 Plants 12 12 12 12 12 3
4 Departmental A.I. Centres 4834 4946 4953 4964 4985 4933 4960
5 Govt. Livestock Farms 10 10 10 10 8 8 8
6 Sheep Farms 2 2 2 2 2 2 2
7 Sheep & Wool Extension Centers 54 14 1 1 - 1 1
8 Integrated Sheep Devt. Projects 11 11 11 11 11 11 11
9 State A.H.Training Centres 3 3 3 3 3 3 3
10 Regional A.H.Training Centres 10 9 9 9 7 7 7
11 District A.H.Training Centres 22 22 22 22 20 20 20
12 Pig Breeding Stations 4 4 4 4 4 4 4
* 2 Veterinary Poly Clinics were transferred to Sri Venkateswara Veterinary University***As the production cost of Liquid Nitrogen is very high, the Liquid Nitrogen is being procured from outside sources. These Plants are being used as standby plants to meet emergency requirements.Source: Animal Husbandry Department
299

A 5.21 : Animals inducted and subsidy utilized under Special Programmes (physical in Number and Amount in Lakh)
Sl. No Package Year
Buffaloes Cows Buff.Heifer CB HeiferTotal No.of
Animals Inducted
Physical Financial Physical Financial Physical Financial Physical Financial Physical Financial
1 2 3 4 5 6 7 8 9 10 12 13 14
1 PM’s Special Pakage
2007-08 8968 1345.20 1192 178.80 0 0.00 0 0.00 10160 1524.00
2008-09 17763 2664.45 8538 1280.70 0 0.00 0 0.00 26301 3945.15
2009-10 6715 1007.25 5632 844.80 0 0.00 0 0.00 12347 1852.05
2010-11 380 57.00 659 98.85 0 0.00 0 0.00 1039 155.85
2011-12 92 13.80 52 7.80 0 0.00 0 0.00 144 21.6
2 CM’s Special Package
2007-08 20270 3040.50 6610 826.25 3176 397 118 11.80 30174 4275.55
2008-09 19371 2905.65 5526 690.75 8305 1038.13 1739 173.90 34941 4808.43
2009-10 4410 661.50 3352 419.00 817 102.13 59 5.90 8638 1188.53
2010-11 1110 166.50 1201 150.13 0 0.00 0 0.00 2311 316.63
2011-12 2130 372.75 1608 241.20 0 0.00 0 0.00 3738 613.95
3 RKVY
2008-09 714 107.10 806 100.75 0 0.00 0 0.00 1520 207.85
2009-10 7738 1160.70 11511 1438.88 1314 166.25 16 1.60 20579 2765.83
2010-11 4242 636.30 5348 668.50 1767 220.88 864 86.40 12221 1612.08
2011-12 8186 1432.55 4392 658.80 876 109.50 817 81.70 14271 2282.55
4 SCAP
2009-10 1088 163.20 910 113.75 0 0.00 0 0.00 1998 276.95
2010-11 1141 171.15 841 105.13 0 0.00 0 0.00 1982 276.28
2011-12 705 105.75 316 39.50 0 0.00 0 0.00 1021 1452.5
Grand Total 105023 16011.35 58494 7863.59 16255 2031.89 3613 361.30 183385 27575.38
Source: Animal Husbandry Department
300

A 5.22 : Fish and Prawn Production (Tonnes)
Sl. No Year
Inland Fish (incl.fresh water prawn & brackish
water shrimp)
Marine Fish (incl.Marine Shrimp) Total
1 2 3 4 5
2 2000-01 407000 219000 626000
3 2001-02 471000 242000 713000
4 2002-03 579000 287000 866000
5 2003-04 649000 296000 945000
6 2004-05 608000 244000 852000
7 2005-06 631000 260000 891000
8 2006-07 694193 240712 934904
9 2007-08 802078 254892 1056970
10 2008-09 961617 291160 1252777
11 2009-10 1000705 293150 1293855
12 2010-11 1269052 290553 1559605
13 2011-12 1223751 379417 1603168
13 2012-13(up to Sep. 2012) 744170 125985 870155
Source: Fisheries Department
301

A 5.23 : Revenue Achieved from Forest Produce (Rs.Lakh)
Sl. No. Item 2009-10 2010-11 2011-12 2012-13
(up to Sep 2012)
1 2 3 4 5 6
1 Timber 3612 3157 2431 1200
2 Bamboo 1564 1424 1887 704
3 Firewood & Charcoal 90 29 49 26
4 Other Forest produce 13 56 12 7
5 Beedi Leaves 26 14 32 14
6 Teak Plants 1788 1502 2192 639
7 Miscellaneous 3245 6692 8283 4648
Total 10337 12874 14886 7237
Source: Forest Department
302

A 5.24 : Major Wood Based Industries
Sl. No. Name of Industry Nature
Production Capacity
(Tonnes per annum)
Raw materialSupply 2011-12
No/MTs
1 2 3 4 5 6
1 Andhra Pradesh Paper Mills, Rajahmundry Paper 174500 Bamboo 1292750/ 21545
2 Bhadrachalam Paper Board Ltd. Paper 300000 Bamboo 1011000 / 16850
3 Sirpur Paper Mills, Kagaz Nagar Paper 138300 Bamboo 295020/ 4917
4 Sri Rayalaseema Paper Mills, Kurnool Paper 42000 Bamboo No Supply
5 Andhra Pradesh Rayon’s Ltd. Eturunagaram, Warangal Rayan Grade Pulp 26250 Hardwood
Eucalyptus No Supply
6 Navopan India Ltd., Patancheru Particle Boards 19200 Hardwood No Supply
7 Godavari Plywood Ltd., Rampachodavaram Plywood 15.0 Lakh Sq.Mts
(6000 Cum) Non-teak No Supply
8 Hyderabad Plywood Ltd., Nacharam Plywood 1.6 lakh Sq.K.M.
(640 Cum) Timber Non-Teak No Supply
Source: Forest Department
303
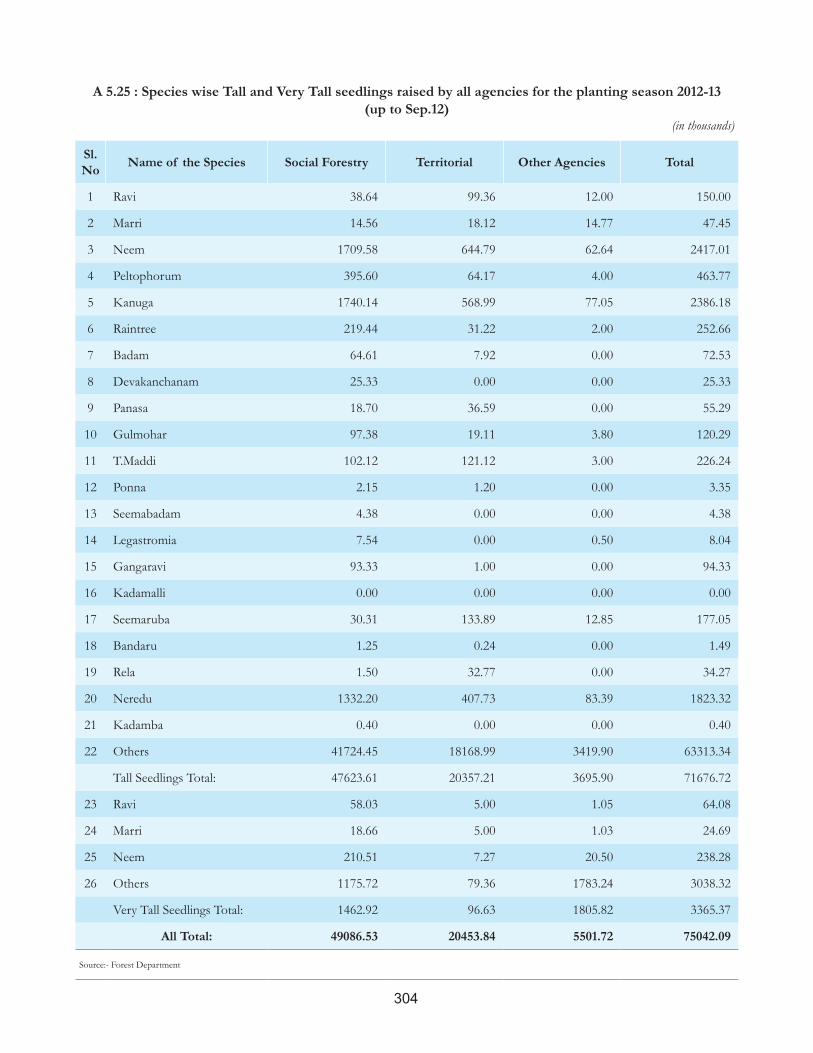
A 5.25 : Species wise Tall and Very Tall seedlings raised by all agencies for the planting season 2012-13 (up to Sep.12)
(in thousands)
Sl. No Name of the Species Social Forestry Territorial Other Agencies Total
1 Ravi 38.64 99.36 12.00 150.00
2 Marri 14.56 18.12 14.77 47.45
3 Neem 1709.58 644.79 62.64 2417.01
4 Peltophorum 395.60 64.17 4.00 463.77
5 Kanuga 1740.14 568.99 77.05 2386.18
6 Raintree 219.44 31.22 2.00 252.66
7 Badam 64.61 7.92 0.00 72.53
8 Devakanchanam 25.33 0.00 0.00 25.33
9 Panasa 18.70 36.59 0.00 55.29
10 Gulmohar 97.38 19.11 3.80 120.29
11 T.Maddi 102.12 121.12 3.00 226.24
12 Ponna 2.15 1.20 0.00 3.35
13 Seemabadam 4.38 0.00 0.00 4.38
14 Legastromia 7.54 0.00 0.50 8.04
15 Gangaravi 93.33 1.00 0.00 94.33
16 Kadamalli 0.00 0.00 0.00 0.00
17 Seemaruba 30.31 133.89 12.85 177.05
18 Bandaru 1.25 0.24 0.00 1.49
19 Rela 1.50 32.77 0.00 34.27
20 Neredu 1332.20 407.73 83.39 1823.32
21 Kadamba 0.40 0.00 0.00 0.40
22 Others 41724.45 18168.99 3419.90 63313.34
Tall Seedlings Total: 47623.61 20357.21 3695.90 71676.72
23 Ravi 58.03 5.00 1.05 64.08
24 Marri 18.66 5.00 1.03 24.69
25 Neem 210.51 7.27 20.50 238.28
26 Others 1175.72 79.36 1783.24 3038.32
Very Tall Seedlings Total: 1462.92 96.63 1805.82 3365.37
All Total: 49086.53 20453.84 5501.72 75042.09
Source:- Forest Department
304

A 5.26 : Achievements made under Sericulture Sector
Sl. No. Item 2006-07 2007-08 2008-09 2009-10 2010-11 2011-12 Apr to Sep
2012
1 2 3 4 5 6 7 8 9
I Mulberry Sector
1 Employment Generation (Lakh Persons) 5.31 4.39 4.16 4.32 4.63 4.88 5.03
2 Mulberry (cumulative area in acres) 106146 87949 82313 86370 92524 97951 100727
3 CBDFLs Production (in Lakh Numbers) 65.95 74.01 86.27 106.18 71.64 74.62 31.91
4 CBDFLs Brushing (in Lakh) 901.44 711.58 703.58 870.53 790.53 894.73 425.49
5Cocoon Production (BV & CB) (in MTs.)
49350 40068 40157 45855 46105 51186 24062
6Raw Silk Production (BV & CB) (in MTs.)
5526 4485 4491 5118 5161 5740 3025
7 Sericulture Farmers (Number) 85471 70818 66608 93875 94360 97950 100000
II Tassar Sector
8 Tasar Food Plantation available for rearing (in acres) 25000 25000 25000 21000 21000 20500 20520
9 Tasar Disease Free Layings (DFLS) Brushed (in lakh) 5.25 6.57 6.86 7.04 9.40 9.40 3.85
10 Tasar Cocoon Production (in lakh numbers) 84.02 69.95 166.67 197.41 125.77 159.62 2.73
11 Tasar Rearers (No.) 3000 3000 3000 1437 1963 2500 1420
III Eri
12 Eri DFLs Brushed (Nos) 2.11 2.55 1.04 1.03 0.83 0.57 0.00
13 Eri Cocoons Production (MTs) 40.80 40.75 8.52 7.31 12.12 8.63 0.00
Source : Sericulture Department
305