a benefit-cost analysis of the wonder world drive overpass
TRANSCRIPT

A Benefit-Cost Analysis of the Wonder World Drive Overpass in San Marcos, Texas
by
Elizabeth J. Ascott
An Applied Research Project (Political Science 5397)
Submitted to the Department of Political Science Texas State University
In Partial Fulfillment for the Requirements for the Degree of Masters of Public Administration
Spring 2006
Faculty Approval: _________________________ Dr. Patricia M. Shields _____________________________ Mr. Roy Hale

Abstract
The purpose of this paper is to two fold. First is to hold a detailed discussion
about benefit-cost analysis and how it is used. The second is to apply the theory of
benefit-cost analysis to a real project: the Wonder World Drive overpass in San Marcos,
Texas. The discussion about benefit-cost analysis looks at how to identify costs and
benefits that are involved in a project and then how to measure these costs and benefits in
dollar amounts. The importance of time and discount rate is discussed and an appropriate
discount rate established. Finally the types of decision criterion are identified and
correlated with the appropriate policy type.
The City of San Marcos has approved funding to build an overpass on Wonder
World Drive in order to bypass the frequent trains that plague the City. This will be the
first train overpass in the city. Because this is the first overpass, there were many
benefits to be considered. The costs and benefits of the project are identified and utilized
in a conceptual framework table. This conceptual framework table is then
operationalized to measure the costs and benefits in dollar amounts.
The Wonder World Drive overpass is a single decision model, meaning that there
are no competing policies decisions. The best decision criterion is to find the Net Present
Value of the project. The Discount rate that has been used is the same that is mandated
by the Office of Management and Budget. Private and social rates are used to show what
the project is worth using varying rates.
The costs and benefits are considered over the life of the project (25 years) and
discounted accordingly to find the present value. Once the present value of each cost and
benefit is know, the net present value of the project is established.

The results show the Wonder World Drive overpass is not a viable project. The
costs exceed the expected benefits at both the private and social discount rates. This does
not necessary mean that this is a poor investment for the City of San Marcos. This
overpass is an important step for the City to bring its transportation infrastructure up to
speed with its rapidly growing population. This benefit-cost analysis can be used as a
model for future proposed overpasses in the area to improve the decision making policy
makers are faced with.
Key words: Benefit-cost analysis, Net present Value, Wonder World Drive overpass,
discount rate

Table of Contents
Chapter One: Introduction……………………………………………………………...7 Purpose…………………………………………………………………………….8
Chapter Two: Literature Review
Introduction…………………………………………………………..…………10 What is Benefit-Cost Analysis?………………………………………………….10 Identifying Costs and Benefits…………………………………………………...13 Project Costs……………………………………………………………..13 Project Benefits…………………………………………………………..14
Measuring Costs and Benefits…………………………………………………...15 Time and Discount Rate………………………………………………………….16 Public vs. Private Rates…………………………………………………..17 Current Discount Rates…………………………………………………..18 Choosing a Discount Rate………………………………………………..19
Decision Criterion: Performing Cost-Benefit Analysis………………………….20 Three types of decisions………………………………………………….20 Selection Criterion……………………………………………………….21
Chapter Summary………………………………………………………………..25
Chapter Three: Setting Introduction………………………………………………………………………26 A Brief History of the Department of Transportation…………………………...26
The City of San Marcos………………………………………………………….27 The Problem San Marcos is Facing……………………………………...29 Wonder World Drive: The Big Picture…………………………………..31 San Marcos Financial Status……………………………………………..32
Identifying Costs and Benefits for Wonder World Drive……..…………………32 Transportation Costs……………………………………………………..32 Right-of-Way Costs……………………..……………………………….33 Maintenance and other Costs.……………………………………............34 Transportation Benefits…………………………………………………..36
Conceptual Framework…………………………………………………………..37 Chapter Summary………………………………………………………………..39
Chapter Four: Methodology Introduction………………………………………………………………………40 Costs……………………………………………………………………………...40 Initial Project Costs………………………………………………………40 Maintenance Costs……………………………………………………….42 Benefits…………………………………………………………………………..44
4

Time Savings…………………………………………………………….44 Accident Reduction………………………………………………………47 Emergency Access……………………………………………………….49 Discount Rate…………………………………………………………………….51 Criterion………………………………………………………………………….51 Chapter Summary………………………………………………………………..51
Chapter Five: Results Introduction………………………………………………………………………52 Costs……………………………………………………………………………...54 Initial Cost………………………………………………………………..54 Maintenance Present Value………………………………………………55 Present Value of Costs…………………………………………………...57 Benefits…………………………………………………………………………..57 Time Savings Present Value……………………………………………..57 Accident Reduction Present Value………………………………………59 Emergency Access……………………………………………………….61 Present Value of Benefits………………………………………………...63 Net Present Value of Wonder World Drive Overpass…………………………...63 Chapter Summary………………………………………………………………..64
Chapter Six: Conclusion Introduction………………………………………………………………………65 Summary…………………………………………………………………………65 Recommendation for Future Research…………………………………………...67
Bibliography…………………………………………………………………………….69
5

Index of Tables and Figures
Chapter 2 Tables and Figures Figure 2.1: Net Present Value Annuity Formula………………………………...22 Figure 2.2: Net Present Value Formula………………………………………….23 Table 2.1: Appropriate Decision Criterion for Policy Types ……………………24 Chapter 3 Tables and Figures Table 3.1: Wait time for Emergency Vehicles…………………………………...30 Table 3.2: Conceptual Framework……………………………………………….38 Figure 3.1: Map of San Marcos, TX.…………………………………………….28 Figure 3.2: Present Value Formula for Conceptual Framework…………………38 Chapter 4 Tables and Figures Table 4.1: Operalization Table…………………………………………………..41 Table 4.2: Maintenance Percentages by Year……………………………………43 Table 4.3: Train and Vehicle time data…………………………………………..45
Figure 4.1: Time Savings Benefit Formula………………………………………47 Chapter 5 Tables and Figures Table 5.1: Population, Vehicle MIF and Households estimates…………………53 Table 5.2: City of San Marcos Cost Estimation…………………………………54 Table 5.3: TxDOT Cost Estimation……………………………………………...54 Table 5.4: Total Project Cost…………………………………………………….55 Table 5.5: Modified Project Cost………………………………………………...55 Table 5.6: Present Value of Maintenance………………………………………..56 Table 5.7: Present Value Costs…………………………………………………..57 Table 5.8: Present Values: Time Savings at Railroad Crossing…………………58 Table 5.9: Present Value for Accident Reduction……………………………….60 Table 5.10: Present Value: Willingness to Pay…………………………………..62 Table 5.11: Present Value Benefits………………………………………………63 Table 5.12 Net Present Value of Wonder World Drive Overpass……………….63
Appendices
Appendix A Definition of Terms………………………………………………………………72 Appendix B San Marcos Police Accident Data..........................................................................74 Appendix C Survey for Emergency Access………….………………..…...………………….76 Appendix D Total Damage Calculation ….…………………………………………………...77
6

Chapter One: Introduction
The paper that follows takes an in-depth look at benefit-cost analysis and how it is
useful in the public sector. The first section of the paper looks at a review of literature
about benefit-cost analysis. The second section sets the stage for a benefit-cost analysis
on a highway improvement project that is underway in San Marcos, Texas. In chapter
four of this paper a discussion about the methodology of how the operationalization of
the costs and benefits of the highway improvement project is done. After a benefit-cost
analysis has been performed the results are discussed and a conclusion is derived from
these results.
Benefit-cost analysis is one of the most widely accepted methods for deciding
whether a public investment is a good use of public resources. Here, the benefit-cost
analysis technique is being applied to the Wonder World Drive overpass in San Marcos
Texas to determine if the project is a good use of funds. By implementing the analysis,
city officials and residents can gain a better understanding about worth of the Wonder
World Drive overpass. Benefit-cost analysis is a technique used in both the private and
public sectors. It has been formally used in the public sector since the 1930’s (Fuguitt &
Wilcox 1999, 3). In 1936, the Flood Control Act mandated a new criterion for public
investment to ensure that measured benefits exceed measured costs (Davisson 1964,
153).
Benefit-cost analysis is particularly useful when considering costly projects like
the Wonder World overpass. Financial resources are scarce in the public sector and
therefore an organization needs to seek out the best return on their investment. Many
7

organizations in the public sector mandate that a benefit-cost analysis be performed prior
to funding any projects. Benefit-cost analysis can be used to set the priorities for an
administration and ensure that tax dollars are spent efficiently and in the best interest of
the public.
Purpose
The purpose of this paper is two fold. First is to review literature regarding
benefit-cost analysis and how it is used. Second is to perform a benefit cost analysis on
the Wonder World Drive overpass in San Marcos, Texas.
It is compelling to examine benefit-cost analysis because it is a widely used and
acceptable method of decision making. Benefit-cost analysis has been in practice in the
public sector for over 60 years (Fuguitt & Wilcox 1999, 3). There are diverse
applications of benefit-cost analysis as a decision making tool to assess things such as;
transportation, education, health and safety programs and the environmental projects
(Fuguitt & Wilcox 1999, 3). This type of analysis evaluates the profitability of a project
by subtracting the costs of the project from the revenues or benefits (Galambos &
Schreiber 1978, 62). This formula is referred to as net present value (NPV) which is
discussed in the literature review chapter.
Cities are continually making improvements to their transportation system in
order to keep a metropolis functioning properly. One such improvement is the proposed
Wonder World Drive overpass in San Marcos, Texas. Benefit-cost analysis is used to
determine whether such an investment is an effective use of resources (Tanadtang 2005,
603). By employing benefit-cost analysis, the City of San Marcos can make better
8

financial investments and thus improve transportation for its residents. (Tanadtang 2005,
604).
The City of San Marcos is facing a crisis situation. The city is geographically
divided by frequently used railroads. Majority of the residents live west of the railroads
while the only hospital is located on the east side of the city. The population growth and
the number of increasing number of trains daily compound the problem. The average
wait time for cars at a railroad crossing is now unacceptable. As a result, City officials
have approved an overpass at one at grade railroad crossing at Wonder World Drive. The
purpose of this paper is to find if this overpass is a viable investment for the City of San
Marcos and what can be learned from this endeavor to possibly improve the planning for
future overpasses in the area.
The Chapter that follows looks at literature on benefit-cost analysis. This chapter
gives a better understanding of what goes into the procedure and all the elements that
need to be considered when performing a benefit-cost analysis. This knowledge is then
used to perform a benefit-cost analysis on the approved Wonder World Drive overpass.
9

Chapter Two: Literature Review
Introduction
The purpose of this chapter is to review the available literature on benefit-cost
analysis. The literature identifies what costs and benefits are how to measure costs and
benefits, the appropriate discount rate for projects, and decision criterion for performing
benefit-cost analysis. Ultimately, this literature review seeks to provide insight and
validation for an analysis of the Wonder World Drive overpass in San Marcos, Texas.
What is Benefit-Cost Analysis?
Benefit-cost analysis is a decision making aid utilized by economists and finance
officers to evaluate a projects worth. The benefit-cost analysis considers the monetary
costs and benefits of a project and enables decision makers to invest resources in a more
efficient manner. But how are costs and benefits identified and measured? What
method should be used for evaluating costs and benefits?
The benefit-cost analysis process has a built in conceptual framework. Once an
analyst can identify what the framework is, the rest falls into place. In a later chapter the
conceptual framework is discussed and spelled out in practice as an operalization table.
Both the conceptual framework and operalization table are key elements when
performing a benefit-cost analysis. Fuguitt and Wilcox (1999, 35) defines benefit-cost
analysis as:
Cost-benefit analysis is a useful approach to assess whether decisions or choices that affect the use of scarce resources promote efficiency. Considering a specific policy and relevant alternatives, the analysis involves systematic identification of policy consequences, followed by valuation of social benefits and costs and then application of the appropriate decision criterion.
10

Benefit-cost analysis is a tool designed to evaluate choices while allocating society’s
scarce resources (Fuguitt & Wilcox 1999, 35).
Eva Galambos and Arthur Schreiber (1978, 62-63) have identified four steps for a
successful benefit-cost analysis. The first step is to identify the cost and benefits of the
project. Second, the costs and benefits are measured in dollars. Third, the costs and
benefits are considered over the life of the project. Finally, a decision must be reached.
In the final stage, the decision maker decides whether this is a project that will produce
enough social benefit to justify the expenditure of limited funds. These four steps
provide a “conceptual framework for assisting decision makers in understanding the
decision situation” (McKenna, 1980, 127). Benefit-cost analysis allows for a conceptual
framework for methodically investigating certain problems of choice (McKenna 1980,
127). Within the four steps are five elements identified by Christopher McKenna:
objectives, alternatives, benefits and cost, a model and a criterion (McKenna 1980, 129).
McKenna defines each element as follows:
The objectives are the desired effects intended to be brought about by the undertaking. Alternatives are the possible uses of resources, or possible approaches to employ. Benefits are results that improve society’s welfare. Costs are resources consumed by the undertaking. A model represents the relationship between qualities of an alternative and the consequences. A criterion is the basis for selecting one alternative (McKenna 1980, 129).
Applying McKenna’s five elements to the Wonder World Drive overpass we see
the objective for the Wonder World Drive overpass is to find if the project is a good
investment for the City. The second element is to evaluate alternatives. In all cost-
benefit projects there are alternatives to weigh against each other. In projects where there
11

is only one proposal (like the Wonder World Drive project) the alternative would be not
to implement the project. Other alternatives are discussed later in the chapter under the
subheading Decision Criterion. The third element is identifying the costs and benefits
that will result from the project. A researcher must be able to identify what costs are
invested into the project and what benefits can be expected from them. The costs and
benefits of the Wonder World Drive overpass are discussed in the Settings chapter of this
paper. Essentially, a cost makes up the negative and benefits the positive. The difference
between the net present benefits (NPB) and the net present costs (NPC) yields the Net
Present Value (NPV) of the project.
There is a difference between the value of current and future dollars. In order to
equate future benefits and costs across time the net present value of benefits and costs is
calculated. This concept is discussed later in the chapter under the subheading Discount
Rate. The fourth element is the model used for the analysis. In the Wonder World Drive
case the model is specified in an operalization table where each cost and benefit is
measured in dollars. The final step is selecting a criterion for evaluating the project. Such
as using net present value or benefit cost ratio.
Benefit-cost analysis is a powerful tool for influencing public decisions.
Kornhauser (2000, 1039) states in his article, On Justifying Cost-Benefit Analysis, that
“cost-benefit analysis is both a theory and a practice”. Kornhauser goes on to break
down the practice of cost-benefit analysis into three parts:
12

(i) A formal theory that derives relations between an individual’s fundamental preferences and a ranking, in terms of money, of policies (ii) A theory of measurement that identifies real world correlates of the theoretical entities manipulated in the formal theory (iii) Applications of the formal theory and theory measurement to specific policy decisions (Kornhauser 2000, 1039).
The formal theory proposed by Kornhauser assumes that individuals will have a well-
defined policy preference that will best serve their needs. Individual needs can be found
through survey techniques (Kornhauser 2000, 1039). The needs of the individual can be
satisfied through the benefits that a project or policy will provide. In the case of the
Wonder World Drive overpass the need is determined by measuring how many people
are using the road. This is discussed in the methodology chapter of this paper.
Once the costs and benefits are known, they can be measured in market values. These
market values are then applied to a decision criterion to establish the worth of a policy or
project.
Identifying Costs and Benefits
Project Costs
Project costs are the value of goods and services that are required for a project.
This includes initial and recurring costs of the project (Davisson 1964, 153). Some of the
initial costs include: research and development, planning, testing and evaluation, training,
land acquisition, building facilities, vehicles and equipment (McKenna 1980, 134).
Recurring costs are those costs that are necessary to keep a project or program running.
Recurring cost can include: personnel, materials, rental of building and equipment,
maintenance, administrative overhead, education, and security and insurance.
Maintenance costs are those cost that will occur throughout the life of the project. They
13

include roadside maintenance, drainage, and structure up keep. These maintenance types
are categorized as routine, preventive and major maintenance (McKenna 1980, 134).
In addition to traditional costs, analysts should consider social costs. Social costs
are “what a community gives up in undertaking a project” (Galambos & Schreiber 1978,
64). These social costs are sometimes labeled as non-tangibles because they are difficult
to measure in dollars. “Environmental effects such as increased air or noise pollution and
flooding from increased storm water runoff” are common social costs included in benefit-
cost analysis (Galambos & Schreiber 1978, 64). Other social costs are the
inconveniences people experience during the initial construction of physical
improvements. A cost-benefit analysis should include any social costs and benefits,
however, these “may be divided into local and non local components for presentation to
local decision makers” (Galambos & Schreiber 1978, 72).
Project Benefits
Benefits are what a community or stakeholders can expect to gain from a project
or policy. In the case of Wonder World drive, the benefits are outlined in the conceptual
framework (table 3.2). These benefits are intended to make at least some of the
population better off then they were before. For example, time travel saving is
considered a project benefit. However, the benefits may not be distributed equally
among the residents. Motorists who don’t use Wonder World Drive on a regular basis
will not experience the same degree of benefits as those residents who frequent Wonder
World Drive. Yet all residents are treated the same in regards to the burden of cost.
Project benefits are weighted against project costs in the Net Present Value
formula. “Benefits in the comprehensive sense include all outputs of the process or
14

consequences of an alternative” (McKenna 1980, 142). According to Kornhauser (2000,
1039) “benefits are usually defined solely in terms of the change in individual well-being
that the policy induces … individual well-being is understood as the satisfaction of
subjective preferences”. These subjective preferences can be measured in the market
choices that individuals make. In a benefit-cost analysis, it is necessary to measure
subjective benefits in monetary terms to ensure that apples are not being compared to
oranges (Kornhauser 2000, 1039).
Measuring Costs and Benefits
Once the benefits and costs have been identified, the second step is to measure or
assign a dollar amount to each benefit and cost. Many scholars argue that flaws of
benefit-cost analysis occur during the measurement of costs and benefits. Too often
analysts will leave out or incorrectly measure costs and benefits. Often there will be
benefit and cost variables that are difficult to measure in market value. These are referred
to as intangibles. Fuguitt and Wilcox have three principles for measuring intangible
variables:
When a policy has hard-to-measure effects, the analyst should (1) value as many benefits and costs as possible using monetary units; (2) if unable to assign a monetary value to a particular policy consequence, try to quantify it in physical units; and (3) in the especially difficult situation where the consequence eludes quantification of any kind, identify and describe it qualitatively (Fuguitt & Wilcox 1999, 173).
When performing a cost-benefit analysis using unmeasured variables, a decision maker
can estimate a threshold. “Intuitively, the decision maker can weigh the unmeasured
benefits and consider whether or not these exceed the threshold” (Fuguitt & Wilcox 1999,
173). It is important to “measure all variables in terms of dollars so you are not
15

comparing apples to oranges” (Galambos & Schreiber 1978, 62). There are a number of
ways to measure intangibles. It is important to note that the analyst cannot “include
increased profits from a business as a social benefit because there is a decrease in profit
sales elsewhere” (Galambos & Schreiber 1978, 71).
Opponents of cost-benefit analysis argue “that in practice cost-benefit analysts
tend to undervalue decision consequences that are difficult to monetize or, worse yet, use
this technique to mask the real value choices that underlie judicial, administrative, or
legislative decisions” (Markovits 1984, 1169).
The operalization of the variables is discussed and measured in the methodology
chapter of this paper. The operalization of the costs and benefits is considered over time.
To do this future costs and benefits must be measured using the appropriate discount
rates.
Time and Discount Rate
The concept of time is important in a benefit cost analysis because the costs and
benefits of a project occur throughout its useful life. The “underlying time value of
money is the basis for employing interest rates, (also known as discount rates) in
assessing the present value of future costs and benefits” (McKenna 1980, 135). The
concept of a discount rate is central to an economic analysis because the discount rate
“allows effects occurring at different times to be compared by converting each future
dollar amount into equivalent present dollars” (Weitzman 2001, 260). Future benefits are
worth less than present benefits, which reduce the monetary value of future benefits. In
addition, the higher the discount rate the lower the value of future benefits. For example,
16

the benefits of the Wonder World overpass will not be worth the same after 25 years. If a
higher discount rate is used for this project, the future benefits are worth even less.
Selecting a suitable time horizon of the benefit and cost stream is important.
“Ideally the time horizon should include the entire time period over which policy benefits
and costs occur” (Fuguitt & Wilcox 1999, 133). The time horizon is often looked at as
the useful life of the capital investment as determined by engineers or manufacturers
(Fuguitt & Wilcox 1999, 133). If the time period is capriciously shortened, it is likely to
lower the Net Present Value of the project by “reducing the future benefit stream”
(Fuguitt & Wilcox 1999, 133). Likewise, a lengthened stream can unreasonably increase
the benefits in the future and skew the decision criterion.
Public vs. Private Rates
Selection of an appropriate discount rate has a significant impact on the outcome
of a benefit-cost analysis. As shown below, rates can be selected from two general
categories: public and private. Furthermore, there is debate about the appropriate
discount rate.
The discount rate is used for discounting future costs and benefits. Martin L
Weitzman states that “the most critical single problem with discounting future benefits
and costs is that no consensus now exists, or for that matter has ever existed, about what
actual rate of interest to use” (Weitzman 2001, 260). William Davisson argues that the
rate should be the market rate or the market opportunity cost i.e. private rate (Davisson
1964, 155). David Newbery agrees with this theory stating that “the appropriate rate of
discount to use in selecting public investment…is the private discount rate” (Newbery
1990, 235). The private discount rate is the rate a private business would use to borrow
17

for a project. On the other hand, Grout (2002, 2) argues the social discount rate is
appropriate because “public sector rates should be lower because the public sector can
pool risks”. Hence, the social rate of discount (or the rate private citizens receive on
savings) is also advocated as the appropriate discount rate. Recent literature supports a
private or market value discount rate for public investments to ensure the best return on
investment.
Paul Grout, author of Public and Private Sector Discount Rates in Public-Private
Partnerships states “lower discount rates should be used for the public sector than the
private sector. Failure to do so will suggest that private provision is less efficient than
public since the present value of private provision will be overestimated relative to
public” (2002, 9). The decision of what discount rate is appropriate comes down to the
difference between liberals and conservative views about the role of government
investments. High discount rates are consistent with a smaller government. The reverse
is true for a low discount rate.
Current Discount Rates
There are three government agencies that implement discounting for capital
expenditure projects; the Office of Management and Budget (OMB), the Government
Accountability Office (GAO), and the Congressional Budget Office (CBO) (Mikesell
2003, 260). The OMB sets the discount rate for most all executive agencies. Currently
the discount rate set by the OMB is 7% (Mikesell 2003, 260). The GAO “uses a discount
rate based on the average nominal yield of marketable Treasury debt with maturity
between one year and the life of the project, with benefits and costs in nominal terms”
(Mikesell 2003, 260). Finally, the CBO “Uses the real yield of Treasury debt and
18

estimates that rate to be 2% with a sensitivity analysis of 2% points to test variability. As
mentioned the discount rate can affect the outcome significantly. When selecting a rate,
an analyst must consider what type of project they are considering.
The current discount rate used by the OMB since 1992 is 7%. Prior to 1992 the
discount rate was 10% (Fuguitt & Wilcox 1999, 116). In 1972 the OMB set the discount
rate at 10% and required all government agencies to use this rate. This discount rate
“was equal to the alternative rate of return on private investment” (Fuguitt & Wilcox
1999, 116). This rate was said by many to be “too high and unfairly penalize desirable
government policies” (Fuguitt & Wilcox 1999, 116). As a result the OMB lowered the
discount rate to its current value of 7%. One reason for lowing the rate is to obtain a
higher return on future benefits (Fuguitt & Wilcox 1999, 112).
Choosing a Discount Rate
When choosing a discount rate the analyst can use a high, moderate, or low rate.
It is beneficial to use more than one discount rate in order to compare the influence of
changing discount rates on the viability of a project. By using a variety of discount rates,
the analysis demonstrates more objectivity. At the Spring 2006 Microeconomics Theory
Workshop at Yale University, Jean-Fancois Mertens and Anna Rubinchik-Pessach
presented their paper entitled “Intergenerational Equity and the Discount Rate for Cost-
Benefit Analysis”. In their paper they discussed the discount rates that are being used
today.
Circular A4 of the U.S. Office of Management and Budget (September 2003) mandates that all executive agencies and establishments conduct a regulatory analysis for any new proposal, and more specifically (pp 33-36), a cost-benefit analysis, at the rates of both 3% and 7% (2006, 1).
19

In a footnote, the authors explain that both of these rates are rational. The 3% interest
rate is the rate relative to private savings and the 7% rate is “relative to capital
formulation and /or displacement, i.e. as the gross return on capital” (Mertens &
Rubinchik-Pessach 2006, 1).
For this paper and the cost-benefit analysis that is to be performed on the Wonder
World Drive overpass, the discount rate of 3% and 7% will be used as mandated by the
Office of Management and Budget.
Decision Criterion: Performing Cost-Benefit Analysis
Three types of decisions
Once the costs and benefits of the project have been identified and measured, the
time horizon determined, and discount rate established, the analysis can be performed to
evaluate the project.
There are three kinds of general decision types that have been identified by
Fuguitt and Wilcox (1999, 81); (1) one decision, (2) several alternatives that are mutually
exclusive and (3) several alternatives that are not mutually exclusive. Benefit-cost
analysis is intended to evaluate options or alternatives. In the case where only one
program or project is being evaluated (1), the alternatives are to either proceed with the
project or not to proceed (Fuguitt & Wilcox 1999, 81). When a policy maker is faced
with several alternatives that are mutually exclusive (2) the choice is which one to
implement. Mutually exclusive alternatives are those where only one can be executed
because of scarce resources. When faced with several polices that are not mutually
exclusive (3) the decision maker can choose a subset of alternatives to employ the best
use of funds (Fuguitt & Wilcox 1999, 81).
20

Selection Criterion
There are a variety of methods for selecting the best policy; Pareto criterion, Pay
back period, Net present value, Present Value, and benefit-cost ratio. The Pareto
criterion is the most conservative approach to deciding capital projects. This section will
discuss each and then identify which is the best criterion for the Wonder World Drive
overpass.
The Pareto criterion states that a project is economically feasible if “no one is
worse off and at least someone is better off” (McKenna 1980, 148). If this standard were
used for all public projects, few would ever be implemented. “Cost-benefit analysis is
concerned with achieving economic efficiency in the use of resources, regardless of who
derives the benefits and who bears the costs” (Galambos & Schreiber 1978, 73). In other
words, benefit-cost analysis does not look at fairness of the distribution of cost (e.g., does
not use the Pareto criterion).
The pay back period (PBP) is the weakest measure with regard to evaluation of a
proposed project. The PBP does not take into account the time and value of money.
Payback period can be found by dividing the initial capital outlay (ICO) by the annual net
flow (S). Annual capital flow can be found by subtracting annual expenditures from
annual benefits.
SICOPBP=
Net Present Value (NPV) simply requires that the benefits exceed the cost of a
project. “Alternately expressed, the position states that the total improvement by the
21

gainers outweighs the combined setback of the losers, or the benefit-cost ratio is greater
than one” (McKenna 1980, 148). This is a strong measure of the worth of a project.
The project present value is a measure that is often used in conjunction with cost-
benefit ratio. These two criterion allow for good decision making because they take into
account the time and value of money. Project present value is essentially the present
value of a project using the annual capital flow S which is the annual benefits minus
annual expenditures, the discount rate r and, the useful life of the project in number of
years n. The present value annuity formula requires constant annual net flow for multiple
years.
Figure 2.1 Present Value Annuity Formula
yearsofNumbernrateDiscountr
FlowNetAnnualS
rrSPV
n
===
⎥⎥⎦
⎤
⎢⎢⎣
⎡⎟⎠⎞
⎜⎝⎛+
−=1
11
The Project benefit-cost ratio is found by dividing the present value of the project
by the initial capital outlay (McKenna 1980, 148). Ideally, projects with a high benefit-
cost ratio are chosen, but the ratio must be greater than one to be considered (Galambos
& Schreiber 1978, 70). “This measure is not influenced by the size of the investment,
and so it better compares different-sized alternatives” (McKenna 1980, 148).
According to the Kaldor-Hicks criterion, a single policy promotes efficiency if the
social benefits outweigh the social costs (Fuguitt & Wilcox 1999, 82). In a single
decision scenario, the best evaluation method is to find if the Net Present Value (NPV) is
22

positive. NPV is the present value of incremental net benefits generated throughout the
policy time horizon. The NPV is the present value of the benefits (PVB) minus present
value of the costs (PVC). The details of the NPV calculations are found in Figure 2.2.
NPV = PVB – PVC
In the year in which the initial expenditure is made, the exponent will be set at zero (this
is because the cost is already at present value) and increase to represent each year of the
project. All of these will be added together to find the PVB and PVC (Fuguitt & Wilcox
1999, 76-77).
Figure 2.1 Net Present Value Calculations
( )Tn
Tn
rB
rB
rB
rB
rB
PVB
rC
rC
rC
rC
rC
PVC
+++
++
++
+=
+++
++
++
+=
1.....
)1()1()1()1(
)1(.....
)1()1()1()1(
33
22
11
00
33
22
11
00
To find the PVB and PVC an analyst use the following formulas:
( ) ( )
rateDiscountrprojectofyearFinalT
iyearinCostsCiyearinBenefitsB
rC
CPVCWherer
BPVBWhere
i
i
T
ii
iT
ii
i
==
==
++=
+= ∑∑
== 11 11
The expression B represents the incremental benefits, and C represents the
incremental costs in one year. To find the surplus value generated by the policy an
analyst can take the total benefits minus the total costs to find the net benefits for society
(Fuguitt & Wilcox 1999, 45). Further, the incremental benefits can be found by taking
23

the benefits with the policy minus the benefits without the policy. The same formula can
be used for incremental costs. (Cost with the policy) – (costs without the policy) =
Incremental costs (Fuguitt & Wilcox 1999, 58). “Net present value is the present value
of incremental net benefits generated throughout the policy time horizon. If the PVB out
weighs PVC then the net benefits are positive, (NPV > 0) and from society’s perspective,
pursuing the policy promotes greater efficiency then not pursuing it” (Fuguitt & Shanton
1999, 82). According to Fuguitt and Shanton, when evaluating one policy or project the
best decision criterion is NPV.
Table 2.1 is found in Fuguitt and Wilcox (1999, 91) Cost Benefit Analysis for
Public Sector Decision Makers. This table expresses the alternatives for policies and
what types of criterion should be used for each.
Table 2.1 Appropriate Decision Criterion for Policy Types Alternatives Criterion
1. One Policy: Implement? NPV > 0
2. Mutually exclusive policies: Choose one Maximum NPV 3. Several Policies: Choose a subset a. Dependent policies i. No budget constraints Find possible combinations, maximum
NPV ii. Budget constraints Find affordable combinations, maximum
NPV b. Independent policies i. No budget constraints All policies with NPV > 0
ii. Budget constraints Find affordable combinations, maximum NPV; rank by B/C for supplementary information
24

Chapter Summary
In sum, benefit-cost analysis is a useful tool for policy makers. It allows an
analyst to measure the costs and benefits of a project, put them into monetary values and
weigh alternatives. Even though public choices are political and no computerized, sterile
analysis can substitute for political discourse, a thorough benefit-cost analysis can supply
policy makers with information to allocate scarce resources and make tough policy
decisions. Flexibility in application of the analysis is an attractive feature since it offers a
variety of criterion to evaluate a project and allows for a range of discount rates to be
used. While not infallible, these elements of benefit-cost analysis tend to insulate the
method considerably from much scrutiny when policy choices are made.
25

Chapter Three: Setting
Introduction
Now that cost-benefit analysis has been discussed, the focus turns to a practical
case where it is applied. Funding has been approved for a four lane overpass on Wonder
World Drive to bypass the existing railroad tracks. This is a joint project between the
City of San Marcos and the Texas Department of Transportation. Since two entities are
involved in this project it is important to discuss each. This chapter first looks at the
history and function of the Department of Transportation. Second, a needs assessment
for the City of San Marcos is developed to justify why an overpass is needed. The costs
and benefits of the project are identified in the needs assessment.
A Brief History of the Department of Transportation
President Lyndon B. Johnson made the Department of Transportation (DOT) a
cabinet level department in 1966 (Barnsness 1970, 500). Once it became a more
powerful agency it allowed for more concise implementation of highway projects
throughout the United States. The purpose of the DOT is to develop “a coordinated
transportation system that permits travelers and goods to move conveniently and
efficiently from one means of transportation to another, using the best characteristics of
each” (Barnsness 1970, 500). From the cabinet level DOT sprang new agencies to assist
in the efforts of efficient transportation. The Federal Highway Administration
incorporates the Bureau of Public Roads and the Highway and Traffic Safety Bureau.
These agencies handle the federal highway planning and construction, and the
supervision of extensive programs of federal aid to highways (Barnsness 1970, 503). A
26

significant percentage of the DOT budget goes to the funding of Federal highways. The
Wonder World Drive overpass is not a federal highway, but the overpass is being funded
with some State money. It is necessary to have a better understanding of the DOT so the
City can comply with good policy practices when using the State of Texas’ money.
Because of this, it is worth looking at the costs and benefits that arise in a highway
improvement project.
The City of San Marcos
In 2000 San Marcos had a population of 34,733 (U.S. Census Bureau 2000). In
2004 the population grew to an estimated 44,769. It is anticipated the population will
exceed 70,000 by 2020 (U.S. Census Bureau 2000). The increase of population means
the City is charged with accommodating and sustaining this growth. President Johnson
once said that “The life of a city depends on an adequate transportation system” (Dodson
1969, 373). To have an adequate transportation system a city must have enough
infrastructures to transport its citizens efficiently.
27

Figure 3.1 Map of San Marcos, Texas
Image obtained from the City of San Marcos Web Site
28

The Problem San Marcos is Facing
San Marcos has a few unique characteristics that make growth and transportation
planning more challenging. San Marcos houses Texas State University which has a
student body of 26,000. This represents almost 29% of the San Marcos population (San
Marcos Trends 3-10). A significant percentage of students housing is on the other side of
the railroad track from Texas State University. Many students and faculty commute from
Austin and San Antonio and must cross the railroad tracks to get to the university.
The first unique feature of San Marcos is the high volume of trains that pass
through daily. The City Manager of San Marcos, Dan O’Leary estimates that 30 trains
pass through the city daily, and the number of carrier cars is increasing the length of the
trains. The increased length of trains results in longer wait times at railroad crossings.
The City of San Marcos is geographically divided by a heavily used railroad
system. There are 68 at-grade railroad crossings in the city (San Marcos Press Release
October 25, 2001). Currently, there are no bridges to overpass the railways. The only
hospital in the city is located on the east side of the train tracks while many of the citizens
reside west of the train tracks. The City of San Marcos web page states that, three-
fourths of the City’s population lives west of IH-35 and one-fourth live east of the
Interstate.
The only Hospital is located less than a mile east of IH-35. With the high volume
of trains and no overpass, the likelihood of being stopped by a train when trying to get to
the hospital is increased. At peak traffic hours the delay time is increased by train
impediment. The train delay has immeasurable negative affects on citizens’ health and
29

safety. With no existing train overpass, both citizens and emergency officials run the risk
of being stopped by a train in an urgent situation.
The city has experienced train derailments, train vehicle collisions, and pedestrian
injuries caused by trains. All of these instances caused roadways to be impassable for
extended periods of time. Having uninterrupted access to the hospital would be a great
benefit for the residents of San Marcos.
The trains are not only an inconvenience for residents, but a safety issue for
emergency officials. The San Marcos Police Department reports the average number of
emergency vehicles (fire, police, and EMS) that were stopped by trains was 488 between
2003 to 2005. The average wait time for these emergency response vehicles was 2
minutes and 45 seconds. Table 3.1 shows emergency vehicles that were stopped by trains
when responding to a call.
Table 3.1 Wait time for Emergency Vehicles in San Marcos
Year Emergency Vehicles stopped at train crossing Average wait time
2003 415 1:28 min 2004 516 4:03 min 2005 534 2:46 min
Average (2003 to 2005) 488 2:45 min
These figures represent the wait time that emergency vehicles experience. This is a
safety concern for the citizens of San Marcos. Table 3.1 is difficult to operationalize.
Because of the varying calls that officials were responding to there it is hard to know how
much could have been saved in dollars by avoiding waiting for a train. These numbers
do however give an accurate picture how the trains affect citizens and officials in
emergency situations.
30

Wonder World Drive: The Big Picture
A part of the overpass project is the extension of Wonder World Drive to Ranch
Road 12. The overpass and extension are independent projects financially, but are
dependent on each other to increase traffic flow in the City. The description and purpose
of the Wonder World Drive extension project is found in the San Marcos Capital
Improvement Program project input form. This description includes the overpass as a
central part of the project. The description reads as follows:
The Wonder World Dr. Extension Project is a 3 mile roadway construction project which will extend Wonder World Dr. from the proposed railroad overpass to Hunter Road (FM 2439) to RM 12, west of the San Marcos City Limit. The project will improve local and region transportation mobility and safety in and around San Marcos by providing an east/west alternative to RM 12, reducing g existing and future traffic volumes and delays through San Marco’s downtown and historic neighborhoods, reducing truck traffic through San Marcos and substandard intersections/roadways, connecting emergency management facilities to the east with west San Marcos via unrestricted railroad crossing route utilizing the city’s only planned railroad overpass. As part of the Minute Order approved by TxDOT, the City will acquire ROW, conduct the environmental assessment, fund mitigation measures and complete construction plans. 1
The purpose statement has identified many of the costs and benefits that are expected
from this project. The remainder of this chapter identifies the expected costs and benefits
of the project.
1 Wonder World Drive is a two part improvement project. First is the railroad overpass and second is to extend Wonder World Drive to RM 12. For this benefit-cost analysis the overpass is the only focus, but it is important to see how the overpass will facilitate the extension of the road.
31

San Marcos Financial Status
The City of San Marcos residents are not wealthy. The San Marcos Horizons
report in 2004 found that the median family income is $37,113. The U.S. Department of
Housing and Urban Development reported that almost 71% of residents were classified as
low to moderate income (San Marcos Horizons 2004, 22). The financial status is
improving for residents. Between 1990 and 2000 the average income of San Marcos
residents increased 30% (adjusted for inflation). This averages to 3% annually (San
Marcos Horizons 2004, 23). This annual income and annual growth is used in the
methodology chapter to operationalize the benefits of time savings and accident
reduction.
Identifying Costs and Benefits for Wonder World Drive
Transportation Costs
The Wonder World Drive overpass is a joint project between the City of San
Marcos and the Texas Department of Transportation. As stated in the San Marcos
Capital Improvement document, the City has acquire the Right of Way (ROW),
conducted the environmental assessment, funded mitigation measures, completed
construction plans and additional amenities for the overpass2. The Texas Department of
Transportation will be responsible for funding the remaining costs such as construction
costs which take into account the materials needed, wages for workers, insurance, and
machinery.
2 The City has chosen to add a bike lane to the overpass. This cost will be the responsibility of the City of San Marcos.
32

The initial cost of the project is determined by engineers and the cost is final once
a bid for construction is accepted. The project costs are estimated for the useful life of
the project. The useful life of the project is the time period where no major repairs or
improvements are expected. Engineers have determined the useful life of the Wonder
World Drive project to be twenty-five years. No significant improvements, expansions or
major repairs are expected during this time.
Right-of-Way Costs
The right of way (ROW) acquisition can be very costly (in both time and money)
for transportation projects. In 1999 the federal government spent 4% of the federal
highway funding on ROW acquisitions (Hakimi & Kockelman 2005, 2). In some cases
eminent domain must be used to acquire the needed land for a highway improvement
project. Eminent domain falls under both a monetary cost and a non tangible cost to
society. “A useful indicator of time, cost and customer satisfaction in ROW acquisition
is the agency’s rate of property condemnation. The condemnation rate is the fraction of
parcels acquired through the power of eminent domain. If the acquiring agency and the
property owner cannot reach an agreement, the agency is legally permitted to acquire the
property through its power of eminent domain by filing its case with the appropriate state
or federal agency” (Hakimi & Kockelman 2005, 3). The process of eminent domain can
increase the cost of ROW acquisition. It is best for a city to avoid this type of
condemnation by looking at the city’s master plan early and evaluating what kind of
projects are to come. It is best to acquire the needed land early to avoid inflated cost
once the project is in the latter stages of planning (Williams 2004, 23). In addition to the
land itself, other costs involved in ROW include appraisals, damages, attorney fees,
33

administrative settlements, court costs, relocation costs, demolition, abatement, and clean
up for contaminated sites (Williams 2004, 10). Measuring the cost of ROW acquisition
can be complicated by the use of eminent domain as well as other unforeseen costs
mentioned above. The cost of Right-of-Way is necessary for all road improvements.
Planning can help to limit or reduce these kinds of costs.
The City of San Marcos is funding the ROW acquisition. The City has issued
General Obligation Bonds to fund part of the ROW. The remaining cost will be taken
from the City’s cash assets. This will be discussed further in the next chapter.
Maintenance and other Costs
Another cost that should be considered in the benefit-cost analysis is the price of
maintaining the project after it has been completed. These maintenance costs are referred
to as recurring costs. Recurring costs can include the utilities, personnel, general
maintenance, repairs, training and the like. These are costs that continue throughout the
life of the project. It can be difficult to speculate exactly how much the maintenance will
be. In the Methodology chapter, a formula has been developed to estimate future
maintenance costs.
The Wonder World overpass cost maintenance will be handled by TxDOT. As
stated, no significant maintenance is expected for the first twenty-five years of the project
as determined by its engineers. Texas Department of Transportation categorizes
maintenance into three areas: Routine, preventive and major (TxDOT Paving the Way
2001). For structures like the Wonder World Drive overpass these three areas are
classified as follows:
34

Routine Maintenance: Repair of substructures, superstructures, decks, joints, approach slabs, and railing and spot painting, repair and operate movable bridges, install temporary bridges, repair and install fender systems Preventive Maintenance: Steel structure cleaning and repainting or install bridge deck protection, joint cleaning and sealing or replacement Major Maintenance: Bridge rehabilitation, reconstruction, or replacement, replacement of structures only as a result of major disaster when no other funds or programs are available. (TxDOT Paving the Way 2001)
Some of annual routine maintenance includes trash pick-up and de-icing in winter
weather. Other maintenance that is performed less often is the re-painting of road
markings and repaving. The Texas Department of Transportation estimates that re-
painting is needed every 3 years and the cost is about $1 a foot.
The overpass has an expected useful life of 25 years. The Texas Department of
Transportation does not anticipate any major maintenance during this time. The routine
and preventive maintenance are recurring costs that will be factored into the cost stream.
Other costs such as traffic lights and signs also need to be considered. Often the
analyst needs to determine if the road improvement will generate enough traffic to
warrant the need for more police officials to patrol and regulate the area. If so, then
additional personnel are a potential external cost of the project. Since it is an external
cost it is not factored into the analysis, however it is important for local budgets to plan
for unexpected expenditures.
The social costs that are involved in a highway improvement are difficult to
measure, but need to be considered to obtain a true benefit-cost analysis. An estimate of
negative environmental effects should be considered in the analysis. A copy of the
35

environmental impact statement (EIS) can be found from city or state offices. An EIS
must be performed on all physical improvements and is a matter of public record that can
be easily obtained. Sabas Avila, the Project manager for the Wonder World Drive
overpass and extension, stated that there were no significant environmental concerns for
the overpass. The Wonder World overpass was labeled as having a FONSI, or Finding of
no Significant Impact on the environment. Because of the FONSI determination, this
analysis does not consider environmental impacts of the project.
The costs that have been discussed are all included in the conceptual framework
for the Wonder World Drive overpass. In the methodology chapter, the costs are
operationalized into dollar values to use in the NPV formula.
Transportation Benefits
Benefits of a highway improvement project are almost always non-tangible;
nevertheless they are important qualitative reasons for including them in the analysis.
With the exception of a toll road that is designed to pay for itself, there are few monetary
benefits. For example one of the most commonly stated reasons for pursuing a highway
improvement project is to relieve traffic congestion and save drivers travel time during
peak hours. The time that motorists save by not waiting is time and money for the
citizens of San Marcos.
If improvements are made to enhance traffic flow, accident reduction can also be
seen as a benefit. The accidents reported for Wonder World drive have been obtained
from the San Marcos Police Department. The type, frequency and time it took to clear the
accidents are considered. There are two ways to look at accident reduction benefit. The
first is to find the most frequent kinds of accidents and estimate the repair costs.
36

Another way to operationalize accident reduction is to look at the time police and other
officials spend at an accident. The time that police are present at the scene is an indicator
of the seriousness of the accident and takes into account the time that other motorists
were delayed because of this incident at the railroad crossing. A more detailed discussion
is found in the accident reduction section of the Methodology chapter.
A unique benefit for the citizens of San Marcos is to have unimpeded emergency
access. Table 3.1 (see above) illustrates the problem that emergency officials are
experiencing with the train delay. This delay is also experienced by citizens trying to
access the hospital. In the Methodology Chapter of this paper the Willingness to pay
model is discussed and utilized to find the monetary benefit for citizens to have
emergency access.
Conceptual Framework
Eva Galambos and Author Schreiber’s (1978, 62-63) first step in a benefit-cost
analysis is to identify the costs and benefits. The conceptual framework for this research
outlines the costs and benefits that will be involved in the analysis. These costs and
benefits where identified through scholarly research. The variables within the framework
are designed to address costs and benefits of the Wonder World Drive overpass project.
A discount rate that takes into account the present value of future benefits will be utilized
in this benefit-cost analysis. The conceptual framework that is used for this research is a
Net Present Value.
Below, table 3.2 outlines the conceptual framework of costs and benefits for the
Wonder World Drive overpass. This is the framework for the benefit-cost analysis that is
to be performed.
37

Table 3.2 Conceptual Framework – Listing of Costs and Benefits
Conceptual Framework Table Research Purpose: To perform Benefit-Cost analysis on the Wonder World Dr. over pass in San Marcos, TX. Costs: Scholarly Support: (IC) Initial Project Costs (M) Maintenance
David (1997), Galambos & Schreiber (1978), Hakimi (2005), Heiner (2005), Litman (1997), Williams (2004)
Benefits: Scholarly Support: (TS) Time travel savings (AR) Accident Reduction (EA) Emergency Access
Barnsness (1970), Davisson (1964), Galambos & Schreiber (1978), Williams (2004)
Discount Rate Scholarly Support Social 3% Private 7%
Miskesell (2003), Mertens & Rubinchik-Pessach (2006)
The Net Present Value (NPV) for this table is illustrated below in figure 3.1
Figure 3.1 Present Value Formula for Conceptual Framework
( )
( )
CostsValueesentPVCitsValueBenefesentPVB
PVCPVBNPV
ratediscountandatcalculatedisrTableseeEAARTSWhereB
rB
PVB
rMICPVC
iiii
ii
i
PrPr
%7%3)2.3(
1
1
==
−=
++=
+=
++=
∑
∑
Construction is the largest cost in the initial project costs for the overpass project.
The construction will provide for a 4 lane bridge and 1 lane frontage roads at railroad
tracks. The construction costs include: Paving, Drainage, Railroad Crossing and
Intersections Signalization. The ROW will pay for land acquisition. Maintenance is a
38

recurring cost and is estimated for the life of the project. Maintenance includes any and
all upkeep and preservation of the bridge. The social cost of the environmental impact
has already been found to be of no significant impact. Therefore environmental costs are
not be used in the NPV formula.
The benefits expected from the project are time travel saving, accident reduction,
and access to hospital. Because this project is paid for and maintained with tax payer
dollars the benefits are intended for the citizens of San Marcos.
Chapter Summary
This chapter discussed the two governmental bodies (Texas Department of
Transportation and the City of San Marcos) responsible for construction and paying for
the Wonder World Drive overpass. The benefits and costs of the project were then
identified. Construction for the overpass began in Summer 2005 and is estimated to be
completed in 2007. The method used to measure the costs and benefits for this project are
discussed in the next chapter.
39

Chapter Four: Methodology
Introduction
This chapter describes the methodology used to operationalize the costs and
benefits identified to calculate the Net Present Value for the Wonder World Drive
overpass. A separate section is devoted to each cost and benefit to discuss how they are
measured as dollar amounts. The last part of this chapter discusses the discount rate and
criterion that is used in the benefit-cost analysis of the Wonder World Drive overpass.
The benefits and costs are operalization in table 4.1 on the following page. This
table illustrates how each cost and benefit is measured in dollars and is a map that can be
used for this chapter.
Costs
Initial Project Costs
Funding for the Wonder World Drive overpass comes jointly from the Texas
Department of Transportation (TxDOT) and the City of San Marcos. The main source of
funding for TxDOT projects is the tax taken from gasoline sales. The City of San Marcos
has funded the right of way costs for the overpass by issuing General Obligation Bonds
and using cash funding. In 1998 San Marcos voters approved the $1.5 million for the
purchase the ROW costs (San Marcos Press Release October 25, 2001). The General
Obligation bonds are voter approved and backed by the property tax. The City issued
$245,000 in General Obligation bonds. This debt is financed at 4.51% interest for 20
years
40

Table 4.1 Operalization Table: Measuring Costs and Benefits
Operalization of Conceptual Framework Table Costs: Measurement: Initial Project Costs: -Construction of 4 lane bridge and 1 lane frontage roads at railroad tracks -Construction costs include:
1. Paving 2. Drainage 3. Bicycle/Pedestrian Lanes 4. Bridges and Major Culverts 5. Railroad Crossing 6. Intersections Signalization
-Estimates project cost in dollars
Maintenance Based on estimates and data provided from TxDOT. A percentage of the initial cost is used for yeari.
Benefits: Measurement: Time travel Savings One-half the median family income in year i
divided by two. This quotient is then divided by the total minutes of work annually or 120,000. To find the total benefit annually the one-half median family income per minute is multiplied by the train time savings times the number of work days in a year, 250. (Galambos & Schreiber 1978, 65)
Accident Reduction To find the benefit of accident reduction the same formula for time savings is used but train time savings is replaced with the average time police spend at accident. The product is added to the estimated cost of repairs for either major or minor accident.
Emergency Access Willingness to pay model to demonstrate citizens’ willingness to pay for emergency access. Residents are asked what they would be willing to pay for emergency access. This average is used for all households in San Marcos.
41

The cash funding for the ROW was $985,0003. In addition to ROW cost, the City
is installing bike lanes for the overpass. This cost is estimated for the bike lane is
$100,0004.
Texas DOT is paying for majority of the cost for the overpass. TxDOT estimates
their cost for the project to be $7,182,934 million plus $629,300 for Planning, surveying
and estimates (PSE)5. The PSE costs were incurred prior to the funding of the overpass.
To find the initial cost of the project the two entities outlays are added together. The City
of San Marcos financed $245,000. The money that has been financed by the City is
financed at a rate of 4.51%; this is the median of the interest rates of 3% and 7%.
Finding the present value of the $245,000 at three and seven percent would cancel each
other out. This makes the present value of the bonds issued $245,000.
Maintenance Costs
The expected maintenance for the Wonder World overpass is routine and
preventative as discussed in the Setting Chapter. Lowell Choate, Director of
Maintenance for the Texas Department of Transportation states that it is difficult to
estimate what the maintenance of a project will be. Choate says that TxDOT estimates
maintenance as a percentage of the initial project cost. The initial project cost for
maintenance does not include the land acquisition ROW or the Planning Surveying and
Estimates, PSE. These are a one time expense and have no recurring cost in the project
3 The ROW cost estimation was obtained from a phone interview with Rondney Gonzales from the City of San Marcos Finance Department. 4 This cost is an estimation from 2002. The final cost of installing bike lanes may change in the final stages of the project. 5 The cost estimate for TxDOT funding was obtained from a phone interview with Danny Stabeno from Texas Department of Transportation
42

that need to be maintained. In the early years of the project, the maintenance is less. The
cost of maintenance increases as the structure ages.
For the first five years of the project, 1% of the initial cost is used to estimate
maintenance (2007 through 2011). Years 2012 through 2016 maintenance cost is
expected to increase to 1.5% of the initial cost. This trend is expected to continue
throughout the life of the project increasing one-half a percent ever 5 years. Table 4.2
illustrates the year and expected maintenance percentage increase.
Table 4.2 Maintenance percentages by year
Year Estimated % for Maintenance
2007 1% 2008 1% 2009 1% 2010 1% 2011 1% 2012 1.5% 2013 1.5% 2014 1.5% 2015 1.5% 2016 1.5% 2017 2% 2018 2% 2019 2% 2020 2% 2021 2% 2022 2.5% 2023 2.5% 2024 2.5% 2025 2.5% 2026 2.5% 2027 3% 2028 3% 2029 3% 2030 3% 2031 3%
43
Benefits
Time Savings
Time savings is one of the most important benefits for the citizens of San Marcos.
The time savings that is expected from this overpass is the time that motorists will not be
stopped waiting for a train. To operationalize this benefit the total daily vehicle delay is
used. This benefit is measured by finding the average number of trains that pass daily
and the average time it takes for them to pass. The roadway is considered blocked when
the safety bars start the descent, blocking motorists, and passable when the safety bars
return to full upright position.
To find the estimated train delay, the City’s engineering department conducted a
study to record the number of trains that came through daily and time delays that vehicles
experience. This data can be found in Table 4.3. This table shows data collected in
2004. The number of trains that pass each roadway daily, the average speed and length
of the trains, the type of traffic control that is in place at the railroad crossing, the number
of vehicles that pass the railway daily, the time delay when a train passes, the number of
vehicles that are stopped by the train, the queue dissipation time, the train delay
movement and the total delay vehicles experience daily are shown in table 4.3.
44
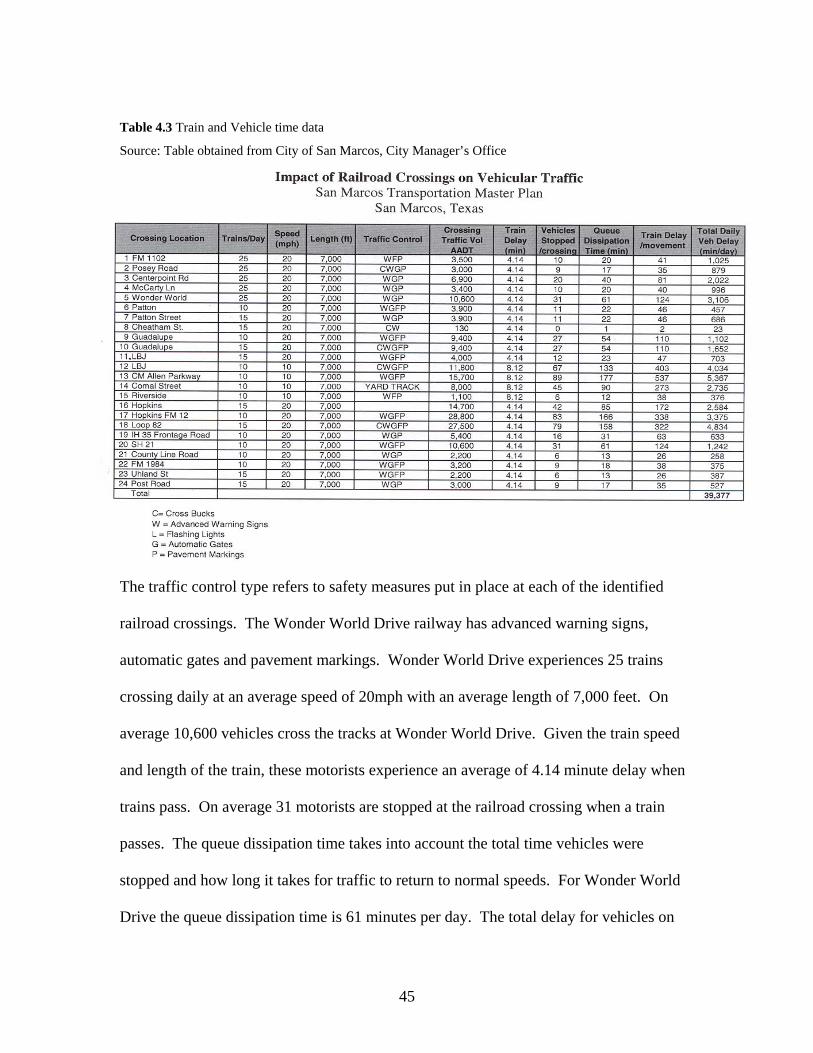
Table 4.3 Train and Vehicle time data
Source: Table obtained from City of San Marcos, City Manager’s Office
The traffic control type refers to safety measures put in place at each of the identified
railroad crossings. The Wonder World Drive railway has advanced warning signs,
automatic gates and pavement markings. Wonder World Drive experiences 25 trains
crossing daily at an average speed of 20mph with an average length of 7,000 feet. On
average 10,600 vehicles cross the tracks at Wonder World Drive. Given the train speed
and length of the train, these motorists experience an average of 4.14 minute delay when
trains pass. On average 31 motorists are stopped at the railroad crossing when a train
passes. The queue dissipation time takes into account the total time vehicles were
stopped and how long it takes for traffic to return to normal speeds. For Wonder World
Drive the queue dissipation time is 61 minutes per day. The total delay for vehicles on
45

Wonder World drive is 3,106 minutes per day. This takes into account the number of
vehicles that are stopped by the train, the wait time they experience and the queue
dissipation time. Using the Texas Department of Transportation estimate of the increase
in vehicles, the total daily vehicle delay is estimated to increase 3% annually.
According to Galambos and Schreiber (1978, 65) the operalization of this benefit
is the total daily vehicle delay in minutes, multiplied by one-half the average gross wage
of San Marcos Citizens. Time is often measured in dollars. For this benefit, the time that
people are waiting represents time they could have been doing things relating to their
daily lives. People measure the worth of their time in the amount they are paid to work.
This earned income is the value of the citizen’s time. To find one-half the gross wage per
year, the median family income in year i is divided by two. This quotient is then divided
by the average number of minutes people work a year or 120,000. The average number
of minutes people work per year is found by multiplying the forty hour work week by the
number of weeks in a year 50. This product gives the number of hours people work per
year, 2,000. To find the minutes worked in a year the 2,000 hours is multiplied by 60
minutes. To find the total benefit of time savings, the equation is multiplied by the
annual time savings (3,106*250). This dollar value is what motorist will save by not
stopping at the Wonder World Drive railroad crossing.
46

Figure 4.1 Time Savings Benefit formula
iyearinIncomeFamilyMedianMIFIMinutesinDelayVehicleVDM
DaysMinutesweekshr
BenefitSavingTimeVDMMFI
i
i
====
=
2505*5060*)50*40(000,120
)250*(*000,120
2
Accident Reduction
Accidents that occur at railroad crossings can be time consuming and dangerous.
This is no exception for San Marcos. Between 2003 and 2005 there were 35 accidents
that police responded to at or near railroad crossings. Of those 35 accidents, eight were at
the Wonder World Drive railroad crossing. Two of the accidents were recorded as major.
One of these was a train pedestrian collision and resulted in the death of a 60 year old
Hispanic male. Accidents occurring at or near railroad crossings take a significant
amount of time to clear and can block traffic for extended periods.
To operationalize the reduction of accidents that occur at railroad crossing
accident reports were obtained from the San Marcos Police Department. This data
contains the date, location, type of accident, brief description, the time the call was
received and the time the accident was cleared (see appendix B). The average time in a
year spent at the scene of a railroad crossing accident in San Marcos is 7 hours 21
minutes. The average time spent at Wonder World Dr in a year is 2 hours 3 minutes.
This causes a delay to motorists. The more serious the accident, the longer the delay
motorists experience. In some cases the accident is serious enough to force the train to
stop. This can cause multiple railroad crossings to be blocked for extended periods of
47

time. In the past three years there have been 2 pedestrians hit by trains. Both incidents
caused the trains to stop, and multiple road closures. The first person survived but with
serious injuries, the second person died at the scene. The injuries and damage
experienced during these accidents are difficult to measure. In some cases the details are
limited.
An ideal way to operationalize would be to know the extent of damage to each car
and person. With this information, estimates from insurance companies could be used to
operationalize this variable. Unfortunately, detailed information is limited about the
incidents. What is available is the time that officers spend at the scene of an accident.
This is time that motorists are delayed. Because there are no overpasses in San Marcos,
when an accident occurs it can affect the city’s entire traffic flow. Again, the Time
Savings formula (see Figure 4.2) is used to calculate a benefit of accident reduction. The
formula however is modified to take into account the police officer time and the cost of
the accident to the parties involved. This number is multiplied by the time that is spent
by police officials at the scene of the accident.
To adjust for annual growth and projected increase of accidents at Wonder World
Drive, an annual increase of 1% is used. It is not appropriate to use the annual vehicle
growth rate or the population growth rate to estimate the increase in accidents. Accidents
are chance occurrences while the population of a city and the number of vehicles on the
road do play a significant role in the number of accidents that occur, the increase of
accidents is not necessarily equal to the increase of population.
In addition, accidents may be major or minor. Major accidents have more
extensive damage to the vehicles than minor accidents. Because there are no details of
48

the extent of damage to the vehicles, a value of $1,000 is assigned to major accidents and
$500 to minor accidents. These values capture the cost of repairs to a vehicle and a
portion of any resulting future medical expenses. This is a very conservative estimate
given the possible costs that occur in accidents. The time savings and damage value are
added to operationalize accident reduction. Based on the San Marcos Police Department
records, in 2003 and 2004 there were 3 minor accidents and 1 major accident each year.
In 2005 there were no accidents reported at the Wonder World Drive train crossing. This
three year average shows that 2 minor accidents occur and 1 major accident occur
annually6.
Emergency Access
A major concern for the citizens of San Marcos is that the railroads divide the
City. A majority of residents live of the west side of the tracks while the only hospital is
on the east side. As stated in the Settings chapter, City officials reported that between
2003 and 2005 on average 488 emergency vehicles (fire, police, EMS) were stopped by
trains while on a call. The average wait time was 2 minutes 45 seconds. It is difficult to
find how many residents have experienced similar delays when in route to the hospital. It
is more difficult to operationalize the medical condition they were experiencing and how
a delay affected their condition. Instead a survey was taken to find an estimate of the
value citizens placed on not being stopped by a train in the event of a medical emergency.
The survey question and format can be found in Appendix C. Forty residents were
surveyed in front of HEB and Wal-Mart (the only grocery stores in the city) and asked:
6 The average of the three years of available data was used. The average for major accidents was rounded to 1.
49

How much would you pay a year to ensure that you or emergency officials (police, fire, EMS) would not be stopped by a train in the event of an emergency?
Respondents were given six answer options:
$1 to $5 $15 to $20 $5 to $10 Greater than $20 $10 to $15 Other amount: The race, age and gender were also recorded.
This method is called the willingness to pay model. The mean is used to
determine what citizens are willing to pay. It is inherently flawed because it utilizes a
hypothetical amount citizens would be willing to pay. Also, respondents have difficultly
differentiating emergency from convenience, especially if they do not have any medical
problems7. The survey results show the residents willingness to pay for the overpass in
regards to emergency access to the hospital and access for Fire, Police and EMS. The
data obtained from the sample is multiplied by the number of households in San Marcos
to find what all residents are willing to pay for the emergency access.
The number of households is used because this would be similar to an annual property
tax. It only taxes households instead of each individual. These hypothetical amounts are
conceptually similar to an annual tax that residents would pay for the overpass, spread
out over the project’s 25 year useful years of life. The willingness to pay estimate was
not measured over time because there is no reason to assume that residents would be
willing to pay more in the future.
7 Some of the respondents commented that they have no medical issues, or that this has never been a problem for them. In such a case I would explain the hypothetical scenario of having an unexpected medical emergency and what it would be worth to not be stopped by a train. Other respondents questioned how I could put a dollar value on pain and suffering or life itself. I would explain that I was not putting a monetary value on life, but what people would be willing to pay to not be stopped by a train in an emergency.
50

Discount Rate
The discount rate that is used in the benefit-cost analysis significantly influences
the outcome of the present value. In the literature review there was much discussion
about whether a private or public rate should be used for public projects. For this benefit-
cost analysis both rates are applied as a sensitivity analysis to show the net present value
under different conditions. As mentioned the Office of Management and Budget
mandates that all executive agencies and establishments conduct a regulatory analysis for
any new proposal, and more specifically a cost-benefit analysis, at the rates of both 3%
and 7% (Mertens & Rubinchik-Pessach 2006, 1). Thus the present value of the Wonder
World Drive overpass is found at a private discount rate of 7% and a social discount rate
of 3%.
Criterion
The criterion that is used in the benefit-cost analysis also plays a major role in the
results. Fuguitt and Wilcox (1999, 91) states that if only one project is considered the
best decision criterion is net present value. Since the Wonder World driver overpass is
not being weighted against any other project, the net present value of the project is the
best decision criterion.
Chapter Summary
This chapter explains the method used to operationalize the costs and benefits for
the Wonder World Drive overpass. The project will use both private and social rates so
that a comparison is possible. The criterion that is used for this project is the net present
value. This is a single project not weighted against any other project, if the net present
value calculation is positive, then the project meets the test and should be built.
51

Chapter Five: Results
Introduction
This chapter presents the results of the benefit-cost analysis performed on the
Wonder World Drive overpass. The results discuss the outcome of each present value of
the benefits and costs. As discussed in the Literature Review Chapter, multiple discount
rates were applied. The social rate of 3% and private rate of 7% are used. The City of
San Marcos estimates the population growth is 5% annually, but for a more conservative
estimate a 3% annual growth rate is used. The Texas Department of Transportation
reports that the increase in motor vehicles is 3% annually. This rate is used to show the
expected increase of vehicles using Wonder World Drive. The median family income is
reported to have a growth rate of 3% annually. Finally, the estimated number of
households in San Marcos has a 2% growth rate8. These annual growth rates for
population, motor vehicles and median family income are used in the Present Value
formula for the benefits of the Wonder World Drive overpass (see table 5.1).
8 This figure is an estimate. No scholarly support was found for rate of increase of households. The rate of increase for population is 3%, so a lower rate should be used for growth of households i.e., 2%.
52

Table 5.1 San Marcos annual growth for: Population, Vehicles, Median Family Income and Households
Year Estimated Population
Estimated Vehicles per
day on Wonder World
Drive
Median Family Income (MFI)
Estimated Total number
of Households
3% Increase 3% Increase 3% Increase 2% Increase 2004 44,769 10,600 $ 37,113.00 12,660 2005 46,112 10,918 $ 38,226.39 13,704 2006 47,495 11,246 $ 39,373.18 13,978 2007 48,920 11,583 $ 40,554.38 14,257 2008 50,388 11,930 $ 41,771.01 14,542 2009 51,900 12,288 $ 43,024.14 14,833 2010 53,457 12,657 $ 44,314.86 15,130 2011 55,060 13,037 $ 45,644.31 15,432 2012 56,712 13,428 $ 47,013.64 15,741 2013 58,413 13,831 $ 48,424.05 16,056 2014 60,166 14,246 $ 49,876.77 16,377 2015 61,971 14,673 $ 51,373.07 16,705 2016 63,830 15,113 $ 52,914.26 17,039 2017 65,745 15,566 $ 54,501.69 17,379 2018 67,717 16,033 $ 56,136.74 17,727 2019 69,749 16,514 $ 57,820.84 18,082 2020 71,841 17,010 $ 59,555.47 18,443 2021 73,996 17,520 $ 61,342.13 18,812 2022 76,216 18,046 $ 63,182.40 19,188 2023 78,503 18,587 $ 65,077.87 19,572 2024 80,858 19,145 $ 67,030.21 19,964 2025 83,284 19719 $ 69,041.11 20363 2026 85,782 20311 $ 71,112.35 20770 2027 88,355 20920 $ 73,245.72 21185 2028 91,006 21548 $ 75,443.09 21609 2029 93,736 22194 $ 77,706.38 22041 2030 96,548 22860 $ 80,037.57 22482 2031 99,445 23546 $ 82,438.70 22932
Source: 2000 U.S. Census and San Marcos Horizon 2004
The year that data became available was in 2004. The Wonder World overpass is not
scheduled to open until 2007. Since the project has a useful life of 25 years the present
value calculations begin in 2007 and end in 2031. The 2004 data has been used to find
the subsequent figures. The formula used to find the total present value is found in
Figure 2.1 as discussed in the Literature Review Chapter.
53

Costs
Initial Cost
The initial cost of the Wonder World Drive overpass is found by adding the City of San
Marcos’ cost to TxDOT’s costs. The City of San Marcos financed $245,000 through
General Obligation Bonds. As discussed in the Methodology chapter, this amount is at
present value. This is added to their cash funding of $985,000 and the estimated cost of
bike lanes $100,000. The total cost for the City of San Marcos is shown in Table 5.2.
Table 5.2 City of San Marcos Cost Estimation General Obligation Bonds $245,000 Cash Funding $985,000 Bike Lanes $100,000 Total cost estimation for San Marcos $1,330,000 Source: These estimates where obtained in a phone interview with Rodney Gonzales from the City of San Marcos Finance Department in March 2006
The Texas Department of Transportation does not finance money. All estimated
costs are taken at face value. The estimated project cost is $7,182,934. The planning,
estimation and surveying was done in advance of finding a contractor to build the
structure, but is included in the total cost of the project. Table 5.3 shows the total cost for
TxDOT.
Table 5.3 TxDOT Costs Estimation Estimated Project cost $7,182,934 Planning Estimation and Surveying $629,300 Total Cost Estimation for TxDOT $7,812,234 Source: These cost estimates where obtained in a phone interview with Danny Stabeno form the Texas Department of Transportation in March 2006. Tables 5.2 and 5.3 show the two entities cost of the Wonder World Drive overpass. The
total cost of the project when combining TxDOT costs and City of San Marcos costs is
$9,142,234.
54

Table 5.4 Total Project Cost City of San Marcos Cost $1,330,000 Texas Department of Transportation Cost $7,812,234 Total estimated cost of project $9,142,234
Maintenance Present Value
The cost of maintenance is found by using the percentages discussed in Table 4.2. The
initial cost of the project is estimated at $9,142,234. The cost is used to find the expected
maintenance cost of the project. The ROW and PSE (planning, surveying and
estimating) are not used in the project cost to find maintenance. The project cost that is
used for maintenance is found in Table 5.5.
Table 5.5 Modified Project Cost Total cost of Project $9,142,234 Right of Way Costs $1,500,000 Planning Surveying and Estimates $629,300 Modified Project Cost $7,012,934 Source of cost estimates obtained from City of San Marcos and Texas Department of Transportation in 2006
Table 5.6 shows the present values of the cost of maintenance at 3% and 7% using the
new modified project cost from Table 5.5.
55

Table 5.6 Present value of Maintenance
Year Maintenance Percentage
Initial Project cost
Maintenance cost PV @ 7% PV @ 3%
project cost *
percent ( )∑− +
T
ii
iC1 07.1
( )∑
− +
T
ii
iC1 03.1
2007 1.0% $7,012,934.00 $70,129.34 $65,541.44 $68,086.74 2008 1.0% $7,012,934.00 $70,129.34 $61,253.68 $66,103.63 2009 1.0% $7,012,934.00 $70,129.34 $57,246.43 $64,178.28 2010 1.0% $7,012,934.00 $70,129.34 $53,501.34 $62,309.01 2011 1.0% $7,012,934.00 $70,129.34 $50,001.25 $60,494.18 2012 1.5% $7,012,934.00 $105,194.01 $70,095.21 $88,098.33 2013 1.5% $7,012,934.00 $105,194.01 $65,509.54 $85,532.36 2014 1.5% $7,012,934.00 $105,194.01 $61,223.87 $83,041.12 2015 1.5% $7,012,934.00 $105,194.01 $57,218.57 $80,622.45 2016 1.5% $7,012,934.00 $105,194.01 $53,475.30 $78,274.22 2017 2.0% $7,012,934.00 $140,258.68 $66,635.89 $101,325.85 2018 2.0% $7,012,934.00 $140,258.68 $62,276.53 $98,374.62 2019 2.0% $7,012,934.00 $140,258.68 $58,202.37 $95,509.34 2020 2.0% $7,012,934.00 $140,258.68 $54,394.73 $92,727.51 2021 2.0% $7,012,934.00 $140,258.68 $50,836.20 $90,026.71 2022 2.5% $7,012,934.00 $175,323.35 $59,388.08 $109,255.72 2023 2.5% $7,012,934.00 $175,323.35 $55,502.88 $106,073.51 2024 2.5% $7,012,934.00 $175,323.35 $51,871.85 $102,983.99 2025 2.5% $7,012,934.00 $175,323.35 $48,478.37 $99,984.46 2026 2.5% $7,012,934.00 $175,323.35 $45,306.89 $97,072.29 2027 3.0% $7,012,934.00 $210,388.02 $50,811.46 $113,093.93 2028 3.0% $7,012,934.00 $210,388.02 $47,487.35 $109,799.93 2029 3.0% $7,012,934.00 $210,388.02 $44,380.70 $106,601.87 2030 3.0% $7,012,934.00 $210,388.02 $41,477.29 $103,496.96 2031 3.0% $7,012,934.00 $210,388.02 $38,763.82 $100,482.49 Total $1,370,881.04 $2,263,549.50
The estimated maintenance cost for the Wonder World Drive overpass is $1,370,881.04
at 7% and $2,263,549.50 at 3%.
56
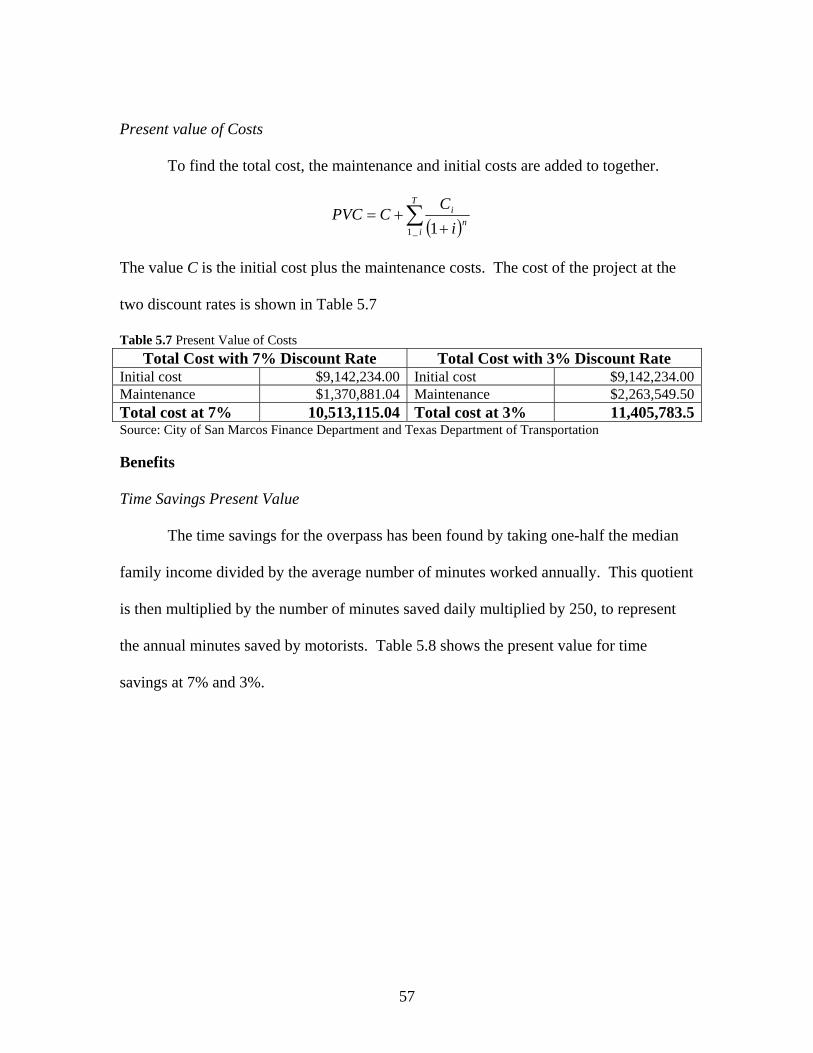
Present value of Costs
To find the total cost, the maintenance and initial costs are added to together.
( )∑+
+=T
in
i
iC
CPVC_1 1
The value C is the initial cost plus the maintenance costs. The cost of the project at the
two discount rates is shown in Table 5.7
Table 5.7 Present Value of Costs Total Cost with 7% Discount Rate Total Cost with 3% Discount Rate
Initial cost $9,142,234.00 Initial cost $9,142,234.00Maintenance $1,370,881.04 Maintenance $2,263,549.50Total cost at 7% 10,513,115.04 Total cost at 3% 11,405,783.5Source: City of San Marcos Finance Department and Texas Department of Transportation
Benefits
Time Savings Present Value
The time savings for the overpass has been found by taking one-half the median
family income divided by the average number of minutes worked annually. This quotient
is then multiplied by the number of minutes saved daily multiplied by 250, to represent
the annual minutes saved by motorists. Table 5.8 shows the present value for time
savings at 7% and 3%.
57

58
Table 5.8 Present Values: Time Savings at Railroad Crossing
Year 1/2 MFI 1/2 Wage per
min Vehicle delay at
RR in min per day Annual Vehicle Delay
at RR in minutes Time saving benefit PV @ 7% PV @ 3%
1/2 MFI/120,000 minutes worked annually 3% Increase
Daily Vehicle delay * 250 work days
annually
wage per min * Annual Vehicle
delay ( )∑− +
T
ii
iB1 07.1
( )∑
−
T
i 1 1+ iiB03.
2007 $21,481.47 $0.18 3,394 848,503 $151,892.33 $141,955.45 $147,468.28 2008 $22,555.54 $0.19 3,496 873,958 $164,271.56 $143,481.14 $154,841.70 2009 $23,683.32 $0.20 3,601 900,176 $177,659.69 $145,023.23 $162,583.78 2010 $24,867.48 $0.21 3,709 927,182 $192,138.95 $146,581.89 $170,712.97 2011 $26,110.86 $0.22 3,820 954,997 $207,798.28 $148,157.30 $179,248.62 2012 $27,416.40 $0.23 3,935 983,647 $224,733.84 $149,749.65 $188,211.05 2013 $28,787.22 $0.24 4,053 1,013,156 $243,049.65 $151,359.10 $197,621.60 2014 $30,226.58 $0.25 4,174 1,043,551 $262,858.19 $152,985.86 $207,502.68 2015 $31,737.91 $0.26 4,299 1,074,858 $284,281.14 $154,630.10 $217,877.82 2016 $33,324.81 $0.28 4,428 1,107,103 $307,450.05 $156,292.01 $228,771.71 2017 $34,991.05 $0.29 4,561 1,140,316 $332,507.23 $157,971.79 $240,210.30 2018 $36,740.60 $0.31 4,698 1,174,526 $359,606.57 $159,669.62 $252,220.81 2019 $38,577.63 $0.32 4,839 1,209,762 $388,914.50 $161,385.69 $264,831.85 2020 $40,506.51 $0.34 4,984 1,246,055 $420,611.03 $163,120.21 $278,073.44 2021 $42,531.84 $0.35 5,134 1,283,436 $454,890.83 $164,873.37 $291,977.12 2022 $44,658.43 $0.37 5,288 1,321,939 $491,964.43 $166,645.38 $306,575.97 2023 $46,891.35 $0.39 5,446 1,361,597 $532,059.54 $168,436.42 $321,904.77 2024 $49,235.92 $0.41 5,610 1,402,445 $575,422.39 $170,246.72 $338,000.01 2025 $51,697.71 $0.43 5,778 1,444,519 $622,319.31 $172,076.48 $354,900.01 2026 $54,282.60 $0.45 5,951 1,487,854 $673,038.34 $173,925.90 $372,645.01 2027 $56,996.73 $0.47 6,130 1,532,490 $727,890.96 $175,795.19 $391,277.26 2028 $59,846.57 $0.50 6,314 1,578,465 $787,214.08 $177,684.58 $410,841.12 2029 $62,838.90 $0.52 6,503 1,625,819 $851,372.02 $179,594.27 $431,383.18 2030 $65,980.84 $0.55 6,698 1,674,593 $920,758.84 $181,524.49 $452,952.34 2031 $69,279.88 $0.58 6,899 1,724,831 $995,800.69 $183,475.46 $475,599.95 Total 2007 to 2031 $4,046,641.30 $7,038,233.36

59
The present value for time savings with a 7% discount rate is $4,046,641.30 and
$7,038,233.36 with a 3% discount rate. This is the estimated benefit that citizens will
gain by not waiting for trains.
Accident Reduction Present Value
The present value for accident reduction was found by using data from the San
Marcos Police Department. The average number of hours an accident costs a resident at
the Wonder World railroad crossing is multiplied the same one-half median family
income divided by the average minutes worked in a year, 120,000. The type of accident
also plays a role in the present value. As stated in the Methodology chapter $500 is
assigned to minor accidents and $1,000 for major accidents. A more detailed table
showing the Total Damage results can be found in appendix D. Table 5.9 shows the
present value for accident reduction.

60
Table 5.9 Present Value for Accident Reduction
Year Accident time
in minutes annually
1/2 MFI 1/2 Wage per min Accident benefit Total damage Total Benefit PV @ 7% PV @ 3%
1/2 MFI/120,000 Accident minutes * 1/2 MFI per min
minor accident + major accident
accident benefit + Total damage ( )∑
− +
T
ii
iB1 07.1
( )∑
−
T
i 1 1+ iiB03.
2007 125.49 $20,277.19 $0.17 $21.20 $2,575.75 $2,596.96 $2,427.06 $2,521.32 2008 126.75 $20,885.50 $0.17 $22.06 $2,601.51 $2,623.57 $2,291.53 $2,472.97 2009 128.01 $21,512.07 $0.18 $22.95 $2,627.53 $2,650.47 $2,163.58 $2,425.56 2010 129.29 $22,157.43 $0.18 $23.87 $2,653.80 $2,677.67 $2,042.78 $2,379.08 2011 130.59 $22,822.15 $0.19 $24.84 $2,680.34 $2,705.17 $1,928.75 $2,333.51 2012 131.89 $23,506.82 $0.20 $25.84 $2,707.14 $2,732.98 $1,821.10 $2,288.83 2013 133.21 $24,212.02 $0.20 $26.88 $2,734.21 $2,761.09 $1,719.47 $2,245.02 2014 134.54 $24,938.38 $0.21 $27.96 $2,761.56 $2,789.52 $1,623.52 $2,202.07 2015 135.89 $25,686.54 $0.21 $29.09 $2,789.17 $2,818.26 $1,532.95 $2,159.96 2016 137.25 $26,457.13 $0.22 $30.26 $2,817.06 $2,847.32 $1,447.43 $2,118.68 2017 138.62 $27,250.85 $0.23 $31.48 $2,845.23 $2,876.71 $1,366.71 $2,078.20 2018 140.01 $28,068.37 $0.23 $32.75 $2,873.69 $2,906.43 $1,290.49 $2,038.51 2019 141.41 $28,910.42 $0.24 $34.07 $2,902.42 $2,936.49 $1,218.54 $1,999.61 2020 142.82 $29,777.74 $0.25 $35.44 $2,931.45 $2,966.89 $1,150.61 $1,961.46 2021 144.25 $30,671.07 $0.26 $36.87 $2,960.76 $2,997.63 $1,086.48 $1,924.06 2022 145.69 $31,591.20 $0.26 $38.35 $2,990.37 $3,028.72 $1,025.93 $1,887.40 2023 147.15 $32,538.94 $0.27 $39.90 $3,020.27 $3,060.17 $968.77 $1,851.45 2024 148.62 $33,515.10 $0.28 $41.51 $3,050.48 $3,091.98 $914.81 $1,816.21 2025 150.11 $34,520.56 $0.29 $43.18 $3,080.98 $3,124.16 $863.86 $1,781.67 2026 151.61 $35,556.17 $0.30 $44.92 $3,111.79 $3,156.71 $815.75 $1,747.79 2027 153.12 $36,622.86 $0.31 $46.73 $3,142.91 $3,189.64 $770.34 $1,714.59 2028 154.65 $37,721.54 $0.31 $48.61 $3,174.34 $3,222.95 $727.46 $1,682.03 2029 156.20 $38,853.19 $0.32 $50.57 $3,206.08 $3,256.65 $686.98 $1,650.12 2030 157.76 $40,018.79 $0.33 $52.61 $3,238.14 $3,290.75 $648.76 $1,618.83 2031 159.34 $41,219.35 $0.34 $54.73 $3,270.52 $3,325.25 $612.68 $1,588.16 Total 2007 to 2032 $33,146.34 $50,487.09

The present value for accident reduction at 7% is $33,146.34 and $50,487.09 at 3%. This
present value benefit shows what motorists will save by not waiting for accidents to clear
at the Wonder World Drive railroad crossing and the money that can be saved by not
having a collision at the railroad tracks.
Emergency Access
The benefit of emergency access was found by using the willingness to pay model
that was discussed in the methodology chapter. In the willingness to pay survey, 54% of
respondents said they would be willing to pay between $5 and $20. This gives a median
of $12.5 per household annually. This number is held constant over the 25 year period
because it is not safe to assume that residents would be willing to pay more than the
initial amount. Table 5.10 shows the present values for Emergency Access.
61

Table 5.10 Present Values: Willingness to Pay
Year Willingness to
pay Number of
Households Total benefit PV @ 7% PV @ 3%
2% Increase willingness * number
of households ( )∑− +
T
ii
iB1 07.1
( )∑
− +
T
ii
iB1 03.1
2007 $12.50 14,542.36 $181,779.51 $169,887.39 $176,484.962008 $12.50 14,833.21 $185,415.10 $161,948.73 $174,771.512009 $12.50 15,129.87 $189,123.40 $154,381.03 $173,074.702010 $12.50 15,432.47 $192,905.87 $147,166.96 $171,394.362011 $12.50 15,741.12 $196,763.98 $140,290.00 $169,730.342012 $12.50 16,055.94 $200,699.26 $133,734.39 $168,082.472013 $12.50 16,377.06 $204,713.25 $127,485.12 $166,450.612014 $12.50 16,704.60 $208,807.51 $121,527.87 $164,834.582015 $12.50 17,038.69 $212,983.66 $115,849.00 $163,234.242016 $12.50 17,379.47 $217,243.34 $110,435.50 $161,649.452017 $12.50 17,727.06 $221,588.20 $105,274.96 $160,080.032018 $12.50 18,081.60 $226,019.97 $100,355.57 $158,525.862019 $12.50 18,443.23 $230,540.37 $95,666.06 $156,986.772020 $12.50 18,812.09 $235,151.18 $91,195.68 $155,462.632021 $12.50 19,188.34 $239,854.20 $86,934.20 $153,953.282022 $12.50 19,572.10 $244,651.28 $82,871.85 $152,458.592023 $12.50 19,963.54 $249,544.31 $78,999.34 $150,978.412024 $12.50 20,362.82 $254,535.19 $75,307.78 $149,512.602025 $12.50 20,770.07 $259,625.90 $71,788.72 $148,061.022026 $12.50 21,185.47 $264,818.42 $68,434.11 $146,623.542027 $12.50 21,609.18 $270,114.78 $65,236.26 $145,200.012028 $12.50 22,041.37 $275,517.08 $62,187.83 $143,790.302029 $12.50 22,482.19 $281,027.42 $59,281.86 $142,394.282030 $12.50 22,931.84 $286,647.97 $56,511.68 $141,011.812031 $12.50 23,390.47 $292,380.93 $53,870.95 $139,642.76
Total 2007 to 2031 $2,536,622.84 $3,934,389.11
The present value at 7% is $2,536,622.84 and $3,934,389 at 3%. These present value
benefits represent what citizens are willing to pay for emergency access unimpeded by
the trains.
62

Present Value of Benefits
To find the total benefit for the Wonder World Drive overpass all benefits are
added together. Table 5.9 shows the total benefit for this project.
Table 5.11 Present Value Benefits Total Benefit with Private 7% Discount Rate Total Benefit with Social 3% Discount Rate Time savings $4,046,641.30 Time savings $7,038,233.36 Accident reduction $33,146.34 Accident reduction $50,487.09 Willingness to pay $2,536,622.84 Willingness to pay $3,934,389.11 Total Benefit at 7% $6,616,410.49 Total Benefit at 3% $11,023,109.56
Net Present Value of Wonder World Drive Overpass
The present value has been found for the costs and benefits of the Wonder World
Drive overpass. Finding the net present values is most appropriate for this project. The
total benefits in Table 5.11 are subtracted from the total costs found in Table 5.7. Table
5.12 shows the net present value of the Wonder World Drive overpass at each discount
rate.
NPV = PVB – PVC
Table 5.12 Net Present Value of Wonder World Drive Overpass Private Rate 7% Social Rate 3%
Present Value Benefits $6,616,410.49 $11,023,109.65Present Value Cost $10,513,115.04 $11,405,783.50Net Present Value ($3,896,704.55) ($382,673.93)
The NPV is negative at both the private rate and the social rate of discount. This Net
Present Value shows that the stream of benefits do not out weigh the stream of costs in
the project. According to the NPV, this is not a viable project.
Many scholars argue that analyst will falsely inflate benefits. To avoid this
conservative estimates have been used. This may be a contributing factor to why the
NPV is negative. When the Social discount rate of 3% is used the NPV comes to less
63

than $400,000. If less conservative estimates were to be used, the NPV at the social rate
could be positive making the Wonder World Drive overpass a viable project.
Chapter Summary
This chapter shows the results of the of the present value calculations for the costs
and benefits for the Wonder World Drive overpass. A public and private discount rate has
been used to show what the difference in value. As stated in the literature review, the
higher the discount rate the lower the present value. The net present value has shown to
be significantly less than zero at both the private and social discount rate. By all
economic standards, the project is inferior.
However there are five good reasons for proceeding with the Wonder World
Drive Overpass. First, the voters in San Marcos approved issuing bonds for this project.
This indicates that residents wanted this project. Second, the Wonder World Drive
overpass is part of the planned Wonder World Extension project. This highway would
not be effective if motorist had to stop at railroad crossings. Third, the benefit of having
access to the hospital is invaluable. The operalization only took into account what people
are willing to pay. In the event of an emergency life and property can be saved. This
was not taken into account in the NPV. Fourth, the City of San Marcos is growing.
Overpasses are a necessity to keep traffic moving. Finally, when using the Social
discount rate the NPV is not a significant quantity compared to the overall cost of the
project. It could be argued if the stream of benefits and costs were extended beyond the
useful life of the project the difference would not be greater than $400,000. This could
then be considered a viable project using the Social discount rate.
64

The City of San Marcos needs to have an adequate transportation system and a
significant move in that direction is to eliminate the extended wait time at railroad
crossings. As President Johnson said, “The life of a city depends on an adequate
transportation system” (Dodson 1969, 373).
65

Chapter Six: Conclusion Introduction
This final chapter provides a summary of the analysis that has been performed.
Recommendations for future benefit-cost analysis for the City of San Marcos are
provided in this chapter. These recommendations are related to this study of overpasses
and improving transportation for the growing population.
Summary
In the Chapter One, the Literature review, the process of benefit-cost analysis was
discussed. This process is a decision making tool that is used by public officials to
ensure the best use of funds. It can be used to compare projects and pick the most
efficient (finding the highest NPV) or to establish if a single project is worth doing (NPV
> 0). The steps of performing a cost-benefit analysis were followed to ensure an accurate
outcome. The first step of identifying the costs and benefits was done by performing a
needs assessment for the overpass. A need was established the costs and benefits were
derived from that need. The second step of measuring the costs and benefits was
accomplished in the methodology chapter where a detailed description of the
operalization of each variable was provided. Third, the costs and benefits were
considered over time. For this project the expected useful life is 25 years. Each cost and
benefit was discount over that 25 year period. Finally a decision criterion was used and
the NPV was found for the Wonder World Drive overpass. The purpose of this paper
was to perform a benefit-cost analysis and find if the Wonder World Drive overpass is a
viable project. The Net Present Values at both the social and private discount rates
illustrate that this is not a good economic investment.
66

There are many factors that influence the outcome of the benefit-cost analysis.
The discount rate plays a notable role in the outcome of the benefit-cost analysis. It is
suggested that the present value be found at both a private and social discount rates. By
doing this, decision makers will know the worth of the project at different levels. The
costs and benefits that are selected also play a role. By disregarding costs or benefits that
are involved in the project will give an inaccurate result. In addition the operalization of
the costs and benefits will determine the outcome. By incorrectly measuring costs and or
benefits the projects worth can become erroneous. In this analysis, the benefits were
intentionally reduced to prevent a flawed outcome.
The benefit-cost analysis that was performed on the Wonder World overpass has
been done in hindsight. The research for this paper began after the Wonder World
project had been approved and construction started. The analysis of this project still
holds merit even in retrospect. This is the first overpass to be approved and funded in
San Marcos. It is important to know what the worth of this project is. This analysis
provides data for future overpasses and transportation improvement projects for the City.
In the Settings chapter a needs assessment was performed. It outlined the current
conditions of the City. Because of these conditions, it was necessary to build an
overpass. The purpose of this research was to find if the overpass is viable. As shown in
the results chapter, the NPV shows the project to be a great benefit for the City of San
Marcos.
This is only the beginning the transportation improvements in the City of San
Marcos. In the City’s Master Plan there are 3 other proposed bridges and many road
67

improvements planned. The data that has been collected in this research and the benefit-
cost analysis can assist in the decision making for these future projects.
Recommendations for Future Research
The results of this benefit-cost analysis are significant. This analysis can be
duplicated on other proposed overpasses in the City. Multiple benefit-cost analyses can
be done to select which overpass should be constructed first to provide the highest benefit
for citizens. For the Wonder World Drive over pass the Willingness to pay model was
used to find what citizens would be willing to pay for emergency access. In other
analysis, a benefit unique to that area can be used. For example, Aquarena Springs Drive
is a heavily used road especially for Texas State University students. This road runs right
next to the Bobcat Football stadium. Benefits could be identified for having an overpass
on this road. In addition, significant costs could result from the existing football stadium.
This would be a worthy benefit-cost analysis.
Another suggestion for research is to perform a benefit-cost analysis on the
Wonder World Drive extension. Much of the same data that has been used in this
analysis can be used to find the estimated worth of the extension to Ranch Road 12. If
the extension project was to be joined with the overpass project the total Net Present
Value may be positive.
Hays County is the fastest growing county in the State of Texas. San Marcos is
the county seat and has a booming population. Because of its location between San
Antonio and Austin it is locating in the middle of a growing corridor. It is important for
the city officials to plan for increased traffic and population in the future. In order for
San Marcos to possess an adequate transportation system the costs and benefits of new
68

proposals need to be established. Having knowledge of the costs and benefits of a project
will allow decision makers to build new infrastructure where it is needed most.
Performing benefit-cost analyses is a good way to find what, where and when projects
should be built. Benefit-cost analysis may be criticized by some, but the qualitative and
quantitative data that it can provide is invaluable.
69

Bibliography
Barnsness, Richard W. 1970. The department of transportation: concept and structure. The Western Political Quarterly 23 (3): 500-515. David, Elizabeth. 1979. Benefit-cost analysis in state and local investment decisions. Public Administration Review. 39 (1): 23-26. Davisson, William. 1964. Public investment criteria. Land Economics. 40 (2): 153-162. Delucchi, Mark. 1997. The social cost of motor vehicle use. Annals of the American Academy of Political Social Science. Vol 553 September: 130-142. Dodson, Edward N. 1969. Cost-effectiveness in urban transportation. Operations Research. Vol 17 May: 373-394 Epstein, Richard. 1985. Takings: private property and the power of eminent domain. Harvard University Press, Cambridge. Fagin, Henry. 1964. Urban transportation criteria. Annals of the American Academy of Political and Social Science. Vol 352 March: 141-151. Fuguitt, Diana and Shanton J. Wilcox. 1999. Cost-benefit analysis for public sector decision makers. Quorum Books, Connecticut. Grout, Paul A. 2002. Public and private sector discount rates in public-private partnerships. CMPO working paper, University of Bristol Department of Economics. Galambos, Eva and Arthur F. Schreiber. 1978. Making sense out of dollars: economic analysis for local government. National League of Cities, Washington D.C. Gunter, Pete and Max Oelschlaeger. 1997. Texas land ethics. University of Texas Press, Austin. Hakimi, Shadi and Kara M. Kockelman. 2005. Right-of-way acquisition and property condemnation: A comparison of U.S. state laws. Submitted for presentation at the 2005 Annual Meeting of Transportation Research Board and for Publication in Transportation Research Record. Heiner, Jared D. and Kara M. Kockelman. 2005. The cost of right-of-way acquisition: methods and models for estimation.” Submitted for presentation at the 2005 Annual Meeting of Transportation Research Board and for Publication in Transportation Research Record.
70

Jones, Carl R. 1971. On the nature of the cost-benefit schedule. Management Science. Vol 17 August: B744-B763 Kornhauser, Lewis A. 2000. On justifying cost-benefit analysis. The Journal of Legal Studies. Vol 29 June: 1037-1057 Litman, Todd. 1997. Policy implications of full social costing. Annals of the American Academy of Political and Social Science. Vol 553 September: 143-156. Markovits, Richard. 1984. Duncan’s do nots: cost-benefit analysis and the determination of legal entitlements.” Stanford Law Review. 36 (5): 1169- 1198. McKenna, Christopher K. 1980. Quantitative methods for public decision making. McGraw-Hill, New York. Meltz, Robert et al. 1999. The takings issue: constitutional limits on land use control and environmental regulation. Island Press, Washington D.C. Mendelsohn, Robert. 1981. The choice of discount rates for public projects. The American Economic Review. Vol 71 March: 239-241 Mertens, Jean-Francois & Anna Rubinchik-Pessach. 2006. Intergenerational equity and the discount rate for cost-benefit analysis. Presented at the Microeconomics Theory Workshop Spring 2006. Mikesell, John L. 2003. Fiscal administration: analysis and applications for the public sector. 6th Ed. Thomson-Wadsworth, United States. Musgrave, Richard A. 1969. Cost-benefit analysis and the theory of public finance. Journal of Economic Literature. Vol 7 September: 797-806. Newbery, David M. 1990. The isolation paradox and discount rate for benefit-cost analysis: a comment. The Quarterly Journal of Economics. Vol 105 February: 235-238 Nichols, Alan. 1964. The opportunity costs of public investment: comment. The Quarterly Journal of Economics. Vol 78 August: 499-505. Pauly, Mark V. 1970. Risk and the social rate of discount. The American Economic Review. Vol 60 (1): 195-198 Pinkston, Elizabeth et al. 1998. Innovative financing of highways: an analysis of proposals. United Congress of the United States Congressional Budget Office. January 1998.
71

Posner, Richard A. 2000. Cost-benefit analysis: definition, justification, and comment on conference papers. The Journal of Legal Studies. Vol 29 June: 1153-1177 Rabin, Yale. 1980. Federal urban transportation policy and the highway planning process in metropolitan areas. Annals of the American Academy of Political and Social Science. Vol 451 September: 21-35. San Marcos Transportation Master Plan 2004. Prepared by Wilbur Smith Associates. San Marcos Horizons 2004. Prepared by Planning and Development services Department, City of San Marcos. October 1, 2004. Tanadtang, Parinya et al. 2005. Incorporating uncertain and incomplete subjective judgments into the evaluation procedure of transportation demand management alternatives.” Transportation. Vol 32: 603-626. Texas Department of Transportation. 2001. Paving the way: open more roadway maintenance to competition. www.window.state.tx.us/txdot/txdot407.html accessed March 28, 2006 U.S. Census Bureau, Census 2000 Weitzman, Martin L. 2001. Gamma discounting. The American Economic Review. Vol 91 March: 260-271 Williams, Kristine et al. 2004. Costs and benefits of strategic acquisition of limited access right-of-way at freeway interchange areas. Center for Urban Transportation Research. University of South Florida, College of Engineering. November 2004.
72

Appendix A Definition of Terms Annual Net Flow (S): Used to find Pay Back Period and used in PV formula. Annual Benefits – Annual Expenditures. Found on pages 10 & 11. Benefit-cost analysis: Method of assessing whether decisions or choices that affect the use of scarce resources promote efficiency. The analysis involves a systematic identification of policy consequences, followed by valuation of social benefits and costs and then application of the appropriate decision criterion Benefits: Involve the tangible and the intangible negative unintended consequences; positive consequence, intended or unintended; direct services provided and their effects on human life Benefit-Cost Ratio: Ratio found by dividing Present Value by Initial Capital Outlay. Ratio must be greater than one to be considered a good project. Costs: Are the value of goods and services that are required for a project. Decision Criterion: Is the basis for selecting one alternative. Discount rate: Used for discounting future costs and benefits. OMB has set the discount rate at 7%. Incremental Costs & Benefits: Baseline scenario of what would happen with or without the policy by identifying costs and benefits by comparing consequences with the policy to those without the policy. Formula found on page 12. Initial Capital Outlay: The total original costs of the project or policy Net Present Value: The present value of incremental net benefits generated throughout the policy time horizon. Net Welfare: Criterion that requires net benefits to exceed net costs
73

Non-tangibles or Intangibles: Variables that are not quantified in market value. Formula found on page 7. Operationalize: The process of measuring variables into quantifiable data for use in an analysis Pareto Criterion: Way of evaluating a project. A project is considered acceptable if, on one is worse off and at least one person is better off. This criterion is not often used for public projects. Pay Back Period: Considered the weakest criterion for a project because it does not take into account the value of time and money. Formula found on page 21. Present Value: Benefits and costs will be discounted to present values. Formula found on page 11 Recurring costs: Those costs that are necessary to keep a project or program running Social Costs: What the community gives up in the undertaking of a project Time Horizon: The useful life of a capital investment as determined by engineers or manufacturers.
74

Appendix B
San Marcos Police Department Accident Data 2003-2005
Date Location Type of Accident Details Start time End time
Total Time in Hours
2003 3/28/2003 WW Drive Hit & Run HEB truck ran through RR arms 15:27 16:03 0:364/23/2003 McCarty Minor accident Truck in Ditch 6:56 7:36 0:405/2/2003 WW Drive Major accident 0:00
5/4/2003 River Rd Major accident
Pedestrian hit by train. Amputation of L leg and head injury. Air lift to hospital 2:22 5:05 2:43
7/9/2003 Hwy 21 Minor accident one vehicle struck other 11:20 11:44 0:24
8/13/2003 Aquarena Springs Major accident Accident w/ injury, blocking traffic 17:32 18:04 0:32
9/5/2003 WW Drive Minor accident 2 car collision 14:43 15:27 0:4411/15/2003 Hwy 21 Minor accident 2 car collision, blocking traffic 0:18 0:50 0:3211/25/2003 WW Drive Minor accident RR arm struck Veh 12:21 12:33 0:1212/8/2003 S LBJ Hit & Run City bus did not yield to rr arm 13:07 13:45 0:38
Summary 2003 Total 7:014 out of 10 accidents were at WW Dr WW total 1:32
Date Location Type of Accident Details Start time End time
Total Time in Hours
2004
3/9/2004 Aquarena Springs Major Accident SWT tram and sm car 17:28 18:17 0:49
3/25/2004 WW Drive minor 2 car collision 20:35 21:48 1:134/6/2004 S LBJ Minor accident 2 car collision, blocking traffic 13:20 13:32 0:125/8/2004 WW Drive Minor accident 3 veh collision 17:15 17:57 0:42
5/20/2004 WW Drive Minor accident no details 17:11 17:33 0:226/14/2004 S LBJ Minor accident 2 vehicle collision, blocking traffic 7:30 8:05 0:35
6/30/2004 HWY 21 accident unknown 2 vehicle collision, blocking traffic 9:57 10:44 0:47
8/9/2004 Centerpoint Major Accident 2 car collision with injurys 13:06 13:52 0:468/15/2004 Patton st Minor accident car in ditch 0:41 1:27 0:468/22/2004 HWY 21 Minor accident 2 car collision 19:30 19:54 0:24
9/11/2004 Aquarena Springs Minor accident no details 0:08 0:27 0:19
10/10/2004 WW Drive Major Accident train hit pedestrian, deceased 17:42 20:04 2:22
11/2/2004 Aquarena Springs Minor accident 2 vehicle collision, blocking traffic 15:03 15:52 0:49
11/3/2004 Aquarena Springs Minor accident 2 vehicle collision 16:20 16:35 0:15
12/10/2004 E Hopkins Hit & Run blocking traffic 7:45 8:06 0:21Summary 2004 Total 10:424 out of 15 at WW Dr WW total 4:39
75

Appendix B Continued
Date Location Type of Accident Details Start time end time time total
2005 1/8/2005 HWY 21 Major accident accident with injuries 17:03 17:44 0:412/4/2005 HWY 21 Minor accident 3 vehicles 12:44 13:21 0:37
3/26/2005 Aquarena Springs Minor accident no details 17:31 18:04 0:33
6/22/2005 Patton Minor accident no details 1:33 1:35 0:028/24/2005 S LBJ Minor accident 2 car collision 12:06 12:50 0:449/10/2005 Patton Major accident investigation 20:32 20:52 0:209/23/2005 HWY 21 Minor accident 2 car collision 22:26 22:30 0:04
10/14/2005 E Access rd Minor accident bus car collision 6:40 7:28 0:4810/21/2005 S Guadalupe st Minor accident Deer ran into side of vehicle 8:59 9:11 0:1212/2/2005 MC Allen Minor accident no details 19:13 19:32 0:19
Summary 2005 Total 4:20No accidents at WW Dr WW total 0
3 year average hours in San Marcos 7:21
3 yr Average hours at WW DR 2:03
76

Appendix C Willingness to Pay Survey Worth of the Wonder World Drive Overpass to Citizens of San Marcos Question: How much would you pay a year to ensure that you or emergency officials (police, fire, EMS) would not be stopped by a train in the event of an emergency? $1 to $5 $5 to $10 $10 to $15 $15 to $20 Greater than $20 Other amount Race Age Minority White <25 25-40 40-60 >60 Gender Male Female SPSS Survey Results
Worth of overpass to citizens of San Marcos
4 10.0 10.0 10.09 22.5 22.5 32.55 12.5 12.5 45.08 20.0 20.0 65.07 17.5 17.5 82.57 17.5 17.5 100.0
40 100.0 100.0
$1 to $5$5 to $10$10 to $15$15 to $20$20 to $30> $50Total
ValidFrequency Percent Valid Percent
CumulativePercent
77

Appendix D Total Accident Damage Calculation
Accident time in hours
Cost of Minor Accident
Cost of Major Accident Total Damage Year
1% Increase 1% Increase 1% Increase Minor + Major 2004 2.03 $1,500.00 $1,000.00 $2,500.00 2005 2.05 $1,515.00 $1,010.00 $2,525.00 2006 2.07 $1,530.15 $1,020.10 $2,550.25 2007 2.09 $1,545.45 $1,030.30 $2,575.75 2008 2.11 $1,560.91 $1,040.60 $2,601.51 2009 2.13 $1,576.52 $1,051.01 $2,627.53 2010 2.15 $1,592.28 $1,061.52 $2,653.80 2011 2.18 $1,608.20 $1,072.14 $2,680.34 2012 2.20 $1,624.29 $1,082.86 $2,707.14 2013 2.22 $1,640.53 $1,093.69 $2,734.21 2014 2.24 $1,656.93 $1,104.62 $2,761.56 2015 2.26 $1,673.50 $1,115.67 $2,789.17 2016 2.29 $1,690.24 $1,126.83 $2,817.06 2017 2.31 $1,707.14 $1,138.09 $2,845.23 2018 2.33 $1,724.21 $1,149.47 $2,873.69 2019 2.36 $1,741.45 $1,160.97 $2,902.42 2020 2.38 $1,758.87 $1,172.58 $2,931.45 2021 2.40 $1,776.46 $1,184.30 $2,960.76 2022 2.43 $1,794.22 $1,196.15 $2,990.37 2023 2.45 $1,812.16 $1,208.11 $3,020.27 2024 2.48 $1,830.29 $1,220.19 $3,050.48 2025 2.50 $1,848.59 $1,232.39 $3,080.98 2026 2.53 $1,867.07 $1,244.72 $3,111.79 2027 2.55 $1,885.74 $1,257.16 $3,142.91 2028 2.58 $1,904.60 $1,269.73 $3,174.34 2029 2.60 $1,923.65 $1,282.43 $3,206.08 2030 2.63 $1,942.88 $1,295.26 $3,238.14 2031 2.66 $1,962.31 $1,308.21 $3,270.52
78