a brief return to corporate class
TRANSCRIPT

A brief return to Corporate ClassA brief return to Corporate Class
What constitutes a corporate What constitutes a corporate class?class?
What category of the social What category of the social ladder would they fit?ladder would they fit?

Where do they fit in our ladder?Where do they fit in our ladder?
When we combine the 2nd (new money)
and 3rd tier
Approximately 14.5 percent – leaning closer to the second tier with incomes Beginning at 750,000
Note: the first tier are “Old Money”Such as seen in the film “”Born Rich”(highly recommended)
Of the 39 women among the richest CEOs -- Inheritance is the main reason for their wealth

Corporate class grew out of ……Corporate class grew out of ……
The increasing size of major corporations and their The increasing size of major corporations and their increasing domination of the global marketsincreasing domination of the global markets
The increasing concentration of stock ownership in The increasing concentration of stock ownership in major corporations, including ownership by other major corporations, including ownership by other (particularly financial) corporations(particularly financial) corporations

The growing network of interlocking The growing network of interlocking directorates that link top corporate directorates that link top corporate personnel and foster interests and personnel and foster interests and loyalties that transcend specific loyalties that transcend specific corporationscorporations

Over 70% of assets of the 200,000 Over 70% of assets of the 200,000 Corporations in America are held by Corporations in America are held by 100 of them or .0005%......100 of them or .0005%......
Source: Kerbo 2007, Stratification in the U.S. Source: Kerbo 2007, Stratification in the U.S.

Characteristics of the Corporate Inter-Organizational Characteristics of the Corporate Inter-Organizational Leaders (Kerbo, 2007) Functions of Interlock DirectoratesLeaders (Kerbo, 2007) Functions of Interlock Directorates
Have more positions on corporate boardsHave more positions on corporate boards
More likely to be on board of larger corporationsMore likely to be on board of larger corporations
Often represent large banks on corporate boardsOften represent large banks on corporate boards
More often belong to elite social clubsMore often belong to elite social clubs
More often worked their way up to top positions rather than inheriting More often worked their way up to top positions rather than inheriting wealthy family statuswealthy family status
Often represent corporate interests in foundations, universities, and Often represent corporate interests in foundations, universities, and government government

Corporate ClassCorporate Class
• Interlocking Directorates are a major Interlocking Directorates are a major means of communication among the means of communication among the power elitepower elite
• At the center of corporate cliques are At the center of corporate cliques are big banks – Citi, Bank America, Chase, big banks – Citi, Bank America, Chase, Chemical, Sallie… These surround Chemical, Sallie… These surround themselves with clusters of corporations themselves with clusters of corporations through interlocks (Kerbo 2007)through interlocks (Kerbo 2007)
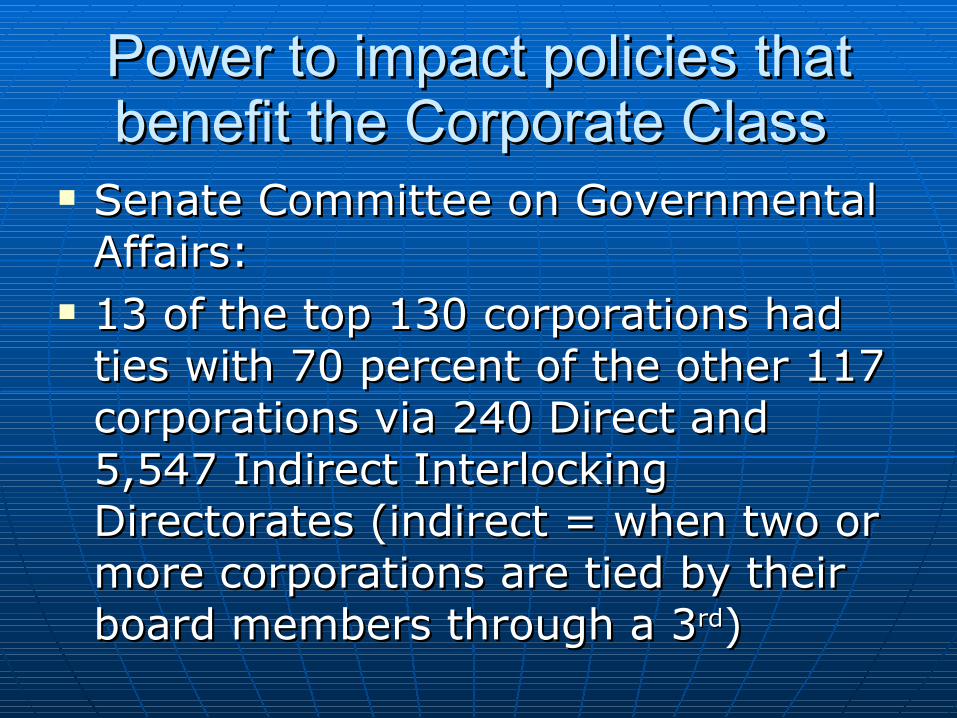
Power to impact policies that Power to impact policies that benefit the Corporate Class benefit the Corporate Class
Senate Committee on Governmental Senate Committee on Governmental Affairs: Affairs:
13 of the top 130 corporations had 13 of the top 130 corporations had ties with 70 percent of the other 117 ties with 70 percent of the other 117 corporations via 240 Direct and corporations via 240 Direct and 5,547 Indirect Interlocking 5,547 Indirect Interlocking Directorates (indirect = when two or Directorates (indirect = when two or more corporations are tied by their more corporations are tied by their board members through a 3board members through a 3rdrd))
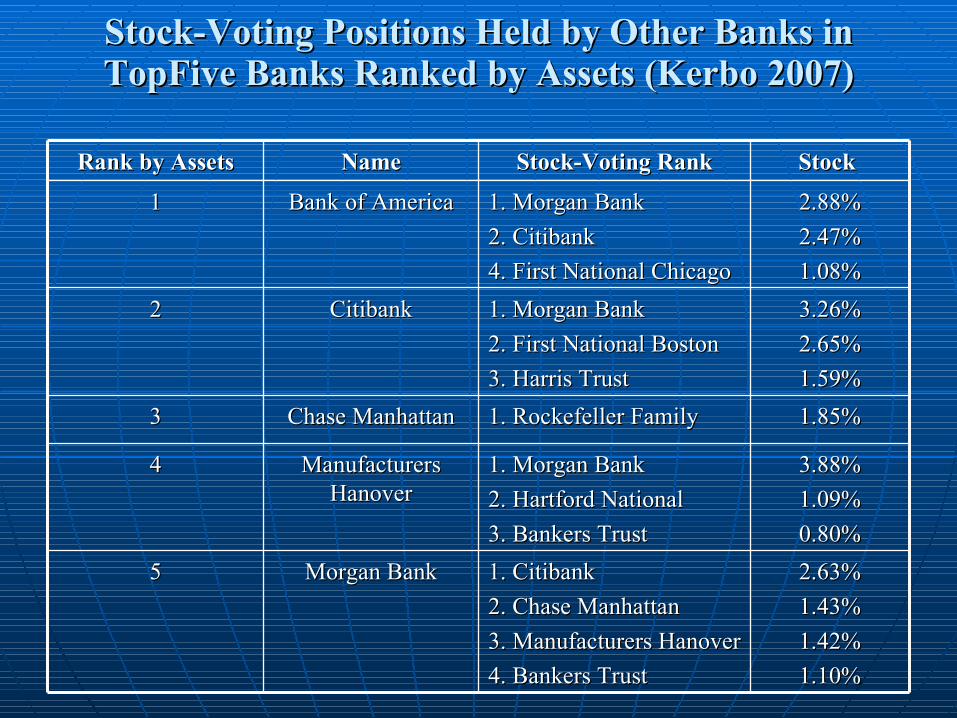
Stock-Voting Positions Held by Other Banks in Stock-Voting Positions Held by Other Banks in TopFive Banks Ranked by Assets (Kerbo 2007)TopFive Banks Ranked by Assets (Kerbo 2007)
Rank by AssetsRank by Assets NameName Stock-Voting RankStock-Voting Rank Stock Stock
11 Bank of AmericaBank of America 1. Morgan Bank1. Morgan Bank
2. Citibank2. Citibank
4. First National Chicago4. First National Chicago
2.88%2.88%
2.47%2.47%
1.08%1.08%
22 CitibankCitibank 1. Morgan Bank1. Morgan Bank
2. First National Boston2. First National Boston
3. Harris Trust3. Harris Trust
3.26%3.26%
2.65%2.65%
1.59%1.59%
33 Chase ManhattanChase Manhattan 1. Rockefeller Family1. Rockefeller Family 1.85%1.85%
44 Manufacturers Manufacturers HanoverHanover
1. Morgan Bank1. Morgan Bank
2. Hartford National2. Hartford National
3. Bankers Trust3. Bankers Trust
3.88%3.88%
1.09%1.09%
0.80%0.80%
55 Morgan BankMorgan Bank 1. Citibank1. Citibank
2. Chase Manhattan2. Chase Manhattan
3. Manufacturers Hanover3. Manufacturers Hanover
4. Bankers Trust4. Bankers Trust
2.63%2.63%
1.43%1.43%
1.42%1.42%
1.10%1.10%

House Committee on Oversight and Government ReformHouse Committee on Oversight and Government Reform, noted that before the infusion, the , noted that before the infusion, the banks had spent or allocated $108 banks had spent or allocated $108 billion on employee compensation billion on employee compensation and bonuses for the first nine and bonuses for the first nine months of 2008, nearly the same months of 2008, nearly the same amount as last year. amount as last year.
Source: Washington PostSource: Washington Post

S&P 500 CEOsS&P 500 CEOs last year averaged $10.5 million, 344 times last year averaged $10.5 million, 344 times
the pay of typical American workers.the pay of typical American workers.
http://www.faireconomy.org/files/executive_excess_2008.pdfhttp://www.faireconomy.org/files/executive_excess_2008.pdf

Put another way, a worker who Put another way, a worker who earned $41,861 (including earned $41,861 (including compensation) made about $400 compensation) made about $400 less last year than what the average less last year than what the average large-company CEO made in one large-company CEO made in one day. day.
That assumes 260 days of pay (52 That assumes 260 days of pay (52 weeks x 5 days a week).weeks x 5 days a week).

Compensation levels for private Compensation levels for private investment fund managers soared investment fund managers soared even further out into the pay even further out into the pay stratosphere. Last year, the top 50 stratosphere. Last year, the top 50 hedge and private equity fund hedge and private equity fund managers averaged $588 million managers averaged $588 million each, more than 19,000 times as each, more than 19,000 times as much as typical U.S.workers earned.much as typical U.S.workers earned.

ForbesForbes’ survey of the top 20 hedge fund and ’ survey of the top 20 hedge fund and private equity managers concluded that their private equity managers concluded that their combined income for 2007 was 43 percent higher combined income for 2007 was 43 percent higher than in 2006. “To even make the list,” the than in 2006. “To even make the list,” the magazine wrote, “you needed minimum earnings magazine wrote, “you needed minimum earnings of $350 million, which is $90 million higher than of $350 million, which is $90 million higher than the year before.”the year before.”
The magazine reported that hedge funds The magazine reported that hedge funds increased their assets by 14 percent to $2.2 increased their assets by 14 percent to $2.2 trillion, while private equity funds raised a record trillion, while private equity funds raised a record $300 billion to reach $2 trillion in assets.$300 billion to reach $2 trillion in assets.

Meanwhile…. What’s happening to Meanwhile…. What’s happening to American WorkersAmerican Workers
What are your chances of moving up What are your chances of moving up the social mobility ladder? the social mobility ladder?

Wage inequalityWage inequality
The past five years have seen an The past five years have seen an explosion of income disparity in the explosion of income disparity in the U.S. - Of all industrialized nations, U.S. - Of all industrialized nations, the U.S. has the greatest gap the U.S. has the greatest gap between the wealthiest and poorest between the wealthiest and poorest members of society.members of society.

Wage InequalityWage Inequality
……..has been increasing, in part, ..has been increasing, in part, because of the declining real value of because of the declining real value of the minimum wage. the minimum wage.

The “anxious class” The “anxious class” and slowed mobilityand slowed mobility
The value of the minimum wage has The value of the minimum wage has not kept up with inflation. When not kept up with inflation. When adjusted for inflation, the value of adjusted for inflation, the value of the minimum wage is 30% lower the minimum wage is 30% lower than it was in 1979.than it was in 1979.

Real Value of Minimum Wage Real Value of Minimum Wage (2000 dollars)(2000 dollars)

YearYear Actual Wage Actual Wage Adjusted for Inflation Adjusted for Inflation
2000 2000 5.15 5.15 4.69 4.69 2001 2001 5.15 5.15 4.56 4.56 2002 2002 5.15 5.15 4.49 4.49 2003 2003 5.15 5.15 4.39 4.39 2004 2004 5.15 5.15 4.28 4.28 2005 2005 5.15 5.15 4.14 4.14 2006 2006 5.15 5.15 4.04 4.04 2007 2007 5.85 5.85 4.41 4.41 2008 2008 6.55 6.55 n/an/a 2009 2009 7.257.25
In 1979 Minimum wage was $2.90 actual, but $6.27 In 1979 Minimum wage was $2.90 actual, but $6.27 adjustedadjusted
SSource: http://www.infoplease.com/ipa/A0774473.htmlource: http://www.infoplease.com/ipa/A0774473.html

Inflation and Social Mobility in the Past DecadeInflation and Social Mobility in the Past Decade
Changes in Cost-of-living and the Minimum Wage Since Changes in Cost-of-living and the Minimum Wage Since September 1997September 1997
Overall inflation Overall inflation 26% 26% Food Food 23% 23% HousingHousing 29% 29% Medical care Medical care 43% 43% Child care and nursery school Child care and nursery school 52% 52% Educational books and suppliesEducational books and supplies 61% 61% Gasoline, unleaded regular Gasoline, unleaded regular 134%134% Minimum wage Minimum wage 0% 0% Source: Bureau of Labor StatisticsSource: Bureau of Labor Statistics Available at http://www.cbpp.org/cms/?fa=view&id=635Available at http://www.cbpp.org/cms/?fa=view&id=635

““Other worldly” compensation and high Other worldly” compensation and high risk ventures….risk ventures….
Tax dollars used to compensate for the Tax dollars used to compensate for the aboveabove
Combined with average wages that Combined with average wages that have not kept up with inflation…..have not kept up with inflation…..

Income Disparity in the U.S. Income Disparity in the U.S.
Average income of top 1 percent Average income of top 1 percent equals the top of Mt. Everest equals the top of Mt. Everest
(28,028 ft)(28,028 ft)
Average Family Income 13 feetAverage Family Income 13 feet
Average Individual income 9 feetAverage Individual income 9 feet

Social Mobility????…..Social Mobility????…..
Top 1 % Top 1 %
Earn twenty percent of U.S. incomesEarn twenty percent of U.S. incomes
And the Top 20% And the Top 20%
earn fifty percent of the incomes of the earn fifty percent of the incomes of the United StatesUnited States
Note:Note:
Investment incomes are not taxed at the Investment incomes are not taxed at the same rate as incomes…. And many of our same rate as incomes…. And many of our
nation’s wealthiest earn their keep via nation’s wealthiest earn their keep via investment incomes…….investment incomes…….

Wealth Says even moreWealth Says even more
Top 1 percent own 42% of wealthTop 1 percent own 42% of wealth

In other words…..In other words…..
Top 10% own 72 percent of the wealthTop 10% own 72 percent of the wealth
Control over 80% of CorporationsControl over 80% of Corporations
****************************************
Bottom 90% own 28 percentBottom 90% own 28 percent
Control less than 20 percent of Control less than 20 percent of CorporationsCorporations

Asset Poverty………Asset Poverty………
The poorest 40% owned 0.2% The poorest 40% owned 0.2% percent of all national wealth.percent of all national wealth.
The bottom 20% had a negative net The bottom 20% had a negative net worth - they owed more than they worth - they owed more than they owned.owned.
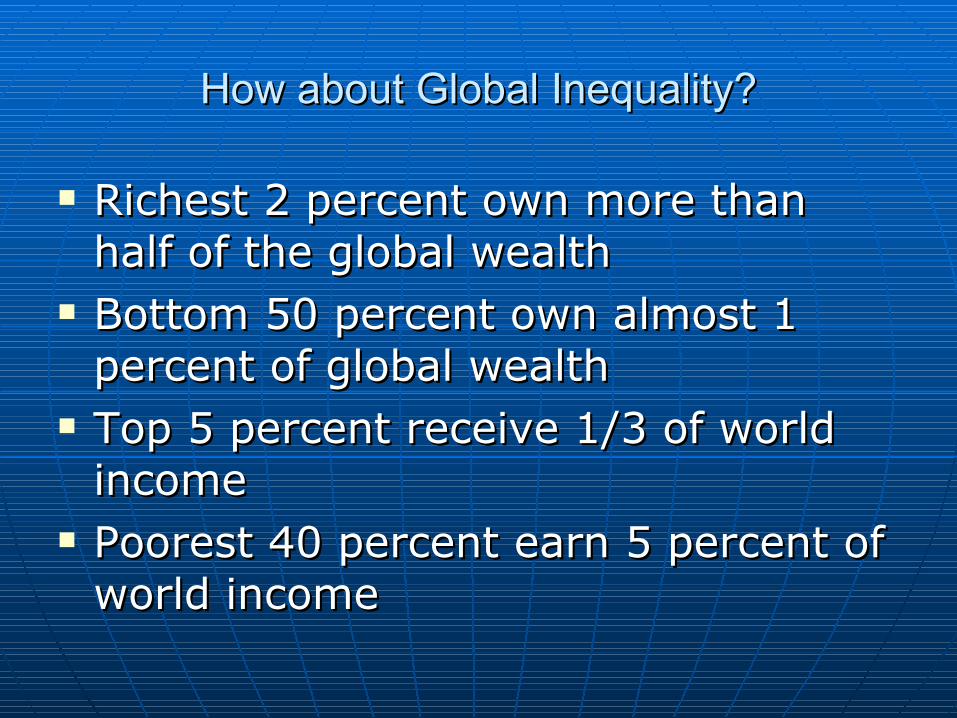
How about Global Inequality?How about Global Inequality?
Richest 2 percent own more than Richest 2 percent own more than half of the global wealthhalf of the global wealth
Bottom 50 percent own almost 1 Bottom 50 percent own almost 1 percent of global wealthpercent of global wealth
Top 5 percent receive 1/3 of world Top 5 percent receive 1/3 of world incomeincome
Poorest 40 percent earn 5 percent of Poorest 40 percent earn 5 percent of world incomeworld income