a c-its based lane changing advisory for weaving sections …eprints.qut.edu.au/81794/1/trung...
TRANSCRIPT
A C-ITS BASED LANE CHANGING
ADVISORY FOR WEAVING
SECTIONS
Trung Minh MAI
Bachelor of Civil Engineering (Honours)
Submitted in fulfilment of the requirements for the degree of
Master of Transportation Engineering
Smart Transport Research Centre
Queensland University of Technology
(February 2015)


A C-ITS BASED LANE CHANGING ADVISORY FOR WEAVING SECTIONS i
Keywords
Cooperative ITS, C-ITS, weaving bottleneck, weaving section management, lane
change distribution, lane-change advisory, AIMSUN

ii A C-ITS BASED LANE CHANGING ADVISORY FOR WEAVING SECTIONS
Abstract
Weaving sections, a common design of motorways, are defined as the crossing
of two or more traffic streams travelling in the same direction along a significant
length of motorway, without the aid of traffic control devices. Characteristic of such
sections is that they require extensive lane-change manoeuvres, one of the most risky
manoeuvres that drivers have to perform in the motorway system. Numerous studies
have found that drivers tend to make their lane changes as soon as they enter the
weaving section, as the traffic volume increases. Because of this high lane-changing
concentration, congestion builds up. Importantly, such congestion also limits the use
of existing infrastructure, the weaving section downstream. This behaviour thus
affects both safety and operational aspects. Cooperative Intelligent Transport
Systems (C-ITS) is the potential tool to manage motorways effectively and
efficiently. This research investigates a lane-change distribution strategy based on C-
ITS for weaving vehicles in weaving sections.
The objective of this research is to alleviate the lane-changing concentration
problem by coordinating weaving vehicles so that such lane-changing activities are
evenly distributed over the existing weaving length. C-ITS will send a message to
weaving vehicles, advising them when to execute a lane change.
The research applies a microscopic simulation in AIMSUN to evaluate the
proposed strategy’s effectiveness in one-sided ramp weaves. The proposed strategy is
evaluated with different traffic demands, weaving advisory proportions, penetration
rates and weaving section lengths (400m and 600m).

A C-ITS BASED LANE CHANGING ADVISORY FOR WEAVING SECTIONS iii
The evaluation revealed that the proposed lane-changing advisory strategy has
the potential to improve delay significantly and that it can be applied for any existing
one-sided ramp weaves.

iv A C-ITS BASED LANE CHANGING ADVISORY FOR WEAVING SECTIONS
Table of Contents
Keywords .................................................................................................................................. i
Abstract .................................................................................................................................... ii
Table of Contents .................................................................................................................... iv
List of Figures ......................................................................................................................... vi
List of Tables .......................................................................................................................... vii
List of Abbreviations ............................................................................................................. viii
Statement of Original Authorship ........................................................................................... ix
Dedication and Acknowledgements ......................................................................................... x
Chapter 1: Introduction............................................................................................. 1
1.1 Background ........................................................................................................................ 1
1.2 Research problem ............................................................................................................... 2
1.3 Purposes and aim ................................................................................................................ 4
1.4 Research Significance ........................................................................................................ 5
1.5 Thesis Outline .................................................................................................................... 5
Chapter 2: Literature Review ................................................................................... 7
2.1 Weaving section ................................................................................................................. 7 2.1.1 Weaving section definition ................................................................................................. 7 2.1.2 Factors influencing weaving capacity ................................................................................. 9 2.1.3 Driving behaviour in weaving sections ............................................................................. 11 2.1.4 Weaving section management techniques ........................................................................ 13
2.2 Cooperative Intelligent Transport Systems ...................................................................... 14 2.2.1 Levels of C-ITS assistance ................................................................................................ 16 2.2.2 Types of C-ITS communications ...................................................................................... 17 2.2.3 C-ITS evaluation ............................................................................................................... 18 2.2.4 Penetration rate ................................................................................................................. 21
2.3 Summary .......................................................................................................................... 24
Chapter 3: Methodology and the proposed strategy............................................. 25
3.1 Research methodology ..................................................................................................... 25
3.2 The proposed strategy ...................................................................................................... 27
3.3 Chapter summary ............................................................................................................. 30
Chapter 4: Simulation and evaluation of weaving section ................................... 31
4.1. Simulation test bed and different test scenarios .............................................................. 31 4.1.1 Simulation test bed ............................................................................................................ 31 4.1.2 Test scenarios .................................................................................................................... 33
4.2. Performance indicators .................................................................................................... 35
4.3 Simulation results and discussion ..................................................................................... 37 4.3.1 Evaluation of scenario 1.................................................................................................... 37 4.3.2 Evaluation of scenarios 2 and 3 ........................................................................................ 48 4.3.3 Impact of the strategy on different weaving geometries ................................................... 52

A C-ITS BASED LANE CHANGING ADVISORY FOR WEAVING SECTIONS v
4.4 Summary ...........................................................................................................................54
Chapter 5: Conclusions ........................................................................................... 55
5.1 Research findings ..............................................................................................................55
5.2. Final discussions and recommendation for future works .................................................57
References…………………………………………………………………………..60
vi A C-ITS BASED LANE CHANGING ADVISORY FOR WEAVING SECTIONS
List of Figures
Figure 1: One-sided ramp weaving section ................................................................ 8
Figure 2: Weaving and non-weaving flows ............................................................... 9
Figure 3: Weaving width and length of the weaving section ................................... 10
Figure 4: Al-Jameel's weaving management technique [6] ..................................... 14
Figure 5: Forecast of equipped light vehicles in the U.S. [34] ................................. 22
Figure 6: Research methodology .............................................................................. 26
Figure 7: Weaving section geometry ....................................................................... 28
Figure 8: Lane-changing advisory strategy for weaving vehicles ............................ 29
Figure 9: Speed contour plot between base case and control case for
auxiliary lane and lane 3 ...................................................................... 40
Figure 10: Impact of different ODs on the strategy ................................................. 42
Figure 11: Actual saving time of scenario 1 ............................................................ 44
Figure 12: Auxiliary lane speed with different penetration rate (scenario 1) .......... 48
Figure 13: Actual saving time of scenario 2 ............................................................ 49
Figure 14: Actual saving time of scenario 3 ............................................................ 49
Figure 15: Auxiliary lane speed with different scenarios ........................................ 51
Figure 16: Lane 3 speed with different scenarios .................................................... 52
Figure 17: Actual saving time of scenario 4 ............................................................ 53
Figure 18: Auxiliary lane speed of scenario 4 .......................................................... 53
Figure 19: Lane 3 speed of scenario 4 ...................................................................... 54
A C-ITS BASED LANE CHANGING ADVISORY FOR WEAVING SECTIONS vii
List of Tables
Table 1: Types of C-ITS communications ............................................................... 18
Table 2: Comparison of C-ITS evaluation methods ................................................ 21
Table 3: Default and calibrated values in AIMSUN ................................................ 33
Table 4: Number of lane changes in the weaving section (observed and
calibrated values) ................................................................................. 33
Table 5: Different test scenario parameters ............................................................. 35
Table 6: Actual merging and diverging proportion.................................................. 37
Table 7: Delay improvement .................................................................................... 38
Table 8: Statistical significance of the delay in base case and delay in
control case .......................................................................................... 38
Table 9: Different OD matrices................................................................................ 41
Table 10: Actual number of lane changes in the weaving section, with
different RF ratios ............................................................................... 43
Table 11: Number of lane changes (%) in the weaving section with different
penetration rates .................................................................................. 47
Table 12: Comparison of actual saving time between scenario 1 and
scenario 3 ............................................................................................. 50
Table 13: Comparison of actual saving time between scenario 2 and
scenario 3 ............................................................................................. 50
viii A C-ITS BASED LANE CHANGING ADVISORY FOR WEAVING SECTIONS
List of Abbreviations
API Application programming interface
C-ITS Cooperative Intelligent Transport Systems
FF Freeway to freeway
FR Freeway to ramp
LC Lane change(s)
NL Number of lane changes
RF Ramp to freeway
RSU Roadside unit
RR Ramp to ramp
V2I Vehicle to infrastructure communication
V2V Vehicle to vehicle communication

A C-ITS BASED LANE CHANGING ADVISORY FOR WEAVING SECTIONS ix
03/02/2015
Statement of Original Authorship
The work contained in this thesis has not been previously submitted to meet
requirements for an award at this or any other higher education institution. To the
best of my knowledge and belief, the thesis contains no material previously
published or written by another person except where due reference is made.
Signature:
Date: ________________________
QUT Verified Signature

x A C-ITS BASED LANE CHANGING ADVISORY FOR WEAVING SECTIONS
Dedication and Acknowledgements
Dedication
The thesis is dedicated with love and passion to my parents, Toan and Chi, my
love, Phan My, and to the Mai family.
Acknowledgements
Completing a masters degree is a stepping-stone in my life and I would like to
take this opportunity to thank and show my gratitude to many people who have
helped me.
Firstly, I wish to acknowledge the funding assistance given by the Smart
Transport Research Centre towards this research effort.
I feel very lucky to have worked and studied with my supervisory team. I
would like to express my sincere gratitude to my principal supervisor, Professor
Edward Chung, for giving me this opportunity to finish the masters degree: thank
you, Professor Chung, for your on-going support, your advice and your useful
critiques. I also really appreciate having Dr Rui Jiang as my daily supervisor: thank
you, Dr Jiang, for your guidance, encouragement and instructions throughout my
graduate study. I also extend my gratitude to Dr Marc Philipp Miska for his useful
support.
Special thanks go to Professor Paulo Almeida for his guidance with
programming, which was such an obstacle for me. My thanks also go to Dr Brian
Lee and Dr Ashish Bhaskar for their insightful recommendations and discussions
about my research.

A C-ITS BASED LANE CHANGING ADVISORY FOR WEAVING SECTIONS xi
I would like to thank Jennifer Beale for her assistance with my thesis. Her
professional editing and proofreading greatly helped the readability of my work.
Next, to all my friends, particularly Minh Kieu Le, Hasitha Gamage, Quan
Nguyen and Xinh Nguyen: your friendliness and hospitality have made my stay so
much more enjoyable.
Finally, I also a debt of gratitude to Nguyen Trinh, Thuy Mai and their
wonderful children for their willingness to let me stay at their house during my study
period.

Chapter 1: Introduction 1
Chapter 1: Introduction
1.1 Background
Traffic congestion, a worldwide problem, strongly reduces traffic throughput,
fluidity and safety, as well as increasing trip times and environmental pollution. In
Australia particularly, the cost of congestion, estimated at around $9.4 billion in
2005, is expected to rise to over $20.4 billion by 2020 according to the Australian
Government Department of Infrastructure and Regional Development [1].
The key for tackling traffic congestion is to match traffic demand and traffic
network capacity (supply) by either reducing demand or increasing supply. Traffic
demand, on the one hand, will keep increasing due to increases in population and
car-ownership. Managing demand, such as increasing public transport, might work
well in a high-density population area but might not be an effective method for a
low-density area such as Australia. According to the literature [2], only 11% of the
population take public transport as their main means of transportation. Increasing
network capacity is a more commonly used approach for congestion management.
Traditionally, constructing new infrastructure is considered to be the most
straightforward way. However, this is becoming very difficult for limited financial
funding and environment reasons. Vanderbilt [3] claimed that even though
constructing more road is affordable, it is still not a good way to spend money
because roads are uncongested most of the time. Therefore, intelligent transport
systems (ITS) for maximising the utilisation of current infrastructure such as ramp
metering (RM), variable speed limits (VSL), adaptive signal control and cooperative
ITS (C-ITS) are of great benefit for managing traffic congestion.
2 Chapter 1: Introduction
Weaving sections, a common design of motorways, are defined as the crossing
of two or more traffic streams travelling in the same direction along a significant
length of motorway, without the aid of traffic control devices. Characteristic of such
sections is that they require extensive lane change manoeuvres, one of the most risky
manoeuvres that drivers have to perform in the motorway system [4]. These
manoeuvres often cause turbulence, reduce travel speed, build up congestion and
reduce weaving capacity.
A few approaches have been put into practice to manage these sections and to
improve their operations, such as imposing speed limits [5] and modifying physical
lane markings [6]. However, the improvements were insignificant (imposing speed
limits) or lacked consideration of factors that influence weaving capacity (modifying
physical lane markings). Hence, there are still opportunities for better management at
these sections.
Thanks to the development of wireless technology, vehicles are now able to
exchange information with other vehicles and infrastructures [7]. This emerging
technology, the so-called C-ITS, offers a new way to increase traffic safety,
productivity and efficiency.
This research seeks a possible way to manage the weaving sections of
motorways with C-ITS, so that a comprehensive evaluation for reducing traffic
congestion and conflicts can be achieved.
1.2 Research problem
As noted, weaving sections, a common design of motorways, are defined as the
crossing of two or more traffic streams travelling in the same direction along a
significant length of motorway, without the aid of traffic control devices.
Chapter 1: Introduction 3
Characteristic of such sections is that they require extensive lane change manoeuvres
[4]. A lane change is a process involving a high level of interaction when vehicles
manoeuvre laterally from one lane to another [8]. These interactions are difficult to
predict because vehicles have to negotiate with the surrounding counterparts to
perform lane changes [9]. Jula et al. [10] affirmed that the lane-changing manoeuvres
are one of the riskiest manoeuvres that drivers have to perform in a motorway system
to merge or diverge into the destination lane. Even though the lane-change crash
problem is relatively small compared with other types of crashes (lane-changing
crashes account for only 4% of all police-reported crashes and around 0.5% of all
fatalities), it is responsible for one-tenth of all traffic delays caused by crashes [4].
Weaving sections are also the main source of traffic bottleneck congestion
[11], which can reduces traffic efficiency by 20% to 50% [12]. The bottleneck
problem in weaving sections is the result of the concentration of merging and
diverging manoeuvers. Empirical data have shown that drivers tend to perform lane
changes close to the merge gore as the traffic volume increases: this behaviour builds
up congestion. Hence, weaving manoeuvres affect the driving comfort, safety and
operational aspects.
To alleviate the merging and diverging concentration problem, only one
technique has yet been put into practice [6] (detailed information is provided in the
literature review, section 2.1.4). However, this current technique is somehow not
finding ways to utilize the entire weaving section. If the weaving length is used
properly and in a coordinated way, travel time can be reduced and conflicts can be
kept to a minimum.
4 Chapter 1: Introduction
1.3 Purposes and aim
The hypothesis for this research is that managing weaving sections with C-ITS
can alleviate congestion and reduce travel time. The research questions are,
therefore, as follows:
How can the C-ITS improves the utilization of current infrastructure by
vehicle-to-infrastructure communication?
How is the C-ITS application influenced by penetration rates?
At which traffic demand does the C-ITS provides the best measurement
of effectiveness?
What are the impacts of the proposed strategy on different weaving
geometries?
The specific objectives of the research project are to:
Review weaving sections and up-to-date weaving section management
techniques.
Review the nature of the C-ITS, including the advantages of
cooperative systems, in order to reduce congestion and to increase
traffic throughput at weaving sections.
Propose a lane-changing advisory strategy for weaving vehicles.
Investigate the proposed strategy with different traffic demands.
Examine the impacts of the proposed strategy with different penetration
rates and geometries.
Chapter 1: Introduction 5
1.4 Research Significance
The key components of this study are to utilize current existing weaving
sections and to reduce travel time by organizing lane-changing actions and
cooperation between vehicles and infrastructures. The research is expected to have
both practical and scientific significance.
Scientific significance: to the best of the author’s knowledge, this
research is the first attempt to manage weaving sections with C-ITS.
The achieved outcomes are also providing state-of-the-art knowledge in
the C-ITS and weaving sections field.
Practical significance: the proposed strategy, the lane-changing
advisory, can be implemented in any existing one-sided ramp weaves.
This will be a win-win process for drivers (less travel time) and for
traffic operation authorities, whose main targets are to ensure the
motorways networks run smoothly and to receive the maximum cost-
effect when investigating any road infrastructure projects.
1.5 Thesis Outline
The thesis is outlined as follows. Chapter 2 reviews the existing knowledge on
weaving sections, including the influencing factors on weaving capacity and driver
behaviour at weaving sections. It also presents the nature of C-ITS and how it can
assist in alleviating the problem at weaving sections. Chapter 3 details the
methodology as well as the proposed strategy. Chapter 4 describes the simulation
study, which includes the calibrated model and the simulation result analyses, each
with different scenarios. Chapter 5 summaries the main findings by answering the
research questions, before outlining suggestions of future works.

6 Chapter 1: Introduction
Chapter 2: Literature Review 7
Chapter 2: Literature Review
The aim of this chapter is to provide the critical knowledge from the existing
literature that will form the foundation for this study. This chapter first reviews the
weaving section – the influenced factors on weaving capacity, the empirical data on
weaving behaviour that causes the bottleneck problem, and weaving management
techniques. Second, it outlines the Cooperative Intelligent Transport Systems (C-
ITS) – the nature of C-ITS and its related characteristics. The final section of the
chapter highlights the implications from the literature about how the C-ITS can assist
in alleviating the problem in weaving sections, and develops the framework for the
study in Chapter 3.
2.1 Weaving section
2.1.1 Weaving section definition
The Highway Capacity Manual 2010 [13] defines weaving sections as:
Sections in which two or more traffic streams travelling in the
same general direction cross paths along a significant length of
freeway without the aid of traffic control devices (except for guide
signs). Weaving sections are formed when a diverge segment closely
follows a merge segment or when a one-lane off-ramp closely follows
a one-lane on-ramp and the two are connected by a continuous
auxiliary lane.
The terms ‘weaving’, ‘merging’, and ‘diverging’ are sometimes unclear as their
individual meaning are difficult to isolate. Roess et al. [14] defined the differences
among these terms:

8 Chapter 2: Literature Review
Weaving occurs when one movement must cross the path of another
along a length of facility without the aid of signals or other control devices.
Such situations are created when a merge area is closely followed by a
diverge area. Merging occurs when two separate traffic stream join to form a
single stream, while diverging occurs when one traffic stream separates to
form two separate traffic streams.
Weaving sections are classified into two different types, one-sided and two-
sided, based on their configurations and the minimum amount of lane changing
required. This research, however, focuses only on one-sided weaving sections, in
which no weaving manoeuvres require more than two-lane changes to be completed
successfully and all the weaving movements are taken on one side of the section.
The geometry of the one-sided ramp weave, where a one-lane on-ramp is
followed by a one-lane off-ramp, with a continuous auxiliary lane between the
ramps, is illustrated in Figure 1. Note that the case of an on-ramp followed by off-
ramps that are not joined by a continuous auxiliary lane is not considered to be a
ramp-weaving section. It is treated as separate merge and diverge areas [15].
Figure 1: One-sided ramp weaving section
A weaving section always has four different flows: the two that cross each
other’s path are weaving flows; those that do not are non-weaving flows. As drawn
in Figure 2, vehicles entering on leg A and exiting on leg D cross the path of vehicles
entering on leg B and exiting on leg C. These are the weaving flows. Movement A-C

Chapter 2: Literature Review 9
and B-D do not have to cross the path of any other movements, even though they
may share lanes, and they are referred to as non-weaving flows.
Figure 2: Weaving and non-weaving flows
where:
BD: Freeway to freeway flow (FF)
AD: Ramp to freeway flow (RF)
BC: Freeway to ramp flow (FR)
AC: Ramp to ramp flow (RR)
2.1.2 Factors influencing weaving capacity
Many factors influence weaving capacity: in particular, volume ratio, weaving
ratio, weaving width and length of weaving and traffic flow composition. This
section outlines the characteristic of these.
2.1.2.1 Volume ratio
Volume ratio (VR) is the ratio of the total weaving volume to the total flow
entering the section. It is represented by VR = (VBC+AD) / (VTotal).
2.1.2.2 Weaving ratio
The weaving ratio (R) is defined as the ratio of the smaller weaving flow rate
to the total weaving flow rate. It is represented by R=VAD / (VAD+BC) or
VBC / (VAD+BC).
10 Chapter 2: Literature Review
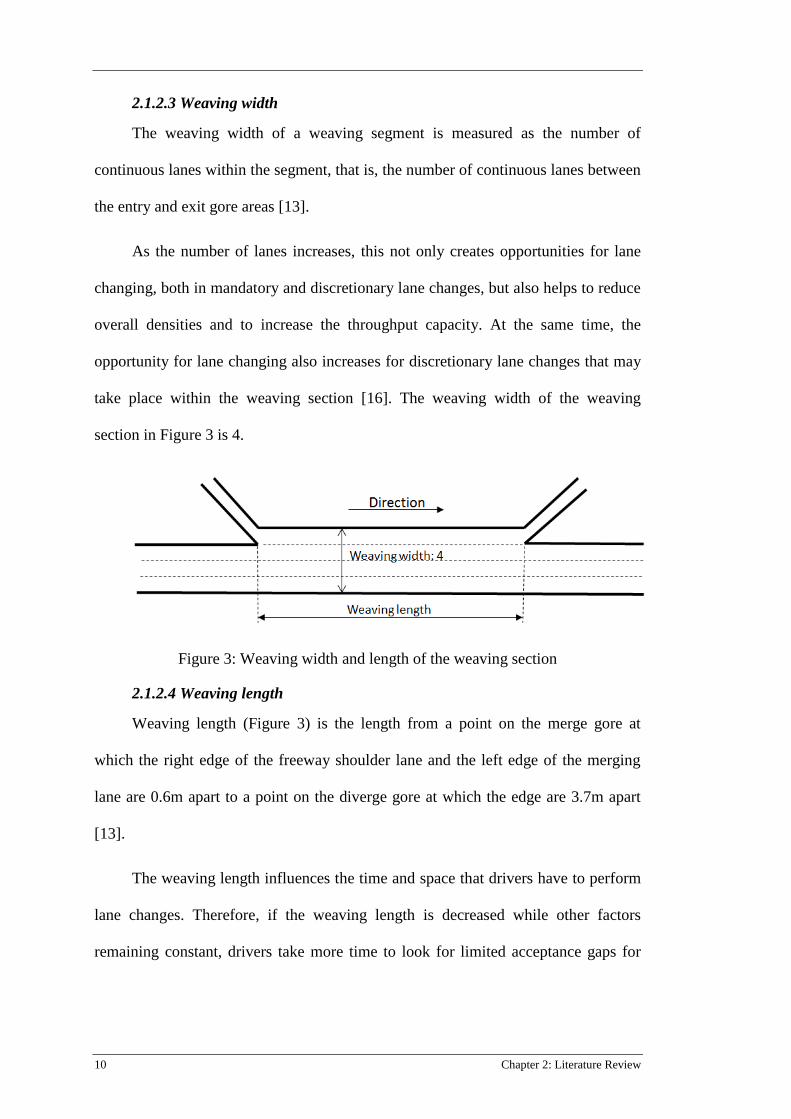
2.1.2.3 Weaving width
The weaving width of a weaving segment is measured as the number of
continuous lanes within the segment, that is, the number of continuous lanes between
the entry and exit gore areas [13].
As the number of lanes increases, this not only creates opportunities for lane
changing, both in mandatory and discretionary lane changes, but also helps to reduce
overall densities and to increase the throughput capacity. At the same time, the
opportunity for lane changing also increases for discretionary lane changes that may
take place within the weaving section [16]. The weaving width of the weaving
section in Figure 3 is 4.
Figure 3: Weaving width and length of the weaving section
2.1.2.4 Weaving length
Weaving length (Figure 3) is the length from a point on the merge gore at
which the right edge of the freeway shoulder lane and the left edge of the merging
lane are 0.6m apart to a point on the diverge gore at which the edge are 3.7m apart
[13].
The weaving length influences the time and space that drivers have to perform
lane changes. Therefore, if the weaving length is decreased while other factors
remaining constant, drivers take more time to look for limited acceptance gaps for

Chapter 2: Literature Review 11
lane changes. As a result, this creates turbulence and reduces the travel speed and the
weaving capacity [17].
In their study of one-sided weaving sections, Fitzpatrick and Nowlin [18]
suggested that weaving sections should be operated at a minimum of 200m, even
though a weaving section at 300m is desirable. Their reason is that traffic starts to
break down quicker with weaving section in which the weaving length is less than
200m.
However, Vermijs [19] proved that even though the weaving length helps to
increase weaving capacity, it has no or minimum impact on the capacity when it
reaches a specific length. It has been shown that weaving section more than 400m
had no significant impacts on weaving capacity.
2.1.2.5 Traffic flow composition
Traffic flow composition also affects weaving capacity. Other vehicle types
such as heavy vehicles, high occupancy or buses often take up more space and
require more time to complete the weaving due to their relatively slow speeds and
acceleration. Vermijs [19] has verified that when the percentage of truck increases by
5%, weaving capacity decreases by approximately 8%.
2.1.3 Driving behaviour in weaving sections
This sub-section describes the driving behaviour in weaving sections that
caused the concentration problem.
Cassidy et al. [20] were among the first to investigate this behaviour. Their
research concluded that a very high concentration of flow and a high rate of lane-
changing manoeuvres occur near the merge gore. To be more specific, they found
that the majority of lane changes (LC) were made in the first 73m of a 445m weaving
section. The same behaviour was found even where the weaving length is relatively

12 Chapter 2: Literature Review
long. This behaviour tends to increase when the flow rate increases because drivers
become more anxious to change lanes over the short travel distance, and this
increased flow rate encourages them to perform lane changes as soon as possible.
The ‘critical region’ occurs where congestion starts to build up and to propagate
upstream.
Kwon et al. [21] studied weaving behaviour by investigating its characteristics
at a 129m one-sided weaving section. The video analysis demonstrates that most of
the LC took place at the first half (65m) of the weaving section. When the weaving
flow increases, diverging vehicles locate themselves into the auxiliary lane right after
they approach the weaving section. Merging vehicles first enter the auxiliary lane,
then travel a considerable distance before changing lane to the mainstream.
Congestion is created right after the merge gore, which reduces weaving capacity
dramatically.
Denny and Williams [22] examined the capacity and quality of service of
several weaving sections in California. Their two hours of video data proved that
weaving vehicles tried to execute LC as soon as they could in the weaving area. This
shows that the weaving capacity is mostly associated with the merging gore areas. It
was found that approximately 85% of the manoeuvres took place in the first 120m to
150m of the 400m weaving sections. As a result, a queue formed near the merge gore
while the weaving section downstream is starved for demand.
Another study was conducted by Ho Lee [15] to investigate the bottleneck at
weaving section .One important observation that came out of this research was that
the tendency of diverging vehicles to change lane close to merge gore areas is
influenced by the space availability in the auxiliary lane. In fact, diverging vehicles
are more likely to change lanes close to the merge gore if the ramp to freeway traffic

Chapter 2: Literature Review 13
is low. When the number of diverging vehicles change lane close to the merge gore
increases, the bottleneck becomes more severe.
The latest empirical data was investigated by Al-Jameel [23]. Within that
research, the author divided the 400m weaving section into four segments from the
merge gore (0-50m, 50-100m, 100-150m and >150m) and explored the lane-
changing location. The research found that approximately 80% of merging vehicles
and up to 90% of diverging vehicles completed LC in the first 100m of the 400m
weaving section.
In summary, this sub-section outlines the driving behaviour in weaving
sections. One can see that drivers are more likely to change lane as close to merge
gore as possible when they enter the weaving section. This behaviour creates a very
high lane-changing concentration, up to 90%. Thus, congestion builds up, limiting
weaving capacity. The next section presents the up-to-date weaving section
management techniques.
2.1.4 Weaving section management techniques
The bottleneck that is formed by the concentration of weaving vehicles is a
clear problem and better use of the existing infrastructure seems to be the effective
solution.
Only one technique has been used in weaving sections to alleviate the
concentration of merging and diverging vehicles close to merge gore areas up to date
even though there are many literatures that have examined the lane-changing
behaviour at weaving sections. This is because the lane changing at weaving sections
is a complicated process that involves a high level of interactions when vehicles
manoeuvre laterally from one lane to another [8] . Al-Jameel [6] has proposed a
method that shifts diverging vehicles to the end of the auxiliary. A solid line marked
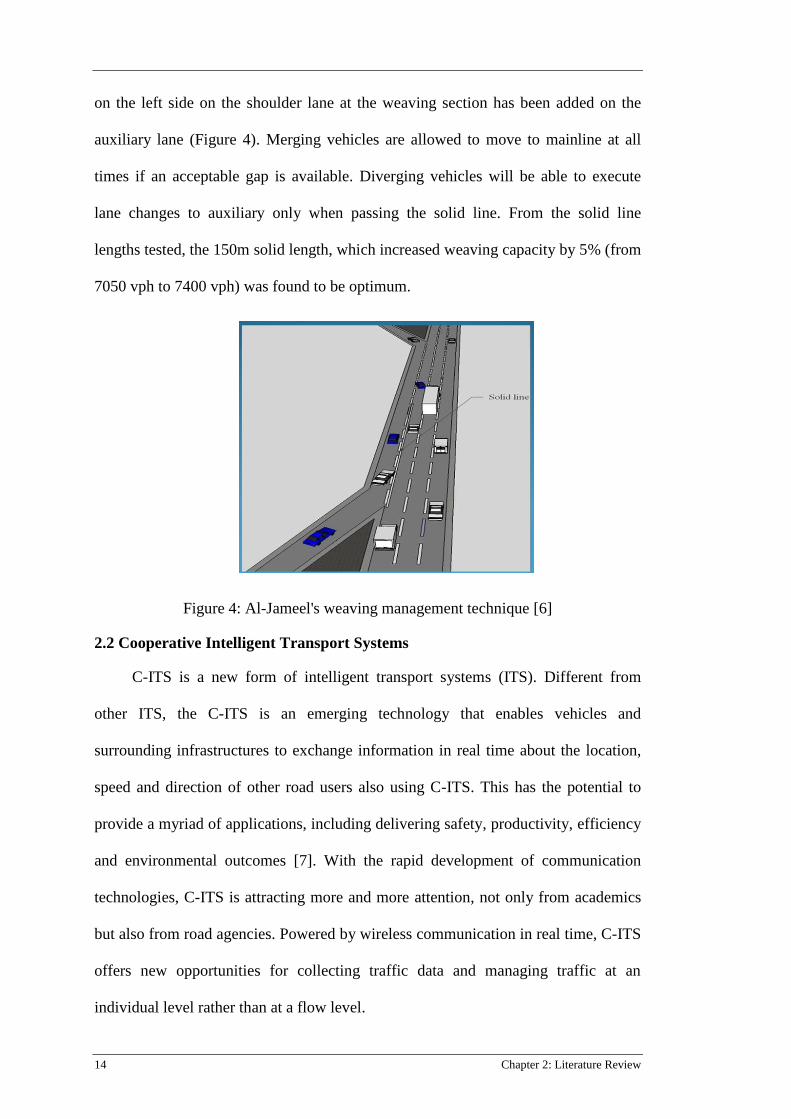
14 Chapter 2: Literature Review
on the left side on the shoulder lane at the weaving section has been added on the
auxiliary lane (Figure 4). Merging vehicles are allowed to move to mainline at all
times if an acceptable gap is available. Diverging vehicles will be able to execute
lane changes to auxiliary only when passing the solid line. From the solid line
lengths tested, the 150m solid length, which increased weaving capacity by 5% (from
7050 vph to 7400 vph) was found to be optimum.
Figure 4: Al-Jameel's weaving management technique [6]
2.2 Cooperative Intelligent Transport Systems
C-ITS is a new form of intelligent transport systems (ITS). Different from
other ITS, the C-ITS is an emerging technology that enables vehicles and
surrounding infrastructures to exchange information in real time about the location,
speed and direction of other road users also using C-ITS. This has the potential to
provide a myriad of applications, including delivering safety, productivity, efficiency
and environmental outcomes [7]. With the rapid development of communication
technologies, C-ITS is attracting more and more attention, not only from academics
but also from road agencies. Powered by wireless communication in real time, C-ITS
offers new opportunities for collecting traffic data and managing traffic at an
individual level rather than at a flow level.
Chapter 2: Literature Review 15
Firstly, C-ITS is able to measure individual vehicle data containing rich
information. Compared with traditional point data measures (e.g. loop detector),
individual vehicle data can provide better-aggregated measurement of traffic flow
(i.e. flow, speed and headway). More importantly, C-ITS is able to directly measure
density, the most useful and stable measurement for traffic control systems, such as
ramp metering (RM) and variable speed limit (VSL). A real time origin-destination
(OD) matrix, another important input for traffic control systems, can also be well
estimated based on individual data collected from C-ITS. Besides, individual vehicle
data are the best source for studying driving behaviours and traffic flow modelling
(especially for the bottleneck sections, such as the merging and weaving sections).
Secondly, C-ITS can regulate each individual vehicle for both traffic safety and
efficiency according to its surrounding traffic conditions. By monitoring distances
from surrounding vehicles, C-ITS can improve traffic safety by preventing crashes.
C-ITS can also contribute to traffic efficiency. For example, in the case of the
merging areas on motorways, Park [24] stated that not taking the actual individual
vehicles into account creates non-smooth merging actions due to the non-distributed
gap at the merging area. Some cars may have more room to merge; others have to
wait due to a lack of gaps, which reduces the total motorway capacity, making it
underutilized. With C-ITS, the whole merging process can be cooperative between
ramp vehicles and mainline vehicles to maximise the total capacity.
C-ITS provides services to all road users and operators [7]. The two primarily
connections through wireless communication are:
Vehicle-to-vehicle (V2V) connection
Vehicle and infrastructure, roadside unit, (V2I) connection
16 Chapter 2: Literature Review
2.2.1 Levels of C-ITS assistance
The main differences among the systems are driver reaction time, a substantial factor
in preventing lane change crashes, and the degree to which functions are taken over
by the system rather than left for the drivers. The U.S. Department of Transportation
[4] has identified four different levels of C-ITS assistance on driving behaviour.
Driver information systems: provide drivers with information regarding
traffic state and driving environment. However, as the warning signs
are not included, drivers are responsible for judging whether/when it is
safe to make a lane change.
Advisory/cooperative systems: unlike the driver information systems,
these types of applications include warning safety messages when
certain thresholds are exceeded. The safety messages are forwarded to
affected vehicles to warn about the presence of other vehicles in the
adjacent lanes. Instructive messages are also sent to drivers to advise
them in dealing with the situations (i.e. brake and/or decelerate).
Semi-automatic systems: to avoid crashes, vehicles will be partially
controlled in critical situations to avoid crashes by locking a part of the
vehicle components, such as the brake or accelerating pedal. After
crossing the potential hazard, drivers remain responsible for their
driving.
Fully automatic control systems: the highest level of C-ITS assistance,
to control the vehicle fully and automatically, means that the required
reaction time is (nearly) zero. The strategy involves fully automatic
braking, automatic steering, and throttle control without driver
intervention.
Chapter 2: Literature Review 17
It is proposed that a cooperative system will be implemented in this study,
rather than a (semi) automatic system. The author believes that there is still a long
way to go until fully automatic control can be implemented. Hence, a cooperative
system should be the next step to build the foundation in the field.
2.2.2 Types of C-ITS communications
Vehicle to vehicle (V2V) and vehicle to infrastructure (V2I) are two different
communication links of C-ITS. This section outlines the main characteristics,
advantages and disadvantage of these links. From this judgment, the type of
communication link is selected for the study.
V2V, by its name, has the ability to communicate directly with other vehicles.
Hence, this enables a number of safety applications. These types of applications alert
drivers to the potential dangers, to increase their awareness and to avoid
unforeseeable accidents. V2V can communicate with other vehicles for a small to
medium distance (300m to 1000m ) without the aid of roadside unit (RSU) in a fast
and reliable channel [25].
However, it is the driver’s responsibility to decide the relevance and the
appropriate actions (i.e. what to do when they receive the forward collision warning).
Another problem of V2V communication is that it is not very useful if the number of
equipped vehicles is low [26].
Vehicles can also communicate with infrastructures via RSU and vice versa to
form a V2I link. With the V2I communication link, RSU can forward personalized
messages to targeted groups of vehicles for better traffic management. In addition,
the communication range can be extended by the connections among RSUs, which is
very useful for traffic efficiency and traffic coordination applications [27].
18 Chapter 2: Literature Review
The drawback of the V2I link is that the supported infrastructures are not
currently available so would require additional cost for their installation [26]. To
increase its efficiency, it can be installed first at the hot spots, such as on-ramps, off-
ramps or weaving sections.
Choosing which type of C-ITS communication connection depends on the
application type and the link’s characteristics. Since the scope of this project is to
increase traffic efficiency by better coordination between vehicles, this study will
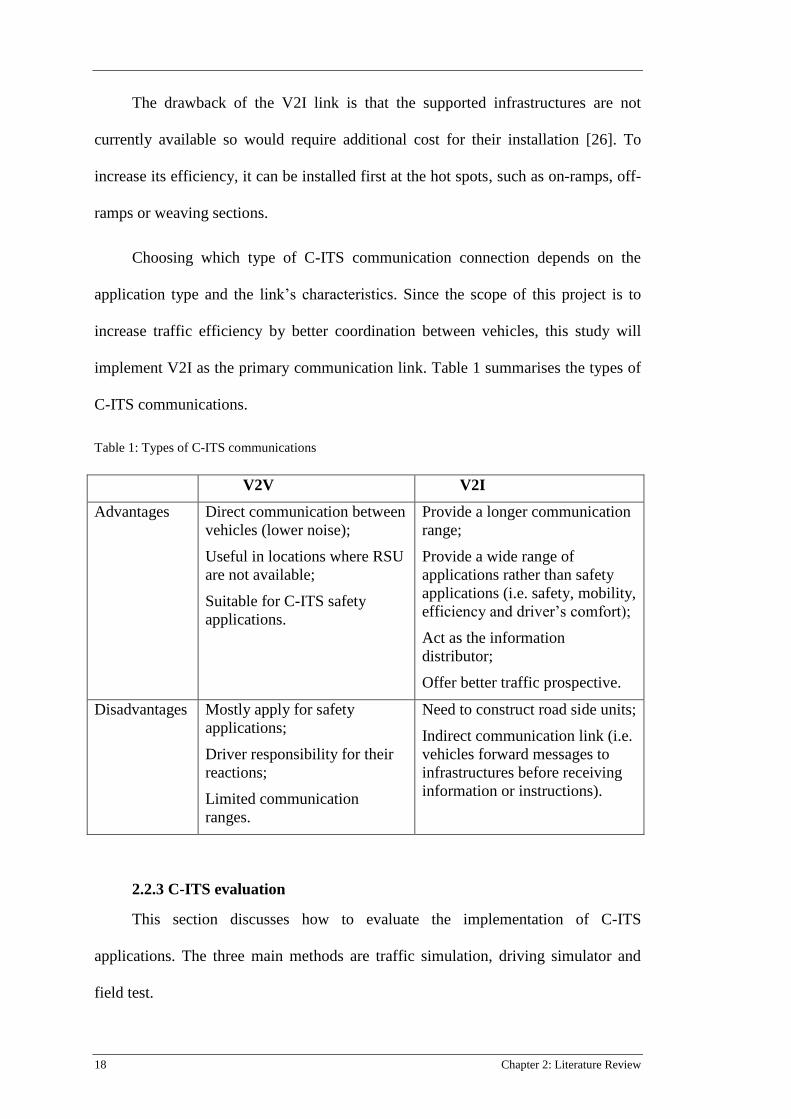
implement V2I as the primary communication link. Table 1 summarises the types of
C-ITS communications.
Table 1: Types of C-ITS communications
V2V V2I
Advantages Direct communication between
vehicles (lower noise);
Useful in locations where RSU
are not available;
Suitable for C-ITS safety
applications.
Provide a longer communication
range;
Provide a wide range of
applications rather than safety
applications (i.e. safety, mobility,
efficiency and driver’s comfort);
Act as the information
distributor;
Offer better traffic prospective.
Disadvantages Mostly apply for safety
applications;
Driver responsibility for their
reactions;
Limited communication
ranges.
Need to construct road side units;
Indirect communication link (i.e.
vehicles forward messages to
infrastructures before receiving
information or instructions).
2.2.3 C-ITS evaluation
This section discusses how to evaluate the implementation of C-ITS
applications. The three main methods are traffic simulation, driving simulator and
field test.

Chapter 2: Literature Review 19
2.2.3.1 Traffic simulation
Traffic simulation, the most common method of evaluating C-ITS
applications, will be the best candidate to test any new strategies on the road because
it is cost-effective. Other benefits of using traffic simulation include no legal or
safety concerns, and full controllability and flexibility of the test scenarios [28].
Specifically, a field experiment usually involves a limited number of participants,
which raises the legal and safety issues; and some of the test scenarios, such as a
different percentage of compliance rates, are difficult to be controlled and tested with
field experiment.
Generally, traffic models are categorised as microscopic, mesoscopic and
macroscopic [29]. Different models present different levels of detail of traffic flow:
the microscopic model is based on car-following and lane-changing models of
individual vehicles; the mesoscopic model looks at the behaviour of a platoon; and
the macroscopic model considers only aggregated traffic flow features, including
flow, density and speed [29]. The microscopic model is the most appropriate for
assessing C-ITS applications because it has the resolution of analysing the impact on
individual vehicles [30]. The drawbacks of the microscopic model are the accuracy
of interpreting driver behaviour and the difficulty in calibration and validation, as
well as the difficulty in assessing traffic safety [29].
2.2.3.2 Driving simulator
The driving simulator is a tool to model a realistic driving environment. The
main objective of deploying a driving simulator for a C-ITS application is to evaluate
the impact on safety and driving behaviours in a risk-free environment. It is therefore
a suitable method to test in the field any new applications, which are dangerous and
difficult to test. The simulator ensures drivers experience the same situation and
20 Chapter 2: Literature Review
realistic driving conditions with guaranteed safety, which also ensures the tests could
be repeated several times without putting in too much work, compared to field
testing [31]. The test can be done with a range of different vehicle types such as
passenger cars, trucks or commercial vehicles.
The disadvantage is that the test cannot be used for a large-scale experiment.
Normally, there is only one vehicle with a simulated driving environment available at
one time. Another disadvantage is that some of the negative effects recorded by the
simulator, such as sickness and discomfort (not all participants feel the same effects),
affect the accuracy of the results. Consequently, there is some disagreement between
driving simulators and the real data obtained [32]. The driving simulator has been
implemented in many big projects in Europe, such as COOPERS and CVIS.
2.2.3.3 Field operational test
A field test is the ultimate way of evaluating C-ITS because it provides the real
situations and environment, which means the results are reliable and accurate. Willke
et al. [33] stated that much research is based on oversimplified networks and models,
which emphasizes the importance of field tests in the evaluation step. However, field
testing is usually costly and time-consuming, preparing the test equipment and
carrying out large-scale experiments. In addition, safety is always a concern for field
tests. Few projects so far have had the C-ITS application assessed by large-scale field
tests. Table 2 provides a comparison of different C-ITS evaluation methods.
Chapter 2: Literature Review 21
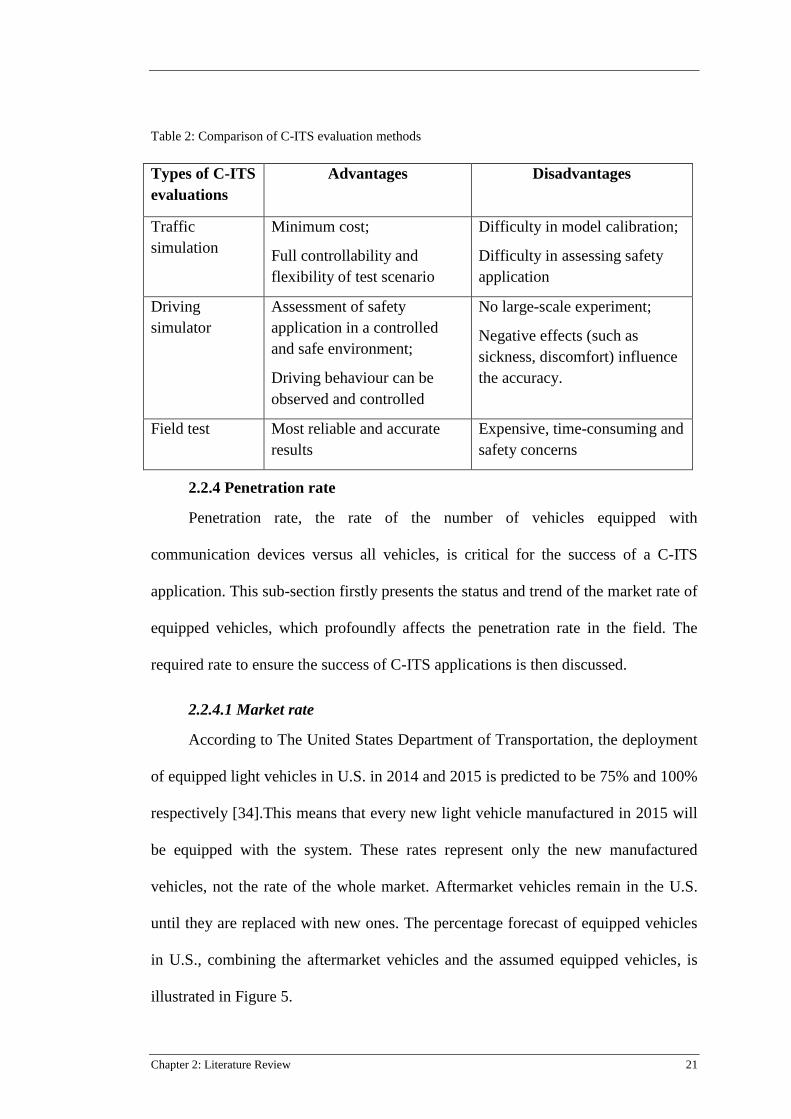
Table 2: Comparison of C-ITS evaluation methods
Types of C-ITS
evaluations
Advantages Disadvantages
Traffic
simulation
Minimum cost;
Full controllability and
flexibility of test scenario
Difficulty in model calibration;
Difficulty in assessing safety
application
Driving
simulator
Assessment of safety
application in a controlled
and safe environment;
Driving behaviour can be
observed and controlled
No large-scale experiment;
Negative effects (such as
sickness, discomfort) influence
the accuracy.
Field test Most reliable and accurate
results
Expensive, time-consuming and
safety concerns
2.2.4 Penetration rate
Penetration rate, the rate of the number of vehicles equipped with
communication devices versus all vehicles, is critical for the success of a C-ITS
application. This sub-section firstly presents the status and trend of the market rate of
equipped vehicles, which profoundly affects the penetration rate in the field. The
required rate to ensure the success of C-ITS applications is then discussed.
2.2.4.1 Market rate
According to The United States Department of Transportation, the deployment
of equipped light vehicles in U.S. in 2014 and 2015 is predicted to be 75% and 100%
respectively [34].This means that every new light vehicle manufactured in 2015 will
be equipped with the system. These rates represent only the new manufactured
vehicles, not the rate of the whole market. Aftermarket vehicles remain in the U.S.
until they are replaced with new ones. The percentage forecast of equipped vehicles
in U.S., combining the aftermarket vehicles and the assumed equipped vehicles, is
illustrated in Figure 5.
22 Chapter 2: Literature Review
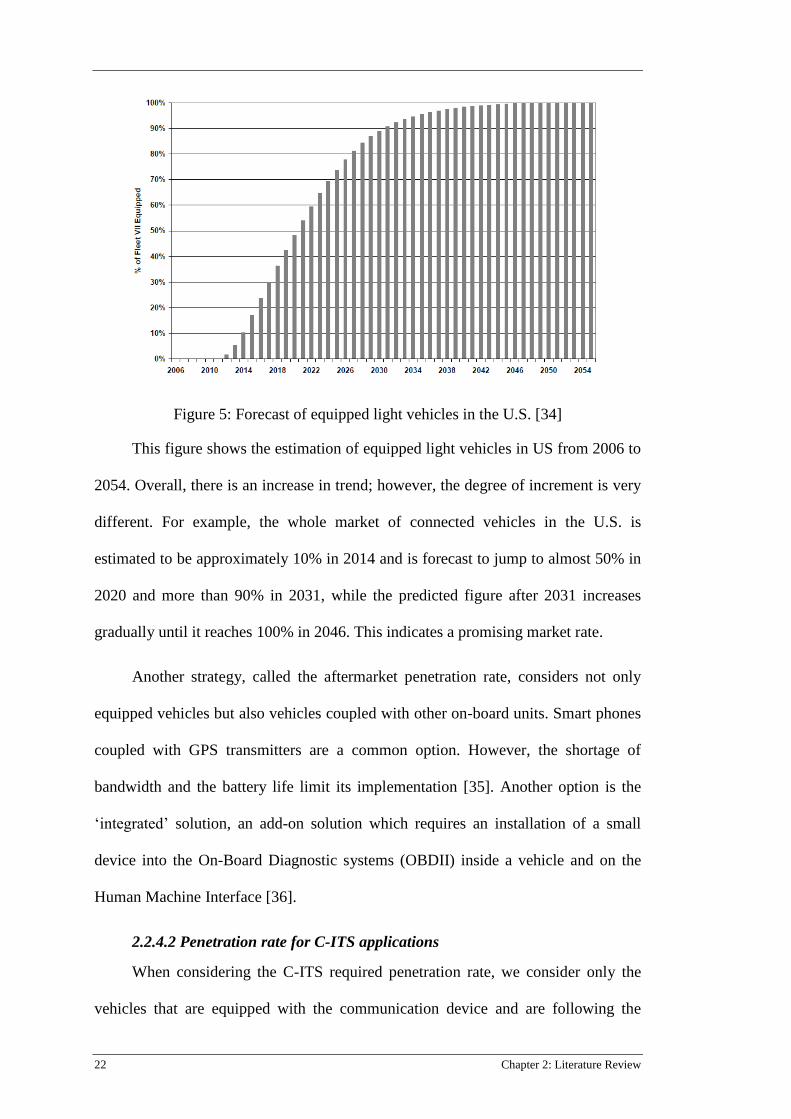
Figure 5: Forecast of equipped light vehicles in the U.S. [34]
This figure shows the estimation of equipped light vehicles in US from 2006 to
2054. Overall, there is an increase in trend; however, the degree of increment is very
different. For example, the whole market of connected vehicles in the U.S. is
estimated to be approximately 10% in 2014 and is forecast to jump to almost 50% in
2020 and more than 90% in 2031, while the predicted figure after 2031 increases
gradually until it reaches 100% in 2046. This indicates a promising market rate.
Another strategy, called the aftermarket penetration rate, considers not only
equipped vehicles but also vehicles coupled with other on-board units. Smart phones
coupled with GPS transmitters are a common option. However, the shortage of
bandwidth and the battery life limit its implementation [35]. Another option is the
‘integrated’ solution, an add-on solution which requires an installation of a small
device into the On-Board Diagnostic systems (OBDII) inside a vehicle and on the
Human Machine Interface [36].
2.2.4.2 Penetration rate for C-ITS applications
When considering the C-ITS required penetration rate, we consider only the
vehicles that are equipped with the communication device and are following the
Chapter 2: Literature Review 23
instructions forwarded by the C-ITS applications. In the rest of this section, the
effective penetration rate is used to measure the C-ITS required penetration rate.
Every application requires a down-mark penetration rate before showing the positive
effects sufficiently. Among these, safety applications require a higher penetration
rate than other types of C-ITS applications [36].
An effective penetration rate is an important factor that has a prominent
influence in the implementation of the C-ITS [37]. After investigating the early lane
changing advisory and the lane merging on-ramp through infrastructure to vehicles
communication, Park et al. [38] concluded that there is a very small improvement in
the merging throughput if the effective penetration rate falls below 90%, and there is
no significant improvement if the rate falls below 70%.
In the case of the dynamic speed advisory, Carlson et al. [39] showed that the
required penetration level of equipped vehicles can be a small proportion because the
equipped vehicles will act as leaders in the platoon in the lane, so the following cars
will have to adjust their speed according to the speed of the leaders. However, there
could be an accident risk if only small numbers of vehicles receive the messages (i.e.
congestion or roadwork ahead) while others do not. Silvano, Farah and Koutsopoulos
[40], in their simulation of I2V in the COOPER project, calibrated that after
receiving information regarding the traffic state, the received message vehicles
reduce their driving speed, thus becoming “obstacles” to following vehicles without
the systems.
The penetration rate fluctuates between different research studies and
applications. Thus, the penetration rate will therefore be carefully tested and analysed
when developing a new strategy within the study.
24 Chapter 2: Literature Review
2.3 Summary
The literature review reveals that a bottleneck problem in the weaving section
results from the merging and diverging manoeuvres concentration. Hence, the entire
length of the weaving section is not used effectively or fully used.
Having better use of the shoulder lane and auxiliary lane is one of the best
ways to tackle the concentration problem. To the best of the author’s knowledge,
there is only one technique that investigated the problem by adding the physical
markings: that outlined in [6]. However, this technique controls only weaving
vehicles from mainstream or on-ramp and does not take into account other factors
influencing weaving capacity, such as weaving ratio, weaving volume and weaving
length. Once the physical marking is drawn, it is applied for all cases.
On the other hand, with C-ITS, vehicles and infrastructures are able to
exchange information in real time. Personalized messages can be sent to advise
individuals or the targeted groups of vehicle. In other words, C-ITS can coordinate
and distribute the weaving vehicles into the existing infrastructure dynamically; other
factors (ratio, volume, length) are also considered.
In short, C-ITS offers an opportunity to address the lane-change concentration
problem, which is mostly created by weaving vehicles at the weaving section. C-ITS
will send personalized guidance/messages to advise weaving vehicles based on their
destination lanes. By doing so, the lane-changing concentration problem can be
alleviated, and the whole weaving section can be fully utilised.
Chapter 3: Methodology and the proposed strategy 25
Chapter 3: Methodology and the proposed strategy
This chapter first describes the methodology adopted in this research to achieve
the aims and objectives stated in Chapter 1 – to utilize the current existing weaving
section via distributing lane changing actions and cooperation between vehicles and
infrastructures – and the stages by which the methodology will be implemented. The
last section details the study’s proposed strategy based on the Cooperative Intelligent
Transport System (C-ITS).
3.1 Research methodology
The research approach is planned in the following stages, depicted in Figure 6.

26 Chapter 3: Methodology and the proposed strategy
Figure 6: Research methodology
Step 1: Literature review
The first stage of the literature review focuses on weaving sections with an in-
depth overview, including the factor influencing weaving capacity and its current
management methods. The second section of the literature gains insight into C-ITS.
In short, the discovered goals of the literature reviewed in Chapter 2 are to:
Provide the evidence of lane-change concentration problems of traffic
at weaving sections;

Chapter 3: Methodology and the proposed strategy 27
Outline the nature of C-ITS and how it can assist to alleviate the
weaving section bottleneck, created by weaving vehicles.
Step 2: Research methodology and the developed strategy
A strategy based on the nature of C-ITS and the current problem with lane
changing at weaving sections will be proposed to lessen the problem and to reduce
travel time. This step is outlined in section 3.2 in this chapter.
Step 3: Simulation and results analyses
After the strategy is proposed, it is carefully implemented and evaluated via the
micro-simulation AIMSUN using code written in Python. Performance indicators
will be examined and chosen based on the current literature. The simulated results
will be compared with those in the base case (uncontrolled case). Chapter 4 presents
the details of this step.
During this evaluation, conclusions will be drawn to prove the hypothesis and
answer the research questions.
Step 4: Conclusion and recommendation for future works
The last step of the research plan is to present the research findings by
answering the research questions. Recommendations for further works are also
included. These steps are outlined in Chapter 5.
3.2 The proposed strategy
As outlined in the literature review section, a very high number of lane-change
manoeuvres occur close to the merge gore area, especially when the traffic flow is
close to capacity. That means the entire length of the weaving section is not fully

28 Chapter 3: Methodology and the proposed strategy
utilized, which is why the length of the weaving zone has no effect on the capacity of
the weaving section beyond a particular value.
Hence, the objective of the proposed strategy is to distribute weaving vehicles
evenly over the existing infrastructure by guiding them to a reference point at which
they can start to merge or diverge. Spreading out the merging and diverging
proportion is expected to reduce the travel time.
The scenario is the one-sided ramp weave, which has three main lanes and one
auxiliary lane as shown in Figure 7. The weaving section is divided into a few
different small segments and each segment contains a particular weaving length.
While non-weaving vehicles travel as normal, weaving vehicles are advised to make
a lane change when they reach a particular reference segment in the weaving section.
Figure 7: Weaving section geometry
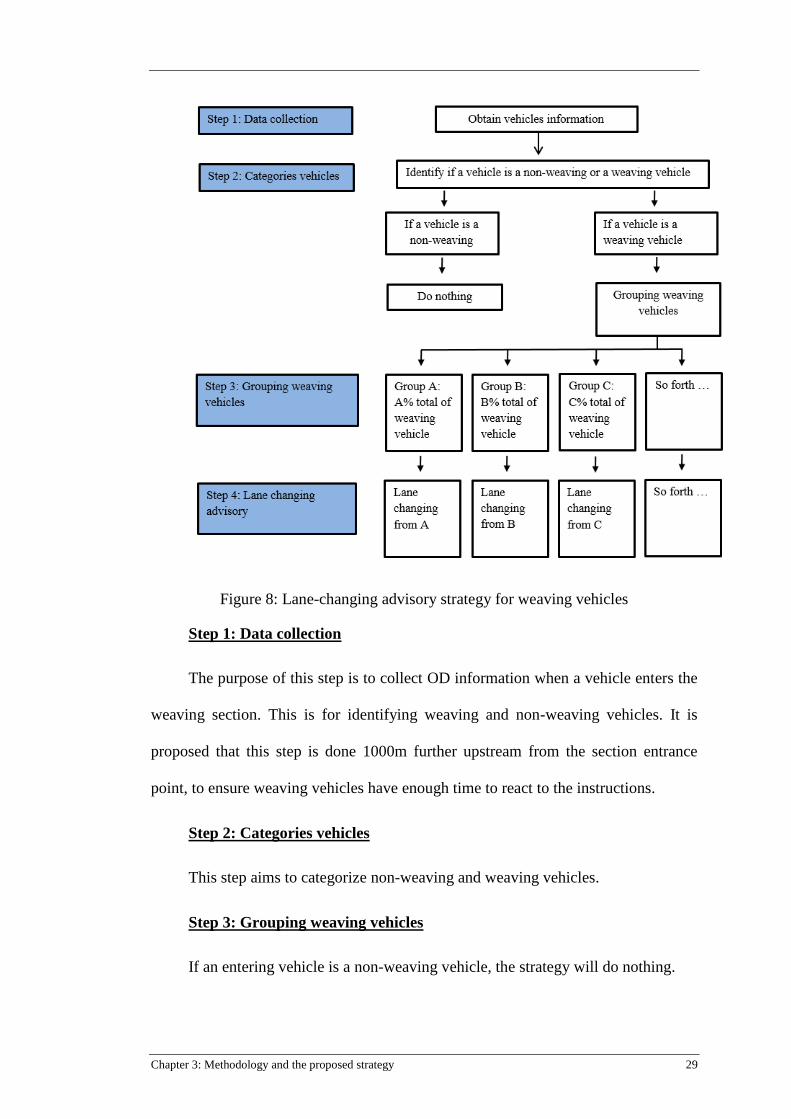
The lane-change advisory strategy flowchart outlined in Figure 8 includes four
steps:
Chapter 3: Methodology and the proposed strategy 29
Figure 8: Lane-changing advisory strategy for weaving vehicles
Step 1: Data collection
The purpose of this step is to collect OD information when a vehicle enters the
weaving section. This is for identifying weaving and non-weaving vehicles. It is
proposed that this step is done 1000m further upstream from the section entrance
point, to ensure weaving vehicles have enough time to react to the instructions.
Step 2: Categories vehicles
This step aims to categorize non-weaving and weaving vehicles.
Step 3: Grouping weaving vehicles
If an entering vehicle is a non-weaving vehicle, the strategy will do nothing.

30 Chapter 3: Methodology and the proposed strategy
If a vehicle enters the system as a weaving vehicle, it will be assigned a
random number (from 0.0 to 1.0). Weaving vehicles are gathered into different
groups based on this random number (uniformly distributed), with each group
containing a distinct weaving vehicle percentage.
Step 4: Lane changing distribution for weaving vehicles
This step aims to advise weaving vehicles of the segment where they can start
executing a lane change. For example, the first weaving vehicle group (group A) can
start to change lanes when they enter the weaving section once they get a proper gap,
the second group should not manoeuvre to another lane until they reach the second
segment (segment B) in the weaving section. The third group of weaving vehicles
should change lane starting from the third segment (segment C) in the section, and so
forth.
Note that the lane changing is still governed by the AIMSUN lane-changing
model. Weaving vehicles are not forced to change lane at the specific segment; they
are, in fact, encouraged to perform a lane change from a particular reference segment
in the weaving section.
3.3 Chapter summary
The chapter presents the methodology used within the study before the
research strategy is illustrated. Details of the development and the result analysis are
presented in Chapter 4.
Chapter 4: Simulation and evaluation of weaving section 31
Chapter 4: Simulation and evaluation of weaving section
This chapter first outlines the simulation test bed and different test scenarios,
then presents and discusses the evaluation results.
4.1. Simulation test bed and different test scenarios
4.1.1 Simulation test bed
The tests are evaluated by the commercially available microscopic traffic
simulation AIMSUN (Advanced Interactive Microscopic for Urban and non-urban
Network). The software was developed by Transportation Simulation System (TSS)
at the Universidad Politecnica Catalynya (UPC), Spain [41]. This powerful
microscopic traffic simulation software makes building the model an easy task, with
errors kept to a minimum. AIMSUN also offers the application programming
interface (API) functions, which enables an interface with external applications so
that users can apply the proposed strategy within the study. The version used in this
study is 8.0.4.
The simulation period is 60 minutes, with a 15 minutes warm-up. To ensure the
test’s credibility, each of the tests was run with 20 different replications. The result is
drawn by taking the average of 20 replications to diminish the outcome variations.
It is not easy to record and capture weaving behaviour in the weaving section.
The main difficulty is obtaining the actual number of lane changes (NL) in the
weaving section. Therefore, the tested network and the adopted data1 are taken from
Al-Jameel’s research paper [23]. The network, a 400 m one-sided ramp weave, has
the following traffic flow rate:
1 In Al-Jameel [22], data provided in the line graphical form, which outlined the traffic volume and
the relative NL in different small segments of the weaving section.

32 Chapter 4: Simulation and evaluation of weaving section
Freeway to freeway (FF): 5300 vph
Freeway to ramp (FR): 900 vph
Ramp to freeway (RF): 900 vph
Ramp to ramp (RR): 100 vph
It is worth noting that the above traffic flow rates consider cars only and heavy
vehicles (such as trucks) are not included.
Calibration is the next step in modelling the test bed. This interactive process
consists of changing model parameters and comparing model outputs with a set of
real data in order to reflect the observed local traffic and driving behaviour condition
being modelled [41]. The data set available for calibration is the NL in the weaving
section.
NL in the weaving section: Al-Jameel [23] investigated NL in terms of
percentage in the weaving section by using video to capture the behaviour. With the
400m weaving section, the author divided the weaving section into four different
segments, namely A (50m), B (50m), C (50m) and D (250m), and recorded the NL
(of weaving vehicles) in each segment;
The model can represent the merging and diverging concentration problem by
adjusting the ‘distance to zone’ parameters in AIMSUN. The default and calibrated
values are shown in Table 3. Other parameters, such as lane-changing cooperation
and side-lane merging distance, were also adjusted. However, no significant
difference was observed.

Chapter 4: Simulation and evaluation of weaving section 33
Table 3: Default and calibrated values in AIMSUN
Road types Motorway On/off ramp
Value Default
value
Calibrated
value
Default
value
Calibrated
value
Distance to zone 1 (m) 500 650 300 300
Distance to zone 2 (m) 100 450 40 120
The NL in terms of percentage of the observed and calibrated values are
revealed in Table 4. The data demonstrate that the calibrated values are close to the
observed values. This is also the best attempt that has been achieved among
numerous simulation runs. The test bed is now ready for comprehensive results
analysis with different test scenarios.
Table 4: Number of lane changes in the weaving section (observed and calibrated values)
Merging vehicles Diverging vehicles
Segment A B C D A B C D
Observed value (%) 45 38 12 5 54 43 3 0
Calibrated value %) 40 50 9 1 54 37 7 2
4.1.2 Test scenarios
To implement the strategy, some initial assumptions are made:
The C-ITS application is coupled with 100% penetration rate (this rate
changes when different penetration rates are tested);
Every vehicle follows the guidance given by the infrastructure;
Every vehicle within the communication zone will be tracked by RSU so
their destination lanes are identified.
The communication signal strength is 100% guaranteed;
The result is evaluated between two different cases:

34 Chapter 4: Simulation and evaluation of weaving section
Base case: the case without applying the strategy in which the bottleneck
occurred;
Control case: the lane-changing advisory applied for weaving vehicles.
Four different scenarios will be investigated as shown in Table 5. As
mentioned in the proposed strategy (section 3.2), the objective of the strategy is to
distribute the weaving proportion further downstream of the weaving section, to
eliminate the bottleneck occurring near the merge gore area. In scenario 1, for
example, the 400 m weaving section is divided into four different small segments,
namely A, B, C, and D. A proportion of weaving vehicles is then assigned; this
assigned weaving advisory proportion of vehicles should change to another lane only
when reaching a reference segment such as:
30% of weaving vehicles are able to start the manoeuvre from segment
A in the weaving section (merge gore), which means they can either
merge or diverge in segment A, B, C or D as long as gaps are available.
Another 15% of weaving vehicles should not manoeuvre to another
lane until they reach segment B (50m from merge gore).
Similarly, 15% of weaving vehicles are encouraged to change lane
when approaching segment C in the weaving section (100m from merge
gore).
Finally, 40% of total weaving vehicles should perform a lane change in
segment D only (150m from merge gore).
Chapter 4: Simulation and evaluation of weaving section 35
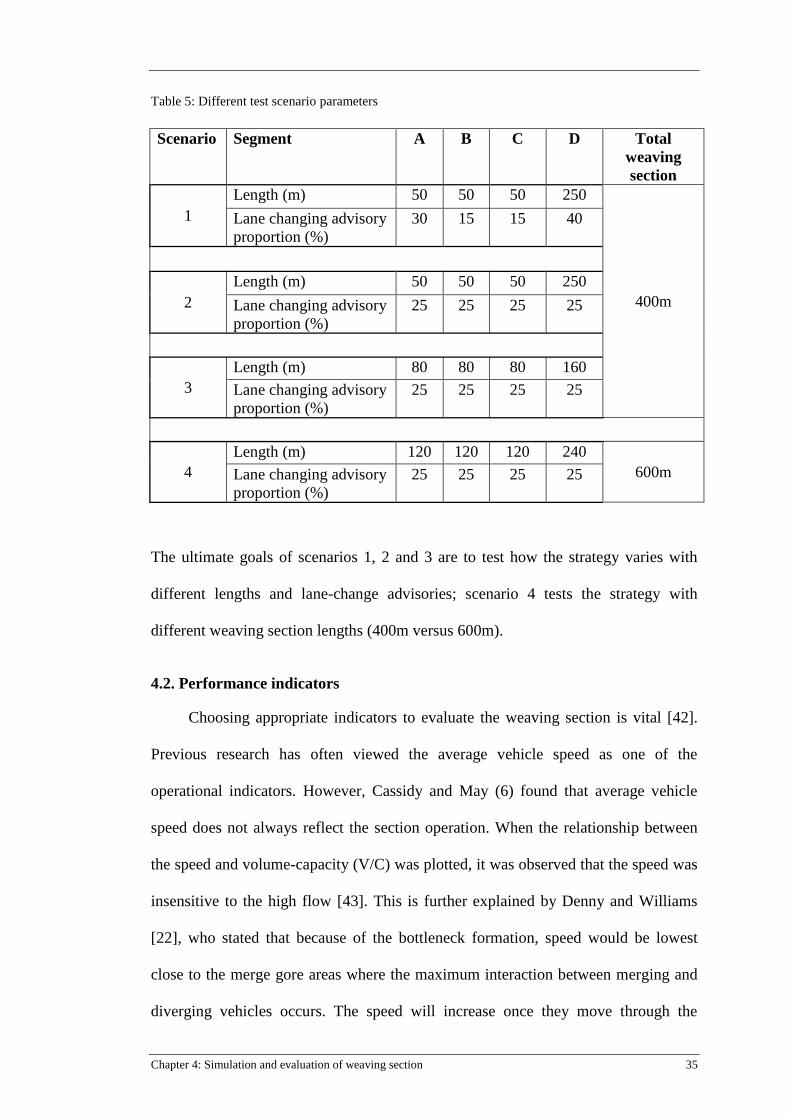
Table 5: Different test scenario parameters
Scenario Segment A B C D Total
weaving
section
1
Length (m) 50 50 50 250
400m
Lane changing advisory
proportion (%)
30 15 15 40
2
Length (m) 50 50 50 250
Lane changing advisory
proportion (%)
25 25 25 25
3
Length (m) 80 80 80 160
Lane changing advisory
proportion (%)
25 25 25 25
4
Length (m) 120 120 120 240
600m Lane changing advisory
proportion (%)
25 25 25 25
The ultimate goals of scenarios 1, 2 and 3 are to test how the strategy varies with
different lengths and lane-change advisories; scenario 4 tests the strategy with
different weaving section lengths (400m versus 600m).
4.2. Performance indicators
Choosing appropriate indicators to evaluate the weaving section is vital [42].
Previous research has often viewed the average vehicle speed as one of the
operational indicators. However, Cassidy and May (6) found that average vehicle
speed does not always reflect the section operation. When the relationship between
the speed and volume-capacity (V/C) was plotted, it was observed that the speed was
insensitive to the high flow [43]. This is further explained by Denny and Williams
[22], who stated that because of the bottleneck formation, speed would be lowest
close to the merge gore areas where the maximum interaction between merging and
diverging vehicles occurs. The speed will increase once they move through the
36 Chapter 4: Simulation and evaluation of weaving section
bottleneck location. Hence, speed will not be used as an operational performance
indicator in this research. Instead, speed shows how smooth drivers cross the
weaving section and observes whether the concentration of merging and diverging
problem has been alleviated successfully.
Instead of applying average speed as the operational indicator, this study
adopts average delay, which is calculated as the difference between the actual travel
time and the free-flow travel time. Actual travel time is recorded by API, which
collects the travel time of individual vehicles passing the network and then calculates
the average delay. The free-flow travel times of the mainline vehicles (FF and FR)
and the on-ramp vehicles (FR and RR) are calculated to be speeds of 100 km/h and
80 km/h respectively. For mainline vehicles, the actual travel time is calculated from
500m upstream from the merge gore to downstream where vehicles pass the weaving
section, while this number for on-ramp vehicles is recorded as 130 m from the merge
gore to the weaving section downstream. The unit of average delay time is second
per vehicle (sec/veh).
Another operational indicator is the actual saving time, which indicates how
many seconds the strategy has saved. The unit of actual saving time is second per
vehicle (s/veh).
In short, the following indicators are adopted within the study:
To understand how smooth drivers cross the weaving section:
o Speed over the weaving section (km/h)
Operational indicators:
o Average delay time (s/veh)
o Actual saving time (s/veh)
Chapter 4: Simulation and evaluation of weaving section 37
4.3 Simulation results and discussion
4.3.1 Evaluation of scenario 1
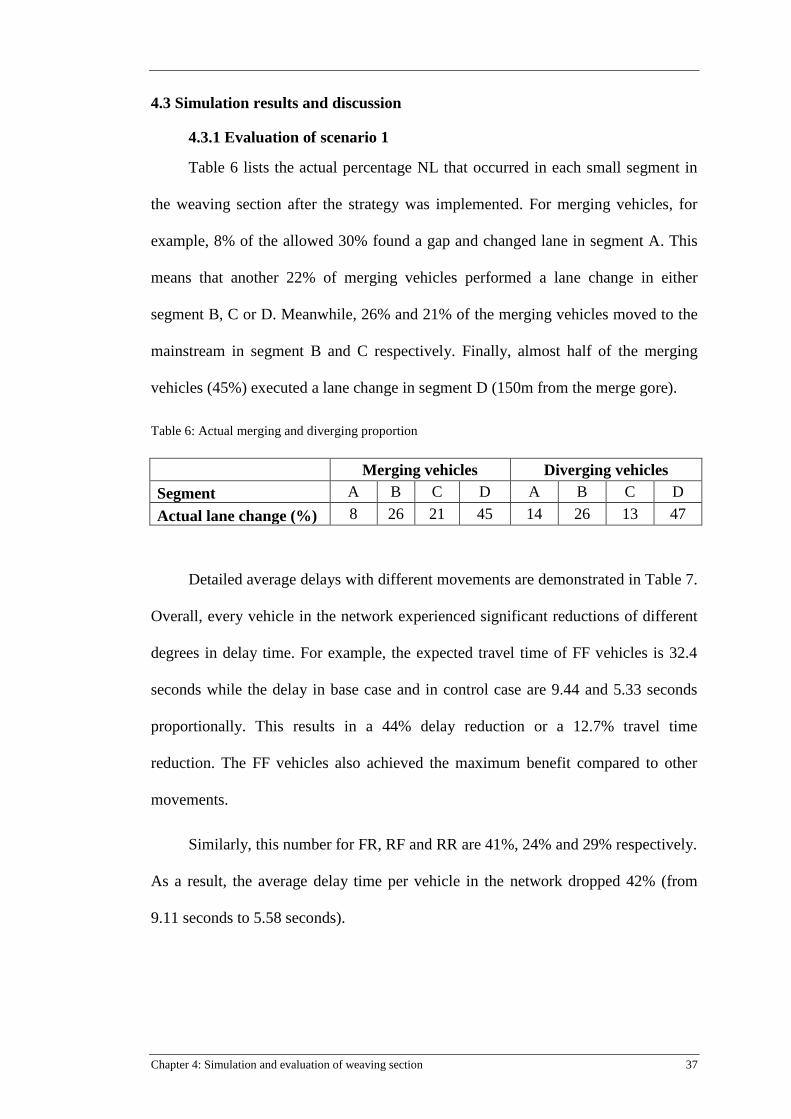
Table 6 lists the actual percentage NL that occurred in each small segment in
the weaving section after the strategy was implemented. For merging vehicles, for
example, 8% of the allowed 30% found a gap and changed lane in segment A. This
means that another 22% of merging vehicles performed a lane change in either
segment B, C or D. Meanwhile, 26% and 21% of the merging vehicles moved to the
mainstream in segment B and C respectively. Finally, almost half of the merging
vehicles (45%) executed a lane change in segment D (150m from the merge gore).
Table 6: Actual merging and diverging proportion
Merging vehicles Diverging vehicles
Segment A B C D A B C D
Actual lane change (%) 8 26 21 45 14 26 13 47
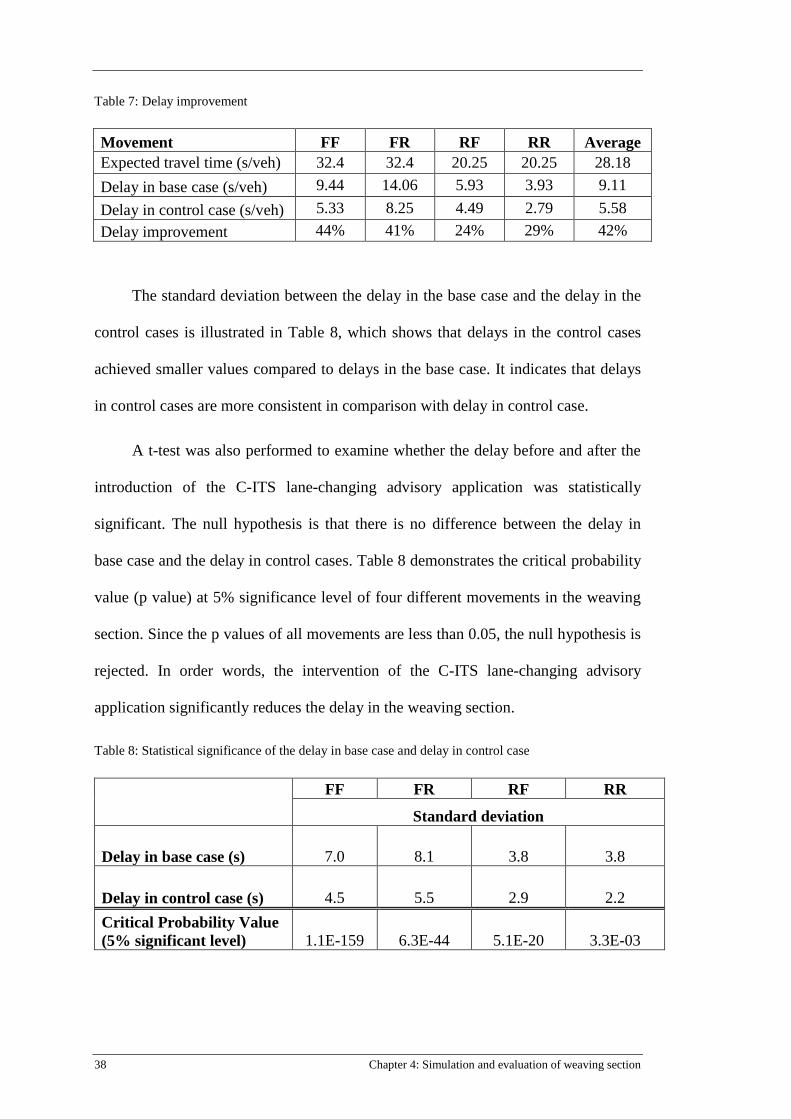
Detailed average delays with different movements are demonstrated in Table 7.
Overall, every vehicle in the network experienced significant reductions of different
degrees in delay time. For example, the expected travel time of FF vehicles is 32.4
seconds while the delay in base case and in control case are 9.44 and 5.33 seconds
proportionally. This results in a 44% delay reduction or a 12.7% travel time
reduction. The FF vehicles also achieved the maximum benefit compared to other
movements.
Similarly, this number for FR, RF and RR are 41%, 24% and 29% respectively.
As a result, the average delay time per vehicle in the network dropped 42% (from
9.11 seconds to 5.58 seconds).
38 Chapter 4: Simulation and evaluation of weaving section
Table 7: Delay improvement
Movement FF FR RF RR Average
Expected travel time (s/veh) 32.4 32.4 20.25 20.25 28.18
Delay in base case (s/veh) 9.44 14.06 5.93 3.93 9.11
Delay in control case (s/veh) 5.33 8.25 4.49 2.79 5.58
Delay improvement 44% 41% 24% 29% 42%
The standard deviation between the delay in the base case and the delay in the
control cases is illustrated in Table 8, which shows that delays in the control cases
achieved smaller values compared to delays in the base case. It indicates that delays
in control cases are more consistent in comparison with delay in control case.
A t-test was also performed to examine whether the delay before and after the
introduction of the C-ITS lane-changing advisory application was statistically
significant. The null hypothesis is that there is no difference between the delay in
base case and the delay in control cases. Table 8 demonstrates the critical probability
value (p value) at 5% significance level of four different movements in the weaving
section. Since the p values of all movements are less than 0.05, the null hypothesis is
rejected. In order words, the intervention of the C-ITS lane-changing advisory
application significantly reduces the delay in the weaving section.
Table 8: Statistical significance of the delay in base case and delay in control case
FF FR RF RR
Standard deviation
Delay in base case (s) 7.0 8.1 3.8 3.8
Delay in control case (s) 4.5 5.5 2.9 2.2
Critical Probability Value
(5% significant level) 1.1E-159 6.3E-44 5.1E-20 3.3E-03

Chapter 4: Simulation and evaluation of weaving section 39
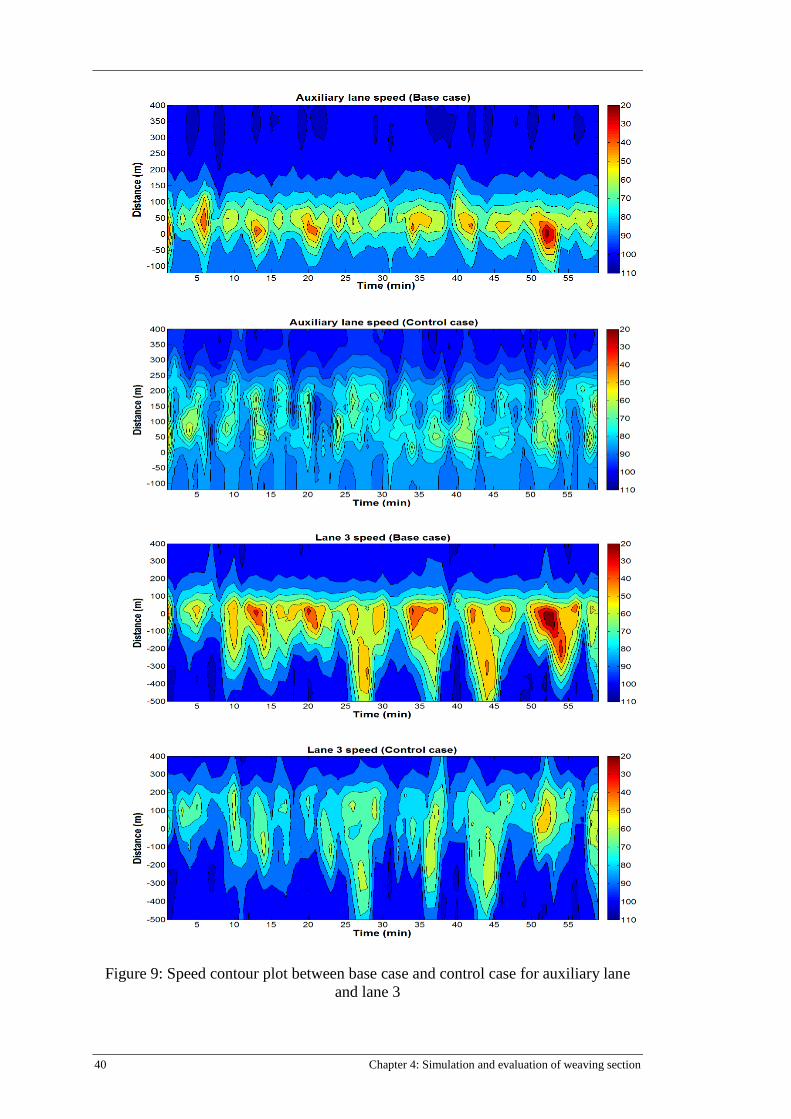
Figure 9 illustrates the speed contours of the auxiliary lane and lane 3 (shoulder
lane), in which most of the turbulences in the weaving section occur. The speed
contour plots are not intended to measure the operational effectiveness. In fact, they
show that the concentration of merging and diverging problems has been alleviated
successfully; the long queue no longer exists. The control case also achieved
smoother speed distribution that allowed smooth vehicle travel. In order to gain a
better understanding, the auxiliary lane speed is recorded up to 120m upstream (on-
ramp), while this distance in lane 3 is 500m.
40 Chapter 4: Simulation and evaluation of weaving section
Figure 9: Speed contour plot between base case and control case for auxiliary lane
and lane 3
Chapter 4: Simulation and evaluation of weaving section 41
4.3.1.1 Impact of different OD matrices on the strategy
This section analyses the impact of different OD matrices on the strategy. The
OD test criteria selections are:
Maximum weaving flow of either RF or FR does not exceed 1260 vph;
Maximum number of passenger cars in the weaving section is 2200
vph/lane.
The test was conducted with five different OD as shown in Table 9. The five
different tests result from a combination of one FF (5300 vph), one total weaving
flow (1800 vph), one RR volume (100 vph) and five different RF ratios2. The level of
service (LOS) in each of the scenarios is E, which is analysed based on HCM 2010,
chapter 12 [13]. LOS E indicates that the network is heavily congested. Note that the
HCM 2010 does not distinguish LOS with different RF ratios.
Table 9: Different OD matrices
Test RF
(vph)
FR
(vph)
FF
(vph)
Total weaving
(vph)
RR
(vph)
RF
ratio
1 540 1260
5300 1800 100
0.3
2 720 1080 0.4
3 900 900 0.5
4 1080 720 0.6
5 1260 540 0.7
The bar chart in Figure 10 compares the average delay between the base case
and the control case, while the line graph shows the delay improvements in terms of
percentage with the different ODs.
2 Ramp to freeway (RF) ratio: the ratio between ramp to freeway and the total weaving flow.

42 Chapter 4: Simulation and evaluation of weaving section
Figure 10: Impact of different ODs on the strategy
The base case (blue column) shows that the weaving section has its minimum
average delay when the RF ratio is at 0.5 with 9.4 (s/veh): that is, the two weaving
flows (FR and RF) are equal. The value increases when either weaving flow (RF or
FR) increases. This is because the one-sided ramp-weave requires a single lane
change; a more balanced weaving distribution of the total weaving flow results in a
better gap utilization [44].
On the other hand, the average delay time in the control case (red column)
shows a different pattern. In fact, it reduces linearly as the RF ratio increases. The
average delay in the control case, at RF 0.3, is highest with more than 8 seconds.
This number reduces gradually until the FR ratio is at 0.6 and 0.7.
To explain these results, the actual NL of weaving vehicles in different
segments of the control case are recorded as shown in Table 10.

Chapter 4: Simulation and evaluation of weaving section 43
Table 10: Actual number of lane changes in the weaving section, with different RF ratios
Number of lane changes in weaving section RF
ratio A B C D
281 328 292 899 0.3
233 333 309 925 0.4
197 341 323 940 0.5
175 331 336 959 0.6
155 316 350 979 0.7
The data in Table 10 demonstrate that the lane-change concentration was
spread further downstream of the weaving section when the RF ratio increased. As a
result, the average delay time in the control case dropped as the RF ratio increased
(i.e. highest at RF 0.3 and lowest at RF 0.7).
In addition, the average delay improvements in terms of the percentage of
those OD (test 1 to test 5) are drawn from the difference in delay time between base
case and control case. Figure 10 indicates that the average delay improvement
increases as the RF ratio increases. The number stood at approximately 25% when
the RF ratio was at 0.3 and achieved its peak at the RF ratio 0.7 with around 55%.
4.3.1.2 Impact of different penetration rates on the strategy
This section outlines how the strategy was influenced by different penetration
rates. The rate of 5%, 10%, 20%, 40%, 60% and 80% were conducted.
Figure 11 shows the results with different penetration rates for RF ratios in
terms of actual saving time, which expresses how many seconds that the strategy has
saved.

44 Chapter 4: Simulation and evaluation of weaving section
Figure 11: Actual saving time of scenario 1
Overall, increased penetration received more positive benefits, as expected.
Even with the penetration rates as low as 5% or 10%, the strategy still achieved
benefits. Compared with other studies, these results are quite remarkable. For
example, a study by Park [38] shows that there is no significant improvement if the
rate falls below 70%.
Again, the figures also increase as the RF ratio increases. RF ratio 0.7 always
had the most benefits, except for its penetration rate low (<20%). With the expected
travelled time (free flow speed) of ramp-vehicles and mainstream vehicles being
20.25 seconds and 32.40 seconds respectively, the maximum saved time, of more
than 6 seconds in several cases, particularly in RF ratio 0.7, are noticeable.
In addition, the figures in the 60% penetration rate were seen to be very close
to those in the 100% penetration rate. In other words, if the infrastructures were able
to connect and give instructions to 60% of the total vehicles, the predicted positive
outcomes would be close to the fully connected scenario
RF ratio
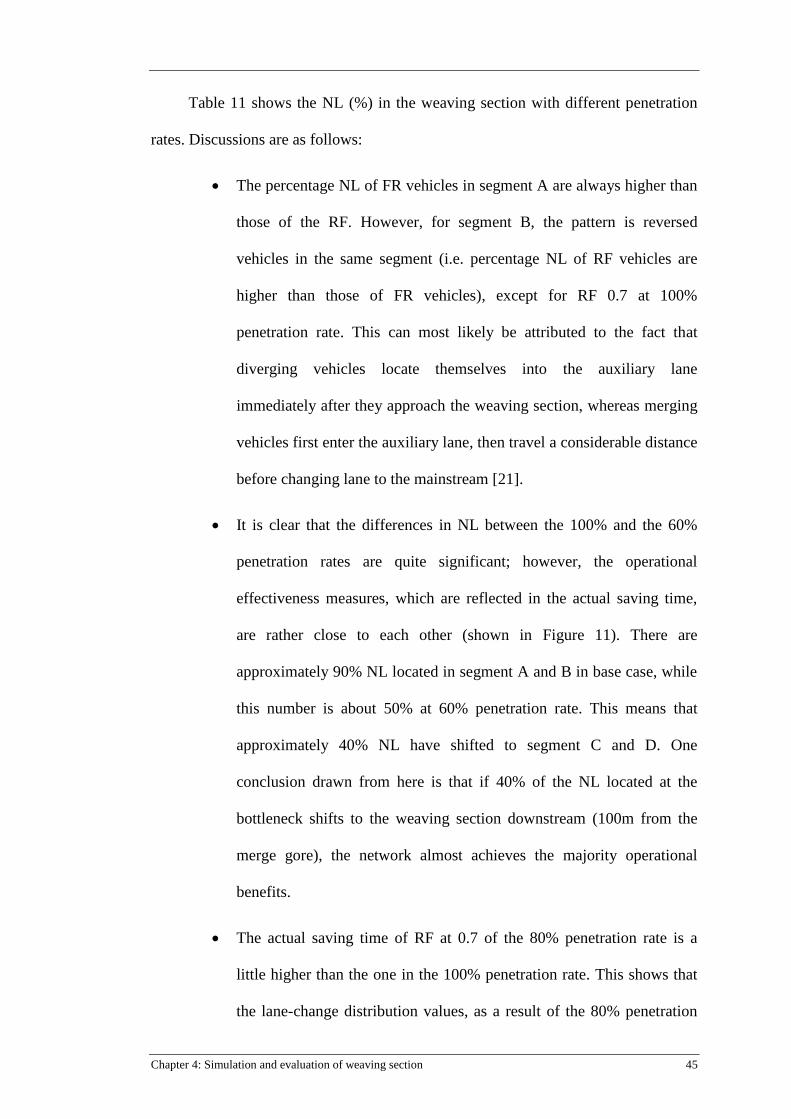
Chapter 4: Simulation and evaluation of weaving section 45
Table 11 shows the NL (%) in the weaving section with different penetration
rates. Discussions are as follows:
The percentage NL of FR vehicles in segment A are always higher than
those of the RF. However, for segment B, the pattern is reversed
vehicles in the same segment (i.e. percentage NL of RF vehicles are
higher than those of FR vehicles), except for RF 0.7 at 100%
penetration rate. This can most likely be attributed to the fact that
diverging vehicles locate themselves into the auxiliary lane
immediately after they approach the weaving section, whereas merging
vehicles first enter the auxiliary lane, then travel a considerable distance
before changing lane to the mainstream [21].
It is clear that the differences in NL between the 100% and the 60%
penetration rates are quite significant; however, the operational
effectiveness measures, which are reflected in the actual saving time,
are rather close to each other (shown in Figure 11). There are
approximately 90% NL located in segment A and B in base case, while
this number is about 50% at 60% penetration rate. This means that
approximately 40% NL have shifted to segment C and D. One
conclusion drawn from here is that if 40% of the NL located at the
bottleneck shifts to the weaving section downstream (100m from the
merge gore), the network almost achieves the majority operational
benefits.
The actual saving time of RF at 0.7 of the 80% penetration rate is a
little higher than the one in the 100% penetration rate. This shows that
the lane-change distribution values, as a result of the 80% penetration

46 Chapter 4: Simulation and evaluation of weaving section
rate at RF 0.7, provide a better outcome compared to that at the 100%
penetration rate (even though the discrepancy is unimportant).
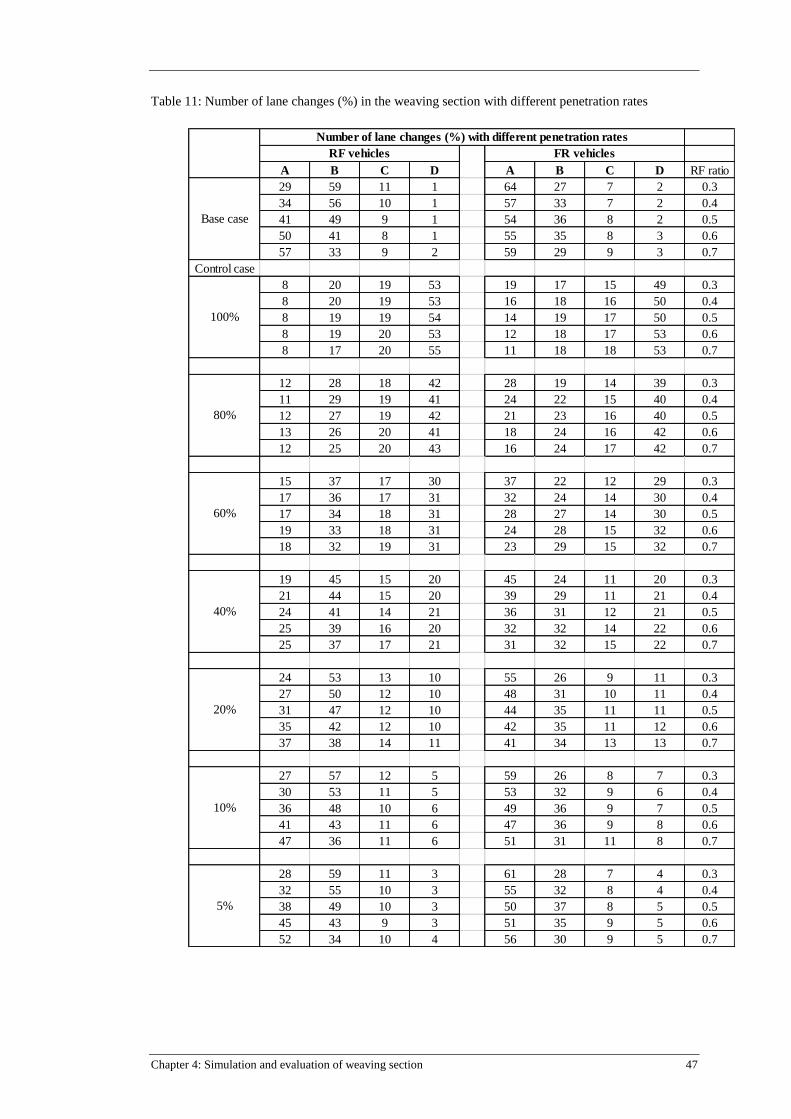
Chapter 4: Simulation and evaluation of weaving section 47
Table 11: Number of lane changes (%) in the weaving section with different penetration rates
A B C D A B C D RF ratio
29 59 11 1 64 27 7 2 0.3
34 56 10 1 57 33 7 2 0.4
41 49 9 1 54 36 8 2 0.5
50 41 8 1 55 35 8 3 0.6
57 33 9 2 59 29 9 3 0.7
Control case
8 20 19 53 19 17 15 49 0.3
8 20 19 53 16 18 16 50 0.4
8 19 19 54 14 19 17 50 0.5
8 19 20 53 12 18 17 53 0.6
8 17 20 55 11 18 18 53 0.7
12 28 18 42 28 19 14 39 0.3
11 29 19 41 24 22 15 40 0.4
12 27 19 42 21 23 16 40 0.5
13 26 20 41 18 24 16 42 0.6
12 25 20 43 16 24 17 42 0.7
15 37 17 30 37 22 12 29 0.3
17 36 17 31 32 24 14 30 0.4
17 34 18 31 28 27 14 30 0.5
19 33 18 31 24 28 15 32 0.6
18 32 19 31 23 29 15 32 0.7
19 45 15 20 45 24 11 20 0.3
21 44 15 20 39 29 11 21 0.4
24 41 14 21 36 31 12 21 0.5
25 39 16 20 32 32 14 22 0.6
25 37 17 21 31 32 15 22 0.7
24 53 13 10 55 26 9 11 0.3
27 50 12 10 48 31 10 11 0.4
31 47 12 10 44 35 11 11 0.5
35 42 12 10 42 35 11 12 0.6
37 38 14 11 41 34 13 13 0.7
27 57 12 5 59 26 8 7 0.3
30 53 11 5 53 32 9 6 0.4
36 48 10 6 49 36 9 7 0.5
41 43 11 6 47 36 9 8 0.6
47 36 11 6 51 31 11 8 0.7
28 59 11 3 61 28 7 4 0.3
32 55 10 3 55 32 8 4 0.4
38 49 10 3 50 37 8 5 0.5
45 43 9 3 51 35 9 5 0.6
52 34 10 4 56 30 9 5 0.7
Number of lane changes (%) with different penetration rates
RF vehicles FR vehicles
Base case
10%
5%
100%
80%
60%
40%
20%

48 Chapter 4: Simulation and evaluation of weaving section
Figure 12 depicts how the speed is scattered over the auxiliary lane, with
different penetration rates. The 100% speed graph line has the flattest figure while
the 60% penetration rate and the base case have a common pattern.
Figure 12: Auxiliary lane speed with different penetration rate (scenario 1)
4.3.2 Evaluation of scenarios 2 and 3
Figure 13 and Figure 14 illustrate the actual saving time of scenarios 2 and
scenario 3 respectively. Overall, the pattern and the values are quite similar to those
observed and discussed in scenario 1.

Chapter 4: Simulation and evaluation of weaving section 49
Figure 13: Actual saving time of scenario 2
Figure 14: Actual saving time of scenario 3
RF ratio
RF ratio
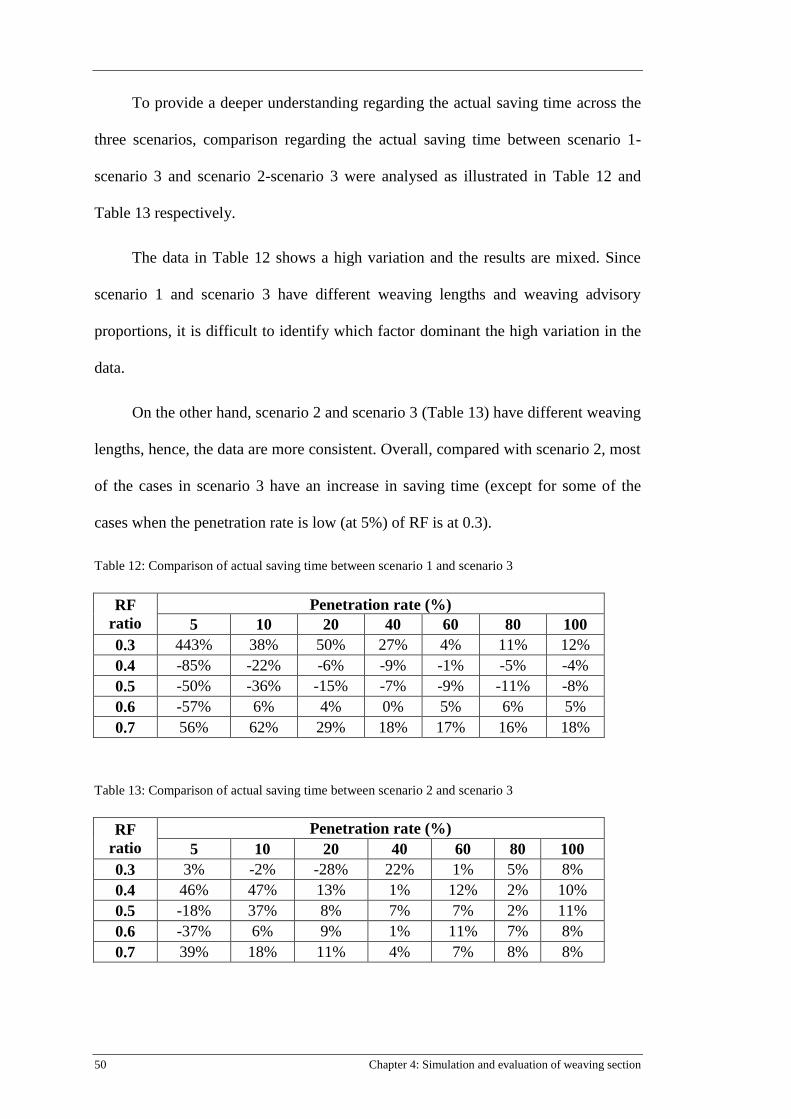
50 Chapter 4: Simulation and evaluation of weaving section
To provide a deeper understanding regarding the actual saving time across the
three scenarios, comparison regarding the actual saving time between scenario 1-
scenario 3 and scenario 2-scenario 3 were analysed as illustrated in Table 12 and
Table 13 respectively.
The data in Table 12 shows a high variation and the results are mixed. Since
scenario 1 and scenario 3 have different weaving lengths and weaving advisory
proportions, it is difficult to identify which factor dominant the high variation in the
data.
On the other hand, scenario 2 and scenario 3 (Table 13) have different weaving
lengths, hence, the data are more consistent. Overall, compared with scenario 2, most
of the cases in scenario 3 have an increase in saving time (except for some of the
cases when the penetration rate is low (at 5%) of RF is at 0.3).
Table 12: Comparison of actual saving time between scenario 1 and scenario 3
RF
ratio
Penetration rate (%)
5 10 20 40 60 80 100
0.3 443% 38% 50% 27% 4% 11% 12%
0.4 -85% -22% -6% -9% -1% -5% -4%
0.5 -50% -36% -15% -7% -9% -11% -8%
0.6 -57% 6% 4% 0% 5% 6% 5%
0.7 56% 62% 29% 18% 17% 16% 18%
Table 13: Comparison of actual saving time between scenario 2 and scenario 3
RF
ratio
Penetration rate (%)
5 10 20 40 60 80 100
0.3 3% -2% -28% 22% 1% 5% 8%
0.4 46% 47% 13% 1% 12% 2% 10%
0.5 -18% 37% 8% 7% 7% 2% 11%
0.6 -37% 6% 9% 1% 11% 7% 8%
0.7 39% 18% 11% 4% 7% 8% 8%
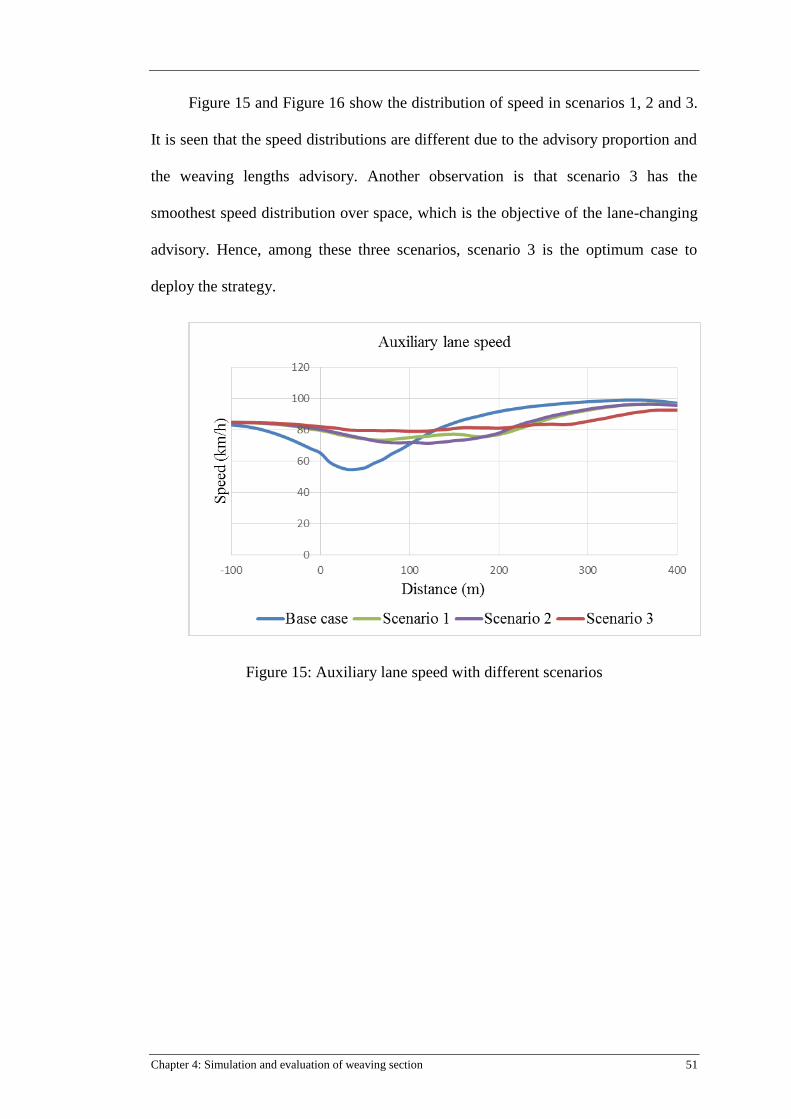
Chapter 4: Simulation and evaluation of weaving section 51
Figure 15 and Figure 16 show the distribution of speed in scenarios 1, 2 and 3.
It is seen that the speed distributions are different due to the advisory proportion and
the weaving lengths advisory. Another observation is that scenario 3 has the
smoothest speed distribution over space, which is the objective of the lane-changing
advisory. Hence, among these three scenarios, scenario 3 is the optimum case to
deploy the strategy.
Figure 15: Auxiliary lane speed with different scenarios

52 Chapter 4: Simulation and evaluation of weaving section
Figure 16: Lane 3 speed with different scenarios
4.3.3 Impact of the strategy on different weaving geometries
This section outlines the results when applying the strategy to different
weaving geometries. While scenarios 1, 2 and 3 possess a 400m weaving section,
this section tests the application with a 600m weaving section.
The effectiveness of this scenario is illustrated in Figure 17. Again, in common
with scenarios 1, 2 and 3, the actual saving time of scenario 4 is quite similar. Given
the fact that the vehicles require longer to complete the 600m weaving section than
to complete the 400m length, the 600m weaving section achieved a less positive
impact compared with the 400m weaving section.

Chapter 4: Simulation and evaluation of weaving section 53
Figure 17: Actual saving time of scenario 4
The speeds of the auxiliary and lane 3 in scenario 4 are shown in Figure 18 and
Figure 19. Again, the control case obtained better speed distribution compared to the
uncontrolled scenario.
Figure 18: Auxiliary lane speed of scenario 4
RF ratio

54 Chapter 4: Simulation and evaluation of weaving section
Figure 19: Lane 3 speed of scenario 4
4.4 Summary
The lane-changing advisory application based on C-ITS has been evaluated in
this chapter. While non-weaving vehicles travel as normal, the mandatory lane
changes of weaving vehicles are managed and cooperated.
The analysis revealed that the strategy has improved the network significantly.
It also found that the lane-changing advisory proportion does not heavily influence
the operation effectiveness between different scenarios; however, it may play an
important role in having the smooth drive across the weaving section. The research
findings are summarised in chapter 5.
Chapter 5: Conclusions 55
Chapter 5: Conclusions
In this study, a lane-changing advisory in weaving sections based on C-ITS was
proposed and evaluated. The research motivations build on two main reasons. Firstly,
empirical findings indicate that drivers tend to merge or diverge quickly when they
enter a weaving section, especially under capacity conditions. This proportion is very
high and can be up to 90%. The behaviour creates a bottleneck around the merge
gore area, limiting weaving capacity, comfort and safety. Secondly, the advancement
in wireless technology, as illustrated in the Cooperative Intelligent Transport
Systems (C-ITS), brings an opportunity to alleviate the problem. Vehicles are able to
exchange information with infrastructures and vice versa. That is, individual vehicles
are monitored and advised through the personalized message based on their
destination lane.
5.1 Research findings
Followings are the findings from the study, which answered the research questions
outlined in Chapter 1.
How can the C-ITS improve the utilization of current infrastructure by the
infrastructure-to-vehicle communication?
o The reality is that a significant proportion of weaving vehicles perform
their lane changes close to the merge gore area. The infrastructures then
communicate, sending advisory messages to the targeted groups of
vehicles. The messages outline the location at which they should start to
change lane in the weaving section. Hence, the concentration spreads out
over the existing auxiliary lane and lane 3. By doing so, the lane-changing

56 Chapter 5: Conclusions
activities are evenly distributed and the weaving section, especially at
downstream, is fully used.
How is the C-ITS application influenced by penetration rates?
o The results evaluation has revealed that the increased penetration rate
achieved more positive benefits, as expected. Even with low penetration
rates (less than 20%), vehicles were still be able to gain benefits. It is also
found that the benefit of the 100% penetration rate is rather similar to that
of the 60% penetration rate. In other words, if the infrastructures were
able to connect and give instructions to 60% of the total vehicles, the
predicted positive outcomes would be close to the fully connected
scenario.
At which traffic demand and condition does C-ITS provide the best measurement
of effectiveness?
o Having the entire test scenarios classified as level of service (LOS) E
suggests that the advisory strategy works well when traffic volume is
close to the capacity. The bottleneck becomes more severe at this
condition. Hence, applying the strategy to spread out the lane-changing
density produces more benefits.
o If the total number of weaving vehicles is constant, varying the RF ratio
will have significant impacts on the outcomes. The evaluation shows that
the network becomes more efficient if the RF ratio increases.
What are the impacts of the proposed strategy on different weaving geometries?
Two weaving lengths (400m and 600m) has been studied and
evaluated. It is found that the actual saving time of these two weaving

Chapter 5: Conclusions 57
lengths is rather similar. Given the fact that the 600m weaving section
takes longer to complete, having similarity in the saving time means
that the 400m weaving section has achieved a more positive outcome
than that of the other.
5.2. Final discussions and recommendation for future works
It is clear that this C-ITS advisory application lies on several assumptions
(Section 4.1.2), and field operational tests would provide the most reliable and
accurate outcome. Nevertheless, this study is one of the first to investigate the
benefits of C-ITS in the lane changing concentration in weaving sections by
coordinating weaving vehicles.
The penetration rate and the compliance rate (first and second assumptions)
are related to each other, such that the two terms are interchangeable, and
this study considers the penetration rate only. The result analysis indicates
that if the infrastructure were able to connect and give instructions to 60%
of the total vehicles, the obtained positive outcomes would be close to the
fully connected scenario (or at the 100% compliance rate).
By using the communication between vehicle and infrastructure (V2I)
(third assumption), vehicles can forward their origin and destination lane to
roadside units. In this way, the O-D in real time can be identified.
In short, when the infrastructure (roadside units) and the number of equipped
vehicles are readily available, this strategy can be implemented in practice.

58 Chapter 5: Conclusions
The author suggests a number of topics that can be considered as future work
to make this research more comprehensive:
Although the benefits at the 60% penetration rate is close to those at the
100% penetration rate, as shown in scenario 1, the aggregated speed reveals
that the 100% case receives the smoothest drive. Further evaluation is
recommended to look at this phenomenon, such as looking at the density for a
better understanding.
The advisories in term of merging/diverging proportion and weaving lengths
were taken manually in this study. It is necessary to optimize the lane-
changing advisory proportion and weaving length using an automatic system
(i.e. implementing an algorithm or a control system).
This study evaluates the effectiveness of the strategy based on the operational
aspects. Because it is purely looking at the traffic efficiency side, traffic
safety was not included within the study. A more comprehensive comparative
analysis is desirable to capture the full picture of the strategy’s influences by
evaluating the effect of this C-ITS application on traffic safety – this can be
evaluated by traffic simulator.
The results and conclusions derived from this study are clearly relative to the
strengths and limitations of the AIMSUN software, and it is also assumed that
AIMSUN correctly models driving behaviour. It should be noted that the
proposed strategy was implemented using the Application Programming
Interface (API) functions provided by AIMSUN. To apply a lane changing in
the right way is important for the credibility of the simulation evaluation.
According to Chapter 3, the proposed strategy only provides advice to certain
Chapter 5: Conclusions 59
vehicles regarding where they should start perform their lane-changing, but
does not force any vehicles to change lane. In the developed API code, all the
lane-changings are still governed by the lane-changing model embedded in
AIMSUN. The developed API code only provides a reference point for C-ITS
enabled vehicles to undertake lane-changing. In order words, the comparison
between the base case and control case are based on the simple advisory
concept. Additionally, the results would be more robust if the validation data
were available. Hence, future studies and additional data are needed to
capture the full impact of this C-ITS advisory application.
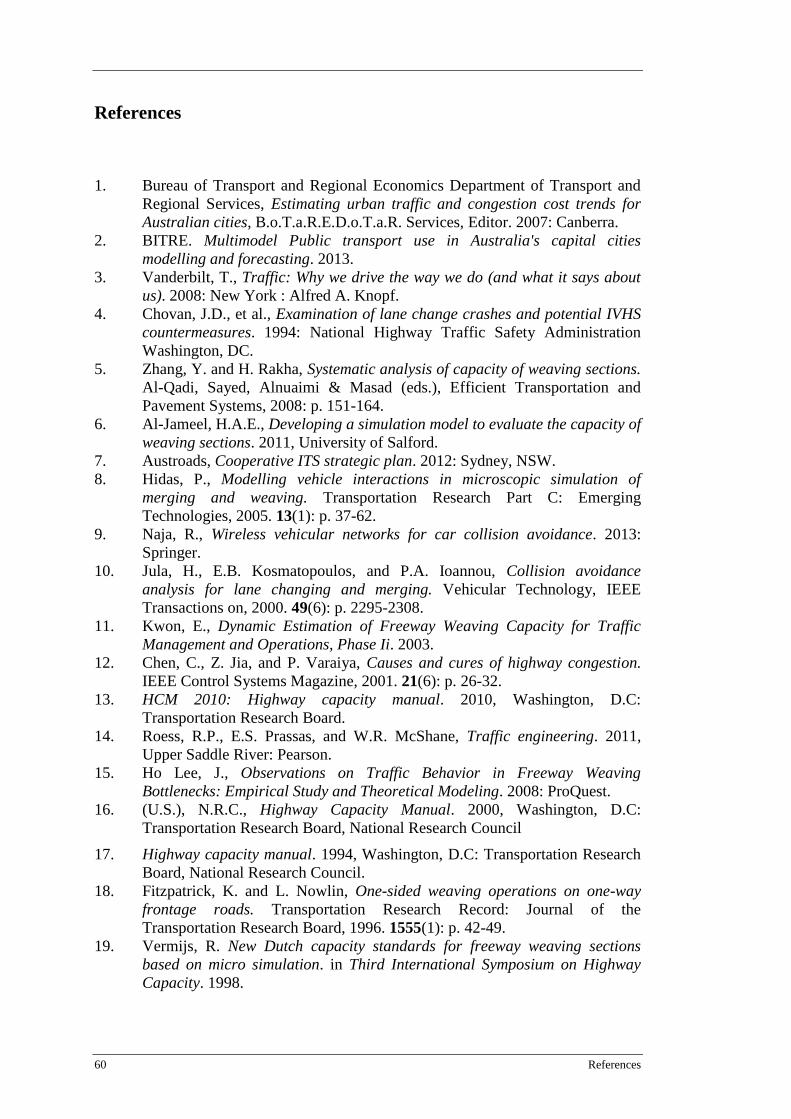
60 References
References
1. Bureau of Transport and Regional Economics Department of Transport and
Regional Services, Estimating urban traffic and congestion cost trends for
Australian cities, B.o.T.a.R.E.D.o.T.a.R. Services, Editor. 2007: Canberra.
2. BITRE. Multimodel Public transport use in Australia's capital cities
modelling and forecasting. 2013.
3. Vanderbilt, T., Traffic: Why we drive the way we do (and what it says about
us). 2008: New York : Alfred A. Knopf.
4. Chovan, J.D., et al., Examination of lane change crashes and potential IVHS
countermeasures. 1994: National Highway Traffic Safety Administration
Washington, DC.
5. Zhang, Y. and H. Rakha, Systematic analysis of capacity of weaving sections.
Al-Qadi, Sayed, Alnuaimi & Masad (eds.), Efficient Transportation and
Pavement Systems, 2008: p. 151-164.
6. Al-Jameel, H.A.E., Developing a simulation model to evaluate the capacity of
weaving sections. 2011, University of Salford.
7. Austroads, Cooperative ITS strategic plan. 2012: Sydney, NSW.
8. Hidas, P., Modelling vehicle interactions in microscopic simulation of
merging and weaving. Transportation Research Part C: Emerging
Technologies, 2005. 13(1): p. 37-62.
9. Naja, R., Wireless vehicular networks for car collision avoidance. 2013:
Springer.
10. Jula, H., E.B. Kosmatopoulos, and P.A. Ioannou, Collision avoidance
analysis for lane changing and merging. Vehicular Technology, IEEE
Transactions on, 2000. 49(6): p. 2295-2308.
11. Kwon, E., Dynamic Estimation of Freeway Weaving Capacity for Traffic
Management and Operations, Phase Ii. 2003.
12. Chen, C., Z. Jia, and P. Varaiya, Causes and cures of highway congestion.
IEEE Control Systems Magazine, 2001. 21(6): p. 26-32.
13. HCM 2010: Highway capacity manual. 2010, Washington, D.C:
Transportation Research Board.
14. Roess, R.P., E.S. Prassas, and W.R. McShane, Traffic engineering. 2011,
Upper Saddle River: Pearson.
15. Ho Lee, J., Observations on Traffic Behavior in Freeway Weaving
Bottlenecks: Empirical Study and Theoretical Modeling. 2008: ProQuest.
16. (U.S.), N.R.C., Highway Capacity Manual. 2000, Washington, D.C:
Transportation Research Board, National Research Council
17. Highway capacity manual. 1994, Washington, D.C: Transportation Research
Board, National Research Council.
18. Fitzpatrick, K. and L. Nowlin, One-sided weaving operations on one-way
frontage roads. Transportation Research Record: Journal of the
Transportation Research Board, 1996. 1555(1): p. 42-49.
19. Vermijs, R. New Dutch capacity standards for freeway weaving sections
based on micro simulation. in Third International Symposium on Highway
Capacity. 1998.
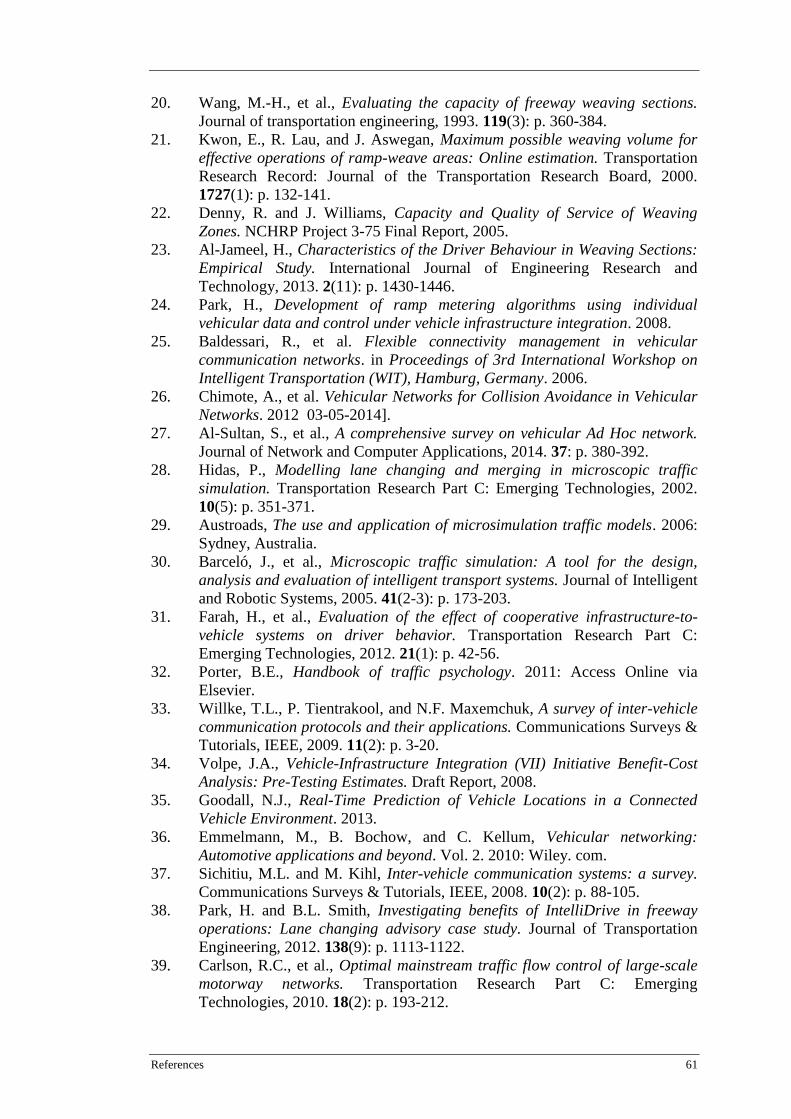
References 61
20. Wang, M.-H., et al., Evaluating the capacity of freeway weaving sections.
Journal of transportation engineering, 1993. 119(3): p. 360-384.
21. Kwon, E., R. Lau, and J. Aswegan, Maximum possible weaving volume for
effective operations of ramp-weave areas: Online estimation. Transportation
Research Record: Journal of the Transportation Research Board, 2000.
1727(1): p. 132-141.
22. Denny, R. and J. Williams, Capacity and Quality of Service of Weaving
Zones. NCHRP Project 3-75 Final Report, 2005.
23. Al-Jameel, H., Characteristics of the Driver Behaviour in Weaving Sections:
Empirical Study. International Journal of Engineering Research and
Technology, 2013. 2(11): p. 1430-1446.
24. Park, H., Development of ramp metering algorithms using individual
vehicular data and control under vehicle infrastructure integration. 2008.
25. Baldessari, R., et al. Flexible connectivity management in vehicular
communication networks. in Proceedings of 3rd International Workshop on
Intelligent Transportation (WIT), Hamburg, Germany. 2006.
26. Chimote, A., et al. Vehicular Networks for Collision Avoidance in Vehicular
Networks. 2012 03-05-2014].
27. Al-Sultan, S., et al., A comprehensive survey on vehicular Ad Hoc network.
Journal of Network and Computer Applications, 2014. 37: p. 380-392.
28. Hidas, P., Modelling lane changing and merging in microscopic traffic
simulation. Transportation Research Part C: Emerging Technologies, 2002.
10(5): p. 351-371.
29. Austroads, The use and application of microsimulation traffic models. 2006:
Sydney, Australia.
30. Barceló, J., et al., Microscopic traffic simulation: A tool for the design,
analysis and evaluation of intelligent transport systems. Journal of Intelligent
and Robotic Systems, 2005. 41(2-3): p. 173-203.
31. Farah, H., et al., Evaluation of the effect of cooperative infrastructure-to-
vehicle systems on driver behavior. Transportation Research Part C:
Emerging Technologies, 2012. 21(1): p. 42-56.
32. Porter, B.E., Handbook of traffic psychology. 2011: Access Online via
Elsevier.
33. Willke, T.L., P. Tientrakool, and N.F. Maxemchuk, A survey of inter-vehicle
communication protocols and their applications. Communications Surveys &
Tutorials, IEEE, 2009. 11(2): p. 3-20.
34. Volpe, J.A., Vehicle-Infrastructure Integration (VII) Initiative Benefit-Cost
Analysis: Pre-Testing Estimates. Draft Report, 2008.
35. Goodall, N.J., Real-Time Prediction of Vehicle Locations in a Connected
Vehicle Environment. 2013.
36. Emmelmann, M., B. Bochow, and C. Kellum, Vehicular networking:
Automotive applications and beyond. Vol. 2. 2010: Wiley. com.
37. Sichitiu, M.L. and M. Kihl, Inter-vehicle communication systems: a survey.
Communications Surveys & Tutorials, IEEE, 2008. 10(2): p. 88-105.
38. Park, H. and B.L. Smith, Investigating benefits of IntelliDrive in freeway
operations: Lane changing advisory case study. Journal of Transportation
Engineering, 2012. 138(9): p. 1113-1122.
39. Carlson, R.C., et al., Optimal mainstream traffic flow control of large-scale
motorway networks. Transportation Research Part C: Emerging
Technologies, 2010. 18(2): p. 193-212.
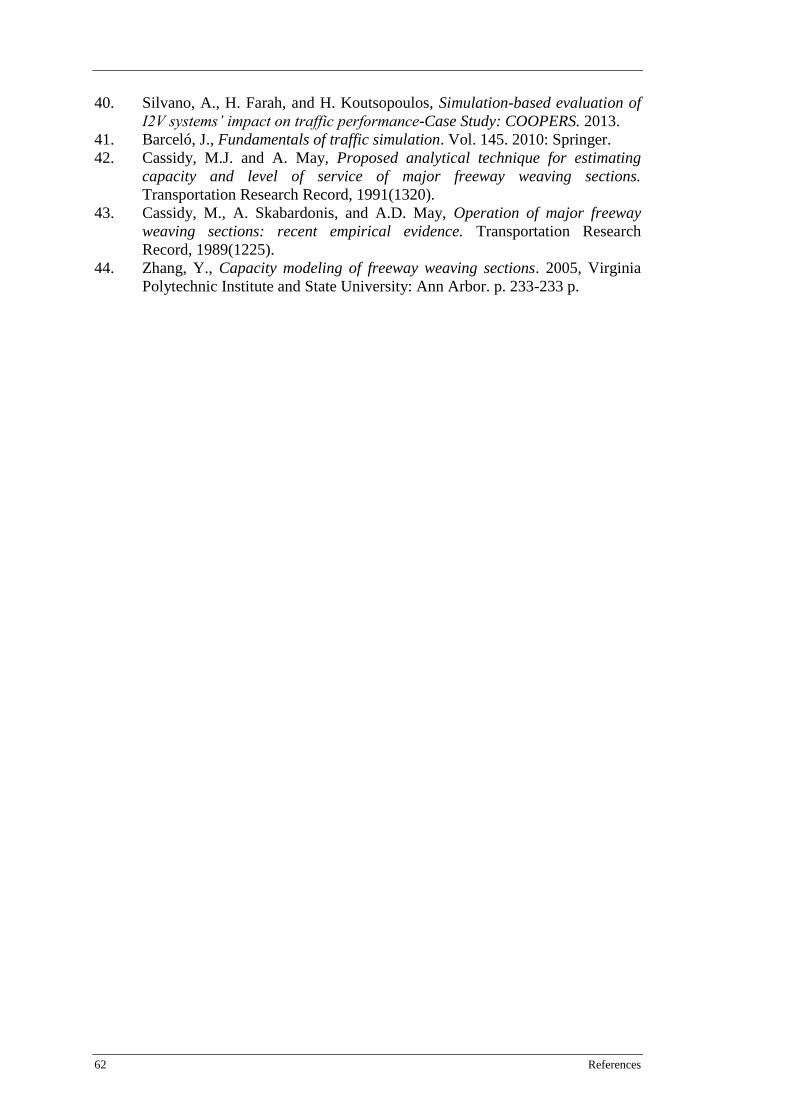
62 References
40. Silvano, A., H. Farah, and H. Koutsopoulos, Simulation-based evaluation of
I2V systems’ impact on traffic performance-Case Study: COOPERS. 2013.
41. Barceló, J., Fundamentals of traffic simulation. Vol. 145. 2010: Springer.
42. Cassidy, M.J. and A. May, Proposed analytical technique for estimating
capacity and level of service of major freeway weaving sections.
Transportation Research Record, 1991(1320).
43. Cassidy, M., A. Skabardonis, and A.D. May, Operation of major freeway
weaving sections: recent empirical evidence. Transportation Research
Record, 1989(1225).
44. Zhang, Y., Capacity modeling of freeway weaving sections. 2005, Virginia
Polytechnic Institute and State University: Ann Arbor. p. 233-233 p.