a case study of resonance in 11kv network in the … · a case study of resonance in 11kv network...
TRANSCRIPT
A Case Study of Resonance in 11kV Network in
the Presence of Series Current Limiting Reactors,
VSDs and Power Factor Improvement Capacitors
Yadavalli Venkata Sridhar Kuwait Oil Company
Email: [email protected]
Abstract—Presence of electrical network elements such as
reactors, power factor capacitors along with harmonics
injecting loads such as Variable Speed drives create an ideal
situation for resonant conditions in an industrial electrical
network. This paper attempts to identify various conditions
that influence the resonance situation in the 11KV network
of hydrocarbon industry and its sensitivity to influencing
factors is assessed. Further, the effect of detuning reactor in
the power factor capacitors on the THD values, harmonic
frequency and other parameters is studied. Based on the
case study, the impact of configuration of electrical network
and variation of capacitance in the electrical network on the
THD and harmonic frequency is established.
Index Terms—harmonics, resonance, capacitors banks
I. INTRODUCTION
Study of resonance in the electrical network is not
routine activity for many electrical design engineers and
plant operating engineers. Mostly the facilities of an oil
field operate either in full throughput capacities or in part
loads. Few of the operating facilities may be under
shutdown that results in variation in power intake
requirement from the utility undertaking.
Application of power factor capacitors and presence of
harmonic injecting electrical loads along with long cables
for power transfer create an ideal situation for electrical
resonance conditions [1]. Electrical Engineers face the
dilemma to proceed with electrical network modifications
& expansions very often when the electrical network
modifications consist of harmonic sources and capacitors.
Although the awareness of harmonics is growing, yet the
issues pertaining to the resonance are seen as complicated
and facility design electrical engineers do not confer
much attention.
A routinely used method to assess resonance frequency
by multiplying the fundamental frequency with the square
root of ratio of the system fault level to the capacitor size
is an indicative method and cannot be considered, as
reliable design tool as the estimation of fault current at
the bus, is not an easy task. Fault current is function of
source impedance, minimum & maximum fault current
available from the utility, motor short circuit contribution,
Manuscript received June 24, 2014; revised December 24, 2014.
configuration of the electrical network etc. Inevitably,
one has to use an established software to assess the
resonance situation in the electrical network.
Electrical engineers planning for capacitor installations
in the electrical network for addition or resizing, have to
pass through the various design activities to have trouble
free operation of capacitor banks. In the present context,
intentionally introduced resonance that happens in the
filtering circuits is not discussed.
A. Resonance
Resonance is a phenomenon of electrical networks
when inductive impedance equals to capacitive
impedance of the electrical network at certain frequencies.
Under the resonant conditions, the electrical network
behaves differently as the impedance of the electrical
network varies in enormous way.
Electrical impedance is function of electrical network
operating conditions. Resonance is function of harmonic
frequencies and harmonic impedances. Under resonant
conditions, the network impedance will change in a
considerable degree and leads to increased currents which
further leads to abnormal situations in the electrical
network. It becomes exceedingly difficult for electrical
engineers to establish the reasons of failure of the
electrical network unless the aspects of resonance are
studied.
Resonance can happen in electrical network either in
the form of parallel resonance, series resonance and
combination of both. In whatever fashion resonance
happens in the electrical networks the ill effects of the
resonance will be present. Resonance can also be partial
resonance or full resonance.
When an electrical network has capacitors for the
purpose of power factor improvement there is a
possibility of occurrence of series and parallel resonance.
Any resonant condition in the electrical network is
detrimental as series resonance will result in high voltage
conditions and parallel resonance will result in high
currents & sometimes high voltages leading to damage of
equipment.
Parallel resonance: Parallel combination of
network capacitance and network inductance equal
in magnitude at a harmonic frequency. In this case,
impedance seen by harmonic current source
International Journal of Electrical Energy, Vol. 2, No. 4, December 2014
©2014 Engineering and Technology Publishing 268doi: 10.12720/ijoee.2.4.268-277

becomes infinite. The energy exchanges that take
place between inductance and capacitance of the
network leads to Parallel resonance. Parallel
resonance results in High harmonic currents and
distortion in the system.
Series resonance: Series combination of network
capacitance and network inductance equal in
magnitude at harmonic frequency. In series
resonance, impedance tends to become zero based
on the network resistance. Series resonance results
in high harmonic currents and high voltages.
Partial resonance: If the natural frequency of the
capacitor bank & power-system reactance
combination is close to a particular harmonic, then
partial resonance will occur.
Full resonance: If the resonant frequency
coincides with one of the harmonic frequency then
it becomes a case of full resonance.
B. Brief Description of the Electrical Network
In the present resonance study, 11KV electrical
network consisting of a source substation (X) and two
distribution substations (Y&Z) loaded to 90% of installed
capacity, is considered. Substation ‘X’ israted for 72MW
at 11KV and feeds to Substation ‘Y’ and Substation ‘Z’.
Substation ‘X’ is fed from Utility undertaking and
consists of four 132KV/11KV transformers and 11KV
switchboard. Substations ‘Y’ and ‘Z’ have 11KV
switchboards and other voltage switchboards and receive
power from Substation ‘X’ and distribute the same to
facility loads. Substation ‘X’ feeds 11KV power to
Substation ‘Z’ through four Series Current Limiting
Reactors. For the electrical scheme details refer to Fig. 1.
Figure 1. Overall electrical network.
C. Type and Nature of the Connected Load
Total maximum demand of Substation ‘Y’ is 55MW.
Non-linear loads to the extent of 36MW operate on
Substation ‘Y’ 11KV bus. Substation ‘Z’ has maximum
demand of 12MW consisting of motors and power factor
improvement capacitors at 11KV level.
For limiting fault current that is at the level of 40KA at
Substation ‘X’ to the level of 25KA at Substation ‘Z’ a
reactor value of 0.3 ohm is considered. The purpose of
this reactor is to limit the short circuit current at
Substation ‘Z’.
The other load composition consists of induction
motors of various sizes connected to 3.3KV and 440 volt
level along with associated transformers. Lighting loads
and small nonlinear loads such as battery chargers, UPS
systems, Computers and Switch Mode Power Supplies
(SMPS) are connected at the 440 volts level.
D. Presence of Harmonics and Harmonic Related
Information
As the nonlinear loads operate at Substation ‘Y’,
harmonic pollution is present in the network. The main
contribution of harmonics is from 11KV Variable Speed
Drives. The Variable Speed Drives are of voltage source
type with high pulse rectifiers.
The capacity of UPS systems & Battery Charger(s) is
much less than 15% of the corresponding transformer
capacity at the 440 volt level. Hence the harmonic
presence at 440 volts is ignored.
E. Capacitor Banks
Physically capacitor banks for power factor
improvement can be installed at Substation X and
Substation ‘Z’ keeping in view the space requirement and
feeder availability. Two numbers capacitor banks
2100KVAr & 1800KVAr are proposed to be installed at
substation ‘Z’.
II. ETAP SYSTEM STUDIES
The ETAP software is used to develop the electrical
network described above and conducted the resonance
related studies. The variations in the configurations of the
electrical network and parameters are considered keeping
in view the operation of the facility is very vital to avoid
production loss. The objective of the resonance study is
to identify the occurrence of resonance under various
network configurations and parameter variation as
indicated hereunder [2]:
Capacitor Variation Under Minimum fault current
and Maximum fault current conditions
Number of Reactors, Numbers of Transformers
and Number of VSD’s variation
Normal operating and Abnormal Operating
configurations
Source X/R variation
Keeping the power factor capacitors constant in the
electrical network, resonant frequency directly varies
with the square root of available short circuit in the
network. Short circuit current is function of network
configuration and load variation. Hence, various
configurations are studied by varying the (i) number of
transformers at source substation X, (ii) reactors between
source substation X and distribution substation Z, (iii)
capacitor banks at substation Z, (iv) number of harmonic
sources at substation Y etc. In the first stage ETAP study
is carried out without considering the detuning reactors in
the capacitor circuits.
International Journal of Electrical Energy, Vol. 2, No. 4, December 2014
©2014 Engineering and Technology Publishing 269
A. Harmonic Load Flow Study
Harmonic Load flow Study is carried out, for assessing Total Harmonic Distortion and quantifying individual
harmonic currents. These calculated values are compared with recommended values indicated in the International
standards to determine the acceptability of Harmonic content.
B. Frequency Scan Study
Frequency Scan study is carried out, for identifying the resonant frequency and harmonic impedance related
information.
III. RESULTS
A. Capacitor Variation under Minimum Source Fault
Current Contribution with 4 Transformers and 4
Reactors
As the capacitance is introduced, in the substation ‘Z’,
two different peaks of parallel resonance and minimum one series resonance trough is noticed.
As the capacitance increases in the network in all the substations, Parallel Resonant impedance decreases from
24.37 ohms to 11.15 ohms and Resonant Frequency reduced from 1100Hz to 450Hz. (Harmonic order from
22 to 9). Same trend applies to Series resonant impedance
and Series resonance frequency. The quantum of capacitance in the electrical network
influences the resonant frequency.
B. Capacitor Variation under Maximum Source Fault
Current Contribution with 4 Transformers and 4
Reactors
The trend indicated above is equally applicable when the source fault level increases from 1851 MVA to 2789
MVA. The expected variation in the source fault level is
due to operational variations at Utility side. However, there is no major difference in the harmonic impedance
due to increase in source fault level.
C. Series Current Limiting Reactor Variation under
Maximum Source Fault Condition with 4
Transformers and All Capacitors Included in the
Network at Substation ‘Z’
With the reduction of series current limiting reactors
from 4 (four) to 3 (three), the harmonic impedance is
expected to increase. However, from 4 Reactors to 3
Reactors variation, the harmonic impedance is reduced
from 21.28 ohms to 18.07 ohms for Substation Z. The
reduction in impedance is attributed to harmonic angles.
Further, reduction of three (3) Reactors to two (2)
Reactors variation the harmonic impedance has increased
from 18.07 ohms to 27.08 ohms. In addition, the
harmonic frequency decreased from 450Hz to 400Hz
(Harmonic order from 9 to 8).
From the above, it is noted that Series Current
Limiting Reactor variation has pronounced impact on the
harmonic impedance.
D. Transformer & Series Current Limiting Reactor
Variation under Source Maximum Fault Condition
with All Capacitors at Substation ‘Z’
Under 4TR and 2R conditions, harmonic impedance is
about 27.8 ohms and harmonic frequency at which
resonance likely to take place is at 400 Hz (Harmonic
order 8).
The possibility of network with two (2) reactors is very
remote as this kind of operation will not deliver the
required power. However, under emergency conditions
this configuration may be used for running few of the
equipment.
E. Number of VSD’s Variation under 4 TR, 4R and Bus
Tie Opening at Substation ‘Z’ 11KV Bus Bar
Number of VSD’s variation (from 8 to 6 VSD’s) does
not have major influence on the harmonic impedance and
resonant frequency.
However opening the bus tie at Substation ‘Z’ 11kV
has increased harmonic impedance to 30.89 ohms and
increased the parallel resonance peaks to 3 (three) at
Substation X and Substation Y.
This kind of operating conditions is not normal and
this configuration affects reliability of power availability
hence not recommended for facility operations.
Resonance frequency at substation Z 11kV bus will be at
harmonic order 8 or 9.
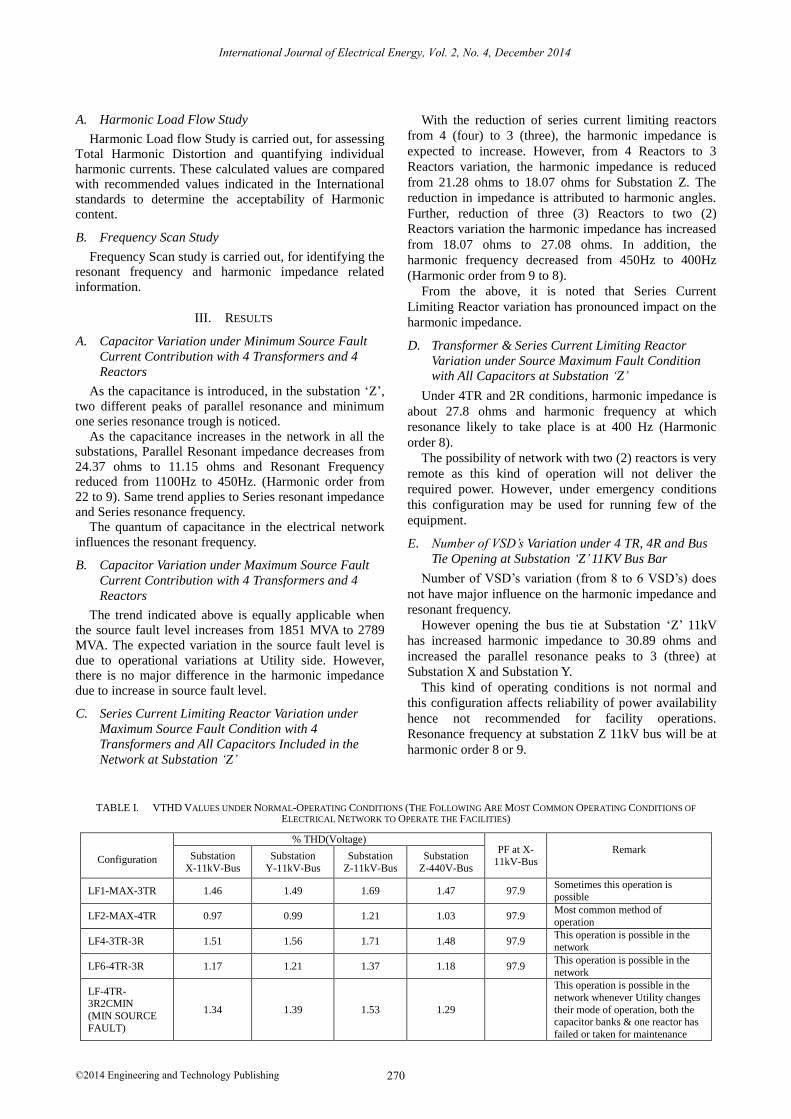
TABLE I. VTHD VALUES UNDER NORMAL-OPERATING CONDITIONS (THE FOLLOWING ARE MOST COMMON OPERATING CONDITIONS OF
ELECTRICAL NETWORK TO OPERATE THE FACILITIES)
Configuration
% THD(Voltage) PF at X-
11kV-Bus Remark
Substation
X-11kV-Bus
Substation
Y-11kV-Bus
Substation
Z-11kV-Bus
Substation
Z-440V-Bus
LF1-MAX-3TR 1.46 1.49 1.69 1.47 97.9 Sometimes this operation is
possible
LF2-MAX-4TR 0.97 0.99 1.21 1.03 97.9 Most common method of
operation
LF4-3TR-3R 1.51 1.56 1.71 1.48 97.9 This operation is possible in the
network
LF6-4TR-3R 1.17 1.21 1.37 1.18 97.9 This operation is possible in the
network
LF-4TR-3R2CMIN
(MIN SOURCE
FAULT)
1.34 1.39 1.53 1.29
This operation is possible in the
network whenever Utility changes
their mode of operation, both the capacitor banks & one reactor has
failed or taken for maintenance
International Journal of Electrical Energy, Vol. 2, No. 4, December 2014
©2014 Engineering and Technology Publishing 270
LF: Harmonic Load Flow. TR: Number of Transformers in operation at Source Substation X.
R: Number of Current Limiting Reactors in operation between
Substation X and Substation Z. C: Capacitors in the electrical network.
PF: Power Factor
F. Voltage THD Values under Normal Operating
Conditions
Any operational mode of electrical network that
delivers power to facilities (for partial and full throughput
capacity) reliably, without endangering life of operators and facility is Normal Operating condition. Under normal
operating conditions, THD values at various substations are in the acceptable range while maintaining the power
factor at source substation X. Refer to Table I for results.
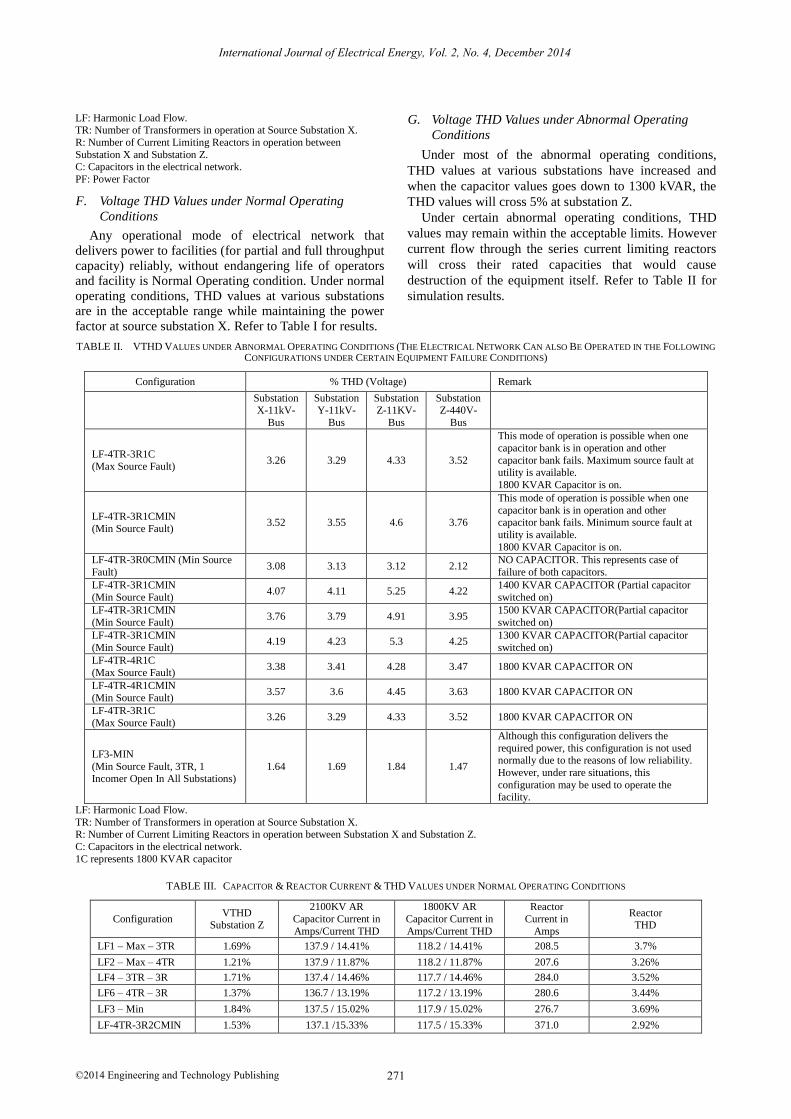
G. Voltage THD Values under Abnormal Operating
Conditions
Under most of the abnormal operating conditions,
THD values at various substations have increased and
when the capacitor values goes down to 1300 kVAR, the
THD values will cross 5% at substation Z.
Under certain abnormal operating conditions, THD
values may remain within the acceptable limits. However
current flow through the series current limiting reactors
will cross their rated capacities that would cause
destruction of the equipment itself. Refer to Table II for
simulation results.
TABLE II. VTHD VALUES UNDER ABNORMAL OPERATING CONDITIONS (THE ELECTRICAL NETWORK CAN ALSO BE OPERATED IN THE FOLLOWING
CONFIGURATIONS UNDER CERTAIN EQUIPMENT FAILURE CONDITIONS)
Configuration % THD (Voltage) Remark
Substation X-11kV-
Bus
Substation Y-11kV-
Bus
Substation Z-11KV-
Bus
Substation Z-440V-
Bus
LF-4TR-3R1C
(Max Source Fault) 3.26 3.29 4.33 3.52
This mode of operation is possible when one
capacitor bank is in operation and other
capacitor bank fails. Maximum source fault at utility is available.
1800 KVAR Capacitor is on.
LF-4TR-3R1CMIN
(Min Source Fault) 3.52 3.55 4.6 3.76
This mode of operation is possible when one
capacitor bank is in operation and other capacitor bank fails. Minimum source fault at
utility is available.
1800 KVAR Capacitor is on.
LF-4TR-3R0CMIN (Min Source
Fault) 3.08 3.13 3.12 2.12
NO CAPACITOR. This represents case of
failure of both capacitors.
LF-4TR-3R1CMIN
(Min Source Fault) 4.07 4.11 5.25 4.22
1400 KVAR CAPACITOR (Partial capacitor
switched on)
LF-4TR-3R1CMIN
(Min Source Fault) 3.76 3.79 4.91 3.95
1500 KVAR CAPACITOR(Partial capacitor
switched on)
LF-4TR-3R1CMIN
(Min Source Fault) 4.19 4.23 5.3 4.25
1300 KVAR CAPACITOR(Partial capacitor
switched on)
LF-4TR-4R1C
(Max Source Fault) 3.38 3.41 4.28 3.47 1800 KVAR CAPACITOR ON
LF-4TR-4R1CMIN
(Min Source Fault) 3.57 3.6 4.45 3.63 1800 KVAR CAPACITOR ON
LF-4TR-3R1C
(Max Source Fault) 3.26 3.29 4.33 3.52 1800 KVAR CAPACITOR ON
LF3-MIN
(Min Source Fault, 3TR, 1 Incomer Open In All Substations)
1.64 1.69 1.84 1.47
Although this configuration delivers the
required power, this configuration is not used normally due to the reasons of low reliability.
However, under rare situations, this
configuration may be used to operate the facility.
LF: Harmonic Load Flow.
TR: Number of Transformers in operation at Source Substation X. R: Number of Current Limiting Reactors in operation between Substation X and Substation Z.
C: Capacitors in the electrical network.
1C represents 1800 KVAR capacitor
TABLE III. CAPACITOR & REACTOR CURRENT & THD VALUES UNDER NORMAL OPERATING CONDITIONS
Configuration VTHD
Substation Z
2100KV AR
Capacitor Current in
Amps/Current THD
1800KV AR
Capacitor Current in
Amps/Current THD
Reactor
Current in
Amps
Reactor THD
LF1 – Max – 3TR 1.69% 137.9 / 14.41% 118.2 / 14.41% 208.5 3.7%
LF2 – Max – 4TR 1.21% 137.9 / 11.87% 118.2 / 11.87% 207.6 3.26%
LF4 – 3TR – 3R 1.71% 137.4 / 14.46% 117.7 / 14.46% 284.0 3.52%
LF6 – 4TR – 3R 1.37% 136.7 / 13.19% 117.2 / 13.19% 280.6 3.44%
LF3 – Min 1.84% 137.5 / 15.02% 117.9 / 15.02% 276.7 3.69%
LF-4TR-3R2CMIN 1.53% 137.1 /15.33% 117.5 / 15.33% 371.0 2.92%
International Journal of Electrical Energy, Vol. 2, No. 4, December 2014
©2014 Engineering and Technology Publishing 271
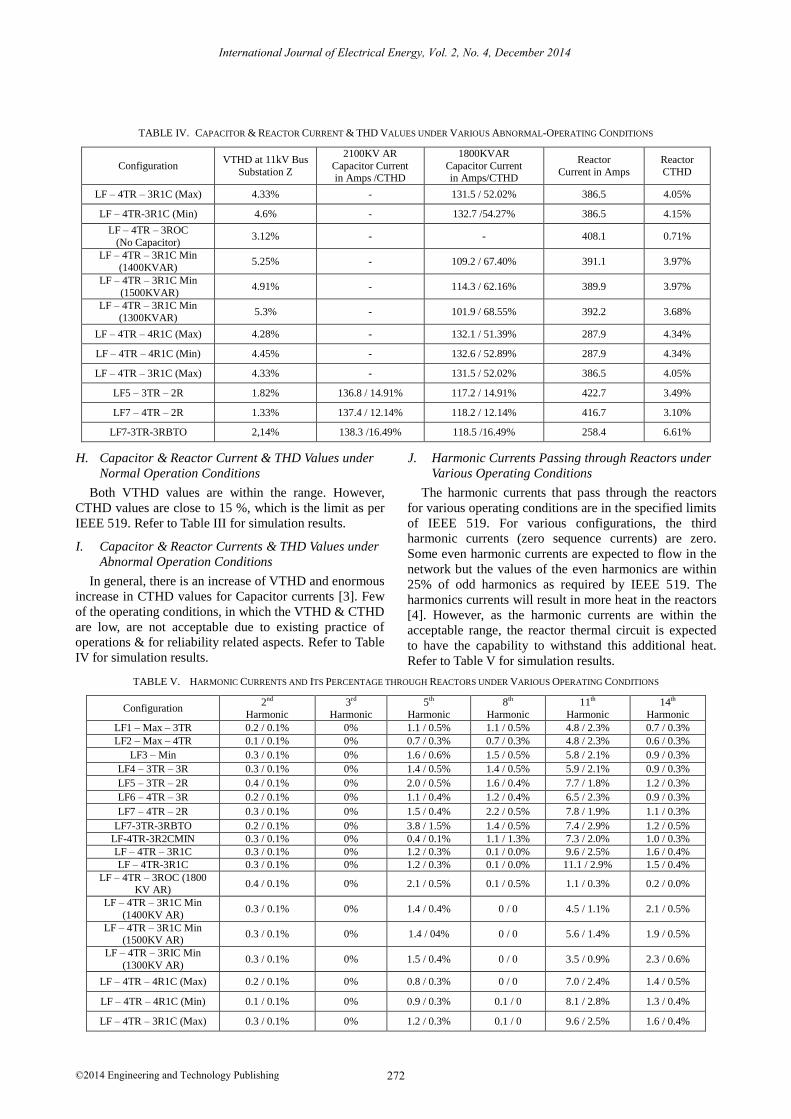
TABLE IV. CAPACITOR & REACTOR CURRENT & THD VALUES UNDER VARIOUS ABNORMAL-OPERATING CONDITIONS
Configuration VTHD at 11kV Bus
Substation Z
2100KV AR
Capacitor Current in Amps /CTHD
1800KVAR
Capacitor Current in Amps/CTHD
Reactor
Current in Amps
Reactor
CTHD
LF – 4TR – 3R1C (Max) 4.33% - 131.5 / 52.02% 386.5 4.05%
LF – 4TR-3R1C (Min) 4.6% - 132.7 /54.27% 386.5 4.15%
LF – 4TR – 3ROC
(No Capacitor) 3.12% - - 408.1 0.71%
LF – 4TR – 3R1C Min
(1400KVAR) 5.25% - 109.2 / 67.40% 391.1 3.97%
LF – 4TR – 3R1C Min
(1500KVAR) 4.91% - 114.3 / 62.16% 389.9 3.97%
LF – 4TR – 3R1C Min
(1300KVAR) 5.3% - 101.9 / 68.55% 392.2 3.68%
LF – 4TR – 4R1C (Max) 4.28% - 132.1 / 51.39% 287.9 4.34%
LF – 4TR – 4R1C (Min) 4.45% - 132.6 / 52.89% 287.9 4.34%
LF – 4TR – 3R1C (Max) 4.33% - 131.5 / 52.02% 386.5 4.05%
LF5 – 3TR – 2R 1.82% 136.8 / 14.91% 117.2 / 14.91% 422.7 3.49%
LF7 – 4TR – 2R 1.33% 137.4 / 12.14% 118.2 / 12.14% 416.7 3.10%
LF7-3TR-3RBTO 2,14% 138.3 /16.49% 118.5 /16.49% 258.4 6.61%
H. Capacitor & Reactor Current & THD Values under
Normal Operation Conditions
Both VTHD values are within the range. However,
CTHD values are close to 15 %, which is the limit as per
IEEE 519. Refer to Table III for simulation results.
I. Capacitor & Reactor Currents & THD Values under
Abnormal Operation Conditions
In general, there is an increase of VTHD and enormous
increase in CTHD values for Capacitor currents [3]. Few
of the operating conditions, in which the VTHD & CTHD
are low, are not acceptable due to existing practice of
operations & for reliability related aspects. Refer to Table
IV for simulation results.
J. Harmonic Currents Passing through Reactors under
Various Operating Conditions
The harmonic currents that pass through the reactors
for various operating conditions are in the specified limits
of IEEE 519. For various configurations, the third
harmonic currents (zero sequence currents) are zero.
Some even harmonic currents are expected to flow in the
network but the values of the even harmonics are within
25% of odd harmonics as required by IEEE 519. The
harmonics currents will result in more heat in the reactors
[4]. However, as the harmonic currents are within the
acceptable range, the reactor thermal circuit is expected
to have the capability to withstand this additional heat.
Refer to Table V for simulation results.
TABLE V. HARMONIC CURRENTS AND ITS PERCENTAGE THROUGH REACTORS UNDER VARIOUS OPERATING CONDITIONS
Configuration 2nd
Harmonic
3rd
Harmonic
5th
Harmonic
8th
Harmonic
11th
Harmonic
14th
Harmonic
LF1 – Max – 3TR 0.2 / 0.1% 0% 1.1 / 0.5% 1.1 / 0.5% 4.8 / 2.3% 0.7 / 0.3%
LF2 – Max – 4TR 0.1 / 0.1% 0% 0.7 / 0.3% 0.7 / 0.3% 4.8 / 2.3% 0.6 / 0.3%
LF3 – Min 0.3 / 0.1% 0% 1.6 / 0.6% 1.5 / 0.5% 5.8 / 2.1% 0.9 / 0.3%
LF4 – 3TR – 3R 0.3 / 0.1% 0% 1.4 / 0.5% 1.4 / 0.5% 5.9 / 2.1% 0.9 / 0.3%
LF5 – 3TR – 2R 0.4 / 0.1% 0% 2.0 / 0.5% 1.6 / 0.4% 7.7 / 1.8% 1.2 / 0.3%
LF6 – 4TR – 3R 0.2 / 0.1% 0% 1.1 / 0.4% 1.2 / 0.4% 6.5 / 2.3% 0.9 / 0.3%
LF7 – 4TR – 2R 0.3 / 0.1% 0% 1.5 / 0.4% 2.2 / 0.5% 7.8 / 1.9% 1.1 / 0.3%
LF7-3TR-3RBTO 0.2 / 0.1% 0% 3.8 / 1.5% 1.4 / 0.5% 7.4 / 2.9% 1.2 / 0.5%
LF-4TR-3R2CMIN 0.3 / 0.1% 0% 0.4 / 0.1% 1.1 / 1.3% 7.3 / 2.0% 1.0 / 0.3%
LF – 4TR – 3R1C 0.3 / 0.1% 0% 1.2 / 0.3% 0.1 / 0.0% 9.6 / 2.5% 1.6 / 0.4%
LF – 4TR-3R1C 0.3 / 0.1% 0% 1.2 / 0.3% 0.1 / 0.0% 11.1 / 2.9% 1.5 / 0.4%
LF – 4TR – 3ROC (1800 KV AR)
0.4 / 0.1% 0% 2.1 / 0.5% 0.1 / 0.5% 1.1 / 0.3% 0.2 / 0.0%
LF – 4TR – 3R1C Min
(1400KV AR) 0.3 / 0.1% 0% 1.4 / 0.4% 0 / 0 4.5 / 1.1% 2.1 / 0.5%
LF – 4TR – 3R1C Min (1500KV AR)
0.3 / 0.1% 0% 1.4 / 04% 0 / 0 5.6 / 1.4% 1.9 / 0.5%
LF – 4TR – 3RIC Min
(1300KV AR) 0.3 / 0.1% 0% 1.5 / 0.4% 0 / 0 3.5 / 0.9% 2.3 / 0.6%
LF – 4TR – 4R1C (Max) 0.2 / 0.1% 0% 0.8 / 0.3% 0 / 0 7.0 / 2.4% 1.4 / 0.5%
LF – 4TR – 4R1C (Min) 0.1 / 0.1% 0% 0.9 / 0.3% 0.1 / 0 8.1 / 2.8% 1.3 / 0.4%
LF – 4TR – 3R1C (Max) 0.3 / 0.1% 0% 1.2 / 0.3% 0.1 / 0 9.6 / 2.5% 1.6 / 0.4%
International Journal of Electrical Energy, Vol. 2, No. 4, December 2014
©2014 Engineering and Technology Publishing 272

K. Harmonic Current Passing through the Capacitor
under Various Operating Conditions
Based on the mode of configuration, the current
through the capacitors vary and corresponding Current
THD varies. When both the capacitor banks are in the
network, then the current values are in acceptable range
and current THD values are in the range of close to 15%.
The acceptable THD value is less than 15% as the Isc/IL
ratio is more than 100 and less than 1000 as per IEEE519
[5].
However when only 1800 KVAR capacitor is in the
circuit, then the current flow and Current THD values
increased to very high ranges. In addition, when the
capacitance value varies to 1400KVAR and 1500KVAR,
the current THD values further increase to 67.40% and
62.10% respectively. Refer to Table VI for results.
TABLE VI. HARMONIC CURRENTS AND ITS PERCENTAGE THROUGH CAPACITORS UNDER VARIOUS OPERATING CONDITIONS
Configuration Parallel Resonance Series Resonance
Frequency Harmonic Order Harmonic Imp in ohms Frequency Harmonic Order Harmonic Imp in ohms
LF1-Max-3TR 400 8 21.06 2150 43 0.43
LF2-Max-4TR 450 9 16.45 2200 44 0.43
LF3-Min 400 8 24.57 2150 43 0.46
LF4-3TR-3R 400 8 22.37 2000 40 0.5
LF- 4TR-3R1C
(Max) 600 12 25.67 1850 37 0.9
LF- 4TR-3R1C (Min) 600 12 24.89 1850 37 0.88
LF- 4TR-3ROC
(Min) 1100 22 23.05 1900 38 1.36
LF- 4TR-3R1C
Min,1400kVAR 650 13 25.99 1850 37 0.98
LF- 4TR-3R1C
Min,1500kVAR 650 13 24.06 1850 37 0.96
Configuration
2100 KVAR 1800KVAR
Total
Current
(CTHD)
Parallel
Resonant
Current
Series Resonant
Current
Total Current
(CTHD)
Parallel
Resonant
Current
Series Resonant
Current
LF1-Max-3TR 137.9
(14.41%) 3.1(2.2%)
0.7
(0.5%)
118.2
(14.4%)
2.6
(2.2%)
0.6
(0.5%)
LF2-Max-4TR 137.9
(11.89%) 0% 0 1182 (11.87%) 0% 0
LF3-Min 137.5
(15.02%)
3.1
(2.3%)
0.8
(0.6%)
117.9
(15.2%)
2.7
(2.3%)
0.7
(0.6%)
LF4-3TR-3R 137.4
(14.46%)
2.9
(2.2%)
2.2
(1.6%) 117.7A
2.5
(2.2%) 0%
LF- 4TR-3R1C
(Max)
-
-
-
131.5
(52.02%)
0
4.8
(4.1%)
LF- 4TR-3R1C
(Min)
-
-
-
132.7
(54.27%)
-
5.0
(4.3%)
LF- 4TR-3ROC
(Min)
-
-
-
-
-
-
LF- 4TR-3R1C
Min,1400kVAR
-
-
-
109.2
(67.40%)
54.6
(60.3)
4.4
(4.8%)
LF- 4TR-3R1C Min,1500kVAR
-
-
-
114.3 (62.16%)
51.7 (53.3)
4.5 (4.7%)
IV. SENSITIVITY ANALYSIS
It is noted that configuration of the network and
variation of the power factor capacitors has big influence
on the harmonic impedance, resonance and VTHD.
Further, the CTHD values for capacitors circuits rapidly
increase to unacceptable levels with the capacitor value
variation [6]. Resonance frequency reduces with the
increase of capacitance in the electrical network.
The 11KV bus (Substation ‘Z’) to which power factor
capacitors are connected is more sensitive and has higher
VTHD values.
The configurations with only 2R (two reactors) in
circuit cannot deliver required power at Substation ‘Z’
and reactor current crosses the rated value.
On comparison, it is noted, that variation of maximum
fault & minimum fault current has little impact on the
various values, although that under maximum source
fault situations the slightly better values of VTHD are
noted. This is consistent with the basic principle that the
higher the short circuit of electrical network, better the
current harmonic absorption and lesser the Current THD
values. With 1800 KVAR capacitor in the circuit:
Variation in source X/R ratio has negligible effect
on VTHD at various buses.
Variation in minimum source fault level has
significant effect on the VTHD at various buses.
(For example decrease in minimum three phase
International Journal of Electrical Energy, Vol. 2, No. 4, December 2014
©2014 Engineering and Technology Publishing 273
Fault level at source from 8.1KA to 4KA resulted
in increase in the VTHD from 4.63% to 5.43% at
Substation ‘Z’ 11KV bus)
It resulted in marginal increase in the Current
THD from 1.82% to 1.98% at one of the buses.
V. INTRODUCTION OF DETUNING REACTORS FOR
CAPACITOR BANK CIRCUITS
In order to avoid passing through of harmonic currents
and to limit inrush current through capacitor banks,
detuned reactors are inserted in the capacitor bank
circuits and ETAP studies are re-conducted [7].
Table VII indicates the effect of variation of detuned
reactor impedance (XL) as a percentage of capacitor
impedance (XC). It can be seen, that as the percentage
impedance of XL increases the current through the
capacitor increases (this is due to the reason that the
overall reactance of XC-XL decreases) and there is no
much variation in the harmonic impedance, parallel and
series resonance frequency, THD values at all the
substations.
TABLE VII. VARIATION OF DETUNED REACTOR VALUES FOR 1800KVAR CAPACITOR
XL of
Reactor
Ohms (%)
VTHD
of X
S/s
11kV Bus
%
VTHD
of Y
S/s
11kV Bus
%
VTHD
of Z
S/s
11kV Bus
%
Current
Through
Capacitor Amp
CTHD of
Through
Capacitor %
Parallel
Resonance
Frequency (HO)
Harmonic Impedance
Ohms
Series
Resonance
Frequency (HO)
Harmonic Impedance
Ohms
Series
Limiting Reactor
Current
Amp
CTHD
through
Reactor %
3.3611 (5%)
3.15 3.21 3.09 124.7 5.21 150 (3)
1150
(23)
1.04
21.66
200 (4)
1900
(38)
0.16
1.36
384 1.05
3.811
(5.67%)
3.14 3.19 3.09 125.7 3.74 150
(3)
1150 (23)
1.07
21.67
200
(4)
1900 (38)
0.74
1.36
384.6 0.97
4.034
(6%)
3.14 3.19 3.10 126.3 3.37 150
(3)
1150 (23)
1.09
21.71
200
(4)
1900 (38)
0.85
1.36
384 0.94
4.71
(7%)
3.13 3.18 3.09 128 2.62 150
(3) 1100
(22)
1.21
21.79
200
(4) 1900
(38)
1.01
1.36
384.2 0.9
9.411
(14%)
3.08 3.13 3.08 141.7 1.04 1100
(22) 3800
(76)
22.54
14.67
1900
(38)
1.36 382 0.8
12.77 (18.9%)
3.06 3.11 3.07 153.4 1.98 100 (2)
1160
(22) 3800
(76)
1.06
22.7
14.66
150 (3)
1900
(38)
0.88
1.36
380.1 0.79
It can be noticed that for detuned reactor parameters
for 6% and 18.9% are almost identical excepting for
increased capacitor current for the later. Increase in the
capacitor current is not acceptable above its rated
capacity as this will destroy the capacitor. Hence,
selection of 6% detuning reactor is prudent. Same logic is
applicable for 2100 KVAR capacitor also.
Table VIII and Table IX indicate the effect of insertion
of 6% detuning reactor for both capacitor banks, on THD
values at various substations, on resonant frequencies,
harmonic impedance for parallel/series resonance and on
capacitor currents under various configurations.
TABLE VIII. CAPACITOR CURRENT, THD VALUES AND RESONANCE FREQUENCIES UNDER VARIOUS CONFIGURATIONS FOR 6% DETUNE REACTORS
FOR 1800KVAR & 2100KVAR CAPACITOR
Configuration % THD at substations 2100KVAR & 1800 KVAR Capacitor
X
%
Y
%
Z
%
Current through
2100 Capacitor Amp
Current
THD of 2100 KVAR Capacitor
%
Current through 1800
Capacitor Amp
Current THD of
Capacitor %
LF1-MAX-3TR 2.75 2.79 2.74 148 3.15 126.8 3.15
LF2-MAX-4TR 2.43 2.47 2.47 148 2.39 127.1 2.39
LF4-3TR-3R 3.06 3.11 2.97 147.4 3.11 126.3 3.11
LF6-4TR-3R 2.86 2.91 2.81 146.9 2.67 125.9 2.68
International Journal of Electrical Energy, Vol. 2, No. 4, December 2014
©2014 Engineering and Technology Publishing 274

Configuration 2100KVAR & 1800 KVAR Capacitor
Parallel Resonance Series Resonance
Resonance Frequency
Harmonic Order
Harmonic Imp
Ohm
Resonance Frequency
Harmonic Order
Harmonic Imp
Ohm
LF1-MAX-3TR
150 1100
3 22
1.68 22.89
200 2300
4 46
0.66 1.05
LF2-MAX-
4TR
150
1200
3
24
1.7
23.07
200
2400
4
48
0.62
1.16
LF4-3TR-3R 150
1150 3
23 1.62
22.48 200
2100 4
42 0.67 1.39
LF6-4TR-3R 150
1200
3
24
1.51
22.69
200
2150
4
43
0.64
1.49
TABLE IX. CAPACITOR CURRENT, THD VALUES AND RESONANCE FREQUENCIES UNDER VARIOUS CONFIGURATIONS FOR 6% DETUNE REACTORS
FOR 1800KVAR CAPACITOR
Configuration
% THD at substations
Current Through Capacitor
Amp
Current THD Through Capacitor
%
X
%
Y
%
Z
%
LF-4TR-3R1C (Max Source Fault) 3.13 3.19 3.10 126.2 3.25
LF-4TR-3R1CMIN (Min Source Fault) 3.25 3.31 3.10 125.8 3.0
LF-4TR-3R0CMIN (Min Source Fault) 3.08 3.13 3.12
LF-4TR-3R1CMIN (Min Source Fault) 1400 KVAR 3.26 3.32 3.11 96.2 8.72
LF-4TR-3R1CMIN (Min Source Fault) 1500 KVAR 3.26 3.32 3.11 103.4 5.21
LF-4TR-3R1CMIN (Min Source Fault) 1300 KVAR 3.26 3.32 3.11 88.7 6.07
LF-4TR-4R1C (Max Source Fault) 3.13 3.19 3.22 126.8 3.34
LF-4TR-4R1CMIN (Min Source Fault) 3.15 3.21 3.47 126.8 3.47
LF-4TR-3R1C (MAX SOURCE FAULT) 3.13 3.19 3.10 126.3 3.25
LF3-MIN
(MIN SOURCE FAULT, 3TR, 1 INC OPEN IN ALL
SWBD)
4.08 4.16 4.01 126.4 3.47
LF5-3TR-2R-1C 3.26 3.32 2.95 125.7 2.95
LF7-4TR-2R-1C 2.86 2.92 2.64 125.2 2.48
LF-3TR-3RBTO-1C 3.05 3.11 2.86 126.8 2.98
LF-4TR-3R2CMIN (MIN SOURCE FAULT) 3.25 3.31 3.10 125.9 3.00
Configuration
Parallel Resonance Series Resonance
Resonance Frequency
Harmonic Order
Harmonic Imp
Ohm
Resonance Frequency
Harmonic Order
Harmonic Imp
Ohm
LF-4TR-3R1C
(Max Source Fault)
150 1150
3850
3 23
77
1.05 21.6
14.57
200 1950
4 39
0.33 1.43
LF-4TR-3R1CMIN (Min Source Fault)
150 1150
3 23
1.4 20.98
200 1900
4 38
0.62 1.36
LF-4TR-3R0CMIN (Min Source Fault)
LF-4TR-3R1CMIN
(Min Source Fault) 1400 KVAR
200
1150
4
23
2.28
20.96
250
1900
5
38
1.09
1.36
LF-4TR-3R1CMIN
(Min Source Fault) 1500 KVAR
150 1150
3 23
1.28 20.97
200 1900
4 38
0.16 1.36
LF-4TR-3R1CMIN (Min Source Fault) 1300 KVAR
150 1150
3 23
1.24 20.96
250 1900
5 38
1.05 1.36
LF-4TR-4R1C
(Max Source Fault)
150
1150
3
23
0.98
23.28
200
2350
4
47
0.8
1.13
LF-4TR-4R1CMIN (Min Source Fault)
150 1150
3 23
1.02 23.69
200 2300
4 46
0.82 1.06
LF-4TR-3R1C
(MAX SOURCE FAULT)
150
1150
3
23
1.05
21.8
200
1950
4
39
0.83
1.43
LF3-MIN (MIN SOURCE FAULT, 3TR, 1 INC
OPEN IN ALL SWBD)
150 1200
3 24
1.96 33.37
200 2250
4 45
0.69 1.37
LF5-3TR-2R-1C 150
1200
3
24
2.14
20.88
200
1850
4
37
0.7
2.12
LF7-4TR-2R-1C 150
1250
3
25
1.8
21.31
200
1900
4
38
0.67
2.31
LF-3TR-3RBTO-1C 150 1150
3 23
2.37 21.39
200 1750
4 35
0.72 2.2
LF-4TR-3R2CMIN
(MIN SOURCE FAULT)
150
1150
3
23
1.4
20.98
200
1900
4
38
0.62
1.36
International Journal of Electrical Energy, Vol. 2, No. 4, December 2014
©2014 Engineering and Technology Publishing 275
On comparison, THD values for configurations
without detuning reactors of Table I to Table VI with the
values of THD of Table VIII and Table IX, with detuning
reactors, the following are noted:
With introduction of detuning reactors, THD
values increase for normal operating
configurations for all substations (in particular for
substations ‘Z’), for other abnormal operating
conditions the THD values have marginally
decreased.
All the THD values are less than 4 % as against
stipulated 5% in IEEE 519.
Only in the LF3–MIN configuration, the THD
values crossed 4%.
In most of the cases, the parallel resonance
frequency is at third Harmonic order.
Introduction of detuning reactors, the THD values
at all the three substations (X, Y and Z) have
become numerically in the close range.
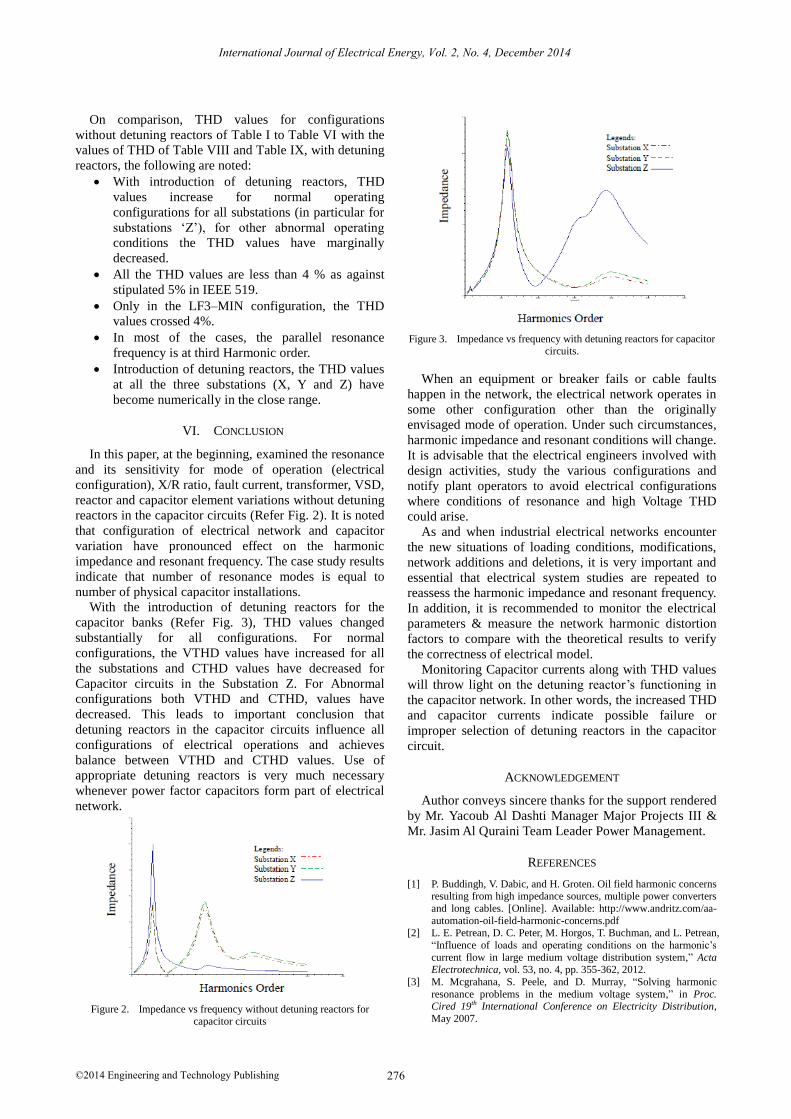
VI. CONCLUSION
In this paper, at the beginning, examined the resonance
and its sensitivity for mode of operation (electrical
configuration), X/R ratio, fault current, transformer, VSD,
reactor and capacitor element variations without detuning
reactors in the capacitor circuits (Refer Fig. 2). It is noted
that configuration of electrical network and capacitor
variation have pronounced effect on the harmonic
impedance and resonant frequency. The case study results
indicate that number of resonance modes is equal to
number of physical capacitor installations.
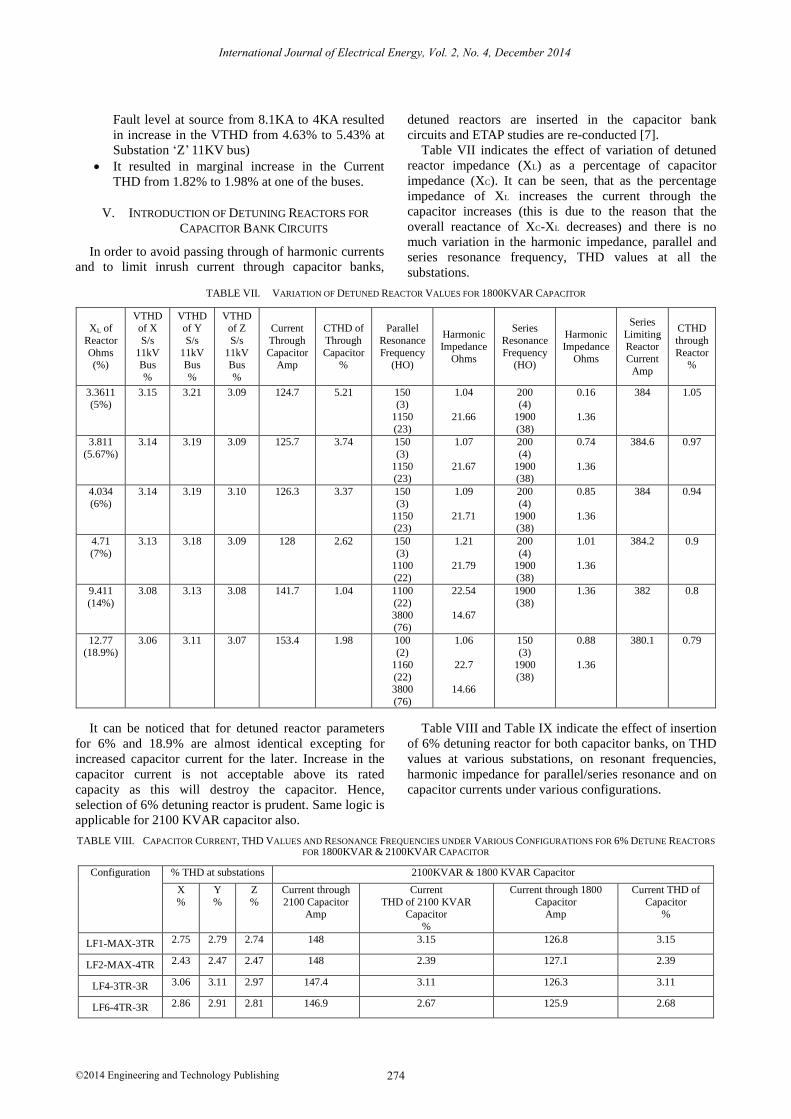
With the introduction of detuning reactors for the
capacitor banks (Refer Fig. 3), THD values changed
substantially for all configurations. For normal
configurations, the VTHD values have increased for all
the substations and CTHD values have decreased for
Capacitor circuits in the Substation Z. For Abnormal
configurations both VTHD and CTHD, values have
decreased. This leads to important conclusion that
detuning reactors in the capacitor circuits influence all
configurations of electrical operations and achieves
balance between VTHD and CTHD values. Use of
appropriate detuning reactors is very much necessary
whenever power factor capacitors form part of electrical
network.
Figure 2. Impedance vs frequency without detuning reactors for capacitor circuits
Figure 3. Impedance vs frequency with detuning reactors for capacitor circuits.
When an equipment or breaker fails or cable faults
happen in the network, the electrical network operates in
some other configuration other than the originally
envisaged mode of operation. Under such circumstances,
harmonic impedance and resonant conditions will change.
It is advisable that the electrical engineers involved with
design activities, study the various configurations and
notify plant operators to avoid electrical configurations
where conditions of resonance and high Voltage THD
could arise.
As and when industrial electrical networks encounter
the new situations of loading conditions, modifications,
network additions and deletions, it is very important and
essential that electrical system studies are repeated to
reassess the harmonic impedance and resonant frequency.
In addition, it is recommended to monitor the electrical
parameters & measure the network harmonic distortion
factors to compare with the theoretical results to verify
the correctness of electrical model.
Monitoring Capacitor currents along with THD values
will throw light on the detuning reactor’s functioning in
the capacitor network. In other words, the increased THD
and capacitor currents indicate possible failure or
improper selection of detuning reactors in the capacitor
circuit.
ACKNOWLEDGEMENT
Author conveys sincere thanks for the support rendered
by Mr. Yacoub Al Dashti Manager Major Projects III &
Mr. Jasim Al Quraini Team Leader Power Management.
REFERENCES
[1] P. Buddingh, V. Dabic, and H. Groten. Oil field harmonic concerns resulting from high impedance sources, multiple power converters
and long cables. [Online]. Available: http://www.andritz.com/aa-
automation-oil-field-harmonic-concerns.pdf [2] L. E. Petrean, D. C. Peter, M. Horgos, T. Buchman, and L. Petrean,
“Influence of loads and operating conditions on the harmonic’s
current flow in large medium voltage distribution system,” Acta Electrotechnica, vol. 53, no. 4, pp. 355-362, 2012.
[3] M. Mcgrahana, S. Peele, and D. Murray, “Solving harmonic
resonance problems in the medium voltage system,” in Proc. Cired 19th International Conference on Electricity Distribution,
International Journal of Electrical Energy, Vol. 2, No. 4, December 2014
©2014 Engineering and Technology Publishing 276
May 2007.

[4] Y. V. Sridhar, H. Safar, and N. Modi, “Techno-Economic study of series current limiting reactor and its impact in the 11kv electrical
network with harmonic pollution,” Journal of Energy
Technologies and Policy, vol. 3, no. 11, pp. 264-273, 2013. [5] IEEE Recommended Practices and Requirements for Harmonic
Control in Electrical Power Systems, IEEE Std. 519-1992.
[6] K. M. Fetyan, “Investigating the effect of using capacitors in the pumping station on the harmonic contents (case study kafr el shikh
governorate, egypt),” World Academy of Science, Engineering, vol.
7, no. 6, pp. 341-346, 2013. [7] Y. V. Sridhar and F. Al Zalzalah, “Techno-Economic evaluation of
power factor improvement scheme for 11kv, 40ka, 72mw main
bulk intake substation,” International Journal of Electrical Energy, vol. 1, no. 1, pp. 37-42, Mar. 2013.
Yadavalli Venkata Sridhar is a specialist Electrical Engineer associated with Hydro
Carbon Industry for the past 37 years. He has
Master’s degree in electrical engineering with Specialization in Electrical Machines and
Industrial Drives.
International Journal of Electrical Energy, Vol. 2, No. 4, December 2014
©2014 Engineering and Technology Publishing 277