optimal capacitor placement in 11kv distribution network
TRANSCRIPT
GSJ: Volume 8, Issue 3, March 2020, Online: ISSN 2320-9186
www.globalscientificjournal.com
Optimal Capacitor Placement in 11kv
Distribution Network for Improved Power Quality
S. I. Osude, D.C. Idoniboyeobu&S. L. Braide
SimonIfeanyiOsude is currently pursuing masters degree program in Power Engineering, Rivers State University, Port Harcourt, Nigeria. Email: [email protected]
D. C.Idoniboyeobu is a Professor of Electrical Engineering at the Department of Electrical Engineering, Rivers State University, Port Harcourt. He is a Professor of Electrical Engineering with specialty in Magnetics, Transmission and Distribution Systems.
S. L. Braide(PhD)is a Senior Lecturer at the department of Electrical Engineering, Rivers State University, Port Harcourt.
ABSTRACT:Power Loss and poor voltage profile are the consequences of a distribution system operating at low lagging power factor. The inductive nature of most distribution system and loads are the factors that contribute to low lagging power factor of a power system, which can be improved by injecting leading reactive power through capacitor bank to the power system, to partly or completely neutralize the lagging reactive power. However, to get effective results, capacitor has to be optimally placed in the power system. This research presents an effective way to improve the power quality of a network using Electrical Transient Analyzer Program, with Rivers State University 11kv distribution network as a case study. Three Stages procedures were used. First stage, the distribution network was modelled on Electrical Transient Analyzer Program and a load flow studies was carried out using Newton Raphson Load Flow method on Electrical Transient Analyzer Program, to identify the voltage violated buses of the network. In the second stage, Optimal Capacitor Placement module on Electrical Transient Analyzer Program was used to determine the optimal locations and sizes of the capacitors. The third stage, the compensated distribution network was remodeled and another load flow studies was carried out to revalidate the results. The power factor, the voltage profile and the power losses before and after placement of capacitors was compared for revalidation. It was observed that the power factor improved by 18%, the voltage profile improved by 1.4% and the active power losses reduced by 33.1%.
KEYWORDS:Distribution System, Optimal Capacitor Placement, Power Loss, Power Factor, Voltage Profile, Reactive Power, Electrical Transient Analyzer Program (ETAP).
GSJ: Volume 8, Issue 3, March 2020 ISSN 2320-9186 750
GSJ© 2020 www.globalscientificjournal.com
1. INTRODUCTION
Electric power quality is an important part of the power systems, generally meant to express the quality of voltage. Power quality improvement is the measure, analysis, and improvement of the bus voltage to maintain a sinusoidal waveform at rated voltage and frequency [1]. A distribution network with a good Power quality basically means the voltage of the network is within the generally acceptable limit (either its voltage drop is within IEC standard), since an adequate level of voltage at the receiving end terminals is essential for satisfactory operation of consumer’s appliances [2]. However, most loads in a power system, are inductive in nature and hence have low lagging power factor. An inductive load with low power factor takes excessive reactive power from the network which leads to an increase in current flowing along the distribution system, as the current increases, 𝐼𝐼2𝑅𝑅 losses along the distribution line also increases which results to a poor voltage profile at the network buses. Therefor the question of improving power factor and voltage profile to reduce line losses are paramount issues that immediately come into pictures on improvement of a power network [3]. Low power factor is distinctly undesirable because it causes poor voltage profile, increase in current, resulting in additional losses of active power in all the element of the power system from the injection station down to the utilization devices. In order to ensure most favourable conditions for a supply from engineering and economic standpoint, it is vital to have optimized power factor as close to unity as possible for a good electricity delivery [4]. Rivers State University 11kv distribution network used as a case study in this research, is a radial distribution network with 24 - 11kv buses classified as a load bus and a 33kv bus classified as a swing bus. In radial distribution network, the further away the power flow from the substation, the more voltage deceases which also leads to a poor voltage profile in addition to the voltage profile violation caused by excessive flow of reactive power in the network as a result of the low power factor of the inductive loads [5].
1.2 Problem Statement
A distribution network should deliver quality power to the end user at good voltage profile and with power losses as low as reasonably practicable. But most distribution system operate at lagging power factor because of inductive loads, lines and transformers. Power system that are inductive needs more reactive power flow from the grid. Over reactive power demand leads to increase in current (𝐼𝐼)which result in increased power losses(𝐼𝐼2𝑅𝑅), reduction in system capacity and voltage drop. For every 1% reduction in voltage, wattage would reduce by 1.6% in filament lamp, 2% in resistive loads and 1.4 % in fluorescent. If voltage is reduced, Induction motors takes more current, leading in overheating and reduced motor life. Motor winding insulation may be weakened because of overheating, which may result to short circuit and motor burning in the long run. Due to increase in current, the line losses tend to be high which would reduce the line voltage more [6]. An improved power quality could be achieved by injecting leading reactive power through Capacitor Bank to partly or completely neutralise the lagging reactive power. Capacitor are widely used but to get effective result, it has to be optimally placed in the distribution network [7].
1.3 Research Aim The aim of this research is to improve power quality of 11kv distribution network at a minimised cost using a case study of Rivers State University 11kv distribution network.
GSJ: Volume 8, Issue 3, March 2020 ISSN 2320-9186 751
GSJ© 2020 www.globalscientificjournal.com
1.4 Research Objectives
The objectives of this research are to:
i. Model the 11kv distribution network ii. Carry out a load flow analysis using numerical method to obtain the operating conditions of the power network parameters and ascertain the extent of voltage violation. iii. Optimally place capacitor bank to improve power factor, voltage profile and minimized power losses. iv. Revalidate the improved distribution network.
1.5 Scope of Work
This research focuses on the analysis and improvement of 11kv distribution system for improved power quality using Rivers State University Network as a case study.
1.6 Significance of the Study
The importance of this study is to establish a dependable data on the poor quality of Rivers State University 11kv distribution network.
2. MATERIALS AND METHODS 2.1 Materials Used for Solving the Load Flow Problems and OCP
Materials required in this research to analyse the Load Flow are; personal computer, Electrical Transient Analyser program, Bus Input Data, Line Input Data. ETAP software is used for Load Flow analyses and Optimal Capacitor Placement (OCP).
2.2 Load Flow Analysis Method
One of the most common effective computational procedures used in power system analysis is the Load Flow calculation. Load Flow studies determine the voltage (V), phase angle of voltages(𝛿𝛿), current (𝐼𝐼), active power(𝑃𝑃), reactive power (𝑄𝑄) and line loses (𝐿𝐿𝑃𝑃𝐿𝐿) in a power system [8]. In this research, the load Flow analysis was carried out with Newton-Raphson method on ETAP Software.
2.3 Optimal Capacitor Placement Method
Many researchers had carried out work on optimal capacitor placement including Fuzzy theory, Neural Network, Partial Swarm Optimization and. This dissertation work is Genetic Algorithm based optimal capacitor placement and sizing.ETAP software 12.6 is used to evaluate the capacitor size and location in the power system network. OCP module on ETAP was used to calculate the sizes and location of the capacitors because of its extreme flexibility. The advanced graphic interface of OCP Module on ETAP provides the flexibility to control the capacitor placement process and allows the result to be view instantly. A voltage constraint of limit 95% ≤ 𝑉𝑉 ≤ 105% and power factor constraint of limit90% ≤ 𝑃𝑃𝑃𝑃 ≤ 100% was programmed on OCP module, with the violated voltage profile buses as the candidate bus for improvement.
2.4Computation of Data Required for Modelling of the Network
In order to carry out load flow analysis on any giving network with software program, it’s required to model the network. This is achieved by measuring the load on each phase of the transformer station and the rout length of each bus, for effective computation of percentage loading and line parameters of the transformer stations.
2.4.1 Calculation of Transformer Loading (%)
(a) TS1-Chem/Pet Lab. Transformer Station (Rated 500KVA)
GSJ: Volume 8, Issue 3, March 2020 ISSN 2320-9186 752
GSJ© 2020 www.globalscientificjournal.com
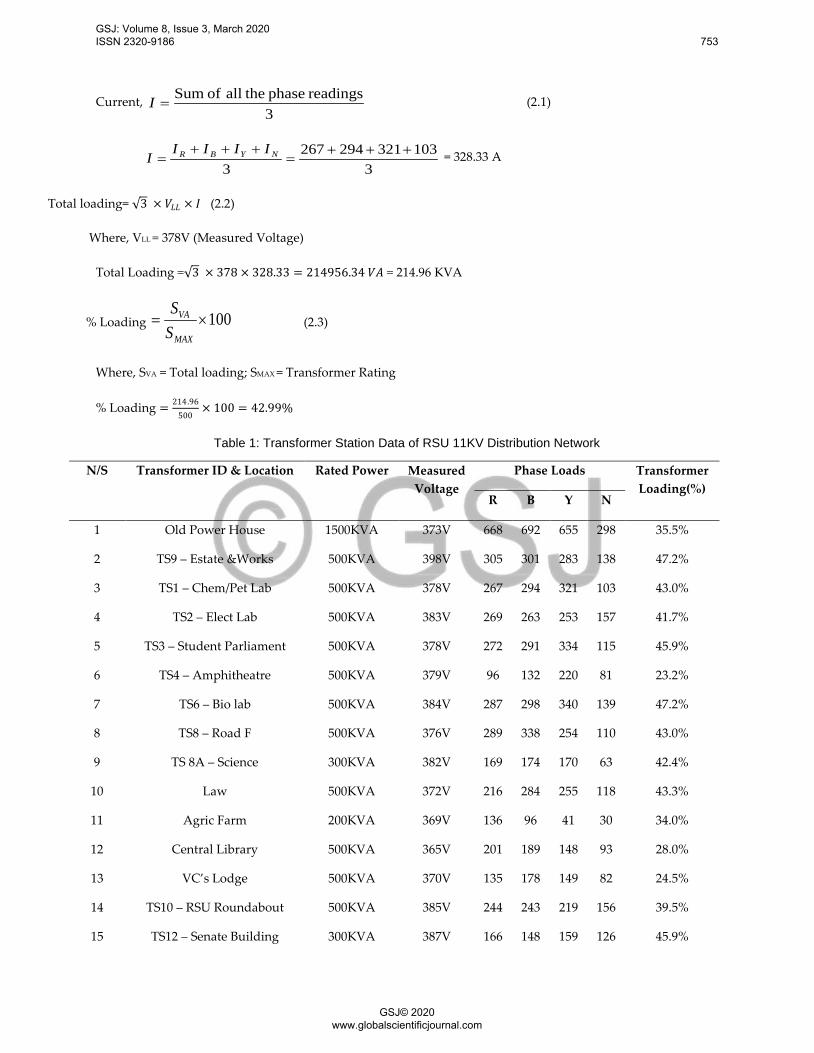
Current, 3
readings phase theall of Sum=I (2.1)
3
1033212942673
+++=
+++= NYBR IIII
I = 328.33 A
Total loading= √3 × 𝑉𝑉𝐿𝐿𝐿𝐿 × 𝐼𝐼 (2.2)
Where, VLL = 378V (Measured Voltage)
Total Loading =√3 × 378 × 328.33 = 214956.34 𝑉𝑉𝑉𝑉 = 214.96 KVA
% Loading 100×=MAX
VA
SS
(2.3)
Where, SVA = Total loading; SMAX = Transformer Rating
% Loading = 214.96500
× 100 = 42.99%
Table 1: Transformer Station Data of RSU 11KV Distribution Network
N/S Transformer ID & Location Rated Power Measured Voltage
Phase Loads Transformer Loading(%)
R B Y N
1 Old Power House 1500KVA 373V 668 692 655 298 35.5%
2 TS9 – Estate &Works 500KVA 398V 305 301 283 138 47.2%
3 TS1 – Chem/Pet Lab 500KVA 378V 267 294 321 103 43.0%
4 TS2 – Elect Lab 500KVA 383V 269 263 253 157 41.7%
5 TS3 – Student Parliament 500KVA 378V 272 291 334 115 45.9%
6 TS4 – Amphitheatre 500KVA 379V 96 132 220 81 23.2%
7 TS6 – Bio lab 500KVA 384V 287 298 340 139 47.2%
8 TS8 – Road F 500KVA 376V 289 338 254 110 43.0%
9 TS 8A – Science 300KVA 382V 169 174 170 63 42.4%
10 Law 500KVA 372V 216 284 255 118 43.3%
11 Agric Farm 200KVA 369V 136 96 41 30 34.0%
12 Central Library 500KVA 365V 201 189 148 93 28.0%
13 VC’s Lodge 500KVA 370V 135 178 149 82 24.5%
14 TS10 – RSU Roundabout 500KVA 385V 244 243 219 156 39.5%
15 TS12 – Senate Building 300KVA 387V 166 148 159 126 45.9%
GSJ: Volume 8, Issue 3, March 2020 ISSN 2320-9186 753
GSJ© 2020 www.globalscientificjournal.com
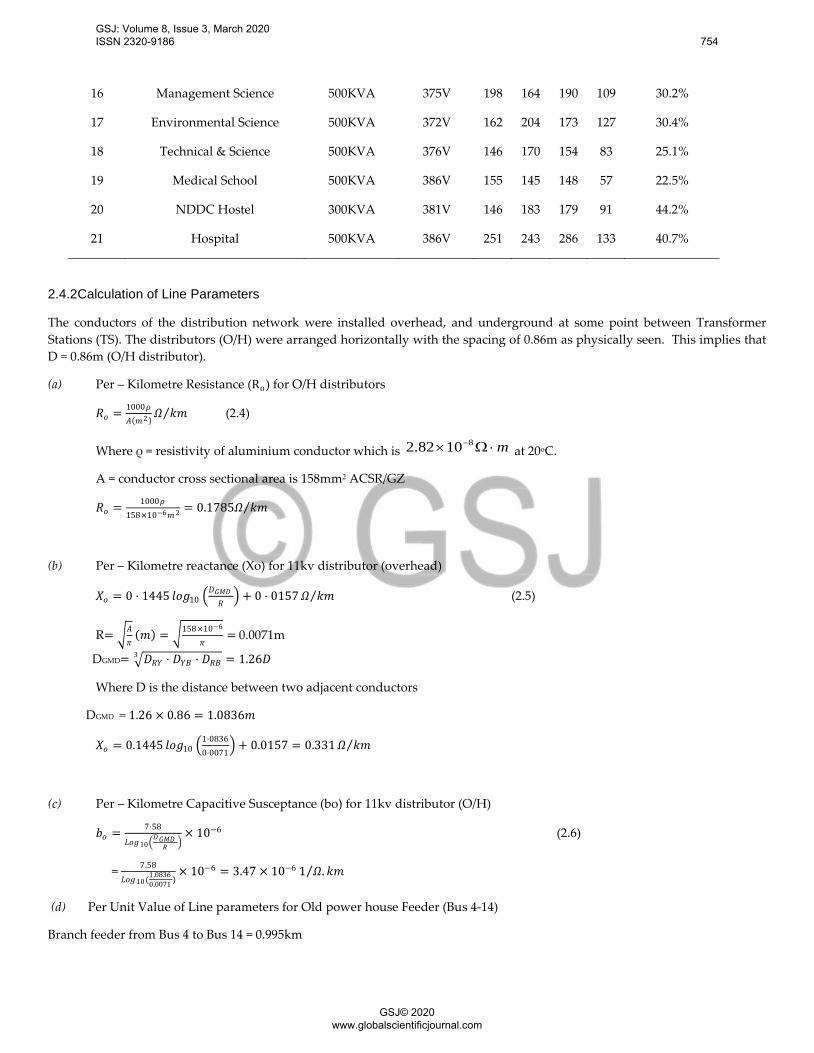
16 Management Science 500KVA 375V 198 164 190 109 30.2%
17 Environmental Science 500KVA 372V 162 204 173 127 30.4%
18 Technical & Science 500KVA 376V 146 170 154 83 25.1%
19 Medical School 500KVA 386V 155 145 148 57 22.5%
20 NDDC Hostel 300KVA 381V 146 183 179 91 44.2%
21 Hospital 500KVA 386V 251 243 286 133 40.7%
2.4.2Calculation of Line Parameters
The conductors of the distribution network were installed overhead, and underground at some point between Transformer Stations (TS). The distributors (O/H) were arranged horizontally with the spacing of 0.86m as physically seen. This implies that D = 0.86m (O/H distributor).
(a) Per – Kilometre Resistance (Ro) for O/H distributors
𝑅𝑅𝑜𝑜 = 1000𝜌𝜌𝑉𝑉(𝑚𝑚2)
𝛺𝛺 𝑘𝑘𝑚𝑚⁄ (2.4)
Where ρ = resistivity of aluminium conductor which is m⋅Ω× −81082.2 at 20oC.
A = conductor cross sectional area is 158mm2 ACSR/GZ
𝑅𝑅𝑜𝑜 = 1000𝜌𝜌158×10−6𝑚𝑚2 = 0.1785𝛺𝛺 𝑘𝑘𝑚𝑚⁄
(b) Per – Kilometre reactance (Xo) for 11kv distributor (overhead)
𝑋𝑋𝑜𝑜 = 0 ⋅ 1445 𝑙𝑙𝑜𝑜𝑙𝑙10 𝐷𝐷𝐺𝐺𝐺𝐺𝐷𝐷𝑅𝑅 + 0 ⋅ 0157𝛺𝛺 𝑘𝑘𝑚𝑚⁄ (2.5)
R= 𝑉𝑉𝜋𝜋
(𝑚𝑚) = 158×10−6
𝜋𝜋= 0.0071m
DGMD= 𝐷𝐷𝑅𝑅𝑅𝑅 ⋅ 𝐷𝐷𝑅𝑅𝑌𝑌 ⋅ 𝐷𝐷𝑅𝑅𝑌𝑌3 = 1.26𝐷𝐷
Where D is the distance between two adjacent conductors
DGMD = 1.26 × 0.86 = 1.0836𝑚𝑚
𝑋𝑋𝑜𝑜 = 0.1445 𝑙𝑙𝑜𝑜𝑙𝑙10 1⋅08360⋅0071
+ 0.0157 = 0.331𝛺𝛺 𝑘𝑘𝑚𝑚⁄
(c) Per – Kilometre Capacitive Susceptance (bo) for 11kv distributor (O/H)
𝑏𝑏𝑜𝑜 = 7⋅58
𝐿𝐿𝑜𝑜𝑙𝑙10𝐷𝐷𝐺𝐺𝐺𝐺𝐷𝐷
𝑅𝑅 × 10−6 (2.6)
= 7.58
𝐿𝐿𝑜𝑜𝑙𝑙10 (1.08360.0071 )
× 10−6 = 3.47 × 10⁻⁶ 1 𝛺𝛺. 𝑘𝑘𝑚𝑚⁄
(d) Per Unit Value of Line parameters for Old power house Feeder (Bus 4-14)
Branch feeder from Bus 4 to Bus 14 = 0.995km
GSJ: Volume 8, Issue 3, March 2020 ISSN 2320-9186 754
GSJ© 2020 www.globalscientificjournal.com
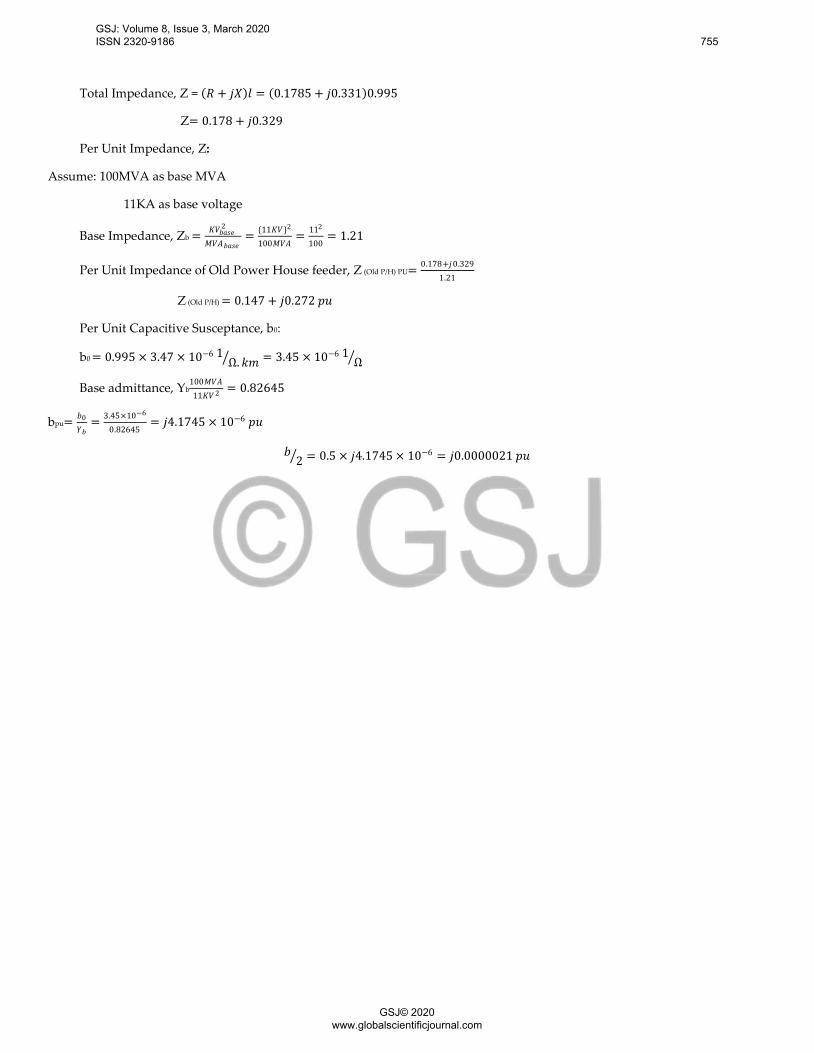
Total Impedance, Z = (𝑅𝑅 + 𝑗𝑗𝑋𝑋)𝑙𝑙 = (0.1785 + 𝑗𝑗0.331)0.995
Z= 0.178 + 𝑗𝑗0.329
Per Unit Impedance, Z:
Assume: 100MVA as base MVA
11KA as base voltage
Base Impedance, Zb = 𝐾𝐾𝑉𝑉𝑏𝑏𝑏𝑏𝑏𝑏𝑏𝑏2
𝐺𝐺𝑉𝑉𝑉𝑉𝑏𝑏𝑏𝑏𝑏𝑏𝑏𝑏= 11𝐾𝐾𝑉𝑉2
100𝐺𝐺𝑉𝑉𝑉𝑉= 112
100= 1.21
Per Unit Impedance of Old Power House feeder, Z (Old P/H) PU= 0.178+𝑗𝑗0.3291.21
Z (Old P/H) = 0.147 + 𝑗𝑗0.272 𝑝𝑝𝑝𝑝
Per Unit Capacitive Susceptance, b0:
b0 = 0.995 × 3.47 × 10−6 1Ω.𝑘𝑘𝑚𝑚 = 3.45 × 10⁻⁶ 1
Ω
Base admittance, Yb100𝐺𝐺𝑉𝑉𝑉𝑉11𝐾𝐾𝑉𝑉2 = 0.82645
bpu= 𝑏𝑏0𝑅𝑅𝑏𝑏
= 3.45×10⁻⁶
0.82645= 𝑗𝑗4.1745 × 10⁻⁶ 𝑝𝑝𝑝𝑝
𝑏𝑏2 = 0.5 × 𝑗𝑗4.1745 × 10−6 = 𝑗𝑗0.0000021 𝑝𝑝𝑝𝑝
GSJ: Volume 8, Issue 3, March 2020 ISSN 2320-9186 755
GSJ© 2020 www.globalscientificjournal.com
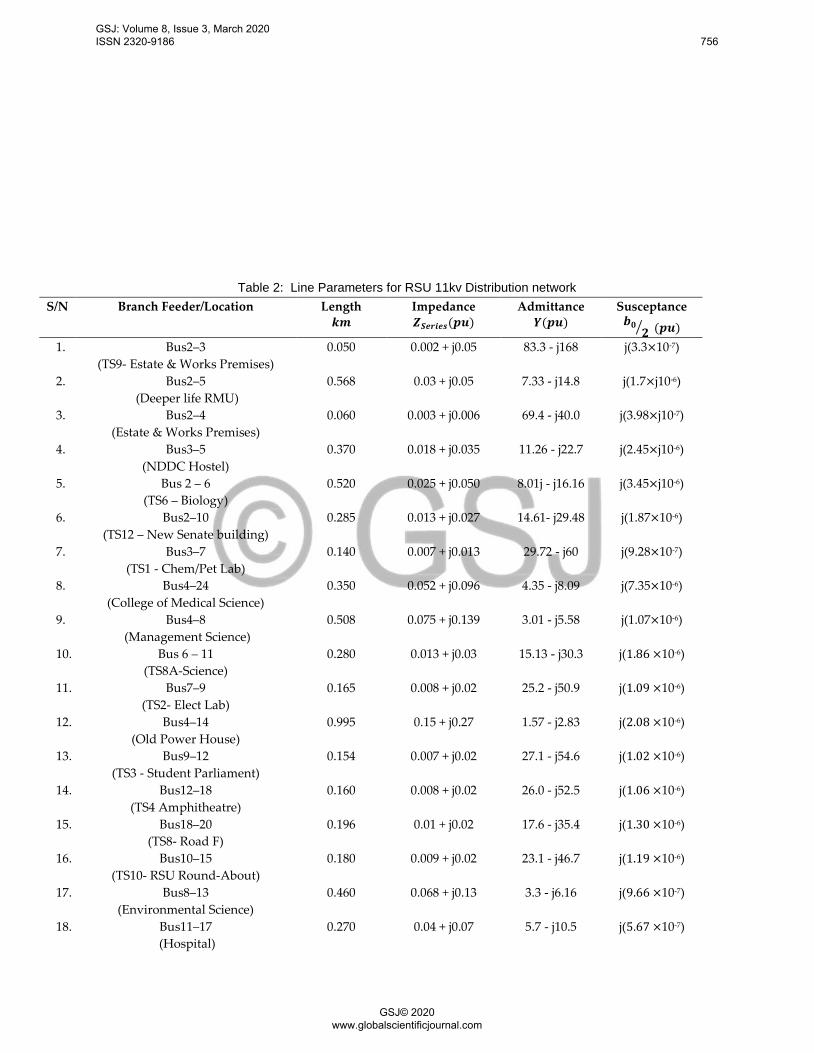
Table 2: Line Parameters for RSU 11kv Distribution network S/N Branch Feeder/Location Length
𝒌𝒌𝒌𝒌 Impedance 𝒁𝒁𝑺𝑺𝑺𝑺𝑺𝑺𝑺𝑺𝑺𝑺𝑺𝑺(𝒑𝒑𝒑𝒑)
Admittance 𝒀𝒀(𝒑𝒑𝒑𝒑)
Susceptance 𝒃𝒃𝟎𝟎
𝟐𝟐 (𝒑𝒑𝒑𝒑) 1. Bus2–3
(TS9- Estate & Works Premises) 0.050 0.002 + j0.05 83.3 - j168 j(3.3×10⁻⁷)
2. Bus2–5 (Deeper life RMU)
0.568 0.03 + j0.05 7.33 - j14.8 j(1.7×j10-6)
3. Bus2–4 (Estate & Works Premises)
0.060 0.003 + j0.006 69.4 - j40.0 j(3.98×j10-7)
4. Bus3–5 (NDDC Hostel)
0.370 0.018 + j0.035 11.26 - j22.7 j(2.45×j10-6)
5. Bus 2 – 6 (TS6 – Biology)
0.520 0.025 + j0.050 8.01j - j16.16
j(3.45×j10-6)
6. Bus2–10 (TS12 – New Senate building)
0.285 0.013 + j0.027 14.61- j29.48
j(1.87×10⁻⁶)
7. Bus3–7 (TS1 - Chem/Pet Lab)
0.140 0.007 + j0.013 29.72 - j60 j(9.28×10⁻⁷)
8. Bus4–24 (College of Medical Science)
0.350 0.052 + j0.096 4.35 - j8.09 j(7.35×10⁻⁶)
9. Bus4–8 (Management Science)
0.508 0.075 + j0.139
3.01 - j5.58 j(1.07×10⁻⁶)
10. Bus 6 – 11 (TS8A-Science)
0.280 0.013 + j0.03 15.13 - j30.3 j(1.86 ×10⁻⁶)
11. Bus7–9 (TS2- Elect Lab)
0.165 0.008 + j0.02 25.2 - j50.9 j(1.09 ×10⁻⁶)
12. Bus4–14 (Old Power House)
0.995 0.15 + j0.27 1.57 - j2.83 j(2.08 ×10⁻⁶)
13. Bus9–12 (TS3 - Student Parliament)
0.154 0.007 + j0.02 27.1 - j54.6 j(1.02 ×10⁻⁶)
14. Bus12–18 (TS4 Amphitheatre)
0.160 0.008 + j0.02 26.0 - j52.5 j(1.06 ×10⁻⁶)
15. Bus18–20 (TS8- Road F)
0.196 0.01 + j0.02 17.6 - j35.4 j(1.30 ×10⁻⁶)
16. Bus10–15 (TS10- RSU Round-About)
0.180 0.009 + j0.02 23.1 - j46.7 j(1.19 ×10⁻⁶)
17. Bus8–13 (Environmental Science)
0.460 0.068 + j0.13 3.3 - j6.16 j(9.66 ×10⁻⁷)
18. Bus11–17 (Hospital)
0.270 0.04 + j0.07 5.7 - j10.5 j(5.67 ×10⁻⁷)
GSJ: Volume 8, Issue 3, March 2020 ISSN 2320-9186 756
GSJ© 2020 www.globalscientificjournal.com
19. Bus11–16 (Faculty of Law)
0.230 0.034 + j0.06 6.6 - j12.3 j(4.83 ×10⁻⁷)
20. Bus16–21 (VC’s Lodge)
0.320 0.047 + j0.09 4.8 - j8.9 j(6.72 ×10⁻⁷)
21. Bus21–22 (Agric Farm.)
0.180 0.032 + j0.06 7.01 - j13.0 j(3.78 ×10⁻⁷)
22. Bus22–23 (Central Library)
0.360 0.053 + j0.10 4.24 - j7.9 j(7.56 ×10⁻⁷)
23. Bus13–19 (Technical & Science)
0.420 0.062 + j0.12 3.64 - j6.7 j(8.82 ×10⁻⁷)
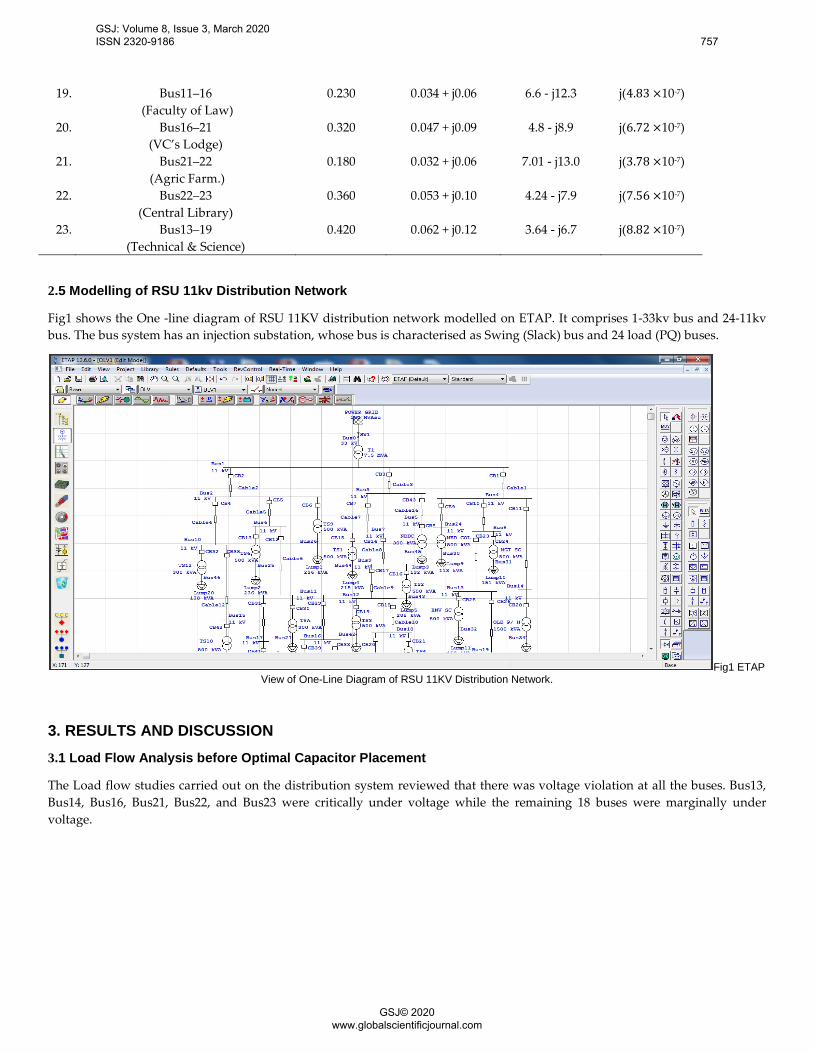
2.5 Modelling of RSU 11kv Distribution Network
Fig1 shows the One -line diagram of RSU 11KV distribution network modelled on ETAP. It comprises 1-33kv bus and 24-11kv bus. The bus system has an injection substation, whose bus is characterised as Swing (Slack) bus and 24 load (PQ) buses.
Fig1 ETAP View of One-Line Diagram of RSU 11KV Distribution Network.
3. RESULTS AND DISCUSSION 3.1 Load Flow Analysis before Optimal Capacitor Placement
The Load flow studies carried out on the distribution system reviewed that there was voltage violation at all the buses. Bus13, Bus14, Bus16, Bus21, Bus22, and Bus23 were critically under voltage while the remaining 18 buses were marginally under voltage.
GSJ: Volume 8, Issue 3, March 2020 ISSN 2320-9186 757
GSJ© 2020 www.globalscientificjournal.com
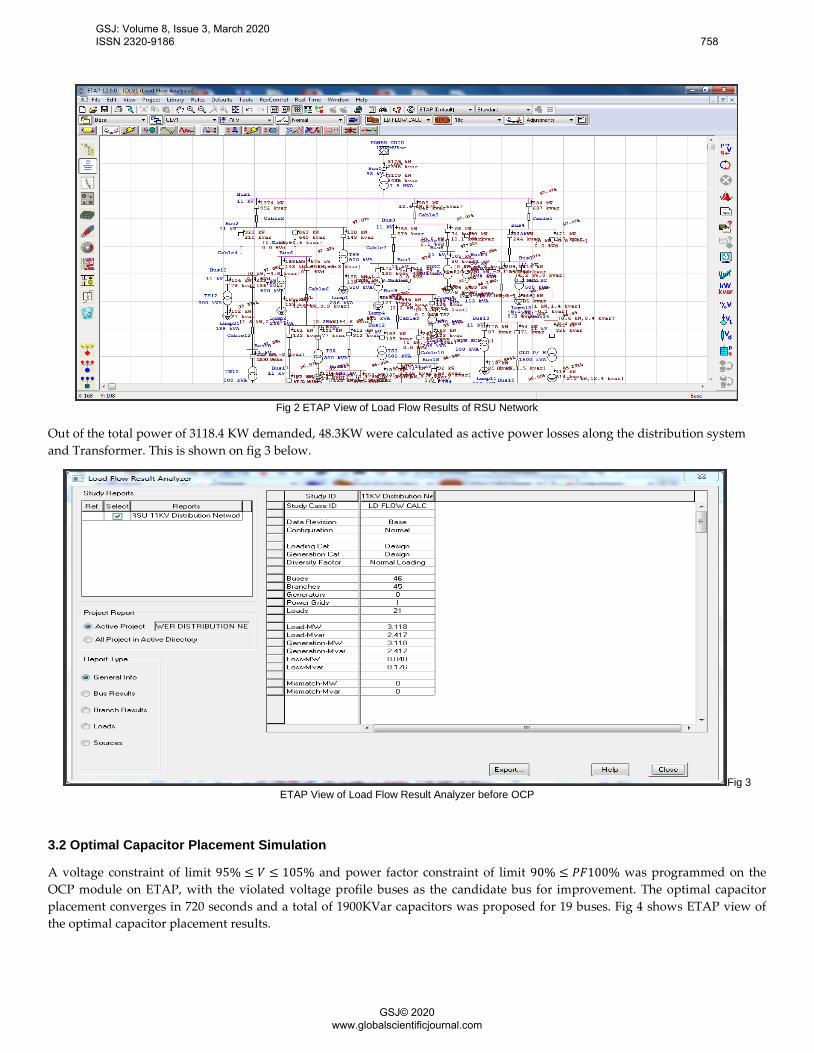
Fig 2 ETAP View of Load Flow Results of RSU Network
Out of the total power of 3118.4 KW demanded, 48.3KW were calculated as active power losses along the distribution system and Transformer. This is shown on fig 3 below.
Fig 3 ETAP View of Load Flow Result Analyzer before OCP
3.2 Optimal Capacitor Placement Simulation
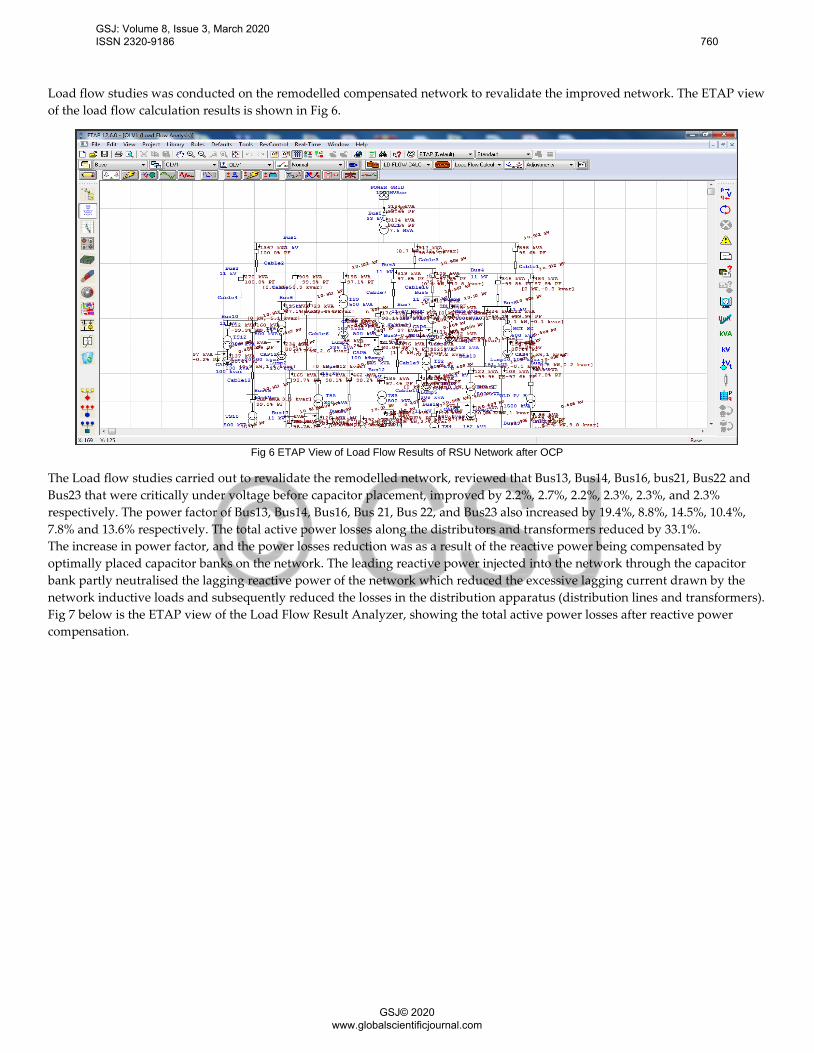
A voltage constraint of limit 95% ≤ 𝑉𝑉 ≤ 105% and power factor constraint of limit 90% ≤ 𝑃𝑃𝑃𝑃100% was programmed on the OCP module on ETAP, with the violated voltage profile buses as the candidate bus for improvement. The optimal capacitor placement converges in 720 seconds and a total of 1900KVar capacitors was proposed for 19 buses. Fig 4 shows ETAP view of the optimal capacitor placement results.
GSJ: Volume 8, Issue 3, March 2020 ISSN 2320-9186 758
GSJ© 2020 www.globalscientificjournal.com
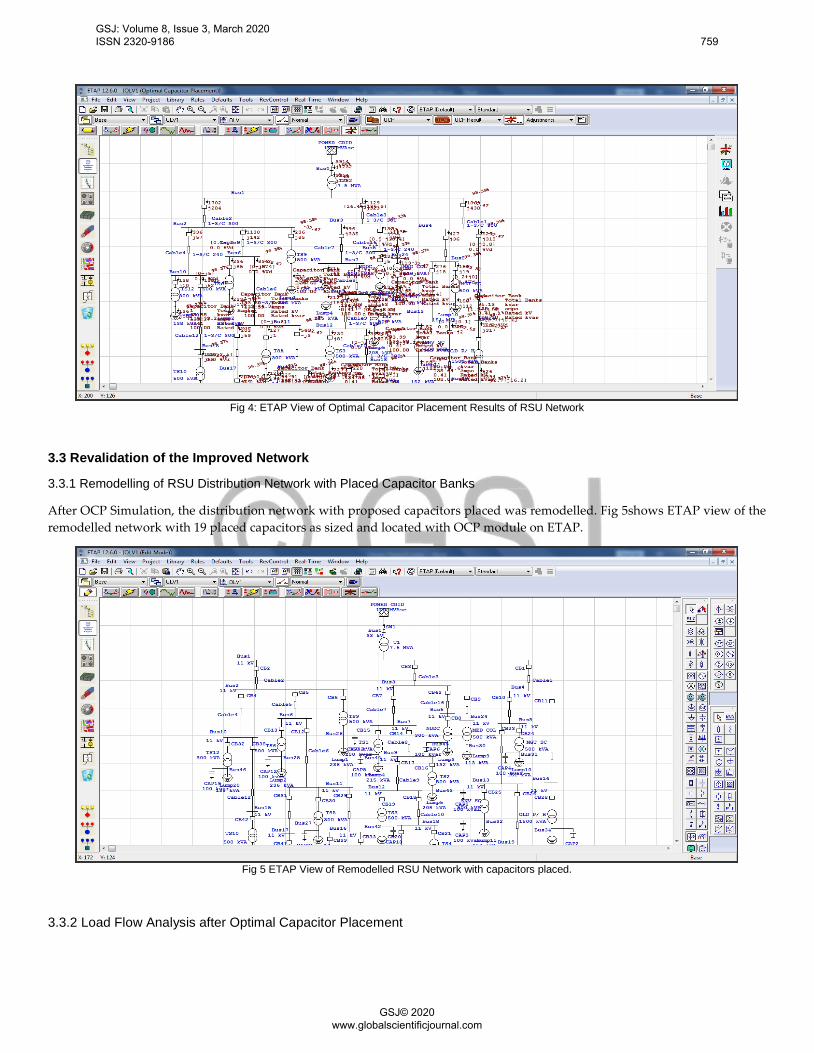
Fig 4: ETAP View of Optimal Capacitor Placement Results of RSU Network
3.3 Revalidation of the Improved Network
3.3.1 Remodelling of RSU Distribution Network with Placed Capacitor Banks
After OCP Simulation, the distribution network with proposed capacitors placed was remodelled. Fig 5shows ETAP view of the remodelled network with 19 placed capacitors as sized and located with OCP module on ETAP.
Fig 5 ETAP View of Remodelled RSU Network with capacitors placed.
3.3.2 Load Flow Analysis after Optimal Capacitor Placement
GSJ: Volume 8, Issue 3, March 2020 ISSN 2320-9186 759
GSJ© 2020 www.globalscientificjournal.com
Load flow studies was conducted on the remodelled compensated network to revalidate the improved network. The ETAP view of the load flow calculation results is shown in Fig 6.
Fig 6 ETAP View of Load Flow Results of RSU Network after OCP
The Load flow studies carried out to revalidate the remodelled network, reviewed that Bus13, Bus14, Bus16, bus21, Bus22 and Bus23 that were critically under voltage before capacitor placement, improved by 2.2%, 2.7%, 2.2%, 2.3%, 2.3%, and 2.3% respectively. The power factor of Bus13, Bus14, Bus16, Bus 21, Bus 22, and Bus23 also increased by 19.4%, 8.8%, 14.5%, 10.4%, 7.8% and 13.6% respectively. The total active power losses along the distributors and transformers reduced by 33.1%. The increase in power factor, and the power losses reduction was as a result of the reactive power being compensated by optimally placed capacitor banks on the network. The leading reactive power injected into the network through the capacitor bank partly neutralised the lagging reactive power of the network which reduced the excessive lagging current drawn by the network inductive loads and subsequently reduced the losses in the distribution apparatus (distribution lines and transformers). Fig 7 below is the ETAP view of the Load Flow Result Analyzer, showing the total active power losses after reactive power compensation.
GSJ: Volume 8, Issue 3, March 2020 ISSN 2320-9186 760
GSJ© 2020 www.globalscientificjournal.com
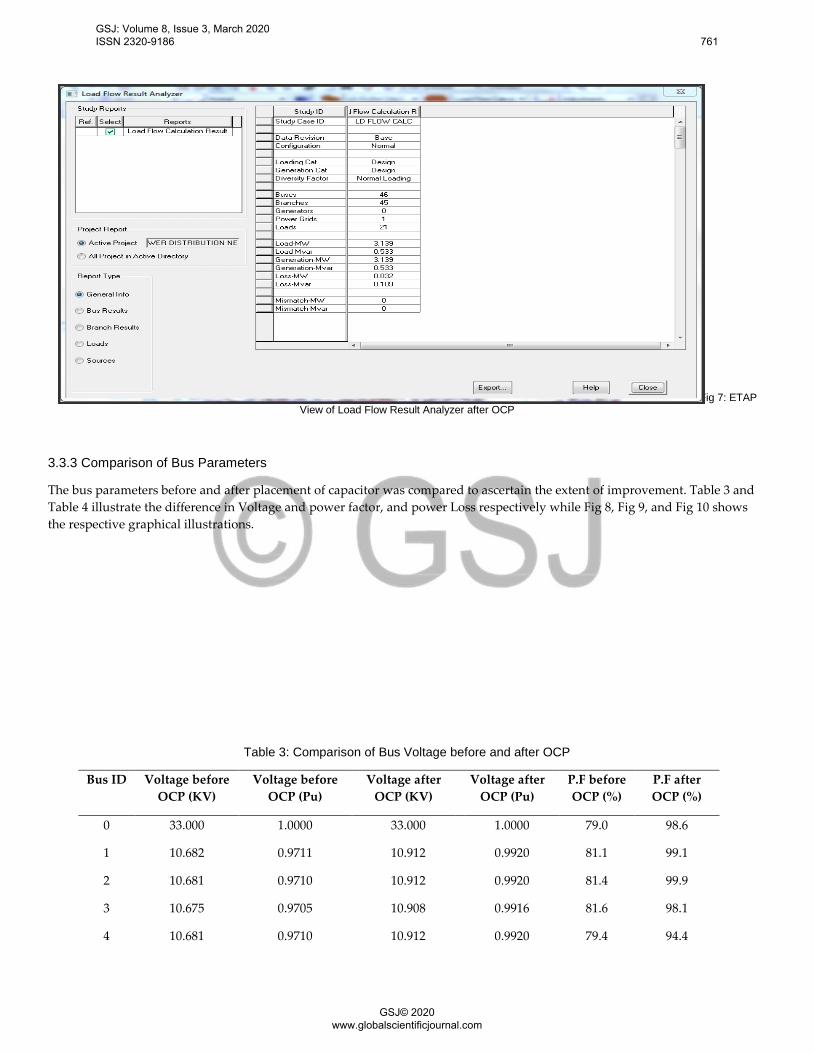
Fig 7: ETAP View of Load Flow Result Analyzer after OCP
3.3.3 Comparison of Bus Parameters
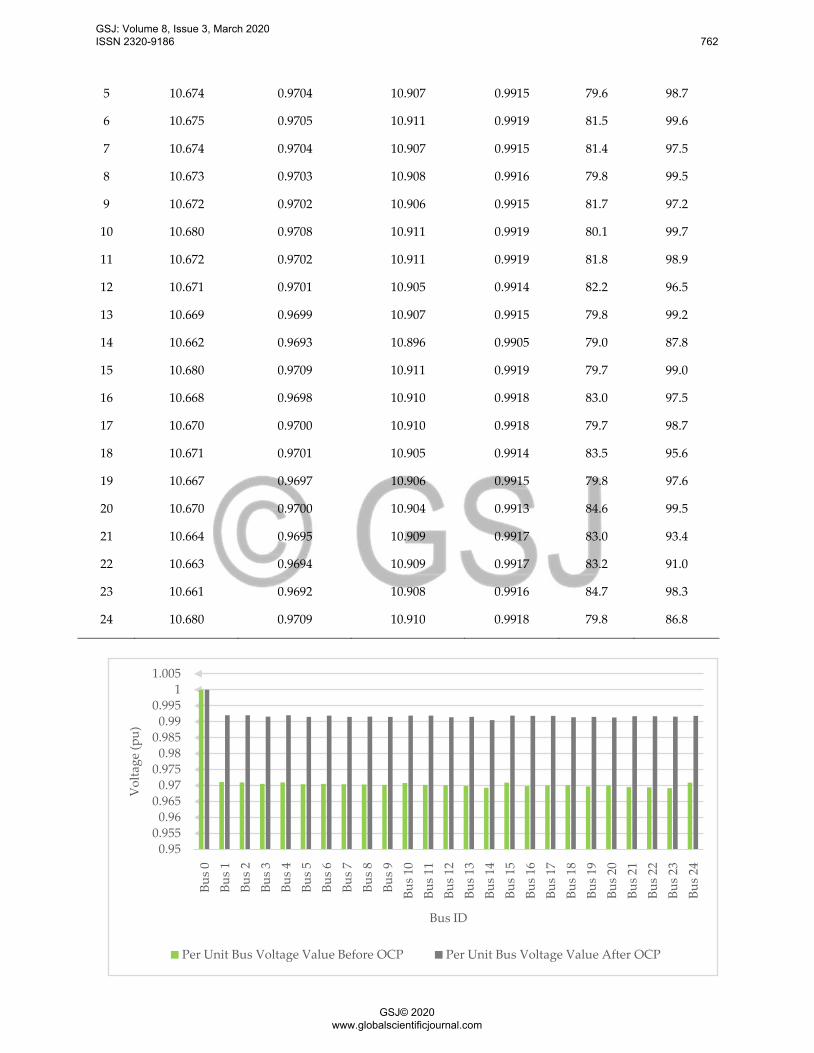
The bus parameters before and after placement of capacitor was compared to ascertain the extent of improvement. Table 3 and Table 4 illustrate the difference in Voltage and power factor, and power Loss respectively while Fig 8, Fig 9, and Fig 10 shows the respective graphical illustrations.
Table 3: Comparison of Bus Voltage before and after OCP
Bus ID Voltage before OCP (KV)
Voltage before OCP (Pu)
Voltage after OCP (KV)
Voltage after OCP (Pu)
P.F before OCP (%)
P.F after OCP (%)
0 33.000 1.0000 33.000 1.0000 79.0 98.6
1 10.682 0.9711 10.912 0.9920 81.1 99.1
2 10.681 0.9710 10.912 0.9920 81.4 99.9
3 10.675 0.9705 10.908 0.9916 81.6 98.1
4 10.681 0.9710 10.912 0.9920 79.4 94.4
GSJ: Volume 8, Issue 3, March 2020 ISSN 2320-9186 761
GSJ© 2020 www.globalscientificjournal.com
5 10.674 0.9704 10.907 0.9915 79.6 98.7
6 10.675 0.9705 10.911 0.9919 81.5 99.6
7 10.674 0.9704 10.907 0.9915 81.4 97.5
8 10.673 0.9703 10.908 0.9916 79.8 99.5
9 10.672 0.9702 10.906 0.9915 81.7 97.2
10 10.680 0.9708 10.911 0.9919 80.1 99.7
11 10.672 0.9702 10.911 0.9919 81.8 98.9
12 10.671 0.9701 10.905 0.9914 82.2 96.5
13 10.669 0.9699 10.907 0.9915 79.8 99.2
14 10.662 0.9693 10.896 0.9905 79.0 87.8
15 10.680 0.9709 10.911 0.9919 79.7 99.0
16 10.668 0.9698 10.910 0.9918 83.0 97.5
17 10.670 0.9700 10.910 0.9918 79.7 98.7
18 10.671 0.9701 10.905 0.9914 83.5 95.6
19 10.667 0.9697 10.906 0.9915 79.8 97.6
20 10.670 0.9700 10.904 0.9913 84.6 99.5
21 10.664 0.9695 10.909 0.9917 83.0 93.4
22 10.663 0.9694 10.909 0.9917 83.2 91.0
23 10.661 0.9692 10.908 0.9916 84.7 98.3
24 10.680 0.9709 10.910 0.9918 79.8 86.8
0.950.955
0.960.965
0.970.975
0.980.985
0.990.995
11.005
Bus 0
Bus 1
Bus 2
Bus 3
Bus 4
Bus 5
Bus 6
Bus 7
Bus 8
Bus 9
Bus 1
0Bu
s 11
Bus 1
2Bu
s 13
Bus 1
4Bu
s 15
Bus 1
6Bu
s 17
Bus 1
8Bu
s 19
Bus 2
0Bu
s 21
Bus 2
2Bu
s 23
Bus 2
4
Vol
tage
(pu)
Bus ID
Per Unit Bus Voltage Value Before OCP Per Unit Bus Voltage Value After OCP
GSJ: Volume 8, Issue 3, March 2020 ISSN 2320-9186 762
GSJ© 2020 www.globalscientificjournal.com
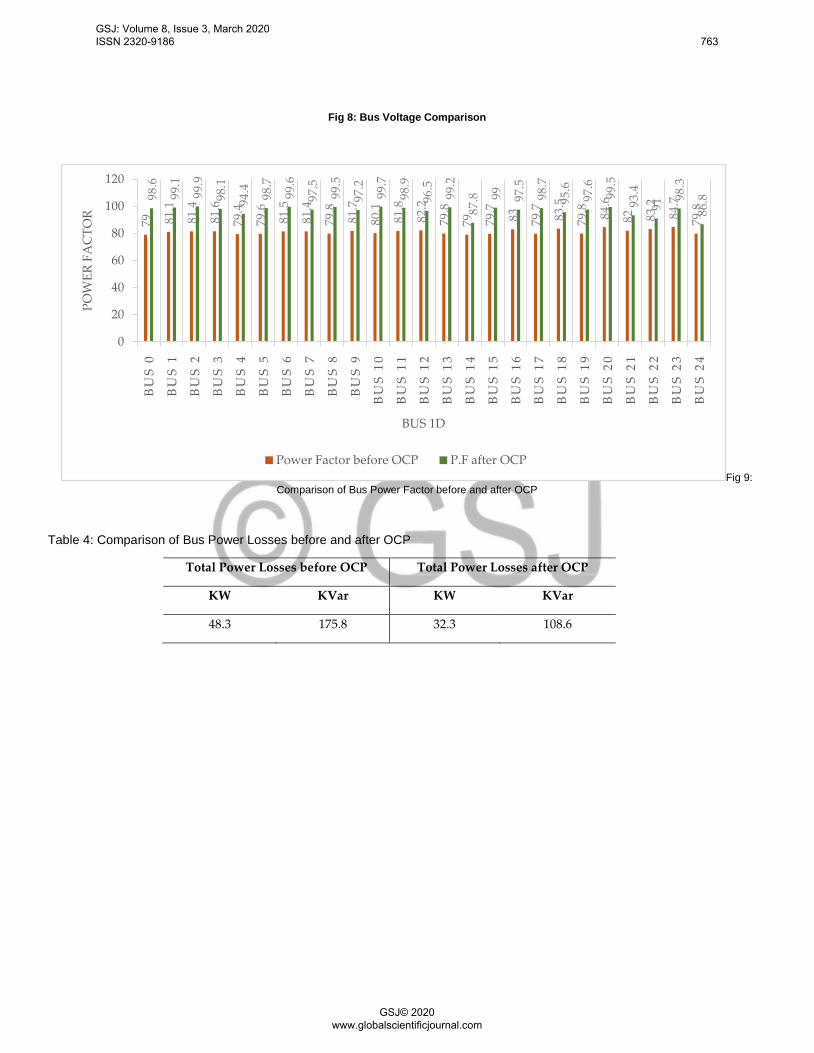
Fig 8: Bus Voltage Comparison
Fig 9: Comparison of Bus Power Factor before and after OCP
Table 4: Comparison of Bus Power Losses before and after OCP
Total Power Losses before OCP Total Power Losses after OCP
KW KVar KW KVar
48.3 175.8 32.3 108.6
79 81.1
81.4
81.6
79.4
79.6
81.5
81.4
79.8
81.7
80.1
81.8
82.2
79.8
79 79.7 83 79.7 83.5
79.8 84
.6
82 83.2
84.7
79.8
98.6
99.1
99.9
98.1
94.4 98.7
99.6
97.5
99.5
97.2
99.7
98.9
96.5
99.2
87.8 99 97
.5
98.7
95.6
97.6
99.5
93.4
91
98.3
86.8
0
20
40
60
80
100
120
BU
S 0
BU
S 1
BU
S 2
BU
S 3
BU
S 4
BU
S 5
BU
S 6
BU
S 7
BU
S 8
BU
S 9
BU
S 10
BU
S 11
BU
S 12
BU
S 13
BU
S 14
BU
S 15
BU
S 16
BU
S 17
BU
S 18
BU
S 19
BU
S 20
BU
S 21
BU
S 22
BU
S 23
BU
S 24
POW
ER F
AC
TOR
BUS 1D
Power Factor before OCP P.F after OCP
GSJ: Volume 8, Issue 3, March 2020 ISSN 2320-9186 763
GSJ© 2020 www.globalscientificjournal.com
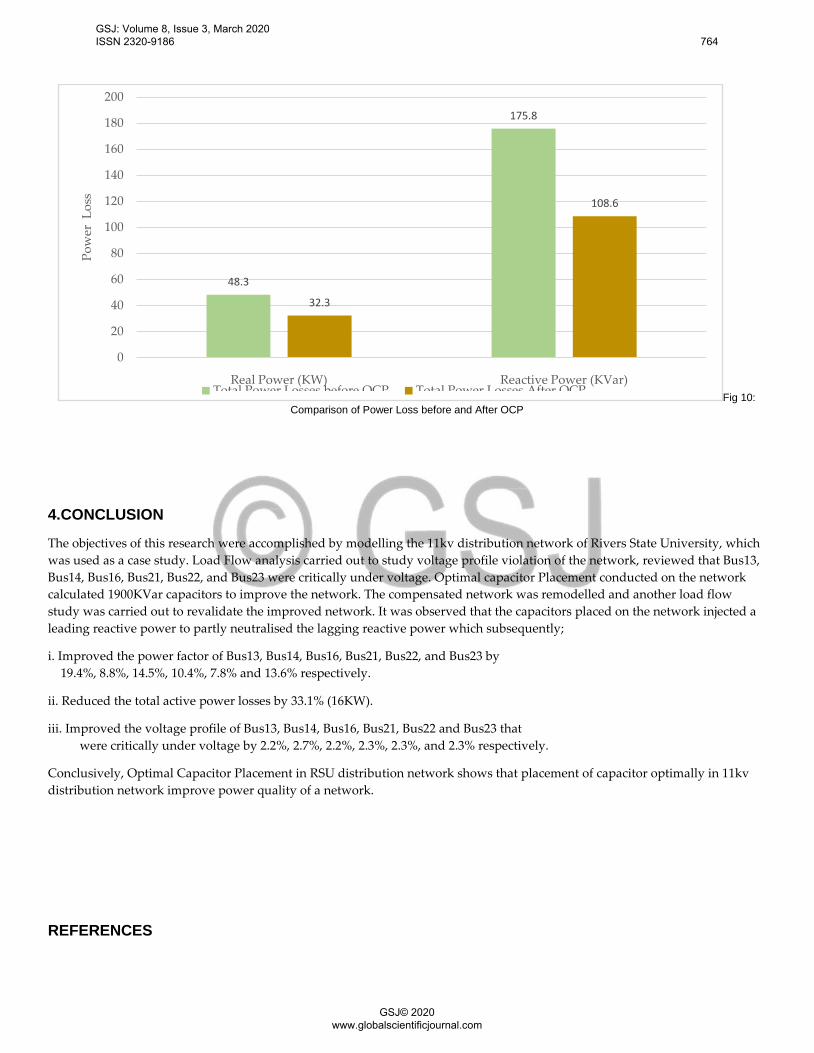
Fig 10: Comparison of Power Loss before and After OCP
4.CONCLUSION
The objectives of this research were accomplished by modelling the 11kv distribution network of Rivers State University, which was used as a case study. Load Flow analysis carried out to study voltage profile violation of the network, reviewed that Bus13, Bus14, Bus16, Bus21, Bus22, and Bus23 were critically under voltage. Optimal capacitor Placement conducted on the network calculated 1900KVar capacitors to improve the network. The compensated network was remodelled and another load flow study was carried out to revalidate the improved network. It was observed that the capacitors placed on the network injected a leading reactive power to partly neutralised the lagging reactive power which subsequently;
i. Improved the power factor of Bus13, Bus14, Bus16, Bus21, Bus22, and Bus23 by 19.4%, 8.8%, 14.5%, 10.4%, 7.8% and 13.6% respectively.
ii. Reduced the total active power losses by 33.1% (16KW).
iii. Improved the voltage profile of Bus13, Bus14, Bus16, Bus21, Bus22 and Bus23 that were critically under voltage by 2.2%, 2.7%, 2.2%, 2.3%, 2.3%, and 2.3% respectively.
Conclusively, Optimal Capacitor Placement in RSU distribution network shows that placement of capacitor optimally in 11kv distribution network improve power quality of a network.
REFERENCES
48.3
175.8
32.3
108.6
0
20
40
60
80
100
120
140
160
180
200
Real Power (KW) Reactive Power (KVar)
Pow
er L
oss
Total Power Losses before OCP Total Power Losses After OCP
GSJ: Volume 8, Issue 3, March 2020 ISSN 2320-9186 764
GSJ© 2020 www.globalscientificjournal.com
[1] Mohammad, A., Masoum, S. andEdwald, F. “Power Quality in Power Systems and Electrical Machines”. Academic Press,123-146, 2015. [2] Afolabi, O. A., Ali, W. H., Fuller J., Cofie, P., Obiomon, P., andKolawole, E. S.“Analysis of Load Flow Problem in Power System Planning Studies,”Energy and Power Engineering, 7, 509-523, 2015. Retrieved from http://www.scirp.org/journal/epe. [3]Mehta, V. K and Mehta, R. “Principles of Power System”:(international edition) 2013. [4] Akhikpemelo, A. andAdeyi, A. “Reliability Analysis of Power Distribution Network:,”Department of Electrical/Electronic Engineering, Maritime Academy of Nigeria, Oron. Continental J. Engineering Sciences 11(2), 52-64, 2016. [5] Manivasagam, R. andHaland, H.“Performance Comparison of Power Flow Studies Using Mipower,”International Journal of Latest Technology in Engineering, Management & Applied Science (IJLTEMAS) 8(5),| ISSN 2278-2540, 2019.https://scialert.net/abstract/?doi=jas.2010.2998.3006 . [6] Babi, V. andVeerakumari, M.“Determination of Bus Strength and Stability by using Voltage Stability Indexes for Transmission Expansion Planning,”International Journal for Research in Applied Science & Engineering Technology (IJRASET) 6(8) ISSN: 2321-9653, 2018. [7] Pabla, A. S. “Electric Power Distribution”, Tata McGraw-Hill Education Pvt. Ltd., New Delhi, (6th Edition). 232-239, 2011. [8] Hadi, S.“Power System Analysis,” (3rd Edition). PSA Publishing, North York, 2010.
GSJ: Volume 8, Issue 3, March 2020 ISSN 2320-9186 765
GSJ© 2020 www.globalscientificjournal.com