shunt capacitor placement in radial distribution networks...
TRANSCRIPT

1
Shunt Capacitor Placement in Radial Distribution Networks Considering Switching Transients Decision Making Approach
Mohammad Sadegh Javadi1, Ali Esmaeel Nezhad2, Pierluigi Siano3,*, Miadreza Shafie-khah4, João P. S. Catalão4,5,6
1Department of Electrical Engineering, Shiraz Branch, Islamic Azad University, Shiraz, Iran
2 Young Researchers and Elite Club, Shiraz Branch, Islamic Azad University, Shiraz, Iran
Department of Industrial Engineering, University of Salerno, Fisciano, Italy3,*
001 Covilhã, Portugal-rsity of Beira Interior, R. Fonte do Lameiro, 6201MAST, Unive-C4
465 Porto, Portugal-INESC TEC and Faculty of Engineering of the University of Porto, R. Dr. Roberto Frias, 42005
001 Lisbon, Portugal -ovisco Pais, 1, 1049ID, Instituto Superior Técnico, University of Lisbon, Av. R-INESC6
Abstract– This paper provides a new approach in decision making process for shunt capacitor
placement in distribution networks. The main core of the evaluation process is a multi-objective
framework to allocate the capacitor banks. The power loss and the total harmonic distortion (THD)
are the objective functions of the system under study in a long-term planning horizon. In order to
select the executive plan introduced by using a multi-objective model, transient switching
overvoltages have been considered. As the size and location of shunt capacitors may result in
unacceptable overvoltages, the proposed technical decision making framework can be applied to
avoid corresponding damages. In this paper, an iterative conventional power flow technique is
introduced. This technique can be applied to evaluate THD for distribution networks as well as
other power flow based objectives, such as power losses calculation and voltage stability
assessment. The presented framework is a two stage one where at the first stage, a non-dominated
sorting genetic algorithm (NSGA-II) augmented with a local search technique is used in order to
solve the addressed multi-objective optimization problem. Then, at the second stage, a decision
making support technique is applied to determine the best solution from the obtained Pareto front.
In order to evaluate the effectiveness of the proposed method, two benchmarks are addressed in this

2
paper. The first test system is a 9-bus distribution network and the second one is an 85-bus large
scale distribution network. The simulation results show that the presented method is satisfactory and
consistent with the expectation.
Keywords: Shunt Capacitors, Switching Transients, Multi-objective Optimization, Iterative Power Flow, Local Search
Technique, Non-dominated Sorting Genetic Algorithm
1. Introduction Static reactive power compensation carried out by installing capacitor banks has a solid
background in power distribution network compensation. Indeed, at the sub-transmission and
distribution voltage levels, application of switched capacitor banks has been generally adopted. In
particular, capacitors have been commonly used to provide reactive power compensation in
distribution systems. Earlier approaches for addressing the capacitor placement problem differ in
both the problem formulation and the solution methods. In some approaches, the savings due to
energy losses reduction and peak power losses reduction against the capacitor cost are considered as
the objective function in an unconstrained optimization. Other researches formulated the problem
with some variations of the above objective function and some of them have also formulated the
problem as a constrained optimization and have considered voltage constraints [1].
Management of the switched capacitor banks has a vital role in order to achieve power and
energy losses reduction, system capacity release and acceptable voltage profile, in the operation
horizon. However, the extent of these benefits depends upon the location, size, type and the number
of the capacitors as well as their control settings [2]. In the planning stage, determination of optimal
size, location and type of capacitor banks are the discrete design decision variables. Although the
planning variables of these assets are discrete, they may have a direct impact on the continuous
variables, such as bus voltage, loss, etc. [3].
Power factor correction is normally achieved by the addition of capacitors to the electrical
network which are able to compensate the reactive power demand of the inductive loads and thus

3
reduce the burden on the supply without any effect on the operation of the equipment [4]. However,
installation of each reactive compensation devices may result in enhanced power quality, reliability
and other issues.
The benefits that can be achieved by applying the proper power factor correction are:
Environmental benefit: reduction of power consumption due to improved energy
efficiency.
Reduced power consumption means less greenhouse gas emissions and fossil fuel
depletion by power stations.
Reduction of the electricity bills
More active power would be attained from the distribution assets.
Reduction of active power losses in transformers and distribution equipment.
Reduction of voltage drop in long cables
Extended equipment life due to the reduced electrical burden on cables and electrical
components.
Combinations of the circuit parameters leading to the maximum over voltages are determined in
compliance with the analytical research of voltage magnification, as performed in Ref. [5].
According to the analysis, the phenomenon of voltage magnification occurs when two series
connected LC loops have the same natural frequency. The results of the aforementioned analysis
(further referred to as the traditional approach) have been adopted in technical literature [6].
Numerical studies of the voltage magnification performed in Refs. [7] and [8] which enabled to
calculate the combinations of the circuit parameters that lead to the maximum over voltages.
It is also worth noting that high transient currents can occur with values higher by ten times than the
capacitor nominal current with a duration of several milliseconds [9]. Several parameters that can
determine the maximum inrush current have been analyzed in Ref. [10], such as pole spread, the

4
dumping resistor inserted in the current limiting reactor, natural frequency and saturation of the
current limiting reactor [11].
However, there are many research works devoted to capacitor placement problem as a vital issue in
distribution networks. In this regard, Ref. [12] implemented the above-mentioned problem in order
to reduce the power losses as well as improving the voltage profile using ant colony optimization
algorithm. Ref. [13] proposes a two-stage framework for locating and sizing of capacitors in radial
distribution systems where the loss sensitivity factors are used in the first stage to determine the
candidate buses and in the second stage, flower pollination algorithm is used to specify the locations
of capacitors among the buses selected in the first stage. It is noted that an improved harmony
search algorithm along with power loss index has been employed in Ref. [14] for the capacitor
placement in distribution systems. Besides, an optimization technique based on plant growth has
been utilized in Ref. [15] to optimally locate the capacitor in power systems. Another research work
investigating the optimal capacitor placement in distribution network is Ref. [16] where the problem
has been solved using enhanced bacterial foraging optimization while the thermal re-rating of
critical cables has been precisely modeled. Furthermore, penalty free genetic algorithm has been
used in Ref. [17] for locating and sizing capacitors in distorted distribution systems which include
different load models. It should be noted that all these research works have proposed a single
objective framework for capacitor placement in distribution systems. However, it is noted that there
are some uncertain parameters within the context of capacitor placement problem in distribution
networks such as load demand and renewable power generation. In this regard, a comprehensive
study on different methods has been carried out in Ref. [18].
The main contributions of this paper are as follows:
1) Proposing a novel framework for Bi-objective Shunt capacitor placement
2) Evaluating the Pareto solutions by analyzing the transient overvoltages
3) Proposing a two-stage framework for the problem of shunt capacitor placement

5
4) Employing NSGA-II augmented with a local search to find the Pareto solutions
This paper is organized as follows: in Section 2, the iterative distribution power flow is presented
where the classic distribution power flow is modified to address the different types of loads by
adopting the successive substitution technique. Section 3 provides the capacitor placement in radial
networks. This section addresses the capacitor placement problem as a multi-objective optimization
problem considering the power losses and the total harmonic distortion. Section 4 includes the
descriptions on the augmented non-dominated sorting genetic algorithm used as the local search
technique to determine the optimal Pareto front for the capacitor placement problem. The optimal
Pareto set would be then evaluated by using a decision making technique. The transient overvoltage
due to capacitor switching in the distribution network is considered for the decision making process
in Section 5. Simulation results for the two case studies are provided in Section 6 to evaluate the
feasibility and optimality criterion. Conclusion remarks are addressed in the last section.
2. Iterative Distribution Power Flow The Backward-Forward power flow method has been addressed in the literature to perform
distribution load dispatch. As the mentioned model has been proposed for the usual frequency of
50-60 Hz, the implementation of such a technique to consider the harmonic power flow needs to be
revised. The method proposed in this paper is based on classical Newton-Raphson power flow
algorithm and considers the recursive equations to update the results in the presence of voltage
dependent load models. The effects of various load models on the convergence pattern of the
method have been verified. As the real distribution networks have several laterals and branches, it is
needed to apply a fast and reliable technique with a fair convergence trend to perform the
distribution power flow. The proposed successive substitutive power flow method confirms that the
convergence ability of the proposed method is acceptable when compared with Ratio-Flow method,
which is known for its faster convergence characteristics amongst various sweep methods [19]. In
the successive power flow method, the obtained results are used to update the active and reactive

6
demanded power at each load center. As the demanded loads are considered to be voltage
dependent, it is needed to iteratively update the active and reactive power.
Since the nature of commercial, industrial and residential loads is such that their active and
reactive powers are dependent on the voltage and frequency of the system, it is needed to provide a
model which is able to handle these issues. In this study, for voltage depended loads, the power
flow model is solved by a successive power flow method and in order to calculate the total
harmonic distortion, the modified power flow algorithm should be implemented by taking into
consideration the other harmonic orders. Common static load models for active and reactive power
are expressed in a polynomial or an exponential form. The characteristic of the exponential load
models can be given as:
)1( (0)(0)
Pnli
li lili
VP PV
)2( (0)(0)
Qnli
li lili
VQ QV
where nP and nQ stand for load exponents, (0)liP and (0)
liQ stand for the values of the active and
reactive powers at the nominal voltages for load l located at bus i, respectively. liV and (0)liV stand
for bus voltage and bus nominal voltage, respectively. Special values of nP and nQ can cause
specific load types such as: 0, constant power; 1, constant current; 2, constant impedance. The
polynomial load model is a static load model that represents the power–voltage relationship as a
polynomial equation of voltage magnitude. It is usually referred as ZIP model, since it is made up
of three different exponential load models: constant impedance (Z), constant current (I) and constant
power (P) static load models.
Common values for exponents of static loads are given in Table 1 [20-22]. For practical
applications, the evaluation of coefficients nP and nQ requires the use of parameter estimation
techniques.

7
Table 1. Common Values for the Exponents for Different Static Load Models [23]
Load Component nP nQ Battery charge 2.59 4.06
Fluorescent lamps 2.07 3.21
Constant impedance 2 2
Fluorescent lighting 1 3
Air conditioner 0.5 2.5
Constant current 1 1
Resistance space heater 2 0
Pumps, funs other motors 0.08 1.6
Incandescent lamps 1.54 0
Compact fluorescent lamps 1 0.35
Small industrial motors 0.1 0.6
Large industrial motors 0.05 0.5
Constant power 0 0
In power flow studies, by incorporation of each common technique used to solve the load flow,
such as Newton-Raphson, Gauss-Seidel and backward-forward techniques, the successive method
could be implemented in order to determine the problem variables, such as power flow direction,
branch current, node voltage and so on. In the successive power flow technique, the replacement of
decision variables (node voltages) should iteratively be performed to maintain the acceptable
absolute error. In this study, for the fundamental frequency (50-60 Hz), the load flow calculation
has been performed by implementing the classical Newton-Raphson model.
The power flow equations for active and reactive power are as follows:
)3( 1 1 1 1 1 1 1
1| || | | | cos( ) 0 1,2,...,
ili ji j i i j ji
j iP Y V V i m
)4( 1 1 1 1 1 1 1
1| || | | | sin( ) 0 1, 2,...,
ili ji j i i j ji
j iQ Y V V i m
where 1jiY is the element ji of the bus admittance matrix based on fundamental frequency; is the
voltage angle; 1ji is the corresponding angle of element 1
jiY . The superscript denotes the
fundamental frequency.

8
The voltage at node i and j are addressed by 1iV and 1
jV , respectively. The Y-bus matrix for a
given network can be arranged as follows:
)5(
ijyyy
ijyYY
ciijij
jijijiji 11
,11
,1
1111
where, the 1jiy is the admittance of line section between buses j and i while 1
ciy is the admittance of
shunt capacitor at bus i at the fundamental frequency. The power losses between nodes i and i+1
can be calculated by:
)6( 21 1 1 1( , 1) , 1 1 , 1| || |loss i i i i i i i iP R V V y
As the power factor correction obtained by implementing the capacitor banks placement in
distribution networks would reduce the power losses, the benefits of the loss reduction due to such
assets should be considered in the objective cost function. In this paper, one of the objective
functions aimed to be minimized is represented by the power losses. The impacts of reducing power
losses can affect the operational cost in the planning horizon. It is noted that the impacts of the
power losses can be considered in the objective function both as minimizing the annual power
losses and also as the maximization of the savings due to the power losses reduction. However, it
should be considered that the form used in this paper is for the sake of comparison. Furthermore, it
is note-worthy that the first part of the simulation includes the optimal power flow in order to obtain
the Pareto optimal solutions of the problem, i.e. the possible plans. This part employs a static power
flow. After obtaining the optimal Pareto solutions, it is time to select the most compromise
solutions. In this respect, this manuscript uses a transient study of all Pareto solutions using
Electromagnetic Transient Program (EMTP) to choose the solution with the best transient
performance. This part plays the decision making role in the problem.

9
3. Capacitor Placement in Radial Networks
The issue of capacitor placement in radial distribution networks is a well-known problem. In
order to evaluate the feasibility of the mentioned problem, some benchmarks have been addressed
in the literature [24]. The general distribution system capacitor placement problem consists of
determining the optimal location, type, and size of capacitors such that the power and energy losses
are minimized while taking the cost of capacitors into account [25]. In recent research studies, the
effects of harmonic distortion in the presence of capacitor banks have been studied [26]. The total
harmonic distortion index has been considered as a constraint in the previous studies.
In this paper, the THDmax is considered as an objective function together with the power losses.
One of the effects of capacitor placement in the radial networks is energy loss reduction influencing
the operational cost. Also, the optimal capacitor placement maintains the voltage profile in an
acceptable margin. The steady state voltage limitations are considered as constraints and should
remain between the permitted range.
The capacitor placement problem in a multi-objective problem is stated as follows:
21 , ffMinimize
where,
BudgetYearFts
THDMaxfFf
Cap
voltagei
Loss
)/($..
)(2
1
(7)
The first objective function aims to minimize the power loss, FLoss, and the second objective
function is organized to minimize the maximum THD observed at entire nodes of distribution
network in presence of capacitor banks, while the annual investment cost has been limited. It is
noted that the cost of supplying load demand is assumed to be fixed since the distribution system
considered is radial and the price of energy is fixed, as well. Besides, the energy tariff is considered

10
to be fixed and does not vary with the consumption. Thus, minimizing the cost of supplying load
has not been considered in the objective function. It is worth noting that the consideration of the
investment cost as one of the constraints has been considered in order to limit the number of shunt
capacitors placement in distribution networks. Not considering this constraint may generate, in fact,
a solution involving high number of capacitors that will not be justified by a modest increase in
other objective functions. So, the number of installed shunt capacitors should be compared to the
benefits they bring in terms of other factors such as power losses, THD, and so on.
There are several research works considering the THD as a constraint when considering the
placement of shunt capacitors. This paper also considers the THD as the second objective function
enabling the decision maker to evaluate different plans. Moreover, it should be noted that after
obtaining the optimal Pareto fronts (optimal plans), it is considered that THDs above 10% are not
acceptable in the first case study, while in the second case study, it is assumed that THDs above 5%
are unacceptable. It should be noted that the voltage of buses is a constrained variable between 0.9
p.u. and 1.1 p.u in the considered problem, so it is not necessary to add another objective function
related to voltages at buses.
The capacitors' size, capacity and their locations are discrete decision variables. It is noted that
the term “size” refers to the capacity of each capacitor unit which are assumed to be available in
150 kVAr utmost and the term “capacity” refers to the total capacity of capacitors needed to be
installed. The maximum size of capacitor banks are a multiple of the smallest size 0cQ as follows:
max 0c cQ LQ (8)
where L is an integer coefficient and generally, larger capacitor sizes are cheaper than smaller ones.
Therefore, the maximum allowable capacitor size to be placed at any feeder location is limited to
maxcQ .

11
Then at each shunt capacitor location, there are L capacitor sizes 0 0 0, 2 ,...,c c cQ Q LQ to choose
from. Moreover, the per kVAr investment cost of larger capacitor banks are lower than the
associated capital costs for smaller ones. Let 1 2, ,...,c c cLK K K be their corresponding equivalent
annual cost per kVAr. Following the above notation, the annual investment cost function due to
capacitor placement is written as:
1($ / )
kc c
Cap j jj
F K Q Y ear
(9)
where j = 1, 2, ..., k represents the shunt capacitor buses. The simulation results confirm this issue
that by installing the capacitor banks in radial distribution networks, the active power losses would
be reduced. The main reason of this reduction is due to voltage profile improvement. The amount of
power losses has been considered in this paper. However, the cost of power losses can be by
multiplying the cost of power losses, pK , by the annual loss, YlossP as following, but the amount of
power loss .
($ / )p YLoss lossF K P Y ear (10)
The annual power loss is the integral of hourly power loss and is defined by:
1
01
)1,(m
i
nloss
N
n
Yloss iiPP (11)
where N is the number of hours over a year, i.e. 8760 hours and m denotes the number of buses
while i=0 indicates the slack bus.
It should be noted that the THD at each node would be attained by implementing the harmonic
power flow [26]. By calculating the n-th order harmonic voltage at node i, the rms voltage can be
calculated by:
2
1
N ni i
nV V
(12)
The corresponding THD for voltage is therefore as follows:

12
2
11(%) 100
N ni
voltage ni
i
VTHD
V
(13)
In this study, the objectives of placing shunt capacitors along distribution feeders is to reduce the
total power loss and to minimize the maximum THD at entire buses while bringing the bus voltages
within the prescribed limits.
min maxiV V V (14)
where Vmin and Vmax correspond to the permissible minimum and maximum rms voltage in the
system under study, respectively.
4. Non-dominated Sorting Genetic Algorithm (NSGA-II) Augmented by Local Search The Elitist Non-dominated Sorting Genetic Algorithm is presented in [27]. The NSGA-II uses not
only an elite-preserving strategy but also an explicit diversity-preserving mechanism. NSGA-II
provides an efficient procedure for introducing elitism into multi-objective evolutionary algorithms
while guaranteeing a diversity-preserving mechanism, assuring in this way a good convergence
towards the Pareto-optimal front without losing solution diversity. In this paper, the classical
NSGA-II is augmented by local search algorithm. The main features of local search technique
adopted in reactive power planning, especially in capacitor placement has been addressed in [28].
The enhanced NSGA-II approach couples a local search scheme to the standard NSGA-II, which is
adapted to the characteristics of the VAR planning problem in radial networks. In this problem the
main decision variables refer to the identification of the network nodes to install capacitors and the
dimension of each capacitor to be installed aimed at minimizing system losses, while keeping an
adequate voltage profile and satisfying physical laws in electrical networks. The chromosome
structure is divided into two parts of equal lengths. The first part of the chromosome keeps the
identification of the nodes where capacitors should be located for that specific solution. The second
part of the chromosome holds the capacitor sizes that are located at the network nodes described in

13
the first part. In this research, we consider that the capacitor location is limited to predefined nodes.
In other words, the first part decision variables are binary variables. However, the proposed method
can solve the optimization models in which the first part of chromosome has integer decision
variables. The proposed model can be implemented in the generation and transmission expansion
planning problem in which the decision variables are the same as the capacitor placement problem.
As the second part of chromosomes is associated with the size of capacitors, it is needed to adopt a
mapping procedure to map the corresponding capacitor from the list.
The continuous decision variables (active power, reactive power and node voltage) in the
mathematical model are computed using the addressed iterative power flow algorithm, which is
invoked once a solution configuration is established (the size of capacitor to be installed in each
network node).
A new population E0 is obtained using binary tournament selection crossover and mutation.
Before combining together the parent and offspring populations, the local search procedure is
applied to all offspring solutions, trying to adjust the capacity installed. The local search only
operates on the second part of the chromosome. In this local search scheme, a move leading to a
neighbor solution is defined by changing the capacitor size in the network to a neighbor size. In the
proposed local search scheme, the procedure attempts to improve the solution by moving the
capacitors' size considering the fact of installing capacitor banks. The local search is adopted for
each chromosome if the first part advises to install capacitor banks. As the second part of
chromosome is under the local search, it is possible to reduce the size of chromosome to the second
part. In order to reduce the size of chromosome, the first part of chromosome would be merged. In
such a case, if the chromosome introduces a non-zero number, it means that at corresponding node
we have a capacitor bank, otherwise it is not necessary to perform the local search for that
chromosome. By implementing the mapping procedure at this stage, the computational burden
would be reduced.

14
Fig 1. Classical mapping procedure to address the capacitor placement problem
Fig2. Modified capacitor placement with local search technique
Fig. 1 illustrates the classical mapping procedure to address the chromosome to capacitor
placement problem. The modified local search technique addressed in this section is provided in
Fig. 2. In this paper, the standard NSGA-II algorithm is modified by considering the addressed local
search to determine the optimal Pareto front. A detailed explanation of standard NSGA-II can be
found in [27] and [29].
In the next section, the transient overvoltage due to switching the capacitor banks in the
distribution network is addressed. This key factor is then taken into consideration as decision
making technique after Pareto front determination by multi-objective optimization model. However,
fuzzy satisfying method can be used, as well [30] beside other methods, such as VIKOR, TOPSIS,
analytic hierarchy process (AHP), Analytic network process (ANP), etc.

15
5. Capacitor Switching Transients The switching transient overvoltage is a well-known phenomenon appearing at the customer
terminals due to capacitor bank switching. The switching transient overvoltages may result in power
quality problems and affect the adjustable speed drives, protection devices and communication
equipment. Such transient overvoltages should be minimized in the planning and operation stages to
maintain the voltage profile in acceptable margins. At the operating horizon, connection and
disconnection of capacitor banks should be managed by smart switches to reduce the maximum
overvoltages. Resistive switching and inductive switching actions are the conventional methods to
mitigate the transient over voltages due to capacitor switching [31].
The peak voltage magnitude of the transient depends upon the instantaneous system voltage at the
moment of energizing and under worst-case conditions, this can be up to 2.0 times greater than the
normal system peak voltage [32]. But the magnitude is usually less than this value because of
system loads and damping phenomenon due to resistive elements in the system [7]. In distribution
networks, typical over voltage levels would be between 0.9 and 1.1 p.u [33]. In addition, to the
transient overvoltage phenomenon, application of shunt capacitors can lead to the following side
effects: Increased transient inrush current in power transformers, and prolonged decay rate of the
transient [34]. Severe harmonic distortion, and resonance with load-generated harmonics and
capacitors can be stressed due to switching transients [8].
Determination of the maximal magnified overvoltages, which may be applied across the customer
terminals, has become an important task for power utility engineers.
As mentioned above, the capacitor bank switching provokes transient overvoltages that
theoretically can reach peak phase-to-earth values in the order of 2.0 p.u. Amplified overvoltages in
remote capacitor banks due to the oscillatory nature of the coupled circuit can be also generated [5].
Some factors that affect the amplification of the transient voltages during the capacitor banks
switching should be also mentioned: the size of the capacitor switched, the short circuit capacity at

16
the location where the capacitor is inserted, the power of the customer’s transformer and the
characteristics of the customer’s load [7]. It is also worth noting that high transient currents can
occur, reaching values superior to ten times the capacitor nominal current with duration of several
milliseconds [9]. Several parameters that can determine the maximum inrush current have been
analyzed in Ref. [10], such as: pole spread, the dumping resistor inserted in the current limiting
reactor, natural frequency and saturation of the current limiting reactor.
Some aspects regarding factors that influence the intensity of the transients were: load current
value during bank switching, the order in which the utility banks are switched, industry capacitor
size, localization of the utility banks along the feeder, pole spread during switching and
synchronization of capacitor switching. Finally, a comparison with real-life data recorded at the
distribution system has been performed in order to validate the present simulation [11].
VS = 100 V
f = 50 Hz
R1 = 10 Ohm R2 = 10 Ohm L1 = 10 mH
S1
C1 = 10 uF
S2
C2 = 10 uF
R3 = 10 O
hm
L2 = 10 m
H
Fig.3 Single line diagram of single phase simple test system [35]
Fig. 3 illustrates the single line diagram of single phase test system for switching transient over
voltages. In this figure, a simple network has been provided to evaluate the transient voltage due to
capacitor switching actions. Three cases are studies in this regard. In the first case, we consider that
corresponding C1 switch named, S1 located at that branch is closing while the second capacitor's
switch, S2, is open. In the second case, the closing of the switch S1 while the switch S2 was closed is
considered. The last case considers the same scenario in which switch S2 is going to be closed with

17
switch S1 already shut. These case studies are provided to model the switched capacitor in line with
fixed capacitor operations.
Case 1:
The equations for the current and voltage in the capacitor C1 during the closing of the switch S1 in
Fig. 3, with switch S2 open, are given, respectively, by [32]:
)15( 1 1 1( ) [ (0)] ( )C CV t V V V Cos t
)16( 1 11
( ) ( )CVI t Sin tZ
where, 1 1
11 L C
is the natural frequency; 1(0)CV initial voltage of C1; V, switch voltage when S1 is
closed and 1
11LCZ is the surge impedance.
Case 2:
In the second case, closing of the switch S1, with switch S2 already shut, the associated voltage on
the remote capacitor C2 could be extracted as follows:
)17( 2 1 2[1 ( ) ( )]CV V A Cos t B Cos t
in which:
4 2 2
1 2 1 2 1 2
2 1 2 1 2 1
1
2 12 2 2 2 2 2
A
4 2 2
1 2 1 2 1 2
2 1 2 1 2 1
1
2 12 2 2 2 2 2
B
22 2 2 2
2 21 2 1 21 1 22 2 2 2
,
22 2 2 22 21 2 1 2
2 1 22 2 2 2
2
11
CC
2
2 2
1L C
11 1
1L C

18
The amplified voltage at the remote capacitor is composed of three components: the source
voltage and two oscillatory components 1 and 2 . This phenomenon is known as amplification of
the voltage and should be considered in the switching actions. In two L-C loop systems, the
maximum transient overvoltage component is found to occur when the natural frequency of each L-
C loop is the same.
Case 3:
The closing of switch S2, with switch S1 already shut, is considered in this case. In such case, any
difference of potential between the two banks is eliminated by a redistribution of load. The
equalizing current that flows in the inductance L2, is given by [36].
)18( 1 2(0)
2 21 2
21 2
( )CC
V VI Sin t
C CLC C
where
2
1 22
1 2
1
C CLC C
In which, 2(0)CV , is the initial voltage C2; and 2 is the capacitor switching transient results from
the energy exchanged between the inductive and capacitive elements in the circuit.
It is worth mentioning that in the radial distribution networks, the resistance of distribution
feeders is considerable. Hence, the overvoltage calculation due to switching of capacitor banks
would be rogueries. Moreover, the number of feeders of a real distribution networks are remarkable
and the calculation of switching transients would be a time consuming process. To alleviate the
computational burden, the overvoltage calculations have been performed with computer based
packages. One of available commercial package to calculate transients in power systems is the
Electromagnetic Transient Program (EMTP). The EMTP package has this ability to simulate large

19
scale power systems and could analyze the steady state as well as transient studies. In the recent
versions of this package, EMTP-RV for the power flow analysis is available as an option. In order
to verify the simulation results of capacitor switching in a simple network, a two-capacitor single
phase test system has been addressed in Ref. [35].
In order to verify the switching over voltage in EMTP-RV with the classical ATP package, there
is a need for a suitable baseline for comparison. This baseline is provided by performing manual
calculations from first principles.
Transient modeling is conducted by closing the switch to capacitor C2, switch S1 is closed. The
ATP and EMTP-RV time domain simulation results of this test system are addressed in Fig. 4 and
Fig 5, respectively. As the simulation results are identical, therefore the simulation procedure with
the EMTP-RV package is valid.
Fig. 4 The worst case capacitor switching at peak voltage (ATP) [35]

20
Fig. 5 The worst case capacitor switching at peak voltage (EMTP-RV)
As mentioned before, one of the key issues in the maximum transient overvoltage due to
capacitor switching is the location of these compensators. The size of capacitors also has a critical
impact on the overvoltages' natural frequency. At the operation horizon, the initial voltage of
capacitors, VC(0), may result in the amplified over voltages during switching actions. As reported in
the literature, the worse conditions for capacitor switching would take place when the initial voltage
of a capacitor is at the peak voltage and the closing switch in the reverse peak voltage. Fig. 6 shows
three switching actions in which the initial voltages of capacitor bank are different. Besides, the
flowchart depicted in Fig. 7 includes the procedure of solving the proposed problem in detail.
0 2 4 6 8 10 12 14 16 18 20-150
-100
-50
0
50
100
150
Time (ms)
Vol
tage
(V)
Source VoltageC2 Voltage
(a)

21
0 2 4 6 8 10 12 14 16 18 20-120
-80
-40
0
40
80
120
Time (ms)
Vol
tage
(V)
Source VoltageC2 Voltage
(b)
0 2 4 6 8 10 12 14 16 18 20-120
-60
0
60
120
180
240
Time (ms)
Vol
tage
(V)
Source VoltageC2 Voltage
(c)
Fig.6 Capacitor switching at peak voltage (EMTP-RV) Case (a): Vc(0)=0, Case (b): Vc(0)=+Vmax , Case (c): Vc(0)=- Vmax

22
Available Network Data Candidate Capacitors’ Data
Preparing Network for Analysis
It = 1
Capacitor Placement Based on Integer Mapping
Evaluation (F1) Evaluation (F2)
Evaluate Capacitor Placement Cost < Budget
Classic Power Flow (Bus Voltage, Power Losses, etc)
Calculate Total Loss
(Power Losses)
Harmonic Power Flow
Determination of THDMax
Evaluate (F1) and (F2)
Impl
emen
t Loc
al S
earc
h
Determine Pareto Front
It < ItMax No
Yes
Optimal Pareto Front
Augmented NSGA-II with Local Search
Decision Making Based on Maximum Transient Overvoltage
Fig.7 The flowchart of the proposed framework.
6. Simulation Results The proposed multi-objective capacitor placement method has been applied to the 9-bus and 85-bus
radial test systems. In both case studies the capacitor placement candidate nodes were fixed based

23
on the pre-planning studies. It should be noted that he proposed model has the ability to find the
best location due to the introduced mapping procedure. Even if the candidate buses to install
capacitors are pre-determined, the places of the capacitors are the variables of the problem. In fact,
the selection of some candidate buses only limits the research space to a lower number of candidate
buses to consider for the installation of capacitors. But, not all these candidate buses will be selected
for the installation of capacitors by the proposed method. It should be noted that, taking into
account selected candidate buses is common due to the fact that, in the real-world some buses may
not have the minimum requirements of installing capacitors, such as enough space. Therefore, these
buses should be eliminated from the space search of the optimization problem. It is considered that
the locations for candidate capacitors are the same as in the literature [25, 26, 37, 38]. In order to
compare the methodology for evaluating optimal capacity placement problem, it is necessary to
perform distribution power flow for each capacity placement plan. At the first step, the distribution
system without the presence of fixed capacitors should be analyzed and the obtained results should
be checked. In this study, the base case test system, in which the distribution system without fixed
capacitors is considered, has been evaluated and the same results have been obtained as reported in
Refs. [25, 26, 37]. This step confirms that the distribution power flow adopted in this study can
overcome the radial features due to the resistance to reactance ratio (R/X). In this test system, the
active and reactive loads are 12.368 MW and 4.186 MVAr, respectively. So, it is necessary to
manage the total reactive injection due to the capacitor placement. To do so, the maximum
capacitor size has been limited to 4050 kVAr in Refs. [25, 26, 37]. The life cycle for capacitors is
considered to be 10 years and the maintenance and running costs are considered to be zero [25]. It is
worth mentioning that the capacitor placement problem in such studies has been performed for one
year the same as this study. In the aforementioned studies, the authors carried out the capacitor
placement for pre-determined locations, i.e. buses 4, 5 and 9 [25, 26, 37]. Moreover, in Ref. [37] the
authors have performed a sensitivity analysis for determining optimal locations of capacitor banks.

24
However, the simulation results illustrated that almost all buses needs reactive compensation and
the operator needs to install 9 MVAr, but this amount is about two times greater than the reactive
loads for end users. It seems that it is necessary to limit the total reactive compensation considering
the total investment costs of capacitor banks. The first test system is considered to compare the
results obtained by the proposed NSGA-II augmented by local search technique with the single
objective model as reported in [26] and [37]. The second test system is a large scale radial network
with laterals to confirm this fact that the proposed model could overcome the convergence
challenge in large scale power distribution networks.
A. 9-bus test system
The first test system is a radial distribution feeder with nine load busses and its nominal
substation transformer is rated at 15 MVA, 23 kV with impedance of (0.5+j5) pu. It is desired to
find the optimal values of three capacitors sizes to be placed at buses 4, 5 and 9. Kp was selected to
be 168 $/kW [39, 40], and the limits on the rms voltages have been selected to be Vmin = 0.9 pu, and
Vmax = 1.1 pu. It is worth noting that the data related to the yearly cost of fixed capacitors are
provided in Ref. [26] while as reported in this reference, it is assumed that the substation voltage
contains 4% and 3% of 5-th and 7-th harmonic, respectively, resulting in a total harmonic distortion
of 5%. These harmonics orders are the most significant harmonics existing in distribution voltages
besides the triplen (zero sequence) harmonics. It has been decided that the largest capacitor size
maxcQ should not exceed the total reactive load, i.e., 4186 kVAr. In this study the loads have been
modeled as PQ loads.
The maximum number of capacitors are 27 possible capacitor sizes while the related data along
their corresponding annual cost/kVAr are available in Ref. [25].
The simulation results in the same case have been confirmed by implementing the proposed
power flow technique by using MATPOWER package.

25
The results reported in Ref. [25]. have been evaluated to validate the harmonic power flow
equations in the presence of the mentioned capacitor banks. As can be seen in Table 2, the obtained
results (A0) are in accordance with Ref. [25]. Having taken into consideration the significance of
the power quality issues in electric power systems, the maximum THD (THDmax) has been assigned
to be equal to 5%. Moreover, a constraint has been assigned to the problem to limit the investment
costs relating to the capacitor installation. In this respect, two different case studies have been
considered where the maximum permitted investment cost are assigned to be 900 ($) and 1000 ($),
respectively. It is worth noting that all data relating to the capacitor banks for a year, taking into
account the investment considerations, life time as well as the operation and management costs are
available in Ref. [25]. Assuming constant load demand over all hours of a year, the power loss can
be multiplied by the number of hours in a year and the respective cost ($/kWh) to calculate the
annual energy cost. As can be observed from Table 2, the results obtained including the investment
limitation (Plan group B) are better in terms of THDmax and power losses if compared to the base
case (A0). Besides, plan B1 is better in comparison with Plan A0 both from the THDmax and the
capacity of capacitors viewpoints. Also, plan B2 dominates plan A0, since it has less power losses
(about 73 kW) making it justifiable, although the installed capacity is the same as A0 and the
investment cost is higher by 1.5 ($). In plan group C, the limitation of the investment cost has been
assigned 1000 ($) leading to six plans, C1-C6. In this regard, the lower loss is equal to 723.999
(kW) in plan C1 and the lower THDmax relates to Plan C2 and it is equal to 4.45. The capacity of
capacitors varies from 5100 (kVAr) to 5400 (kVAr). Taking into consideration the close obtained
results, the next step would be evaluating the transient overvoltages to pick up the best compromise
solution amongst the derived solutions. Fig. 8 shows the voltage profile in different buses before
and after installing the capacitors for the best compromise plan.
Based on the reported cases in Ref. [26], the maximum allowed THDmax for voltage at the load
buses has been considered to be below 8% and 5%. In the multi-objective framework, only the

26
under 5% of THDmax can be seen and another plan has been dominated. The simulation results for
multi-objective evaluation of functions are reported in Table 2 including both THDmax and power
losses in the presence of optimum capacitor placement for each member of Pareto solutions. Fig. 8
illustrates the voltage profile of 9-bus test system for these Pareto solutions.
Table 2. Pareto front of capacitor placement in 9-bus test system
Plan c 9Q(kVAr)
c 5Q(kVAr)
c 4Q(kVAr)
Power Losses (kW)
THDmax Total_Cap
(kVAr) Total_Inv
($)
A0 2100 0 2850 822.581 4.918 4950 891.150 Ref. [25] B1 0 3000 1650 743.812 4.680 4650 858.150 Investment Cost
Constraint=900 ($)
B2 0 3300 1650 749.507 4.651 4950 892.650
C1 1200 2550 1500 723.999 4.709 5250 987.450 Investment Cost Constraint=1000
($) C2 900 2400 2100 770.128 4.450 5400 942.300 C3 1200 2400 1800 743.276 4.459 5400 948.600 C4 450 3300 1500 738.202 4.460 5250 989.550 C5 600 3000 1500 732.053 4.671 5100 973.500 C6 900 2850 1500 729.156 4.681 5250 987.750
0 1 2 3 4 5 6 7 8 90.86
0.88
0.90
0.92
0.94
0.96
0.98
1.00
Bus Number
Vol
tage
(pu)
A0 B1 B2 C1 C2 C3 C4 C5 C6 Base
Fig. 8 Voltage profile of 9-bus test system
After the determination of the Pareto set, in the decision making stage, the severe transient over
voltage should be evaluated to attain the minimum over voltage in the executive plan. In order to
perform the transient simulation study, the EMTP-RV package has been applied. The severe
condition for transient over voltage has been addressed in the Section V.

27
The time domain simulation results for the worst case and the best case are provided in Figs. 9
and 10, respectively. In these figures, the capacitor banks switching has been performed for
different initial voltage stored in capacitors, because the amount of the stored charges in capacitors
are unknown. It is worth mentioning that these results are obtained corresponding to three different
states depicted in Fig. 6. In such circumstances, in order to consider the severe conditions, the
switching actions for all installed capacitor have been applied at the same time.
0 0.01 0.02 0.03 0.04 0.05 0.06 0.07 0.08 0.09 0.1-50
0
50
Vol
tage
(kV
) Three Phase Voltage at Bus 9
0 0.01 0.02 0.03 0.04 0.05 0.06 0.07 0.08 0.09 0.1-50
0
50
Vol
tage
(kV
) Three Phase Voltage at Bus 5
0 0.01 0.02 0.03 0.04 0.05 0.06 0.07 0.08 0.09 0.1-50
0
50
Time (s)
Vol
tage
(kV
) Three Phase Voltage at Bus 4
Fig. 9 Maximum transient over voltage due to capacitor placement (Plan C6)
The simulation results claim that the maximum over voltages would exactly occur at the location
of the installed capacitor banks. The main reason of this issue is X/R ratio of distribution networks.
The resistance of distribution feeders is greater than those for transmission lines. Therefore, the
damping criterion of overvoltage for distribution networks is considerable. Moreover, the large
amounts of low voltage loads are residential and commercial and the percentages of industrial loads
are negligible. As a result, the presence of multiple capacitor banks in a radial network, the transient
overvoltage due to simultaneous capacitor switching would be considerable.
28
0 0.01 0.02 0.03 0.04 0.05 0.06 0.07 0.08 0.09 0.1-50
0
50
Vol
tage
(kV
)
Three Phase Voltage at Bus 9
0 0.01 0.02 0.03 0.04 0.05 0.06 0.07 0.08 0.09 0.1-50
0
50
Vol
tage
(kV
)Three Phase Voltage at Bus 5
0 0.01 0.02 0.03 0.04 0.05 0.06 0.07 0.08 0.09 0.1-50
0
50
Time (s)
Vol
tage
(kV
)
Three Phase Voltage at Bus 4
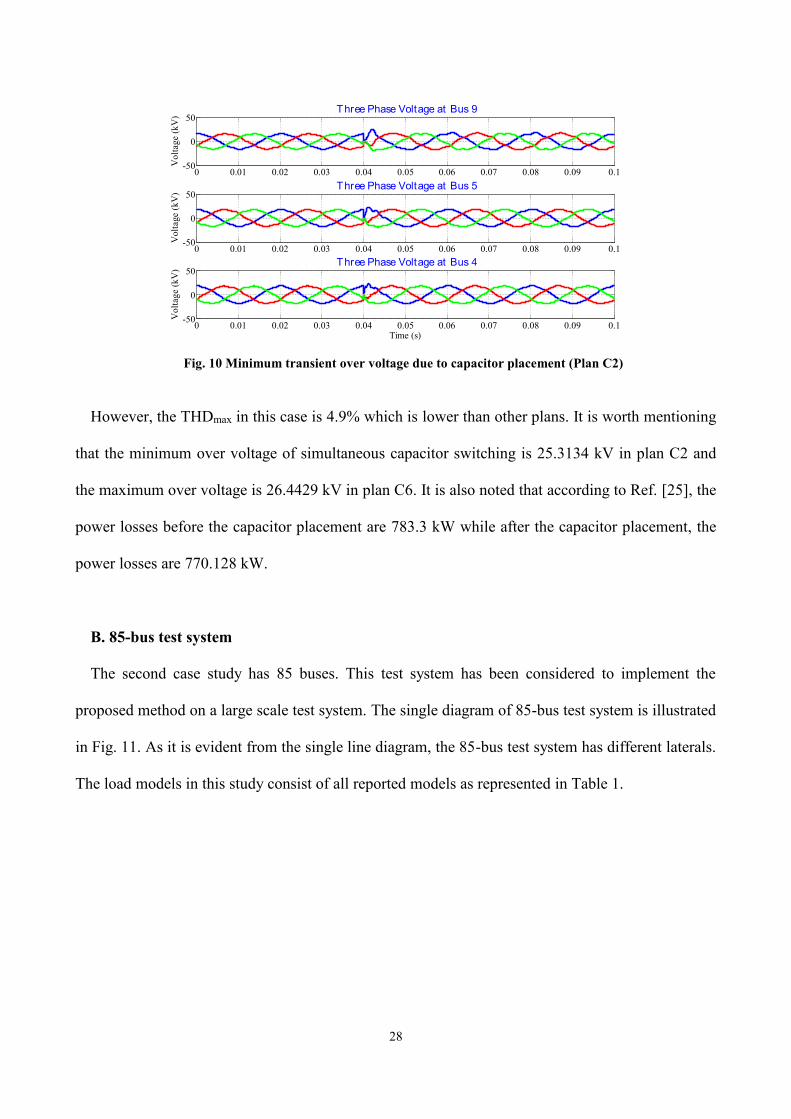
Fig. 10 Minimum transient over voltage due to capacitor placement (Plan C2)
However, the THDmax in this case is 4.9% which is lower than other plans. It is worth mentioning
that the minimum over voltage of simultaneous capacitor switching is 25.3134 kV in plan C2 and
the maximum over voltage is 26.4429 kV in plan C6. It is also noted that according to Ref. [25], the
power losses before the capacitor placement are 783.3 kW while after the capacitor placement, the
power losses are 770.128 kW.
B. 85-bus test system
The second case study has 85 buses. This test system has been considered to implement the
proposed method on a large scale test system. The single diagram of 85-bus test system is illustrated
in Fig. 11. As it is evident from the single line diagram, the 85-bus test system has different laterals.
The load models in this study consist of all reported models as represented in Table 1.

29
Fig. 11 Single line diagram of 85-bus test system [41]
Commercially-available capacitor sizes in this case are the same as the ones considered in the
previous case study while the branch data have been reported in Ref. [41]. The hourly net demand
(hourly load) and the injected power from the grid (the load demand plus the power losses) for this
test system is provided in Fig 12.
The difference between the generation and demand represents the hourly power losses. The limits
on the rms voltages have been selected to be Vmin = 0.9 pu, and Vmax = 1.1 pu. One of the key
features considered in this case study is to take into consideration the peak seasonal loads. As the
capacitor placement in distribution networks is a long-term planning issue and on the other hand,
the operation of such compensating devices depends upon the short-term operation of power
systems, it is necessary to perform the simulations at the severe operational conditions.

30
30
40
50
60
70
1 3 5 7 9 11 13 15 17 19 21 23
Hour (h)
Pow
er (M
W)
Hourly Load Generation (MW)
Fig. 12 Demand and generation power trends for daily peak load
It is desired to find the optimal values of three capacitor sizes (k = 7) to be placed at buses 7, 8, 9,
29, 34, 58 and 60. The capacitor sizes and the cost per unit of the power losses are the same as the
previous case study. Consequently it is needed to evaluate the 27 integer decision variables and also
the associated local search technique should be applied in NSGA-II to determine the best Pareto
optima. However, the candidate locations are greater than the 9-bus test system but the mapping
procedure is the same as the one mentioned above. The Pareto front for this test system includes 9
Pareto solutions (plans).

31
4.77 4.78 4.79 4.80 4.81 4.82 4.83151.5
152.0
152.5
153.0
153.5
154.0
154.5
155.0
155.5
THDmax(%)
Pow
er L
oss
(kW
)
Pareto front
Fig. 13 Optimal Pareto Front for the 85-Bus Test System
Fig. 13 illustrates the Pareto front related to the 85-bus test system capacity placement. In this test
system, the maximum allowed THD is limited to be below 5% and the maximum investment cost
limited to be lower than 700 ($/year). Therefore, only 9 plans remain for transient overvoltage
evaluations.
Since the final plans are limited to 9 plans, it is necessary to perform 24 simulations based on
hourly trends of loads. The demand includes the industrial, commercial and residential loads and
each of them has different types of load model mentioned in Table 1.
Table 4. Selected Plans Based on THDmax=5% and Associated Maximum Transient Over Voltage
Occurrence Time (h)
Occurrence Location (Bus)
Maximum Over Voltage (kV) Plan
13 8 26.54 1 12 60 27.24 2 14 8 25.65 3 15 60 27.03 4 10 60 26.67 5 21 9 26.13 6 22 9 26.10 7 23 34 25.89 8 24 34 25.71 9

32
Table 4 addresses the maximum overvoltages due to capacitor switching and associated
occurrence intervals. Simulation results show that plan 3 has the lowest maximum overvoltage due
to capacitor switching and the maximum overvoltage of 25.65 kV happens at hour 14. It is worth
mentioning that the rated voltage of this test system is 20 kV. The voltage profile of the system for
different plans has been depicted in Fig. 14. According to Ref.[42], the power losses before
placement of the capacitors are 315.714 kW, while after placement of the capacitors, the power
losses are 153.2 kW.
5 10 15 20 25 30 35 40 45 50 55 60 65 70 75 80 850.88
0.90
0.92
0.94
0.96
0.98
1.00
Bus Number
Vol
tage
(pu)
Set 1 Set 2 Set 3 Set 4 Set 5 Set 6 Set 7 Set 8 Set 9 Base
Fig. 14 Voltage profile of 85-bus test system
a. Discussion
As general results, the following observations can be considered:
1- The maximum overvoltages occur at hours with peak load demand.
2- The buses at which the overvoltage occurs include the inductive loads as well as the induction
machines such as buses 8 and 60.

33
3- It is noted that fluorescent lighting load (at Bus 10) can impact the overvoltage during
capacitor switching, such as the one observed at Bus 9 at hour 21 and 22.
With respect to this fact the first stage decision variables are binary and also the limited number of
states, applying other heuristic optimization methods, such as Multi-objective Particle Swarm
Optimization (MOPSO) may lead to the same results as NSGA-II. In addition, it is noted that the
sub-problems solutions for THD calculation, load flow and the associated capital cost are all
deterministic. Therefore, these items would not affect the outputs of the sub-problem of the
optimization level as well as the transient overvoltage evaluation. In brief, it can be stated that the
decision vector at the first stage results in the unique solution which is deterministic.
7. Conclusion This paper provides a new approach in capacitor placement in radial distribution network aiming
to reduce power losses and ensure the total harmonic distortion maintaining the power quality
issues. Moreover, in this study we considered the transient overvoltage criterion due to capacitor
switching in the network. This criterion has been modeled as a decision making support technique
to select the best plan from the optimal Pareto front provided by the modified NSGA-II. The
addressed NSGA-II in this research was augmented with the local search technique to improve the
convergence time and accelerate the problem evaluation. In the proposed method, we adopted the
local search for sizing part of chromosomes of NSGA-II. The addressed technique could be
implemented in other discrete-variables optimization problems such as generation and transmission
expansion planning problems. The simulation results in the case studies confirmed that with the
presence of multiple capacitor banks in a radial network, the transient overvoltage due to
simultaneous capacitor switching would be considerable. Moreover, in multiple capacitor
placements, the rising transient overvoltage in switching of each capacitor bank is greater than those
one for a centralized capacitor with the same capacitor located at a same node.

34
Acknowledgment J.P.S. Catalão acknowledges the support by FEDER funds through COMPETE 2020 and by
Portuguese funds through FCT, under Projects SAICT-PAC/0004/2015 - POCI-01-0145-FEDER-
016434, POCI-01-0145-FEDER-006961, UID/EEA/50014/2013, UID/CEC/50021/2013, and
UID/EMS/00151/2013, and also funding from the EU 7th Framework Programme FP7/2007-2013
under GA no. 309048.
References [1] Sayed AG, Youssef HKM. Optimal sizing of fixed capacitor banks placed on a distorted
interconnected distribution networks by Genetic Algorithms. Computational Technologies in
Electrical and Electronics Engineering, 2008 SIBIRCON 2008 IEEE Region 8 International
Conference on2008. p. 180-5.
[2] Kalyuzhny A, Levitin G, Elmakis D, Ben-Haim H. System approach to shunt capacitor
allocation in radial distribution systems. Electric Power Systems Research. 2000;56:51-60.
[3] Levitin G, Kalyuzhny A, Shenkman A, Chertkov M. Optimal capacitor allocation in distribution
systems using a genetic algorithm and a fast energy loss computation technique. IEEE Transactions
on Power Delivery. 2000;15:623-8.
[4] Ware J. Power Factor Correction. IEE Wiring Matters. 2006:22-4.
[5] Schultz AJ, Johnson IB, Schultz NR. Magnification of switching surges. Electrical Engineering.
1959;78:811-.
[6] Ramasamy N. Power Systems Capacitors. New York: Taylor & Francis; 2005.
[7] McGranaghan MF, Zavadil RM, Hensley G, Singh T, Samotyj M. Impact of utility switched
capacitors on customer systems-magnification at low voltage capacitors. IEEE Transactions on
Power Delivery. 1992;7:862-8.
35
[8] Das JC. Analysis and control of large-shunt-capacitor-bank switching transients. IEEE
Transactions on Industry Applications. 2005;41:1444-51.
[9] Olivier G, Mougharbel I, Dobson-Mack G. Minimal transient switching of capacitors. IEEE
Transactions on Power Delivery. 1993;8:1988-94.
[10] Aradhya RS, Subash S, Meera KS. Evaluation of switching concerns related to shunt capacitor
bank installations. International Conference on Power System Transients. London1995.
[11] Coury DV, dos Santos CuJ, Oleskovicz Mr, Tavares MC. Transient analysis concerning
capacitor bank switching in a distribution system. Electric Power Systems Research. 2003;65:13-21.
[12] El-Ela AAA, El-Sehiemy RA, Kinawy AM, Mouwafi MT. Optimal capacitor placement in
distribution systems for power loss reduction and voltage profile improvement. IET Generation,
Transmission & Distribution. 2016;10:1209-21.
[13] Abdelaziz AY, Ali ES, Abd Elazim SM. Flower Pollination Algorithm and Loss Sensitivity
Factors for optimal sizing and placement of capacitors in radial distribution systems. International
Journal of Electrical Power & Energy Systems. 2016;78:207-14.
[14] Ali ES, Abd Elazim SM, Abdelaziz AY. Improved Harmony Algorithm and Power Loss Index
for optimal locations and sizing of capacitors in radial distribution systems. International Journal of
Electrical Power & Energy Systems. 2016;80:252-63.
[15] Huang SJ, Liu XZ. A Plant Growth-Based Optimization Approach Applied to Capacitor
Placement in Power Systems. IEEE Transactions on Power Systems. 2012;27:2138-45.
[16] Othman AM. Optimal capacitor placement by Enhanced Bacterial Foraging Optimization
(EBFO) with accurate thermal re-rating of critical cables. Electric Power Systems Research.
2016;140:671-80.
[17] Vuletić J, Todorovski M. Optimal capacitor placement in distorted distribution networks with
different load models using Penalty Free Genetic Algorithm. International Journal of Electrical
Power & Energy Systems. 2016;78:174-82.
36
[18] Soroudi A, Amraee T. Decision making under uncertainty in energy systems: State of the art.
Renewable and Sustainable Energy Reviews. 2013;28:376-84.
[19] Eminoglu U, Hocaoglu MH. A new power flow method for radial distribution systems
including voltage dependent load models. Electric Power Systems Research. 2005;76:106-14.
[20] Taylor CW. Power System Voltage Stability: McGraw-Hill; 1994.
[21] Cutsem TV, Vournas CD. Voltage Stability of Electric Power Systems. Kluwer1998.
[22] Dous GL. Voltage Stability in Power Systems. Load Modeling Based on 130 kV Field
Measurements. Goteborg, Sweden: Department of Electrical Power Engineering, Chalmers
University of Technology; 1999.
[23] Eminoglu U, Hocaoglu MH. A new power flow method for radial distribution systems
including voltage dependent load models. Electric Power Systems Research. 2005;76:106-14.
[24] Bortignon GA, El-Hawary ME. A review of capacitor placement techniques for loss reduction
in primary feeders on distribution systems. Electrical and Computer Engineering, 1995 Canadian
Conference on1995. p. 684-7 vol.2.
[25] Baghzouz Y, Ertem S. Shunt capacitor sizing for radial distribution feeders with distorted
substation voltages. IEEE Transactions on Power Delivery. 1990;5:650-7.
[26] Khalil TM, Youssef HKM, Abdelaziz MM. Optimal Capacitor Placement on Radial
Distribution Feeders in Presence of Nonlinear Loads using Binary Particle Swarm Optimization.
19th International Conference on Electricity Distribution (CIRED 2007). Vienna2007. p. Paper 180.
[27] Deb K, Pratap A, Agarwal S, Meyarivan T. A fast and elitist multiobjective genetic algorithm:
NSGA-II. IEEE Trans Evolut Comput. 2002;6:182-97.
[28] Pires DF, Antunes CH, Martins AG. NSGA-II with local search for a multi-objective reactive
power compensation problem. International Journal of Electrical Power & Energy Systems.
2012;43:313-24.
[29] Deb K. Multi-Objective Optimization Using Evolutionary Algorithms. NewYork: Wiley; 2003.
37
[30] Soroudi A, Afrasiab M. Binary PSO-based dynamic multi-objective model for distributed
generation planning under uncertainty. IET Renew Power Gener. 2012;6:67-78.
[31] Debnath D, De A, Chakrabarti A, Kothari DP. Studies on the impact of capacitor bank
switching on grid connected transformers. International Journal of Electrical Power & Energy
Systems. 2012;43:126-30.
[32] Greenwood A. Electrical Transients in Power Systems: John Wiley & Sons; 1991.
[33] Grebe T. Application of distribution system capacitor banks and their impact on power quality.
IEEE Transactions on Industry Applications. 1996;32:714-9.
[34] Witte JF, DeCesaro FP, Mendis SR. Damaging long-term overvoltages on industrial capacitor
banks due to transformer energization inrush currents. IEEE Transactions on Industry Applications.
1994;30:1107-15.
[35] Cran A. Investigation into harmonics and switching transients at substations equipped with
Capacitor banks using ATP software. 2000.
[36] Sickle RCV, Zaborszky J. Capacitor switching phenomena. Electrical Engineering.
1952;71:126-.
[37] Khalil TM, Youssef HKM, Aziz MMA. A Binary Particle Swarm Optimization for Optimal
Placement and Sizing of Capacitor Banks in Radial Distribution Feeders with Distorted Substation
Voltages. AIML 06 International Conference. Sharm El Sheikh, Egypt2006. p. 129-35.
[38] Ameli K, Alfi A, Aghaebrahimi M. A fuzzy discrete harmony search algorithm applied to
annual cost reduction in radial distribution systems. Engineering Optimization. 2016;48:1529-49.
[39] Grainger JJ, Lee SH. Optimum Size and Location of Shunt Capacitors for Reduction of Losses
on Distribution Feeders. IEEE Transactions on Power Apparatus and Systems. 1981;PAS-
100:1105-18.

38
[40] Ramadan HA, Wahab MAA, El-Sayed A-HM, Hamada MM. A fuzzy-based approach for
optimal allocation and sizing of capacitor banks. Electric Power Systems Research. 2014;106:232-
40.
[41] Das D, Kothari DP, Kalam A. Simple and efficient method for load flow solution of radial
distribution networks. International Journal of Electrical Power & Energy Systems. 1995;17:335-
46.
[42] Rao RS, Narasimham SVL, Ramalingaraju M. Optimal capacitor placement in a radial
distribution system using Plant Growth Simulation Algorithm. International Journal of Electrical
Power & Energy Systems. 2011;33:1133-9.