a commercial tilapia, tilapia moaaambica, hatchery … · 2004-05-13 · a commercial tilapia,...
TRANSCRIPT
A Commercial Tilapia, Tilapia moaaambica, Hatchery for Hawaiian Skipjack Tuna, Katauwonua peEamia,
Fishery-Cost Analysis and Problematical Study BRUCE L. CRUMLEY’
ABSTRACT
The Hawaiian ekipjack tuna fldwrman #pendl a god part of hi. time catching nehu. Stolephonu purpureua, for bait initead of fiihing. Thia p a p r coniiden pond-ra id tilapia, nlupia momwnbica, as a possible alternative bait, and net. forth inlomation about a commercial tilapia production plant. If the nohermen purchased tilapia and fiahed full time, their bait would cost less than it does now, since the current breakaven cost to the fiiherman of a bucket of nehu is determined to be $30.12, while the higheat coit wtimate for pond-reared tilapia is $17.66.
The catch ratm for tuna when udng nehu and tilapia as bait were studied. and found to be com- parable. Tilapia still need extensive trials a~ a bait species, however, and tilapia data need further scrutiny.
Tilapia characteristics. both favorable and unfavorable. are discussed and should offer some in- sight Into the problem# and advantages of railing tilapia. The possibility of sharing the tilapia tanks with a compatible. marketable speciea, and thereby helping to defray expenses. are also discussed.
Fish diseases contracted during three different baitfish rearing studies are reviewed. along with their treatments.
INTRODUCTION
This paper seta forth information about a commercial tilapia. Tilapia nossambica, production plant, as far as what must be known and considered prior to the actual investment of cash. I investigated thie subject ae though this tilapia plant were being directed primarily to fur- nish tilapia for the local Hawaiian skipjack tuna, Kat- suwonu pelamis, industry, although a t the end of this paper I discuss possible alternative markets for tilapia and alternate uses of the production plant.
I began by studying the economic feaeibility of euch a production plant. Obviously, the figures used here will not apply in the future because of expected changes in price factors, but they provide a basis from which any in- terested individual or firm can derive information need- ed in considering euch a commercial enterprise. I also discuss differences between the currently used baitfish, nehu, Stolephoru purpureus, and tilapia, and examine their relative efficiencies as skipjack tuna live bait.
I discuss the type of tank construction which hae been used in the past and pointed out ways to facilitate such a plant’s operation.
BACKGROUND
The Hawaiian skipjack tuna fishery L a live-bait fishery with an average annual ex-vessel value in excess of $2 million. Annual landings average over 4 million kg
‘Southwest Fishenes Center, National Marine Fisheries Service. N O M , Honolulu, HI 96812
137 ReprlntSa &om U.8. Dep. Commer.. NOAA Tach. Rap. NMFS Cire. 408.
(9 million Ib), but fluctuate between 2 and 7 million kg (5 and 16 million Ib). Thie fluctuation is primarily due to:
1) availability of bait, 2) fragility of the bait, and 3) abundance and availability of the skipjack tuna.’
A possible solution to the problem of obtaining an adequate and dependable supply of baitfish would be for the fishermen to purchase bait, and to replace the time spent fishing for it (“baiting time”) with time devoted entirely to fishing for aku (“fishing time”). This ad- ditional fishing time could increase the annual catch by as much as 66% and provide an increaee in ex-vessel value of the catch by $1.9 million. Thie increase could oc- cur with the existing fleet. Any growth of the fleet would result in an accompanying increase in ex-venae1 value, since the skipjack tuna is underutilized (eee footnote 2).
The problem then, is to estimate the indirect cost that the fieherman is incumng and the amount of skipjack tuna he is not catching because of the time he is rpending baiting. This will give the eetimated maximum cost per bucket that the fisherman should be willing to pay for bait. Obviously, this assumes that he will buy bait offered a t a price that ia less than the coet he in incurring by catching the bait himself. Past experience has shown this not to be the case. In the future, however, increaeing
‘ U S . National Marine Fisheries Service. 1973. The tuna baitfish problem of Hawaii-an a.sessment and development of an action program. Unpubl. rep. prepared by Staff, Southwest Fiaheria Center, National Marine Fisheries Service. NOM, Honolulu, HI 96812. 33 D.
preeeure may be exerted upon the fisherman to use hie time more efficiently, abandoning the less efficient “traditional” ways that have hindered expansion of the commercial aku industry. Thia preeeure could come from:
1) changing fleet compit ion, with more modem ves- sels in the Anelaa claee being added, permitting longer trips and travel to better fishing grounda during the off-season (October-April) and, at the same time, increasing the demand for live bait; and
2) increased world demand for high protein foods aris- ing from a rapidly increasing population.
It is to the advantage of this study that the Anelo has worked with different types of baitfish. This could serve to encourage other fishermen to use species other than the nehu.
One additional point is that the crew size could be reduced without the need for added crew members to bait (see footnote 2).
I have employed the approach used by Shang and Iver- sen (1971) to determine the indirect cost of baitfish to the fishermen, relying heavily upon Hide et al. (1962) for their statistics. Previously unpublished data gathered by the State Fish and Game Division at the Honolulu Bait Station (HBS) were used in a present-day cost estimate for a commercial tilapia production facility.
AN ESTIMATE OF THE VALUE OF NEHU
A good cost estimate at today’s market prices is of prime importance in considering a commercial tilapia production plant. The cost estimate obtained in this paper is derived from prices effective as of 1 January 1974.
To determine the cost of nehu, the same problems pre- sent themselves here as they did to Shang and Iversen (1971), those of a vertically integrated system for fishing. Since no market exista for bait, the cost of nehu has been determined indirectly.
I have described an operation similar to that set forth in Shang and Iversen (1971) with 1973 prices for fuel, ice, and total catch. Because final figures are not yet available for the total days fished and days baited, cer- tain assumptions must be made. Using Shang and Iver- sen’s table 2, but with the new prices substituted:
Ccnt of Fiibinn and Baitinn Per TriD
Fiahinn Baitinr
Hours of operation’ 14 3-h day baiting 5-h traveling
T h e An&. a 26.6-m steel veasel. joined the Hawaiian skipjack tuna fishing fleet in December 1971. Unlike the remainder of the skipjack tuna fleet (about 12 veeuels). which consists of boats 17.8 Lo 24.5 m long with a bait-carrying capacity of only about 35 bucketa. the Anelo is capable of carrying 130 bucketa. The Anela also has greater fish-carrying capacity and greater range, and represents a new Iwk in the Hawaiian skipjack tuna hherv.
Fuel comumption 12.5 6 gaVh during ba i t iq
Riceoffuel pergallon $ 0.215 S 0.215 ( g a m 12.6 g a m during traveling
Rice of ice S17.5Oc - ~ __ ~ 0 - l colt $55.12 $16.66
a. Fishing: 10-h scouting-fishing and 4-h traveling time (botn waya). Baiting: 5-h traveling-about 2 h to Pearl Harbor. 8 h to Kaneohe
b. Baiting trip uses less time than fishing trip and allown for more leisure time. The value of leisure time of fishermen is not incorporated in the calculation.
Bay (both ways)
c. (14 x 12.5 x 10.215) + $17.50 = $55.12. d . 1 3 X 5 X $0.215) + (5 X 12 5 X $0.215) = $16.66
This shows that a fishing trip costa $38.46 more than a baiting trip. This must be taken into account when one is talking of increasing fishing time and reducing baiting time.
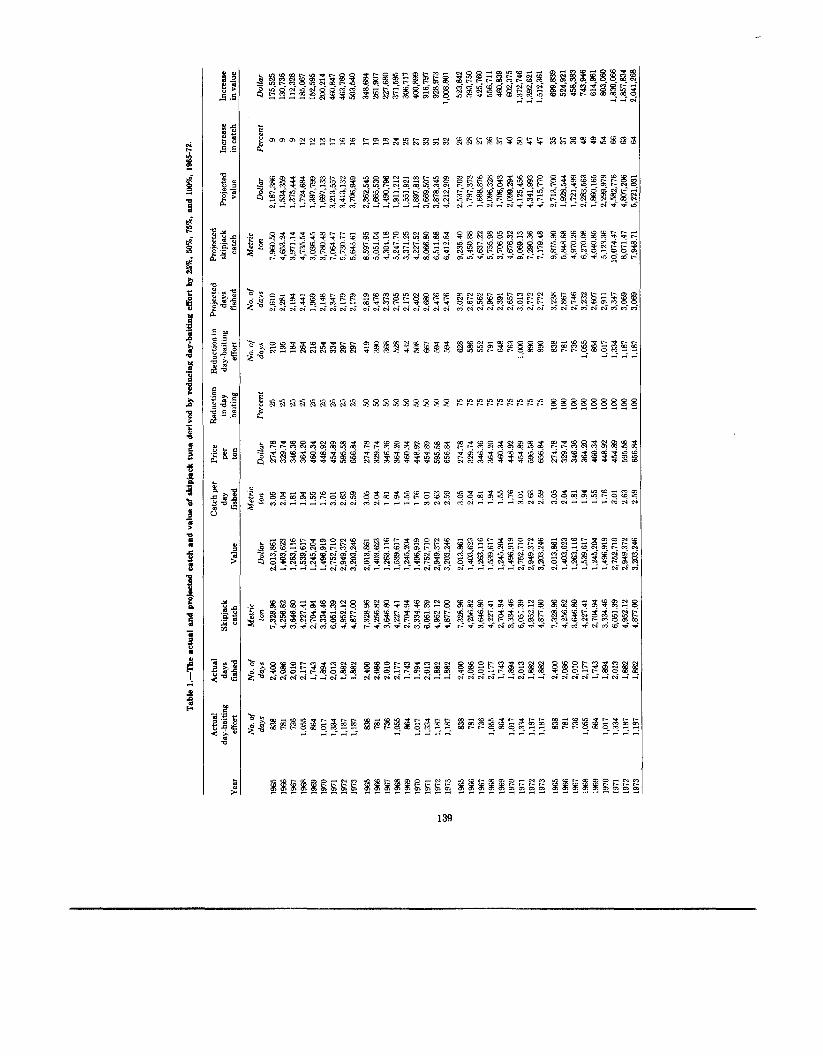
Referring to Table 1 we can see that the total skipjack tuna catch (in metric tons) did not vary much between 1972 and 1973. Ths actual day-baiting effort and actual days fished were assumed to remain relatively constant for these 2 yr, since the 1973 data for these two areas were not yet available. Shown are the effects of reductions in baiting effort by the amounts of 25%, 50%, 7596, and lc!o%.
Table 2 shows the number of buckets of nehu caught during day and night baiting. Since the number of buckets of bait caught in 1971 and 1972 did not fluctuate appreciably, an average for these 2 yr was used to es- timate the number of hurkets of bait caught in 1973.
38.786 buckets FLl:? buckets 75.499 buckets
hllcke‘s = 37,718 buckets of bait ,
Using Shang and Iversen’s (1971) formulas:
H, = H,) + E ,
and taking the values from Tables 1 and 2, the net oppor- tunity costs (C, , ) and the total amnunt of bait required ( H I ) (in buckets) were obtained. Dividing C,, by E, gives the break-eve11 price of nehu.
C , = $1.974.673.698 R, = 65,671 hurkets.
The break-even prire is $30.12 per bucket of bait. (See p. 145. for calrulations.)
138
139
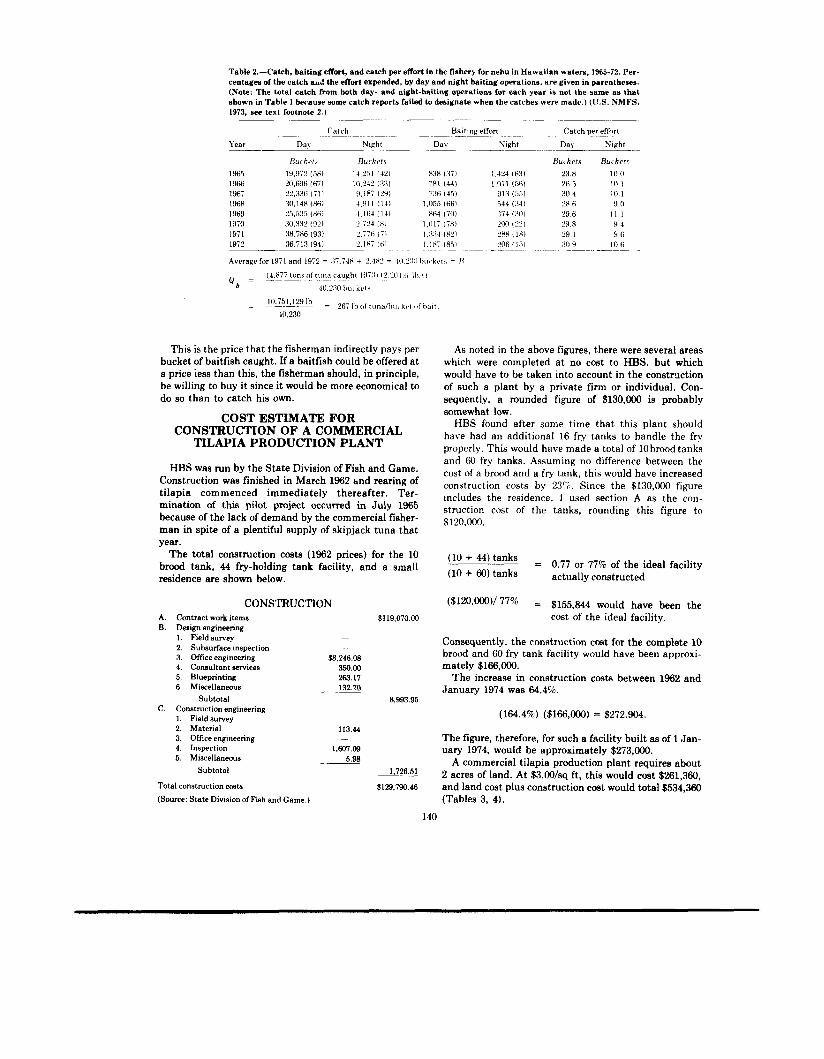
Table 2.-Catch. baiting effort, and catch per effort in the fishery for nehu in Hawaiian waters. 1965-72. Per- centages of the catch a d the effort expended, by day and night baiting operations. are given in parentheses. (Note: The total catch fiom both day- and night-baiting operations for each year is not the same a s that shown in Table 1 berause some catch reports failed to designate when the catches were made.) (17.5. NMFS, 1973. see text footnote 2.)
Catch per effort Da\ Nieht
~~~ -
Auckel.\ 1965 19.972 (.%I 1966: 20.696 (671 1967 22.336 1711 istin 30.148 1%) 1969 25.5:15 ( M i 19i0 30.33% (321 19il 3R.iXG (931 192 36.713 (94)
Buckets Bucket? 23.8 m i 26 5 10 I 30.4 10.1 %A 6 9.11 29.6 I I I 29.8 Y 1 29.1 9.6 ,IO 9 i n 6 ~- ~~~
This is the price that the fisherman indirectly pays per bucket of baitfish caught. If a baitfish could be offered at a price iess than this, the fisherman should, in principle, be willing to buy it since it would be more economical to do so than to catch his own.
As noted in the above figures, there were several areas which were completed a t no cost to HBS, but which would have to be taken into account in the construction of such a plant by a private firm or individual. Con- sequently, a rounded figure of $130,000 is probably somewhat low.
HBS found after some time that this plant should have had an additional 16 fry tanks to handle the fry properly. This would have made a total of 10 brood tanks and 60 fry tanks. Assuming no difference between the cost of a brood and a fry tank, this would have increased construction costs by 23c6, since the $130,000 figure
COST ESTIMATE FOR CONSTRUCTION OF A COMMERCIAL
TILAPIA PRODUCTION PLANT
HBS was run by the State Division Of Fish and Game' Construction was finished in March 1962 m d rearing of tilapia commenced immediately thereafter. Ter- includes the residence, 1 used section A as the coll- mination of this Pilot Project occurred in July 1965 struction cost of the tanks, rounding this figure to because of the lack of demand by the commercial fisher- man in spite of a plentiful supply of skipjack tuna that year.
The total construction costa (1962 prices) for the 10 brood tank, 44 fry-holding tank facility, and a small residence are shown below. (lo -+ tanks actually constructed
$120,000,
(lo + tanks = 0.77 or 77% of the ideal facility
CONSTRUCTION A. Contract work items B. Design engineering
1. Field survey - 2. Subsurface inspection - 3. Offce engineering $8,248.08 4. Consultant services 350.00 5. Blueprinting 263.17
132.70 6. Miscellaneous -__ Subtotal
C. Construction engineering 1. Field Survey -
3. Office engineering -
5. Miscellanwus 5.98
2. Material 113.44
4. Inspection 1.607.09
Subtotal
Total construction costs
(Source: State Division of Fish and Game.)
($120p000)/77% = $155,844 would have been the $119,070.00 cost of the ideal facility.
Consequently, the construction cost for the complete 10 brood and 60 fry tank facility would have been approxi- mately $166,000.
The increase in construction costa between 1962 and January 1974 was 64.4%.
8,993.95
(164.4%) ($166,000) = $272.904.
The figure, therefore, for such a facility built as of 1 Jan- uary 1974, would be approximately $273,000.
A commercial tilapia production plant requires about 2 acres of land. At $3.OO/sq ft, this would cost $261,360, and land cost plus construction cost would total $534,360 (Tables 3, 4).
1,726.51
$129,790.46
140
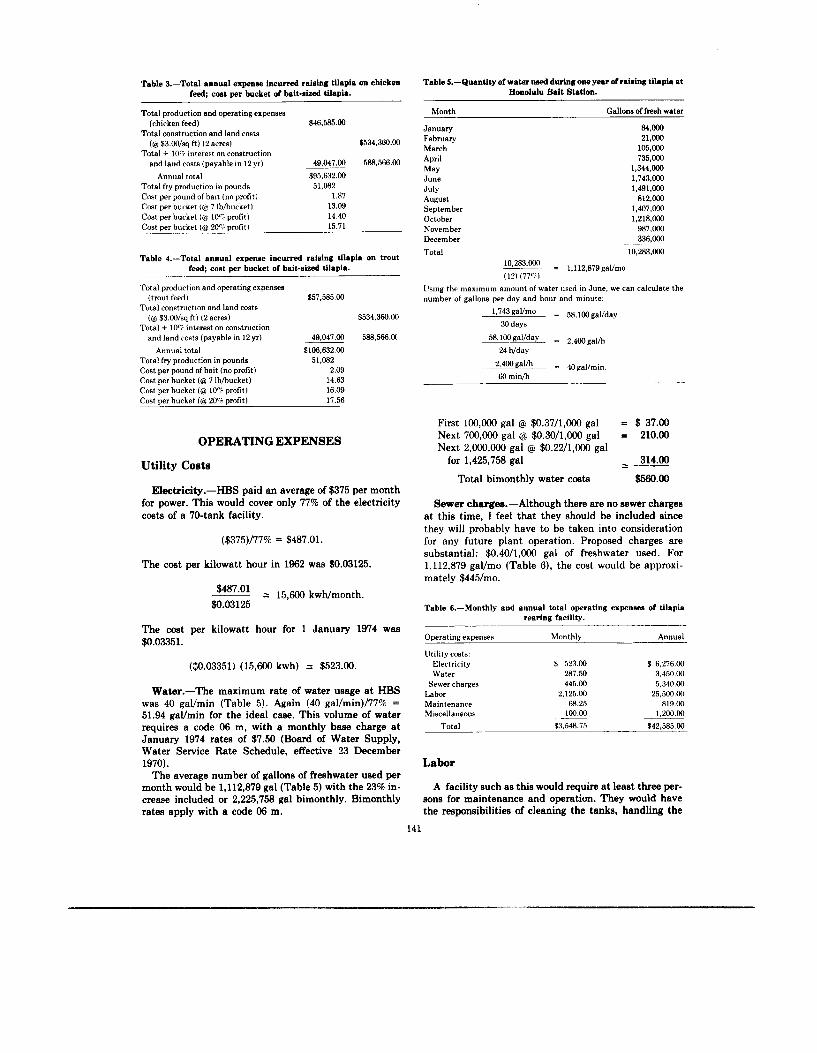
Table 3.-Total annual expenae incurred raising tilapia on chicken feed; coat per bucket of bait-sized tilapia.
Total production and operating expenses
Total construction and land costs
Total + lor; interest on construction
(chicken feed) $.16.585.00
(@ $3.00/sq St) (2 acres) $534,360.00
and land rosts (payable in 12 yr) 49,047.00 588.566.00 Annual total $95,632.00
1.87 13.09 14.40 15.71
Total fry production in pounds Cost per pound of bait (no profit) Cost per bucker (@ 7 lbhucketl Cost per bucket (@ IOc: profit) Cost per bucket (@ 20rF profit)
51,082
Table 4.-Total annual expense incurred raising tilapia on trout feed; cost per bucket of bait-sized tilapia.
Total productinn and operating expenses (trout Seed)
Total construction and land cnsts (@ $3.00/sq ft) (2 acres)
Total + loci interest on constructinn and land Costs (payable in 12 yr)
Annual total Total fry production in pounds Cost per pound of bait (no profit) Cost per bucket (@ 7 Ibhucket) Cost per bucket (@ lo? profit) Cost per bucket (@ 20% profit)
$57,585.00
$534,360.00
49.047.00 588,566.M $106.632.00
51.082 2.09
14.63 16.09 17.56
OPERATING EXPENSES
Utility Costs
Electricity.-HBS paid an average of $375 per month for power. This would cover only 77% of the electricity costs of a 70-tank facility.
($375)/77% = $487.01
The cost per kilowatt hour in 1962 was $0.03125.
$487'01 = 15,600 kwh/month. $0.03125
The cost per kilowatt hour for 1 January 1974 was $0.03351.
($0.03351) (15,600 kwh) = $523.00.
Water.-The maximum rate of water usage a t HBS was 40 gal/min (Table 5). Again (40 gal/min)/77% = 51.94 gaVmin for the ideal case. This volume of water requires a code 06 m, with a monthly base charge a t January 1974 rates of $7.50 (Board of Water Supply, Water Service Rate Schedule, effective 23 December 1970).
The average number of gallons of freshwater used per month would be 1,112,879 gal (Table 5) with the 23% in- crease included or 2,225,758 gal bimonthly. Bimonthly rates apply with a code 06 m.
Table 5.-Quantity of w a h used during one year of raising tilapia at Honolulu Bait Station.
Month
January February March April
June July August September October November December Total
May
Gallons of fresh water
84.000 21.000
105.000 735,000
1,344.000 1.743.000 1.491.000
812.000 1,407,MM 1,218,000
987,000 336,000
10,283,000 ____
~. 10,283*000 = 1,11~.879gai/mo (12) (77L;l
Using the maximum amnunt OS water used in June, we can calculate the number of gallons per day and hour and minute:
1*743 gal/mo = 58.100 gal/day 30 days
24 Wday
M) min/h
~ _ _ _ 58.100gal/day - - 2,4rngalh
2,400galh -~ = 40gal/min
First 100,000 gal @ $0.37/1,000 gal = $ 37.00 Next 700,000 gal @ $0.30/1,000 gal = 210.00 Next 2,000,000 gal @ $0.22/1,000 gal
314.00 -- - for 1,425,758 gal
Total bimonthly water costs w.00
Sewer chargee.-Although there are no sewer charges a t this time, I feel that they should be included since they will probably have to be taken into consideration for any future plant operation. Proposed charges are substantial: $0.40/1.000 gal of freshwater used. For 1,112,879 gal/mo (Table 6), the cost would be approxi- mately $445/mo.
Table 6.-Monthly and annual total operating expenses of tilapia rearing facility.
Operating expenses Mnnthly Annual
Utility costs: Electricity $ 523.00 $ 6,276.00 Water 287.50 3.450.00
Sewer charges 445.00 5,340.00 Labor 2.125.00 25.500.00 Maintenance fX25 819.00
1.200.00 Miscellaneous - 100.00 -~ Total $3.5443.75 $42.585.00
Labor
A facility such as this would require a t least three per- sons for maintenance and operation. They would have the responsibilities of cleaning the tanka, handling the
141
paper work, feeding the tilapia, and supervising the loading of the bait aboard fishing veseels. The annual wages of two employees with a GS-2 level and a super- visor with a GS-7 level would give a fairly accurate salary assessment. Current salaries run:
2 GS-2 @I $6,800 = $13,600 annually 1 GS-7 = 11,900 annually
Total $25,500 annually
Maintenance and Repair
Cost of maintenance and repair should run ap- proximately 6% of the total construction cost of $273,000. Prorated over a 2 0 9 period, this equals $819/yr.
Miscellaneous Expenses
Approximately $1,200 a year should cover such items aa office supplies and equipment. See Table 6 for total operating expenses.
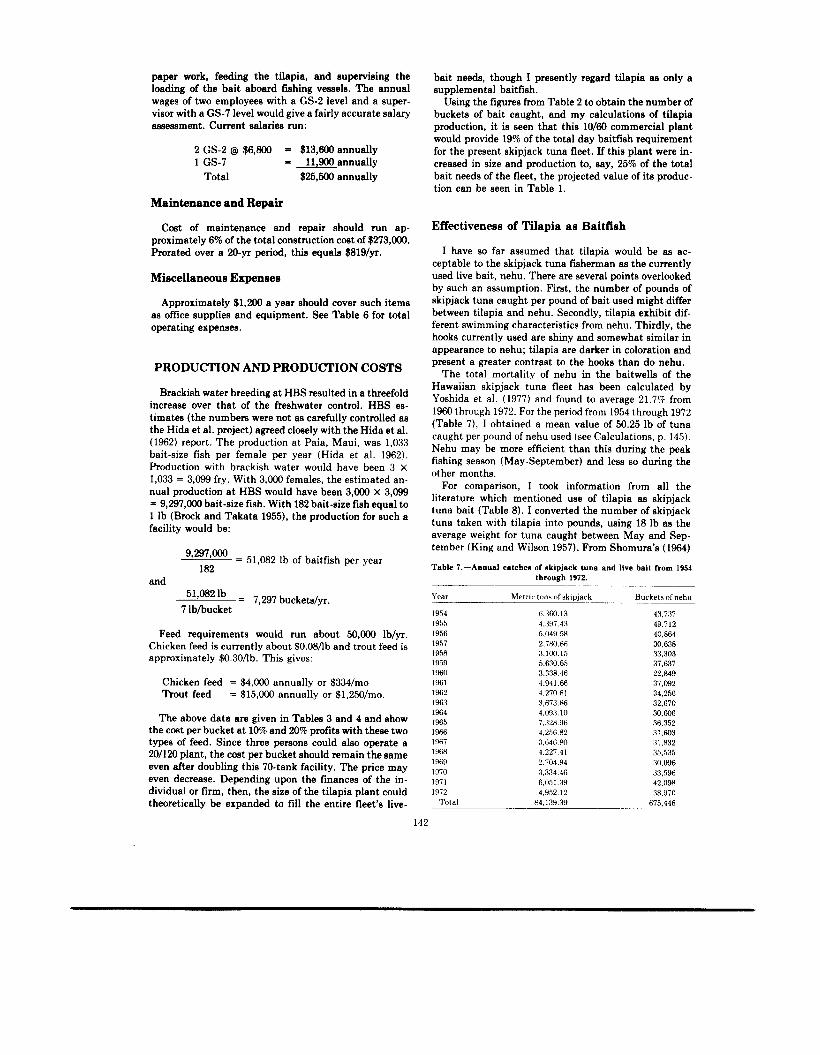
PRODUCTION AND PRODUCTION COSTS
bait needs, though I presently regard tilapia as only a supplemental baitfish.
Using the figures from Table 2 to obtain the number of buckets of bait caught, and my calculations of tilapia production, it is seen that this 10/60 commercial plant would provide 19% of the total day baitfish requirement for the present skipjack tuna fleet. If this plant were in- creased in size and production to, say, 25% of the total bait needs of the fleet, the projected value of its produc- tion can be seen in Table 1.
Effectiveness of Tilapia as Baitfish
I have so far assumed that tilapia would be as ac- ceptable to the skipjack tuna fisherman as the currently used live bait, nehu. There are several points overlooked by such an assumption. First, the number of pounds of skipjack tuna caught per pound of bait used might differ between tilapia and nehu. Secondly, tilapia exhibit dif- ferent swimming characteristics from nehu. Thirdly, the hooks currently used are shiny and somewhat similar in appearance to nehu; tilapia are darker in coloration and present a greater contrast to the hooks than do nehu.
The total mortality of nehu in the baitwells of the Hawaiian skipjack tuna fleet has been calculated by Yoshida et al, (1977) and found to average 21,7p/o from 1960 through 1972. For the period from 1954 through 1972 (Table 7), I obtained a mean value of 50.25 Ib of tuna caught per pound of nehu used (see calculations, p, 145). Nehu may be efficient than this during the peak fishing season (May-September) and less so during the other months,
For comparison, I took information from all the literature which mentioned use of tilapia as skipjack tuna bait (Table 8). I converted the number of skipjack
average weight for tuna caught between May and Sep- tember (King and Wilson 1957). From Shomura's (1964)
Brackish water breeding at HBS resulted in a threefold increase Over that Of the freshwater timates (the numbers were not as carefully controlled as the Hida et al. Project) agreed closeb'with the Hida et el. (1962) report. The production at Pais. Maui was 1,033 bait-size fish per female per year (Hida et a]. 1962). Production with brackish water would have been 3 X 1,033 = 3,099 fry. With 3,000 females, the estimated an- nual production at HBS would have been 3'000 3'099 = 9,297,000 bait-size fish. With 182 bait-size fish equal to
facility would be:
HBS
lb and Takata 1955), the production for such a tuna taken with tilapia into pounds, using 18 1b as the
Table ?.-Annual catches of skipjack tuna and live bait from 1954 through 1972.
Year Metric tons of skipjack Buckets of nehu
9'297'000 = 51,082 Ib of baitfish per year 182
_ _ ~ and ~~
51'0821b = 7,297 buckets/yr. __ 7 Ibhucket 1354 fi.360. 13 43.737
1955 4,397.43 49.712 Feed requirements would run about 50,OOO Ib/yr. 1956 5.049 SR 40.864
2,780.66 30.638 3.100.1s 33,303
1959 5.630 fis 37,637 1960 3.338 46 22.849
Chicken feed = $4,000 annually or $334/mo 1961 4.941.66 37,092 Trout feed = $15,000 annually or $1,2W/mo. 1 w2 4,270.81 34.256
1963 3.fi73.86 32.670 1964 4,093.10 30,606
7,328.96 36,352 the cost per bucket at 10% and 20% profits with these two 1% 1.256 X? 31.603 types of feed. Since three persons could also operate a 1967 3.64fi no 31,832
4.227.41 35,535 2,704.94 30,096 :3.334.4fi 33,596 ~ ,ns1 .39 42.09X
84,139.39 675.446
Chicken feed is currently about $0.08/lb and trout feed is approximately $0.30/lb. This gives:
The above data are given in Tables 3 and 4 and show 196s
20/120 plant, the cost per bucket should remain the same even after doubling this 70-tank facility. The price may even decrease. Depending upon the finances of the in- dividual or firm, t,hen, the size of the tilapia plant could 19i2 4.9?2 12 38.37O theoretically be expanded to fill the entire fleet's live-
{iz 1970 1971
_ _ _ _ _ _ _ ~
142
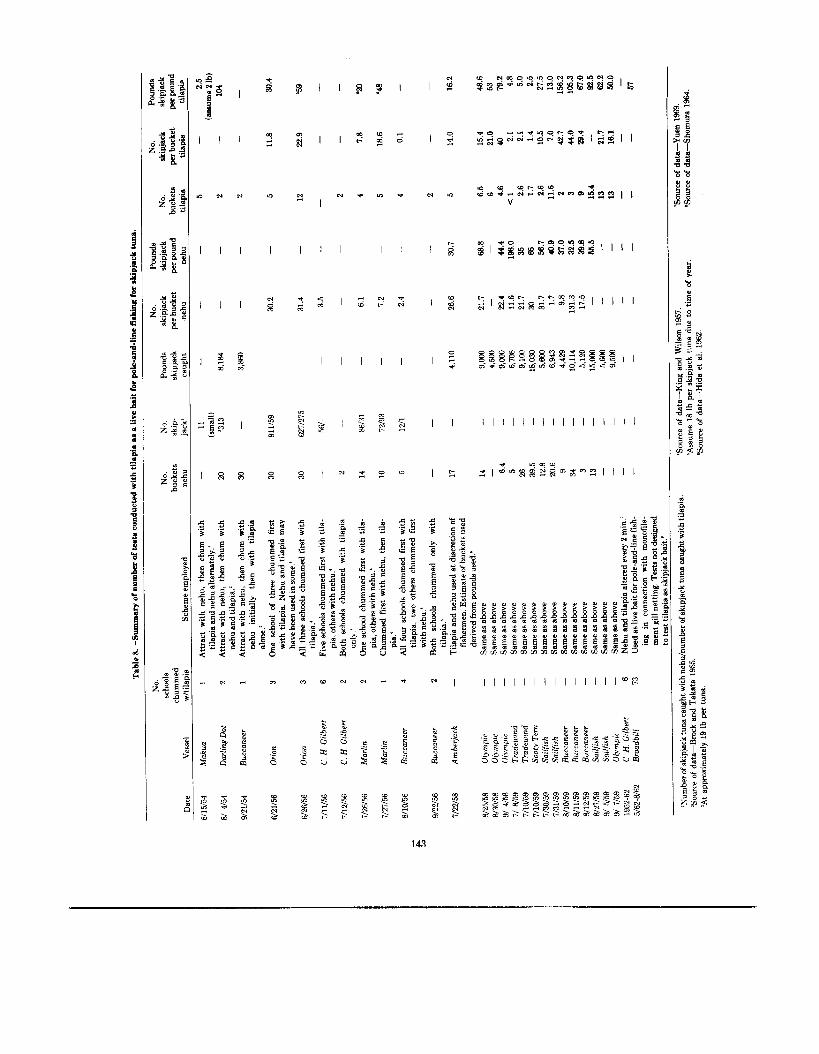
data, I obtained a value of 57 Ib of tuna per pound of bait. The average for the five papers consulted was 53 Ib of skipjack tuna caught per pound of tilapia used. This agrees with Hida et al. (1962) a t least in part because the large quantity of data that they contributed caused this final figure to be skewed in their direction.
I feel that this 53-lb figure may not be real, because, as can be Been in Table 8, the ratio between the amount of nehu used and the amount of tilapia used in these trials was quite high, and it appears that moat, if not all, of the trials did not provide a nonbiased test for tilapia. The tilapia were probably used as if they were nehu, with lit- tle regard for tilapia’s own special characteristics and as- sociated problems, which also probably biases the data; but, observing the trial dates, it can be seen that they were conducted during the “fishing season,” which could be the reason for a high efficiency figure. Evaluation of these different factors is difficult and will not be at- tempted here. However, i t appears that the efficiency of tilapia, as measured by available data, is quite com- parable to the efficiency of nehu in catching skipjack tuna.
As mentioned earlier, there are several problems with tilapia. They are slower swimmers than nehu, and with present fishing methods, the tilapia are “left behind,” causing the tuna to fall behind also, and out of range of the pole and line. Tilapia reportedly have a tendency to sound, which also draws the tuna out of range of the pole and line.
The color contrast between nehu and tilapia makes the tilapia a less desirable supplemental baitfish, because the shiny hooks presently used more closely approach the coloration of nehu than that of tilapia. Thus the tuna might be able to differentiate more easily between the hooks and tilapia, making it less effective under the pres- ent fishing method.
Another drawback mentioned previously is the sharp dorsal spines that tilapia have, which are apt to injure the chummer’s hands. For the size of a baitfish (3.8-6.4 cm), however, the spines should be too poorly developed to present a problem.
Problems and Advantages of Tilapia Culture
One major problem in culturing tilapia is the need for controlled growth. There is a need to cultivate the cor- rect bait-sized fish, and predict when they will reach such a size. In addition, cannibalism occurs in this species, calling for a continuing separating procedure.
On the other hand, there are numerous advantages to using tilapia. They are very hardy and relatively easy to cultivate. They can be raised in fresh, brackish, or salt water, with proper acclimatization. Properly ac- climatized, the mortality is negligible, say 5% at most, when held in a baitwell for extended periods. In addition, the fisherman probably will not have to “rest” the bait as he currently does.
Tilapia are edible, and fish that have grown beyond
bait size could be sold for human consumption. A public information program would probably have to be carried out, however, before tilapia is readily accepted as food fish.
“Ogo,” Gracilaria coronopifolia, an algae which is sold locally, could possibly be grown in conjunction with tilapia (E. L. Nakamura, Southeast Region, National Marine Fisheries Service, NOAA, Panama City, Fla., pers. commun.). Since it appears that tilapia do not ac- tively feed upon this algae, it could be harvested, providing additional income and thus helping to defray the operating expenses of a tilapia production plant. There may be other species that could share the tilapia tanks and help defray operating costs while not harming, or being harmed by, the tilapia.
Enclosing the tanks and regulating the temperature could aid in maintaining a constant production throughout the year, and would provide protection from predators and poachers.
Fish Diseases, Cures, and Prevention
Knowledge of fish diseases or parasitic infestations is very important because they can kill a large quantity of fish in a matter of hours or a few days. Hatchery operators must constantly check the fish tanks and fish to ensure early detection and must institute treatment promptly.
Hida et al. (1962) described their problems. Their tanks remained almost disease free in 1958; a minor out- break of the protozoan Trichodinu occurred which was controlled by treatment with 0.5 ppm copper sulfate or 3 pprn potassium permanganate solution. They also en- countered acute catarrhal enteritis, and because there was no known cure, they simply increased the flow of freshwater. They gave a prophylactic treatment of 3 ppm potassium permanganate or 0.5 ppm copper sulfate before adding new fry in 1959. They attributed their low infection rate, in part, to having an independent water supply for each tank instead of using recirculated water.
Uchida and King (1962) encountered infestations by the ectoparasite, Trichodina, and reported that potas- sium permanganate (3 ppm) was easiest to use and as ef- fective as other methods. They used the same solution to control the protozoan Chilodon. Acute catarrhal enteritis, now called infectious pancreatic necrosis, is a viral infection which has characteristics similar to those caused by the protozoan Octomitus salmonis. The symp- toms are whirling or corkscrewing accompanied by rapid ventilating, and subsequent sinking to the bottom and cessation of feeding. A “pin head” appearance results from this last symptom. Uchida and King found that by treating the feed with PMA (pyridylmercuric acetate) both of these latter diseases were eventually controlled. They also periodically added potassium permanganate as a prophylactic treatment. Their conclusion was that the single most important factor favoring diseases was overcrowding.
The HBS also encountered fish diseases. They had problems with a “whirling” disease and corrected this by
144
changing the diet from pelleted dry feed to algae. Their prebait-size fish suffered from “pin head” a condition that was corrected by using filamentous algae collected from the ocean, alfalfa pellets, and cooked taro peels. This ailment was believed to have been caused by insuf- ficient algae production in the tanks. They experienced heavy mortality among bait- and prebait-size fish caused by an unidentified disease. They treated this with a 12-h 0.8 ppm copper sulfate solution once every fourth day and increased the rate of water turnover from once every 2.5 days to once every 5 h.
FEATURES OF TANK CONSTRUCTION
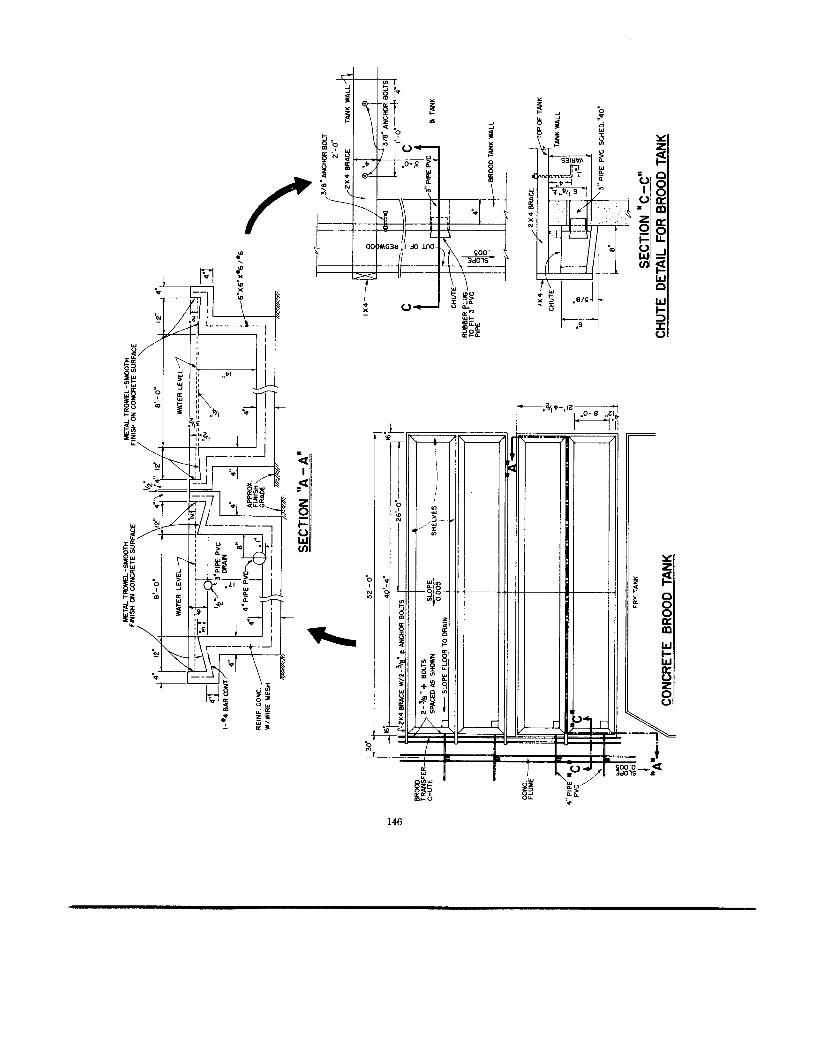
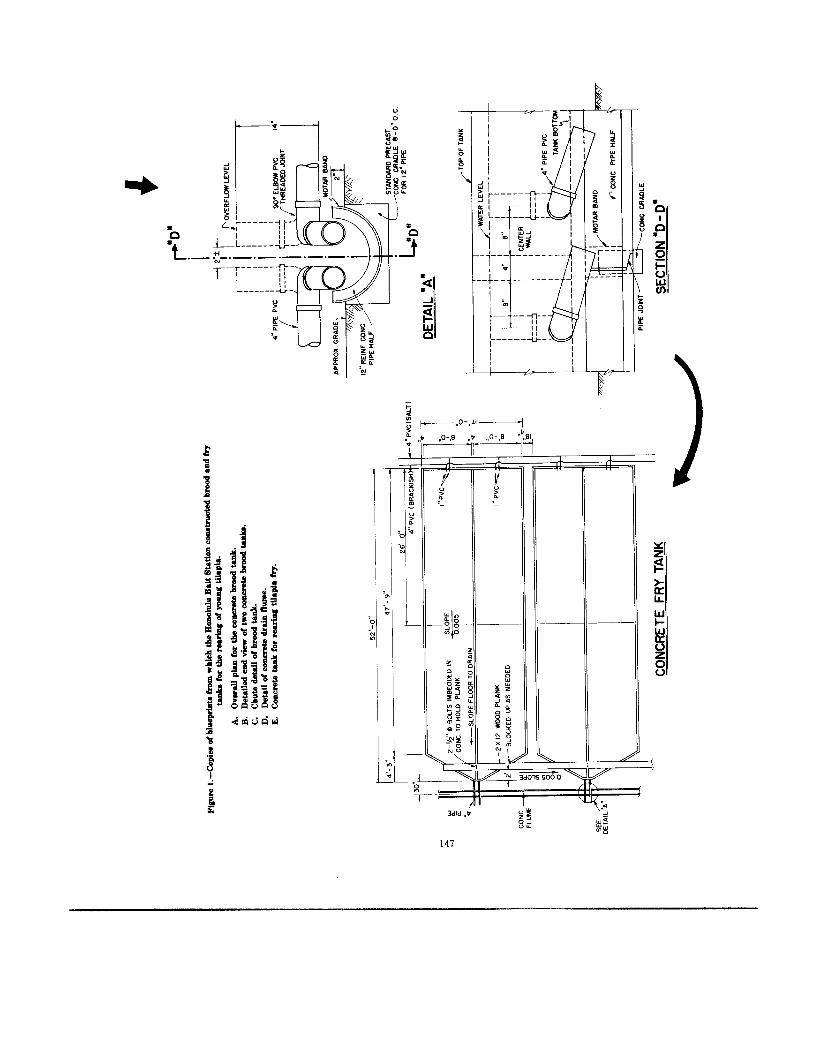
The construction of the brood and fry tanka is very important in facilitating the overall operation of a tilapia plant. The cannibalistic characteristics of tilapia make it necessary to separate fry from the brood stock and dif- ferent size fry from one another.
The HBS constructed a lip around the rim of the brood tanks that provided an area of refuge for the fry (Fig. 1). Periodically, this trough was emptied into fry tanks that had been “aged” with heavy growths of algae upon which the fry fed. There needs to be sufficient difference between the level of the trough and that of the fry tank to create a good head of water for fl ushing the fry easily and quickly from one location to another. There should also be a cascade arrangement between fry tanks for further separation after the fry begin to grow. Frames with dif- ferent mesh sizes might also be used to separate the fry.
The bot;om of the tanks should slope so as to drain properly and facilitate cleaning. Hose connections should be handy, and might even be saltwater outlets to reduce freshwater consumption.
Plumbing should be arranged so that water can be fil- tered and recirculated if desired, and proper lighting should be considered for night work and transferring the bait to the baitwells of the vessels.
A good pier with easy access both from land and sea should be available. Work saving devices might include a trough system to deliver bait to the baitwells, a movable crane, preferably motorized, for moving heavy objects, and an automatic feeder. The resulting ease of main- tenance and operation would reduce personnel needs, helping to keep costs down.
CONCLUSIONS
In this paper I have analyzed the current break-even cost to the skipjack tuna fisherman of his bait, using an indirect method. I concluded that this cost, to the fisher- man, is $30.12 per bucket of bait.
I analyzed the pilot tilapia production plant that was funded and run by the State Division of Fish and Game. From their raw data I drew a current cost estimate for a similar plant that could be theoretically increased to any size to handle either a portion or all of the bait needs of the current skipjack tuna fleet. Using the highest coet es-
timates, 10% interest on construction costs, land costing $3.00/sq f t payable over a 12-yr period, and using trout feed, I still obtained a cost per bucket of tilapia of $17.56. This includes a 20% profit for the producer.
Therefore I submit that if fishermen no longer catch bait, but purchase it instead and spend full time fishing, their bait will cost them less.
I also looked a t the catch rates for tuna when using nehu and tilapia as bait, and found them to be com- parable. Tilapia still need extensive trials as a bait species, however, and tilapia data need further scrutiny.
Tilapia characteristics, both favorable and un- favorable, were discussed and should offer some insight into the problems and advantages of raising tilapia. I also mentioned the possibility of sharing the tilapia tanks with a compatible, marketable species, and thereby helping to defray expenses.
Fish diseases contracted during three different bait- fish rearing studies were reviewed, along with their treat- ments.
CALCULATIONS C,, = &L V - (D, - C,)
D i
= 1187 ($3,203.246) - (1,187days) ($38.46) 1882
= $1,974,674 net opportunity cost
= 3,072 tons (40,230 buckets/yr) / (4,877 tons caught for 1973)
= 25,341 buckets (additional amount of bait re- quired to catch additional skipjack tuna)
E , = ( E , + E,)
= (40,230 buckets) + (25,341 buckets)
= 65,571 buckets.
Break-even (maximum) price for nehu:
C,/B, = 1,974,674/65,571 = $30.12.
Determination of the number of pounds of tuna caught per pound of nehu used.
Total number of metric tons of skipjack tuna caught 1954 through 1972 (from Table 7):
(84,139.39 t of tuna) (2,204.6 lb/t) 185,493,699 Ib of tuna caught. Total number of buckets of nehu caught, 1954-
72: (673,446 buckets of nehu caught) (21.7% mortality) 146.137.782 buckets of nehu died
-0 I N
-
%
0 *I
t
I-I
x a
$ w n
-. -0
i -- 3dld ,,
147
(673,446) - (146,137) = 527,308 buckets of nehu used
185,493,699 lb of tuna caught = 351.77 Ib of tuna/ 527,308 buckets of nehu used bucket ofnehu
351.77 lb of tunabucket of nehu = 50.25 lb of tuna/ 7 Ib. of n e h a u c k e t lb of nehu used
ACKNOWLEDGMENTS
I thank the Division of Fish and Game of the Depart- ment of Land and Natural Resources of the State of Hawaii for allowing me access to their files and the use of the raw data gathered a t their Honolulu Bait Station during the years 1962 through 1965. Without their data this paper could never have been written. I extend my personal thanks to Michio Takata, Director of the State Fish and Game Division, for granting me permission to publish their data and to Takuji Fujimura, who had to bear with all my questioning and who supplied many of the ideas incorporated into this paper. I express my in- debtedness to Richard N. Uchida, Thomas s. Hida, and Tamio Otsu a t the Honolulu Laboratory, Southwest Fisheries Center, National Marine Fisheries Service, NOAA, who took many of their busy hours to help me.
LITERATURE CITED BROCK, V. E., and M. TAKATA.
1955. Contribution to the problems of bait fish capture and mor- tality together with erperimenta in the uae of tilapia aa live bait. Territory of Hawaii, Ind. Res. Adv. Counc. Grant 49. Final Rep., 39 p.
HIDA, T. S., J. R. HARADA. and J. E. KING. 1962. Rearing tilapia for tuna bait. US. Fish Wildl. Serv., Fish.
Bull. 621-20. KING, J. E., and P. T. WILSON.
1957. Studies on tilapia as skipjack bait. US. Fish Wildl. Sew., Spec. Sci. Rep. Fish. 225. 8 p.
SHANG. Y. C.. and R. T. B. IVERSEN. 1971. The production of threadfin shad as live bait for Hawaii’s
skipjack tuna fishery: An economic feasibility study. Univ. Hawaii. Econ. Res. Cent., 42 p.
SHOMURA. R. S. 1964. Effectiveness of tilapia as live bait for skipjack tuna fishing.
Trans. Am. Fish. Soc. 93291-294. UCHIDA. R. N., and J. E. KING.
1962. Tank culture of tilapia. U S . Fieh Wildl. Serv., Fish. Bull. 62:21-52.
YOSHIDA, H. 0.. R. N. UCHIDA. and T. OTSU. 1977. The Pacific tuna pole-and-line and live-bait fisheries. In
R. S. Shomura (editor). Collection of tuna baitfish papers, p. 36- 51. U.S. Dep. Commer.. NOAA Tech. Rep. NMFS Circ. 408.
W E N , H. S. H. 1969. Response of skipjack tuna (Katsuwonus pelamis) to experi-
mental changes in pole-and-line fishing operations. In A. Ben- Tuvis and W. Dickmn (editors), Proceedings of the FA0 Confer- ence on Fish Behaviour in Relation to Fishing Techniques and Tactics, Bergen. Norway, 19-27 October 1967. FA0 Fish. Rep. 62, 3:607-618.
148