a community connection - jonestown bank & trust · richard s. miller, inc. ... the bank had...
TRANSCRIPT

2016 Annual Report
A Community Connection


1
TABLE OF CONTENTS
2 Board of Directors and Executive Officers
3 Letter to Shareholders
5 Financial Highlights
6 Independent Auditor’s Report
7 Balance Sheets
8 Statements of Income
9 Statements of Comprehensive Income
9 Statements of Stockholders’ Equity
10 Statements of Cash Flows
11 Notes to Financial Statements

2
Larry P. Minnich Director since 2013 Program Manager, Children’s Heart Group, Milton S. Hershey Medical Center, Operations Manager, COO, Central Medical Ambulance Services
J o n e s t o w n B a n k & T r u s t C o .
BOARD OF DIRECTORS
EXECUTIVE OFFICERS
Edward L. Anspach Second Vice Chairman and Secretary Director since 1987 President, Anspach Autos
Jeffrey L. Bohn Vice Chairman Director since 1987 Executive Director, Shining Light Ministries
Troy A. Peters President Chief Executive Officer
Timothy D. Gingrich Vice President Operations and Information Technology
Edward T. Martel, Jr. Senior Vice President Sales, Marketing and Branch Administration
C. William Roth Senior Vice President Chief Financial Officer
Lloyd A. Deaven, Jr. Director since 1998 Fisher Auto Parts
Edwin C. Hostetter II CPA CGMA Director since 2013 Vice President of Finance & Chief Financial Officer, SSM Group, Inc.
Brian R. Miller Director since 2015 Insurance Agency Principal, Richard S. Miller, Inc.
Sallie A. Neuin Director since 2009 Lebanon County Treasurer, Lebanon County Tax Claim Director
Richard J. Newmaster, Jr. CPA Chairman Director since 2004 Chief Financial Officer, Lebanon Seaboard Corp.
Troy A. Peters Director since 2016 President Chief Executive Officer, Jonestown Bank & Trust Co.
Eric A. Trainer Director since 2011 Co-owner/Operator, Trainer’s Midway Diner, Comfort Inn at Midway, Microtel Inn & Suites–Hamburg, Pappy T’s Pub & Lounge–Hamburg
Glenn T. Wenger Director since 2008 President, Wengers of Myerstown, Chairman, Ag Industrial, Inc., President of JK&B Inc.
Terry L. Resanovich Vice President Senior Trust Officer
Richard M. RollmanVice President Lending

3
Dear Shareholders of Jonestown Bank & Trust Co.,
The year of 2016 was another successful one for JBT. During the course of the year, your Bank produced a record setting net income of $4,471,000 -- a 6.9% increase over the prior year. Return on average equity increased by 8.3% for shareholders and the Bank strengthened its capital position. Our stock price increased by 12% and finished the year trading above book value. The dividend yield was 3.19%, and share trading volume reached its peak as over 86,000 shares were bought and sold during the year. Loans and deposits both increased and we ended the year with total assets over the $500 million mark. We were able to take advantage of disruption in our marketplace caused by a number of bank mergers to gain both new commercial and consumer relationships. Interest income and non-interest income revenue streams improved and contributed to the growth of our bottom line. Asset quality continued to improve, and at the end of the year we broke ground in Manheim for a new branch location. In all, it was a busy, progressive year, and we are optimistic about our future.
LENDING
Loan growth is a key to our success, but growth was sluggish for most of the year. Loan balances grew 4.9% which was slightly under our expectations. We were led by strong commercial loan results and growth in our municipal lending portfolio. Even though the national economy is said to be through the recovery, and perhaps even in a modest expansion mode, many consumer households in our market are still resistant to adding new debt. However, we did see strong growth in our mortgage lending activities. This is an area that we emphasized in 2016, and it resulted in a 34% increase in mortgage income. It appears housing developments are in full swing throughout our market and with mortgage rates on the rise and appraisal values increasing; many homeowners are getting active and buying new homes.
Additionally, we entered the student lending market late in the year with an affiliation to iHelp, a student lending conduit. Booking loans through iHelp allows us to participate in this market without all of the servicing and credit risks associated with student lending. These loans are funded by JBT, but underwritten and guaranteed by an insurance company. By the end of the year, we already started to build a student loan portfolio.
For years, our indirect auto lending program had been a successful one, but coming out of the recession, the competitive landscape changed dramatically and we experienced a decline in outstanding balances. In 2016, we placed a renewed emphasis on this line of business by hiring a new department manager, Kody Sitch, investing in new technology for our lending platform, and revising the program and pricing for our dealership clients. Although the roll-out of this new program will not be complete until later in 2017, we have already seen a substantial increase in business. During the last quarter of 2016, we grew balances by 16%, we booked loans with higher credit-rated borrowers, and we began financing newer vehicles. Newly implemented technology has helped it become easier to do business with us, and we believe that we will continue to see positive results going forward.
ASSET QUALITY
Asset quality has been a major focus for us over the past several years as it is one area where we trail many banks in our peer group. Great strides were made in improving our asset quality in 2016. As mentioned earlier, our indirect program is now putting on higher quality credits which is aiding our
LETTER TO SHAREHOLDERS
Richard J. Newmaster, Jr. Chairman
Troy A. Peters President Chief Executive Officer
J o n e s t o w n B a n k & T r u s t C o .
Continues on next page >
4
progress. Our non-current loans (greater than 90 days) are at a seven year low. We remain adequately reserved for future loan losses and the provision expense increased by 42% during the year – largely due to our growth. We believe that we are positioning ourselves well for the next downturn in the credit cycle when it inevitably arrives.
DEPOSITS
The Bank had another year of strong deposit growth as we experienced increases in each deposit category, culminating in an 8.5% increase in total deposits. There are many reasons for this continued growth, including the aforementioned deleveraging of consumer households and the uncertainty related to the national elections. The latter is now a settled matter and we have seen both the equity markets and interest rates rise. Rates are widely expected to continue to increase in the near future and that is welcome news to both savers and the Bank. Rising rates will ultimately reduce the pressure on our net interest margin – a key metric in our profitability. Another important reason for our increase in deposits was the tremendous market disruption in our area, caused by the mergers of local competing banks with larger out-of-town financial institutions. At one time, there were more than a dozen banks headquartered in Lebanon County. Now, we are the last local bank left standing and we are benefiting from this “merger-mania.” Many of our new clients have come to us looking for the attention and flexibility that we provide through direct and personal ties to the communities we serve. This remains one of our strongest selling points.
TECHNOLOGY
As technology advances in all areas of our lives, we realize that those advances often require further investment to remain relevant. While most of our technology investments are related to increasing our security and protecting our data, they are largely invisible to our clients. One project that was certainly evident to our clients was our debit card conversion. With the payment systems shift in liability as a result of the nation’s change to EMV (Europay MasterCard® and Visa®) technology, commonly referred to as a chip card, we reissued all JBT debit cards under the Discover® brand in the third quarter of the year. We made the change after studying Discover’s security, acceptance, customer service, and pricing. This required the reissuance of 10,500 cards in a relatively short timeframe. This was a major undertaking and was not without its bumps, as retail merchants in the United States have been slow in their conversion to this new technology. We were very pleased with the professionalism and hard work our employees demonstrated while helping our clients navigate this change. Activity continues to increase and you might be surprised to learn that our clients used their JBT debit cards nearly 2 million times in 2016 alone!
MANHEIM EXPANSION
In the third quarter Shareholder Report, we were excited to announce the news of our thirteenth branch office, to be built in Manheim, PA. In December, we officially broke ground in the new Penn Towne Center development on Route 72, located directly across from the Manheim Auto Auction and next to the new Sheetz convenience store. This is a natural extension of our existing market, and we anticipate a June 2017 opening. Dee Ann Carpenter has been named as Branch Manager of this new office. Dee is a lifelong Manheim resident and helped manage the opening of our Ephrata office in 2011. She has also worked for a direct competitor in the Manheim market for 16 years before joining JBT. We look forward to additional growth to be able to serve more clients and more communities in Lancaster County.
As always, we thank you for your continued business, investment, and support. Bank on a Smile®.
J o n e s t o w n B a n k & T r u s t C o .
FINANCIAL HIGHLIGHTS
(Dollars in thousands, except per share amounts) 2016 2015 Change
Results of OperationsNet interest income 16,101 15,406 4.5%Provision for loan losses 837 588 42.3%Net income 4,471 4,181 6.9%
Per Share DataBasic earnings 1.93 1.80 7.2%Book value 19.61 18.50 6.0%
Financial Condition at Year-endAssets 504,084 482,906 4.4%Deposits 432,714 398,638 8.5%Loans Receivable, net 417,028 397,697 4.9%Allowance for loan loss 5,038 5,034 0.1%Stockholders' equity 45,541 42,725 6.6%
Financial ratiosReturn on average assets 0.91% 0.92%Return on average equity 10.02% 9.25%Total capital to risk weighted assets 12.91% 12.73%
-1.1%8.3%1.4%
$275,000
$295,000
$315,000
$335,000
$355,000
$375,000
$395,000
$415,000
$435,000
2012 2013 2014 2015 2016
Total Loans
$300,000
$320,000
$340,000
$360,000
$380,000
$400,000
$420,000
$440,000
2012 2013 2014 2015 2016
Total Deposits
7
Richard J. Newmaster, Jr. Chairman
Troy A. Peters President Chief Executive Officer

5
J o n e s t o w n B a n k & T r u s t C o .
FINANCIAL HIGHLIGHTS
(Dollars in thousands, except per share amounts) 2016 2015 Change
Results of OperationsNet interest income 16,101 15,406 4.5%Provision for loan losses 837 588 42.3%Net income 4,471 4,181 6.9%
Per Share DataBasic earnings 1.93 1.80 7.2%Book value 19.61 18.50 6.0%
Financial Condition at Year-endAssets 504,084 482,906 4.4%Deposits 432,714 398,638 8.5%Loans Receivable, net 417,028 397,697 4.9%Allowance for loan loss 5,038 5,034 0.1%Stockholders' equity 45,541 42,725 6.6%
Financial ratiosReturn on average assets 0.91% 0.92%Return on average equity 10.02% 9.25%Total capital to risk weighted assets 12.91% 12.73%
-1.1%8.3%1.4%
$275,000
$295,000
$315,000
$335,000
$355,000
$375,000
$395,000
$415,000
$435,000
2012 2013 2014 2015 2016
Total Loans
$300,000
$320,000
$340,000
$360,000
$380,000
$400,000
$420,000
$440,000
2012 2013 2014 2015 2016
Total Deposits
7

6
INDEPENDENTAUDITOR'SREPORTBoardofDirectorsandShareholdersJonestownBank&TrustCo.
WehaveauditedtheaccompanyingfinancialstatementsofJonestownBank&TrustCo.,whichcomprisethebalancesheetsasofDecember31,2016and2015,andtherelatedstatementsofincome,comprehensiveincome,stockholders’equity,andcashflowsfortheyearsthenended,andtherelatednotestothefinancialstatements.MANAGEMENT’SRESPONSIBILITYFORTHEFINANCIALSTATEMENTS
ManagementisresponsibleforthepreparationandfairpresentationofthesefinancialstatementsinaccordancewithaccountingprinciplesgenerallyacceptedintheUnitedStatesofAmerica;thisincludesthedesign,implementation,andmaintenanceofinternalcontrolrelevanttothepreparationandfairpresentationoffinancialstatementsthatarefreefrommaterialmisstatement,whetherduetofraudorerror.AUDITOR’SRESPONSIBILITY
Ourresponsibilityistoexpressanopiniononthesefinancialstatementsbasedonouraudits.WeconductedourauditsinaccordancewithauditingstandardsgenerallyacceptedintheUnitedStatesofAmerica.Thosestandardsrequirethatweplanandperformtheauditstoobtainreasonableassuranceaboutwhetherthefinancialstatementsarefreefrommaterialmisstatement.
Anauditinvolvesperformingprocedurestoobtainauditevidenceabouttheamountsanddisclosuresinthefinancialstatements.Theproceduresselecteddependontheauditor’sjudgment,includingtheassessmentoftherisksofmaterialmisstatementofthefinancialstatements,whetherduetofraudorerror.Inmakingthoseriskassessments,theauditorconsidersinternalcontrolrelevanttotheentity’spreparationandfairpresentationofthefinancialstatementsinordertodesignauditproceduresthatareappropriateinthecircumstances,butnotforthepurposeofexpressinganopinionontheeffectivenessoftheentity’sinternalcontrol.Accordingly,weexpressnosuchopinion.Anauditalsoincludesevaluatingtheappropriatenessofaccountingpoliciesusedandthereasonablenessofsignificantaccountingestimatesmadebymanagement,aswellasevaluatingtheoverallpresentationofthefinancialstatements.
Webelievethattheauditevidencewehaveobtainedissufficientandappropriatetoprovideabasisforourauditopinion.OPINION
Inouropinion,thefinancialstatementsreferredtoabovepresentfairly,inallmaterialrespects,thefinancialpositionofJonestownBank&TrustCo.asofDecember31,2016and2015,andtheresultsofitsoperationsanditscashflowsfortheyearsthenendedinaccordancewithaccountingprinciplesgenerallyacceptedintheUnitedStatesofAmerica.
Chambersburg,PennsylvaniaFebruary22,2017

7
J o n e s t o w n B a n k & T r u s t C o .
The accompanying notes are an integral part of these financial statements.
(Dollars in thousands, except per share amounts) 2016 2015ASSETS
Cash and due from banks $ 3,152 $ 4,354 Interest bearing deposits in other banks 14,081 8,978 Securities available for sale 46,386 48,140 Securities held to maturity, fair value of $865 and $478 863 475 Loans held for sale 385 - Loans 422,066 402,731 Less allowance for loan losses 5,038 5,034
Net loans 417,028 397,697 Restricted investment in bank stock 1,510 2,194 Foreclosed assets 384 977 Premises and equipment 4,062 3,859 Investment in life insurance 11,281 10,998 Accrued interest receivable 1,286 1,167 Other assets 3,666 4,067
TOTAL ASSETS $ 504,084 $ 482,906
LIABILITIESDeposits:
Non-interest-bearing 48,051 43,560 Interest-bearing 384,663 355,078 Total deposits 432,714 398,638
Short-term debt 6,000 17,947 Long-term debt 14,274 18,033 Subordinated debt 3,000 3,000 Accrued interest payable and other liabilities 2,555 2,563
TOTAL LIABILITIES $ 458,543 $ 440,181
STOCKHOLDERS' EQUITYCommon stock, par value $2.00; 6,000,000 shares authorized; issued and outstanding 2,322,678 and 2,309,878 on December 31, 2016 and December 31, 2015 4,645 4,620 Surplus 4,877 4,678 Retained earnings 36,984 33,995 Accumulated other comprehensive (loss) (965) (568)
TOTAL STOCKHOLDERS' EQUITY $ 45,541 $ 42,725
TOTAL LIABILITIES AND STOCKHOLDERS' EQUITY $ 504,084 $ 482,906
Balance Sheets
December 31,
The accompanying notes are an integral part of these financial statements.
6

8 The accompanying notes are an integral part of these financial statements.
J o n e s t o w n B a n k & T r u s t C o .
(Dollars in thousands, except per share amounts) 2016 2015
INTEREST INCOMELoans receivables, including fees $ 17,229 $ 16,443 Securities:
Taxable 598 500 Tax-exempt 322 253 Other 194 210 Total interest income $ 18,343 $ 17,406
INTEREST EXPENSEDeposits 1,706 1,590 Short-term borrowings 44 - Interest on subordinated debt 165 24 Long-term debt 327 386
Total interest expense $ 2,242 $ 2,000
NET INTEREST INCOME 16,101 15,406 Provision for loan losses 837 588
NET INTEREST INCOME AFTER PROVISION FOR LOAN LOSSES $ 15,264 $ 14,818
OTHER INCOMETrust income 324 278 Service charges on deposit accounts 1,633 1,426 Automated teller machine and internet banking fees 235 268 Mortgage banking activities 502 374 Earnings on investment in life insurance 371 332 Gain on sales of investments 117 163 Other 195 156
Total other income $ 3,377 $ 2,997
OTHER EXPENSESalaries and employee benefits 6,834 6,542 Outsourcing services 1,237 1,028 Occupancy 816 819 Equipment and data processing 528 565 Marketing 296 254 ATM processing fees 433 327 Pennsylvania bank shares tax 349 376 Federal deposit insurance assessment 274 333 Net (gain) loss on foreclosed assets (15) 46 Other 1,819 1,850
Total other expense $ 12,571 $ 12,140
Income before income taxes 6,070 5,675 Federal income taxes 1,599 1,494
NET INCOME $ 4,471 $ 4,181
PREFERRED DIVIDENDS - 34
NET INCOME AVAILABLE TO COMMON SHAREHOLDERS 4,471 4,147
EARNINGS PER SHARE $ 1.93 $ 1.80
WEIGHTED-AVERAGE SHARES OUTSTANDING 2,316,599 2,303,861
The accompanying notes are an integral part of these financial statements.
Years Ended December 31,
Statements of Income
7

9The accompanying notes are an integral part of these financial statements.
J o n e s t o w n B a n k & T r u s t C o .
Statements of Comprehensive Income
(Dollars in thousands, except per share amounts) Years Ended December 31, 2016 2015
Net Income $ 4,471 $ 4,181
Unrealized (losses) on securities:Unrealized holding (losses) arising during the year (562) (232) Reclassification adjustment for (gains) realized in net income (117) (163) Tax effect 232 134
Net unrealized (losses) on securities (447) (261)
Defined benefit pension plan:Change in benefit obligations and plan assets 77 117 Tax effect (27) (39)
Net change in defined benefit pension plan 50 78
Other comprehensive (loss) (397) (183) Total comprehensive income $ 4,074 $ 3,998
The accompanying notes are an integral part of these financial statements.
8
(Dollars in thousands, except per share amounts) Years Ended December 31, 2016 and 2015Accumulated
OtherPreferred Common Retained Comprehensive
Stock Stock Surplus Earnings Income (Loss) Total
Balance, December 31, 2014 $ 4,000 $ 3,066 $ 3,678 $ 33,631 $ (385) $ 43,990
Issuance of common stock through dividend reinvestment plan (8,846 shares) - 17 171 - - 188 Repayment of preferred stock (4,000) - - - - (4,000) Adjustment for stock split - 1,537 829 (2,366) - - Comprehensive income: Net income - - - 4,181 - 4,181 Other comprehensive loss, net of taxes - - - - (183) (183)
Dividends on preferred shares - - - (34) - (34) Cash dividends declared ($0.61 per share) - - - (1,417) - (1,417)
Balance, December 31, 2015 $ - $ 4,620 $ 4,678 $ 33,995 $ (568) $ 42,725
Issuance of common stock through dividend reinvestment plan (12,799 shares) - 25 199 - - 224 Comprehensive income: Net income - - - 4,471 - 4,471 Other comprehensive loss, net of taxes - - - - (397) (397)
Dividends on preferred shares - - - - - - Cash dividends declared ($.64 per share) - - - (1,482) - (1,482)
Balance, December 31, 2016 $ - $ 4,645 $ 4,877 $ 36,984 $ (965) $ 45,541
The accompanying notes are an integral part of these financial statements.
Statements of Stockholders' Equity
9

10 The accompanying notes are an integral part of these financial statements.
J o n e s t o w n B a n k & T r u s t C o .
(dollars in thousands) Y ears Ended December 31,2016 2015
OPERATING ACTIVITIESNet income $ 4,471 $ 4,181 Adjustments to reconcile net income (loss) to net cash provided byoperating activities
Provision for loan losses 837 588 Provision for depreciation and amortization 538 534 Net amortization of securities premiums and discounts 426 175 Net amortization of deferred loan fees (630) 8 (Increase) decrease in deferred income taxes (34) 746 Loss (gain) on disposal of property and equipment 42 (1) (Gain) on sale of investments (117) (163) (Gain) loss on foreclosed assets (15) 46 Writedown of other real estate owned 77 36 Charitable donation of other real estate owned - 24
(Gain) on sale of loans, net (237) (177) Proceeds from sales of loans 12,500 8,933 Loans originated for sale (12,648) (8,756) Earnings on investment in Bank-owned life insurance, net (283) (254) (Decrease) in accrued interest receivable and other assets (43) (638) Decrease in accrued interest payable and other liabilities 507 206
Net cash provi ded by operati ng acti v i ti es 5,391 5,488
INVESTING ACTIVITIESProceeds from maturities and principal repayments
Securities held to maturity 12 166 Securities available for sale 3,396 6,592
Proceeds from sale of available for sale securities 4,720 5,759 Proceeds from sale of held to maturity securities - 291 Purchase of securities available for sale (7,350) (31,819) Purchase of securities held to maturity (400) - Net (increase) in loans (20,361) (14,238) Redemption of restricted bank stock 684 256 Purchase of premises and equipment (657) (388) Proceeds from sale of foreclosed assets 1,354 829 Purchase of bank owned life insurance - (2,000)
Net cash used fo r i nvesti ng acti v i ti es (18,602) (34,552)
FINANCING ACTIVITIESNet increase in deposits 34,076 40,135 Net (decrease) in short-term borrowings (11,947) (3,514) Proceeds from subordinated debt - 3,000 Repayment of long term debt (3,759) (1,247) Proceeds from the issuance of common stock 224 188 Redemption of preferred stock - (4,000) Dividends on preferred stock - (34) Dividends on common stock (1,482) (1,417)
Net cash provi ded by fi nanci ng acti v i ti es 17,112 33,111 Increase i n cash and cash equi va l ents 3,901 4,047
CASH AND CASH EQUIVALENTS AT BEGINNING OF Y EAR 13,332 9,285
CASH AND CASH EQUIVALENTS AT END OF Y EAR $ 17,233 $ 13,332
Cash paid during the year for:Interest $ 2,240 $ 1,995 Taxes 875 1,150
Noncash investing transactions:Loans Transferred to Foreclosed Assets $ 823 $ 1,240
The accompanying notes are an integral part of these financial statements.
Statements o f Cash F l ows
10

11
J o n e s t o w n B a n k & T r u s t C o .
1. Summary of Significant Accounting Policies Nature of Operations The Jonestown Bank & Trust Co. (the “Bank”) operates under a state bank charter and provides full banking services, including trust services. As a state bank, the Bank is subject to regulation of the Pennsylvania Department of Banking and Securities and the Federal Deposit Insurance Corporation. The area served by the Bank is principally Lebanon County and northern Lancaster County, Pennsylvania. Estimates The preparation of financial statements in conformity with accounting principles generally accepted in the United States of America requires management to make estimates and assumptions that affect the reported amounts of assets and liabilities and disclosure of contingent assets and liabilities at the date of the financial statements and the reported amounts of revenues and expenses during the reporting period. Actual results could differ from those estimates. Material estimates that are particularly susceptible to significant change in the near term relate to the determination of the allowance for loan losses, mortgage servicing rights, deferred tax valuation allowances, pension liability, and the determination of impairment of restricted investment in Bank stock and of other-than-temporary impairment of securities. Presentation of Cash Flows For purposes of reporting cash flows, cash and cash equivalents include cash and due from banks with original maturities of 90 days or less, if any. Securities Securities classified as available for sale are those securities that the Bank intends to hold for an indefinite period of time but not necessarily to maturity. Any decision to sell a security classified as available for sale would be based on various factors, including significant movement in interest rates, changes in maturity mix of the Bank’s assets and liabilities, liquidity needs, regulatory capital considerations, and other similar factors. Securities available for sale are carried at fair value. Unrealized gains or losses are reported in other comprehensive income, net of the related deferred tax effect. Realized gains or losses, determined on the basis of the cost of the specific securities sold, are included in earnings. Premiums and discounts are recognized in interest income, using the interest method over the terms of the securities. Bonds, notes, and debentures for which the Bank has the positive intent and ability to hold to maturity are reported at cost, adjusted for premiums and discounts that are recognized in interest income using the interest method over the terms of the securities. Management determines the appropriate classification of debt securities at the time of purchase and reevaluates such designation as of each Balance Sheet date. Securities are evaluated on a periodic basis to determine whether a decline in their value is other than temporary. For debt securities, management considers whether the present value of cash flow expected to be collected is less than the security’s amortized cost basis (the difference defined as the credit loss), the magnitude and duration of the decline, the reasons underlying the decline, and the Bank’s intent to sell the security or whether it is more likely than not that the Bank would be required to sell the security before its anticipated recovery in market value, to determine whether the loss in value is other than temporary. Once a decline in value is determined to be other than temporary, if the investor does not intend to sell the security, and it is more likely than not that it will not be required to sell the security before recovery of the security’s amortized cost basis, the charge to earnings is limited to the amount of credit loss. Any remaining difference between fair value and amortized cost (the difference defined as the non-credit portion) is recognized in other comprehensive income, net of applicable taxes. Otherwise, the entire difference between fair value and amortized cost is charged to earnings.
11

12
J o n e s t o w n B a n k & T r u s t C o .
1. Summary of Significant Accounting Policies (Continued) Restricted Investments in Bank Stock Restricted investments in bank stock, which represent required investments in the common stock of correspondent banks, are carried at cost and as of December 31, 2016 and 2015 consist of the common stock of the Federal Home Loan Bank (“FHLB”) of Pittsburgh and Atlantic Community Bankers Bank (“ACBB”). Federal law requires a member institution of the FHLB to hold stock of its district FHLB according to a predetermined formula. As of December 31, 2016 and 2015, the recorded investment in restricted bank stock is $1,510,000 and $2,194,000, respectively. Management evaluates the restricted stock for impairment at least annually, or more frequently, if necessary. Management’s determination of whether these investments are impaired is based on their assessment of the ultimate recoverability of their cost rather than by recognizing temporary declines in value. Loans Held for Sale Loans originated and intended for sale in the secondary market are carried at the lower of cost or fair value in the aggregate. Net unrealized losses, if any, are recognized through a valuation allowance by charges to income. There were $385,000 loans held for sale at December 31, 2016 and no loans were held for sale in 2015. Mortgage loans held for sale are generally sold with the mortgage-servicing rights retained by the Bank; however, the Bank does sell some mortgage loans with servicing released. The carrying value of mortgage loans sold is reduced by the cost allocated to the associated mortgage-servicing rights. Gains or losses on sales of mortgage loans are recognized based on the difference between the selling price and the carrying value of the related mortgage loans sold. Loans Receivable The Bank grants mortgage, commercial, and consumer loans to customers. A substantial portion of the loan portfolio is represented by mortgage loans throughout Lebanon County, Pennsylvania. The ability of the Bank’s debtors to honor their contracts is dependent upon the real estate and general economic conditions in this area. Loans that management has the intent and ability to hold for the foreseeable future or until maturity or payoff generally are stated at their outstanding unpaid principal balances, net of any deferred fees or costs on originated loans. Interest income is accrued on the unpaid principal balance. Loan origination fees, net of certain direct origination costs, are deferred and recognized as an adjustment of the yield (interest income) of the related loans. The Bank is generally amortizing these amounts over the contractual life of the loan. The accrual of interest for all loan segments (including impaired loans) is discontinued when the contractual payment of principal or interest has become 90 days past due, unless the credit is well-secured and in the process of collection or management has serious doubts about further collectability of principal or interest, even though the loan is currently performing. When a loan is placed on nonaccrual status, unpaid interest credited to income in the current year is reversed and unpaid interest accrued in prior years is charged against the allowance for loan losses. Interest received on nonaccrual loans generally is either applied against principal or reported as interest income, according to management’s judgment as to the collectability of principal. Generally, loans are restored to accrual status when the obligation is brought current, has performed in accordance with the contractual terms for a reasonable period of time, and the ultimate collectability of the total contractual principal and interest is no longer in doubt. Loan delinquencies for all loan segments are determined based on contractual terms of the loans.
12

13
J o n e s t o w n B a n k & T r u s t C o .
1. Summary of Significant Accounting Policies (Continued) Loans Receivable (Continued) The Bank segregates its loan portfolio into segments with varying risk characteristics. Commercial loans include loans to businesses for general commercial purposes and include permanent and short-term working capital, machinery and equipment financing, and may be either in the form of lines of credit, demand, or term loans. Some commercial and industrial loans may be unsecured to higher rated customers, but the majority of these loans are secured by the borrower’s accounts receivable, inventory and machinery and equipment and in many loans, the collateral also includes the business real estate or the business owner’s personal real estate or assets. Commercial loans have credit exposure since they are more susceptible to risk of loss during a downturn in the economy as borrowers may have greater difficulty in meeting their debt service requirements and the value of the collateral may decline. Commercial real estate loans consist of owner occupied and non-owner occupied commercial real estate loans. Owner occupied commercial real estate loans are generally dependent upon the successful operation of the borrower’s business, with the cash flows generated from the business being the primary source of repayment of the loan. If the business suffers a downturn in sales or profitability, the borrower’s ability to repay the loan could be in jeopardy, which could increase the risk of loss. Non-owner occupied and multi-family commercial real estate loans and non-owner occupied residential loans are dependent on the borrower’s ability to generate a sufficient level of occupancy to produce rental income that exceeds debt service requirements and operating expenses. Lower occupancy or lease rates may result in a reduction in cash flows, which may affect the ability of the borrower to meet debt service requirements, and may result in lower collateral values, which represents a higher inherent risk than owner-occupied commercial loans. Commercial real estate construction loans consist of 1-4 family residential construction and commercial and land development loans. The risk of loss on these loans is contingent on the assessment of the property’s value at the completion of the project, which should exceed the property’s construction costs. A number of factors can negatively affect the project during the construction phase such as cost overruns, delays in completing the project, competition, and real estate market conditions which may change based on the supply of similar properties in the area. If the collateral value at the completion of the project is not sufficient to cover the outstanding loan balance, repayment of the loan would potentially need to rely on other repayment sources, including the guarantors of the project or other collateral securing the loan. Residential real estate loans include fixed-rate and adjustable first lien mortgage loans with the underlying 1-4 family owner-occupied residential property securing the loan. Risk exposure is mitigated somewhat through the evaluation of the credit worthiness of the borrower, including credit scores and debt-to-income ratios, and limits on the loan-to-value ratios based on collateral values. Home equity lines of credit represent a slightly higher risk than residential real estate first liens, as these loans can be first or second liens on residential family owner occupied residential property, but there are loan-to-value limits on the value of the real estate taken as collateral. The credit worthiness of the borrower is considered, including credit scores and debt-to-income ratios. Consumer indirect automobile and other consumer loans’ credit risk are mitigated through evaluation of the credit worthiness of the borrower through credit scores and debt-to-income ratios, and if secured, the collateral value of the assets. However, these loans can be unsecured or secured by assets that may depreciate quickly or may fluctuate and represent a greater risk than 1-4 family residential loans. Indirect automobile loans represent some risk as the initiation of the credit process begins with a consumer and dealer at the point of purchase with the Bank then approving or denying the credit based on the consumer’s credit worthiness. The risk to the Bank is somewhat limited by loan officers using the same underwriting credit criteria as direct financing loans and risk can also be limited if the loan is written with recourse that requires the dealer to purchase the contract back in the event of default, but this is also dependent on the financial condition of the dealership.
13

14
J o n e s t o w n B a n k & T r u s t C o .
1. Summary of Significant Accounting Policies (Continued) Allowance for Loan Losses Management establishes the allowance for loan losses based upon its evaluation of the pertinent factors underlying the types and quality of loans in the portfolio. All commercial loans and commercial real estate loans are reviewed on a regular basis with a focus on larger loans along with loans which have experienced past payment or financial deficiencies. All commercial loans and commercial real estate loans which are 90 days or more past due are selected for impairment testing. These loans are analyzed to determine if they are “impaired,” which means that it is probable that all amounts will not be collected according to the contractual terms of the loan agreement. All commercial loans that are delinquent 90 days and residential mortgage loans that are 120 days delinquent and are placed on nonaccrual status are evaluated for impairment on an individual basis. The remaining loans are evaluated for impairment as groups of loans with similar risk characteristics. The Bank allocates allowances based on the factors described below, which conform to the Bank’s asset classification policy. In reviewing risk within the Bank’s loan portfolio, management has determined there to be several different risk categories within the loan portfolio. The allowance for loan losses consists of amounts applicable to: (i) the commercial loan portfolio; (ii) the commercial real estate portfolio; (iii) the consumer loan portfolio (indirect and other); (iv) the loans secured by residential real estate portfolio; and (v) home equity lines of credit. Factors considered in this process include general loan terms, collateral, and availability of historical data to support the analysis. Historical loss percentages for each risk category are calculated and used as the basis for calculating allowance allocations based on the last eight or twelve quarters of historical losses. Certain qualitative factors are then added to the historical allocation percentage to get the total factor to be applied to non-classified loans. The following qualitative factors are analyzed:
• Trends in delinquency • Underlying loan collateral value factors • Trends in risk ratings • Economic trends • Concentrations of credit risk • Lending policies and procedures • Quality of loan review methodology • External factors (competition, legal, regulatory) • Experience, depth and ability of lending management/staff • Nature and volume of the portfolio and terms of loans • Special mention and substandard trends
The Bank analyzes its loan portfolio each quarter to determine the appropriateness of its allowance for loan losses. While management uses available information to recognize losses on loans, future additions to the allowance may be necessary based on changes in local economic conditions. In addition, regulatory agencies, as an integral part of their examination process, periodically review the Bank’s allowance for losses on loans. Such agencies may require the Bank to recognize additions to the allowance based on their judgments about information available to them at the time of their examination. Because of these factors, management’s estimate of credit losses inherent in the loan portfolio and the related allowance may change in the near term. However, the amount of the change that is reasonably possible cannot be estimated. Loan Charge-off Policies Consumer and residential real estate loans are generally fully or partially charged down to the fair value of collateral securing the asset when the loan is 120 days past due unless the loan is well secured and in the process of collection. On all other loans, the primary factors considered by management in determining charge-offs include payment status and collateral value but could also include debt service coverage, financial health of the borrower, and other external factors that could impact the ability of the borrower to repay the loan.
14

15
J o n e s t o w n B a n k & T r u s t C o .
1. Summary of Significant Accounting Policies (Continued) Servicing Servicing assets are recognized as separate assets when rights are acquired through the sale of loans. Capitalized servicing rights are reported in other assets and are amortized as a reduction of noninterest income in proportion to, and over the period of, the estimated future net servicing income of the underlying loans. Servicing assets are evaluated for impairment based upon the fair value of the rights as compared with amortized cost. Impairment is determined by stratifying rights by predominant characteristics, such as interest rates and terms. Fair value is determined using prices for similar assets with similar characteristics, when available, or based upon discounted cash flows using market-based assumptions. Impairment is recognized through a valuation allowance for an individual stratum, to the extent that fair value is less than the capitalized amount for the stratum. Foreclosed Assets Assets acquired through, or in lieu of, loan foreclosure are held for sale and are initially recorded at fair value less cost to sell at the date of foreclosure, establishing a new cost basis. Subsequent to foreclosure, valuations are periodically performed by management and the assets are carried at the lower of carrying amount or fair value less cost to sell. Revenue and expenses from operations and changes in the valuation allowance are included in net expenses from foreclosed assets. Residential real estate in the process of foreclosure was $593,000 and $712,000 at December 31, 2016 and 2015, respectively. Residential real estate held as other real estate owned and included in foreclosed assets on the balance sheets was $225,000 and $551,000 at December 31, 2016 and 2015, respectively. Commercial real estate and other foreclosed assets were $159,000 and $426,000 at December 31, 2016 and 2015, respectively. Bank Premises and Equipment Land is carried at cost. Bank premises and equipment are stated at cost less accumulated depreciation. Depreciation is computed principally on the straight-line method over the estimated useful lives of the related assets, ranging from 3 to 40 years. Transfers of Financial Assets Transfers of financial assets are accounted for as sales when control over the assets has been surrendered. Control over transferred assets is deemed to be surrendered when: (1) the assets have been isolated from the Bank; (2) the transferee obtains the right (free of conditions that constrain it from taking advantage of that right) to pledge or exchange the transferred assets; and (3) the Bank does not maintain effective control over the transferred assets through an agreement to repurchase them before their maturity. Investment in Life Insurance The Bank invests in split-dollar bank-owned life insurance (“BOLI”) as a source of funding for employee benefit expenses. BOLI involves the purchasing of life insurance by the Bank on a chosen group of employees. The Bank is the owner and beneficiary of the policies. This life insurance investment is carried at the cash surrender value of the underlying policies. Income from the increase in cash surrender value of the policies is included in other income on the income statement. The expense related to the liability for future benefits of the Bank’s split-dollar bank-owned life insurance was approximately $33,000 and $37,000 for the years ended December 31, 2016 and 2015, respectively. Trust Assets Assets held by the Bank in a fiduciary capacity for customers are not included in the financial statements, since such items are not assets of the Bank. Trust income is reported on the accrual method.
15

16
J o n e s t o w n B a n k & T r u s t C o .
1. Summary of Significant Accounting Policies (Continued) Income Taxes Deferred taxes are provided on the liability method, whereby deferred tax assets are recognized for deductible temporary differences and deferred tax liabilities are recognized for taxable temporary differences. Temporary differences are the differences between the reported amounts of assets and liabilities and their tax basis. Deferred tax assets are reduced by a valuation allowance when, in the opinion of management, it is more likely than not that some portion or all of the deferred tax assets will not be realized. Deferred tax assets and liabilities are adjusted for the effects of changes in tax laws and rates on the date of enactment. The Bank follows generally accepted accounting principles, which provides guidance on accounting for uncertainty in income taxes recognized in a Bank’s financial statements. The Bank’s policy is to charge penalties and interest to income tax expense as incurred. The Bank’s federal and state tax returns are subject to examination by the Internal Revenue Service and state tax authorities, generally for a period of three years after the returns are filed. Advertising Advertising costs are expensed as incurred. The Bank’s expenditures on advertising were $296,000 and $254,000 for the years ended December 31, 2016 and 2015, respectively. Off-Balance Sheet Financial Instruments In the ordinary course of business, the Bank has entered into off-balance sheet financial instruments consisting of commitments to extend credit and letters of credit. Such financial instruments are recorded in the Balance Sheet when they are funded. Earnings per Share Basic earnings per share represent net income available to common shareholders divided by the weighted-average number of shares outstanding during the period. Dividends on preferred stock are deducted from net income in calculating earnings per common share. The bank declared a 3 for 2 stock split in August 2015 payable in September 2015. The outstanding shares before the split were 1,537,004 and after the split were 2,305,506. All per share data was restated to account for this. Comprehensive Income Accounting principles generally accepted in the United States of America require that recognized revenue, expenses, gains, and losses be included in net income. Although certain changes in assets and liabilities, such as unrealized gains and losses on available-for-sale securities and unrecognized gains and losses, prior service costs, and transition assets or obligations for defined benefit pension plans are reported as a separate component of the equity section of the Balance Sheets, such items, along with net income, are components of comprehensive income.
16

17
J o n e s t o w n B a n k & T r u s t C o .
1. Summary of Significant Accounting Policies (Continued) Comprehensive Income (Continued) The components of accumulated other comprehensive income (loss) and related tax effects are presented in the following table:
(Dollars in 000s) Unrealized Defined Total
Gains\( losses) Benefiton Securities Pension
PlanBalance, December 31, 2014 $ 458 $ (843) $ (385) Change in urealized gains on securities available for sale (232) - (232) Reclassification adjustment for (gains) realized in net (163) - (163)
income from sale of available for sale securities (1)Change in benefit obligation and plan assets - 117 117 Tax effect of current period changes (2) 134 (39) 95
Balance, December 31, 2015 $ 197 $ (765) $ (568) Change in urealized losses on securities available for sale (562) - (562) Reclassification adjustment for (gains) realized in net (117) - (117)
income from sale of available for sale securities (1)Change in benefit obligation and plan assets - 77 77 Tax effect of current period changes (3) 232 (27) 205
Balance, December 31, 2016 $ (250) $ (715) $ (965)
(1) Gain on sale of investments is included gross on the statements of income.(2) $55,000 is included in federal income taxes on the statements of income, and the remainder is included in
accumulated other comprehensive loss.(3) $40,000 in included in federal income taxes on the statements of income, and the remainder is included in
accumulated other comprehensive loss. Reclassifications Certain amounts in the prior year financial statements have been reclassified for comparative purposes to conform to the presentation in the current year financial statements.
2. Restrictions on Cash and Due from Bank Balances
The Bank is required to maintain cash reserve balances with the Federal Reserve Bank. The required reserve balances were $ 373,000 at December 31, 2016 and $215,000 at December 31, 2015. The Bank maintains balances with its correspondent banks that may exceed federal insured limits, which management considers a normal business risk.
17

18
J o n e s t o w n B a n k & T r u s t C o .
3. Securities The amortized cost and fair value of securities are presented in the following tables:
December 31, 2016 Gross GrossAmortized Unrealized Unrealized Fair
(Dollars in 000s) Cost Gains Losses Value
Available-for-sale securities:U. S. government agencies $ 1,000 $ - $ - $ 1,000 Certificates of deposit 2,629 8 (5) 2,632 Obligations of states and political subdivisions 13,023 142 (284) 12,881 Mortgage-backed securities in government-sponsored entities 30,113 126 (366) 29,873
Total $ 46,765 $ 276 $ (655) $ 46,386
Held-to-maturity securities:Mortgage-backed securities in government-sponsored entities $ 63 $ 2 $ - $ 65 Investment Note Receivable 800 - - 800
Total $ 863 $ 2 $ - $ 865
December 31, 2015 Gross GrossAmortized Unrealized Unrealized Fair
(Dollars in 000s) Cost Gains Losses Value
Available-for-sale securities:U.S. government agencies $ 1,988 $ 3 $ (1) $ 1,990 Certificates of deposit 2,629 - - 2,629 Obligations of states and political subdivisions 12,832 338 (11) 13,159 Mortgage-backed securities in government-sponsored entities 30,392 153 (183) 30,362
Total $ 47,841 $ 494 $ (195) $ 48,140
Held-to-maturity securities:Mortgage-backed securities in government-sponsored entities $ 75 $ 3 $ - $ 78 Investment Note Receivable 400 - - 400
Total $ 475 $ 3 $ - $ 478
18

19
J o n e s t o w n B a n k & T r u s t C o .
3. Securities (Continued)
Securities with a fair value of $23,055,000 and $22,856,000 at December 31, 2016 and 2015, respectively, were pledged to secure public deposits and for other purposes as required or permitted by law. Seven securities were sold in 2016 for a gross gain of $117,000. Eighteen securities were sold in 2015 for a gross gain of $163,000. The amortized cost and fair value of securities by contractual maturity are shown in the following table. Expected maturities may differ from contractual maturities because borrowers may have the right to prepay obligations with or without call or prepayment penalties.
December 31, 2016Amortized Fair Amortized Fair
(Dollars in 000s) Cost Value Cost Value
Due in one year or less $ 1,043 $ 1,055 $ - $ - Due after one year through five years 5,012 5,104 400 400 Due after five years through ten years 3,477 3,473 400 400 Due after ten years 7,120 6,881 - - Mortgage-backed securities in government-sponsored entities 30,113 29,873 63 65
Total $ 46,765 $ 46,386 $ 863 $ 865
Available for Sale Held to Maturity
The following table shows the gross unrealized losses and fair value, aggregated by investment category and length of time that individual securities have been in a continuous unrealized loss position at December 31, 2016 and 2015:
December 31, 2016
Fair Unrealized Fair Unrealized Fair Unrealized(Dollars in 000s) Value Losses Value Losses Value LossesAvailable-for-sale securities:Certificates of deposit $ 244 $ (5) $ - $ - $ 244 $ (5) Obligations of states and political subdivisions 8,292 (284) - - 8,292 (284) Mortgage-backed securities in government-sponsored entites 20,830 (365) 190 (1) 21,020 (366)
Total $ 29,366 $ (654) $ 190 $ (1) $ 29,556 $ (655)
December 31, 2015Fair Unrealized Fair Unrealized Fair Unrealized
(Dollars in 000s) Value Losses Value Losses Value Losses
Available-for-sale securities:U.S. government agencies $ 1,172 $ (1) $ - $ - $ 1,172 $ (1) Obligations of states and political subdivisions 2,160 (11) - - 2,160 (11) Mortgage-backed securities in government-sponsored entites 19,755 (182) 30 (1) 19,785 (183)
Total $ 23,087 $ (194) $ 30 $ (1) $ 23,117 $ (195)
Less Than Twelve Months Twelve Months or Greater Total
Less Than Twelve Months Twelve Months or Greater Total
19

20
J o n e s t o w n B a n k & T r u s t C o .
3. Securities (Continued)
In management’s opinion, the unrealized losses reflect changes in interest rates subsequent to the acquisition of specific securities. At December 31, 2016, the Bank had 38 securities in a loss position and 4 securities had a loss of more than 5% of book value with the largest loss on one security being 7.14%. Management believes that the unrealized losses are temporary and the Bank: (a) does not have the intent to sell any of the debt securities prior to recovery; and (b) it is more likely than not that it will not have to sell any of the debt securities prior to recovery. In addition, management feels that these losses are the result of interest rate changes that are not expected to result in the non-collection of principal and interest during the period. At December 31, 2015, the Bank had 25 securities in a loss position and only one security that was at a loss of more than 1% of amortized cost. The loss on this security was 2.63%. The Bank’s investments are exposed to various risks, such as interest rate, market, currency and credit risks. Due to the level of risk associated with certain investments and the level of uncertainty related to the changes in the value of the investments, it is at least reasonably possible that charges in risks in the near term would materially affect investment assets reported in the financial statements.
4. Loans Receivable
Loans receivable consist of the following:
(Dollars in 000s) 2016 2015
Commercial $ 52,334 $ 48,576 Commercial real estate 82,433 75,700 Commercial real estate contruction 6,202 10,696 Secured by residential real estate 142,337 134,981 Home equity lines of credit 62,235 58,590 Consumer - indirect automobile financing 62,845 60,153 Consumer - other 13,680 14,035
Gross loans 422,066 402,731 Less allowance for loan losses (5,038) (5,034)
Net loans $ 417,028 $ 397,697
December 31,
Net deferred costs included in the table above total $1,614,000 and $984,000 as of December 31, 2016 and 2015, respectively.
5. Allowance for Loan Losses Management has an established methodology to determine the adequacy of the allowance for loan losses that assesses the risks and losses inherent in the loan portfolio. For purposes of determining the allowance for loan losses, the Bank has segmented certain loans in the portfolio by product type. Loans are segmented into the following pools: commercial loans, commercial real estate loans, residential real estate loans, home equity lines of credit, and consumer loans. Historical loss percentages for each risk category are calculated and used as the basis for calculating allowance allocations. These historical loss percentages are calculated over a three-year period for all loan segments except for home equity lines of credit which are evaluated over a two-year period. The following qualitative factors are analyzed for the loan portfolio:
• Trends in delinquency • Underlying loan collateral value factors • Trends in risk ratings • Economic trends • Concentrations of credit risk • Lending policies and procedures • Quality of loan review methodology
20

21
J o n e s t o w n B a n k & T r u s t C o .
5. Allowance for Loan Losses (Continued)
• External factors (competition, legal, regulatory) • Experience, depth and ability of lending management/staff • Nature and volume of the portfolio and terms of loans • Special mention and substandard trends
These qualitative factors are reviewed each quarter and adjusted based upon relevant changes within the portfolio. Two qualitative factors comprise 65% of the 2016 qualitative reserves and they are the unemployment rate and trends in delinquencies. Both factors increased slightly during 2016 and accounted for most of the $254,000 increase in the qualitative reserve from 2015. This increase was mostly offset by decreases in the specific reserves for impaired loans and the general reserve which is based on historical losses. Loans by Segment The total allowance reflects management's estimate of loan losses inherent in the loan portfolio at the Balance Sheet date. The Bank considers the allowance for loan losses of $5,038,000 adequate to cover loan losses inherent in the loan portfolio at December 31, 2016. The following table presents, by portfolio segment, the allowance for loan losses for the years ended December 31:
Secured by Home Consumer -Commercial Residential Equity Lines Indirect Consumer Not
(Dollars in 000s) Commercial Real Estate Real Estate of Credit Automobiles Other allocated Total
Al l owance fo r credi t l osses:Beginning Balance 548$ 984$ 1,382$ 645$ 1,100$ 314$ 61$ 5,034$ Charge-offs (17) (29) (142) (37) (645) (229) - (1,099)$ Recoveries 1 - 8 1 189 67 - 266$ Provision 39 (97) 212 114 479 119 (29) 837$
Ending Balance 571$ 858$ 1,460$ 723$ 1,123$ 271$ 32$ 5,038$
Ending balance: individually evaluated for impairment 5$ 1$ 76$ -$ 61$ 7$ -$ 150$
Ending balance: collectivelyevaluated for impairment 566$ 857$ 1,384$ 723$ 1,062$ 264$ 32$ 4,888$
F i nanci ng rece i vabl es:
Ending balance, net of fees 52,334$ 88,635$ 142,337$ 62,235$ 62,845$ 13,680$ -$ 422,066$
Ending balance: individually evaluated for impairment 234$ 6,046$ 2,901$ 292$ 227$ 56$ 9,756$
Ending balance: collectivelyevaluated for impairment 52,100$ 82,589$ 139,436$ 61,943$ 62,618$ 13,624$ 412,310$
As o f December 31, 2016
21

22
J o n e s t o w n B a n k & T r u s t C o .
5. Allowance for Loan Losses (Continued)
Secured by Home Consumer -Commercial Residential Equity Lines Indirect Consumer-
(Dollars in 000s) Commercial Real Estate Real Estate of Credit Automobiles Other Unallocated Total
Al l owance fo r credi t l osses:Beginning Balance 483$ 1,086$ 1,458$ 610$ 1,100$ 275$ 28$ 5,040$ Charge-offs - - (181) (22) (728) (235) - (1,166)$ Recoveries 1 272 5 - 213 81 - 572$ Provision 64 (374) 100 57 515 193 33 588$
Ending Balance 548$ 984$ 1,382$ 645$ 1,100$ 314$ 61$ 5,034$
Ending balance: individually evaluated for impairment 9$ 3$ 94$ -$ 118$ 39$ -$ 263$
Ending balance: collectivelyevaluated for impairment 539$ 981$ 1,288$ 645$ 982$ 275$ 61$ 4,771$
F i nanci ng rece i vabl es:
Ending balance, net of fees 48,576$ 86,396$ 134,981$ 58,590$ 60,153$ 14,035$ 402,731$
Ending balance: individually evaluated for impairment 378$ 6,022$ 3,869$ 294$ 466$ 163$ 11,192$
Ending balance: collectivelyevaluated for impairment 48,198$ 80,374$ 131,112$ 58,296$ 59,687$ 13,872$ 391,539$
As o f December 31, 2015
Credit Quality Information The following tables represent credit exposures by internally assigned grades for the years ended December 31, 2016 and 2015. The grading analysis estimates the capability of the borrower to repay the contractual obligations of the loan agreements as scheduled or at all. The Bank’s internal credit risk grading system is based on definitions determined by the Bank. The Bank’s internally assigned grades are as follows: Pass – loans which are protected by the current net worth and paying capacity of the obligor or by the value of the underlying collateral. There are five sub-grades within the pass category to further distinguish the loan. Special Mention – loans where a potential weakness or risk exists, which could cause a more serious problem if not corrected. Substandard – loans that have a well-defined weakness based on objective evidence and are characterized by the distinct possibility that the Bank will sustain some loss if the deficiencies are not corrected. Doubtful – loans classified as doubtful have all the weaknesses inherent in a substandard asset. In addition, these weaknesses make collection or liquidation in full highly questionable and improbable, based on existing circumstances. Loss – loans classified as a loss are considered uncollectible, or of such value that continuance as an asset is not warranted.
22

23
J o n e s t o w n B a n k & T r u s t C o .
5. Allowance for Loan Losses (Continued)
Credit Quality Information (Continued)
CommercialCommercial Real Estate
(Dollars in 000s) Commercial Real Estate Construction
Pass $ 49,397 $ 77,421 $ 3,115 Special Mention 3 990 - Substandard 2,934 4,022 3,087 Doubtful - - - Loss - - - Ending Balance $ 52,334 $ 82,433 $ 6,202
As of December 31, 2016
CommercialCommercial Real Estate
(Dollars in 000s) Commercial Real Estate Construction
Pass $ 45,261 $ 68,928 $ 6,320 Special Mention 510 2,376 693 Substandard 2,805 4,396 3,683 Doubtful - - - Loss - - - Ending Balance $ 48,576 $ 75,700 $ 10,696
As of December 31, 2015
The following tables present performing and nonperforming consumer loans based on payment activity for the years ended December 31, 2016 and 2015. Payment activity is reviewed by management on a monthly basis to determine how loans are performing. Loans are considered to be nonperforming when they become 90 days past due, but do not include non-accrual loans less than 90 days past due. For more information on non-accrual loans see the section on non-accrual loans later in this footnote.
Secured Home Equity Indirect Otherby Residential Lines of Automobile Consumer
(Dollars in 000s) Real Estate Credit F inancing Loans
Performing $ 140,424 $ 61,975 $ 62,833 $ 13,636 Nonperforming 1,913 260 12 44 Total $ 142,337 $ 62,235 $ 62,845 $ 13,680
As of December 31, 2016
Secured Home Equity Indirect Otherby Residential Lines of Automobile Consumer
(Dollars in 000s) Real Estate Credit F inancing Loans
Performing $ 132,683 $ 58,405 $ 60,097 $ 13,991 Nonperforming 2,298 185 56 44 Total $ 134,981 $ 58,590 $ 60,153 $ 14,035
As of December 31, 2015
23

24
J o n e s t o w n B a n k & T r u s t C o .
5. Allowance for Loan Losses (Continued) Credit Quality Information (Continued)
As of December 31, 2016Total > 90 Days
30-59 Days 60-89 Days 90 Days Total Past F inancing and(Dollars in 000s) Past Due Past Due Or Greater Due Current Receivables AccruingCommercial $ - $ - $ 139 $ 139 $ 52,195 $ 52,334 $ - Commercial real estate 237 890 702 1,829 80,604 82,433 - Commercial real estate
construction - - - - 6,202 6,202 - Secured by residential
real estate 1,167 1,055 1,913 4,135 138,202 142,337 Home equity lines of credit 565 64 260 889 61,346 62,235 - Consumer - indirect
automobile financing 1,008 195 12 1,215 61,630 62,845 12 Consumer - other 90 45 44 179 13,501 13,680 -
Total $ 3,067 $ 2,249 $ 3,070 $ 8,386 $ 413,680 $ 422,066 $ 12
Following is a table which includes an aging analysis of the recorded investment of past due financing receivables:
As of December 31, 2015Total > 90 Days
30-59 Days 60-89 Days 90 Days Total Past F inancing and(Dollars in 000s) Past Due Past Due Or Greater Due Current Receivables AccruingCommercial $ 40 $ 1 $ - $ 41 $ 48,535 $ 48,576 $ - Commercial real estate 320 - 807 1,127 74,573 75,700 - Commercial real estate
construction - - - - 10,696 10,696 - Secured by residential
real estate 1,276 591 2,298 4,165 130,816 134,981 70 Home equity lines of credit 281 40 185 506 58,084 58,590 - Consumer - indirect
automobile financing 684 142 56 882 59,271 60,153 56 Consumer - other 88 23 44 155 13,880 14,035 26
Total $ 2,689 $ 797 $ 3,390 $ 6,876 $ 395,855 $ 402,731 $ 152
Impaired Loans Management considers commercial loans and commercial real estate loans which are 90 days or more past due to be impaired along with loans that are not expected to be collected as per the original loan contract. Larger commercial loans and commercial real estate loans which are 90 days or more past due are selected for impairment testing in accordance with GAAP. All substandard and doubtful loans are reviewed to determine if the loan is impaired. These loans are analyzed to determine if it is probable that all amounts will not be collected according to the contractual terms of the loan agreement. If management determines that the value of the impaired loan is less than the recorded investment in the loan (net of previous charge-offs, deferred loan fees, or costs and unamortized premium or discount), impairment is recognized through an allowance estimate or a charge-off to the allowance.
24

25
J o n e s t o w n B a n k & T r u s t C o .
5. Allowance for Loan Losses (Continued) Impaired Loans (Continued) The following table includes the recorded investment and unpaid principal balances for impaired financing receivables with the associated allowance amount, if applicable:
As of and for the year ended December 31, 2016Unpaid Average Interest
Recorded Principal Related Recorded Income(Dollars in 000s) Investment Balance Allowance Investment RecognizedWith no related allowance recorded:
Commercial $ 229 $ 229 $ - $ 227 $ 9 Commercial real estate 3,962 4,608 - 4,108 55 Commercial real estate construction 2,037 2,196 - 2,063 77 Secured by residential real estate 2,376 2,415 - 2,755 81 Home equity lines of credit 292 292 - 293 11 Consumer - indirect auto 30 30 - 34 2 Consumer - other 19 19 - 19 -
Subtotal $ 8,945 $ 9,789 $ - $ 9,499 $ 235
With an allowance recorded:Commercial 5 5 5 5 - Commercial real estate 47 52 1 57 1 Secured by residential real estate 525 614 76 543 14 Consumer - indirect auto 197 197 61 249 20 Consumer - other 37 37 7 44 2
Subtotal $ 811 $ 905 $ 150 $ 898 $ 37 Commercial 234 234 5 232 9 Commercial real estate 4,009 4,660 1 4,165 56 Commercial real estate construction 2,037 2,196 - 2,063 77 Secured by residential real estate 2,901 3,029 76 3,298 95 Home equity lines of credit 292 292 - 293 11 Consumer - indirect auto 227 227 61 283 22 Consumer - other 56 56 7 63 2
Total $ 9,756 $ 10,694 $ 150 $ 10,397 $ 272
25

26
J o n e s t o w n B a n k & T r u s t C o .
5. Allowance for Loan Losses (Continued) Impaired Loans (Continued)
As of and for the year ended December 31, 2015Unpaid Average Interest
Recorded Principal Related Recorded Income(Dollars in 000s) Investment Balance Allowance Investment Recognized
With no related allowance recorded:Commercial $ 263 $ 263 $ - $ 270 $ 6 Commercial real estate 3,759 4,263 - 3,874 28 Commercial real estate construction 2,198 2,352 - 2,332 59 Secured by residential real estate 2,634 2,655 - 2,689 70 Home equity lines of credit 294 294 - 284 10 Consumer - other 29 29 - 32 1
Subtotal $ 9,177 $ 9,856 $ - $ 9,481 $ 174
With an allowance recorded:Commercial 115 115 9 108 1 Commercial real estate 65 68 3 72 2 Secured by residential real estate 1,235 1,335 94 1,270 31 Consumer - other 600 588 157 657 42
Subtotal $ 2,015 $ 2,106 $ 263 $ 2,107 $ 76
Commercial 378 378 9 378 7 Commercial real estate 3,824 4,331 3 3,946 30 Commercial real estate construction 2,198 2,352 - 2,332 59 Secured by residential real estate 3,869 3,990 94 3,959 101 Home equity lines of credit 294 294 - 284 10 Consumer - other 629 617 157 689 43
Total $ 11,192 $ 11,962 $ 263 $ 11,588 $ 250
Nonaccrual Loans Commercial Loans are placed on nonaccrual upon 90 days delinquency and residential loans are placed on nonaccrual after 120 days. A nonaccrual loan will generally only be placed back on accrual status after the borrower has become current and has demonstrated six consecutive months of non-delinquency. When a loan is placed in nonaccrual status, previously accrued but unpaid interest is deducted from interest income. On the following table are the financing receivables on nonaccrual status as of December 31, 2016 and 2015. The balances are presented by class of financing receivable.
As of December 31, As of December 31,(Dollars in 000s) 2016 2015
Commercial $ 139 $ - Commercial real estate 2,791 1,410 Secured by residential real estate 2,386 2,696 Home equity lines of credit 299 226 Consumer - other 44 18
Total $ 5,659 $ 4,350
26

27
J o n e s t o w n B a n k & T r u s t C o .
5. Allowance for Loan Losses (Continued) Troubled Debt Restructurings
In situations where, for economic or legal reasons related to a borrower's financial difficulties, management may grant a concession for other than an insignificant period of time to the borrower that would not otherwise be considered, the related loan is classified as a Troubled Debt Restructuring (“TDR”). Management strives to identify borrowers in financial difficulty early and work with them to modify more affordable terms before their loan reaches nonaccrual status. These modified terms may include rate reductions, principal forgiveness, payment forbearance and other actions intended to minimize the economic loss and to avoid foreclosure or repossession of the collateral. In cases where borrowers are granted new terms that provide for a reduction of either interest or principal, management measures any impairment on the restructuring by calculating the present value of the revised loan terms and comparing this balance to the Company’s investment in the loan prior to the restructuring. As these loans are individually evaluated for impairment, they are excluded from pooled portfolios when calculating the allowance for loan and lease losses and a separate allocation within the allowance for loan and lease losses is provided. Management continually evaluates loans that are considered TDRs, including payment history under the modified loan terms, the borrower’s ability to continue to repay the loan based on continued evaluation of their operating results, and cash flows from operations. Loan modifications that are considered TDRs completed during the years ended December 31, 2016 and 2015, were as follows:
(Dollars in 000s) Pre-Modification Post-ModificationNumber of Outstanding Recorded Outstanding RecordedContracts Investment Investment
2016Troubled debt restructurings:
Commercial real estate 1$ 1,234$ 1,234$ Secured by residential real estate 1 81 81
Total 2 1,315 1,315
(Dollars in 000s) Pre-Modification Post-ModificationNumber of Outstanding Recorded Outstanding RecordedContracts Investment Investment
2015Troubled debt restructurings:
Commercial 3 73$ 73$ Secured by residential real estate 6 635 668 Consumer 25 451 448
Total 34 1,159$ 1,189$ All of the TDRs are performing and are in compliance with their modified terms and there were no commitments to lend more funds to these borrowers. The restructuring of the majority of loans for both 2016 and 2015 was either an extension of the maturity date or temporary reduction or moratorium on the payment terms or amounts. No modifications involved any changes in principal balances for 2016 or 2015. `
27

28
J o n e s t o w n B a n k & T r u s t C o .
6. Mortgage Servicing The Bank entered into agreements to sell residential mortgages to the FHLB of Pittsburgh. The total amount of loans sold under these agreements was $200,733,000 and $188,665,000 as of December 31, 2016 and 2015, respectively. The agreements include a maximum credit enhancement of $520,000 which the Bank may be required to pay if realized losses on any of the sold mortgages exceed the amount held in the FHLB’s Spread Account. The FHLB is funding the Spread Account at 0.04 percent of the outstanding balance of loans sold annually. The Bank’s historical losses on residential mortgages have been lower than the amount that will be funded to the Spread Account. Therefore, the Bank has not recorded a liability for the credit enhancement. As compensation for the credit enhancement, the FHLB is paying the Bank 0.10 percent of the outstanding loan balance in the portfolio on a monthly basis. Loans serviced for others are not included in the accompanying balance sheets. The unpaid principal balances of mortgage loans serviced for others were $80,717,000 and $79,628,000 at December 31, 2016 and 2015, respectively.
The Bank retains the servicing on certain loans sold to the FHLB and receives a fee based upon the principal balance outstanding. The balance of mortgage servicing rights included in other assets on the balance sheets was $261,000 and $279,000 at December 31, 2016 and 2015. Mortgage servicing fee income for the years ended December 31, 2016 and 2015 was $103,000 and $106,000, respectively, which is included in mortgage banking activities in the statements of income. The following summarizes mortgage servicing rights capitalized and amortized:
(Dollars in 000s) 2016 2015
Mortgage servicing rights capitalized $ 95 $ 53 Mortgage servicing rights amortized (113) (122) Net change $ (18) $ (69)
Years Ended December 31,
7. Bank Premises and Equipment Components of Bank premises and equipment are as follows:
(Dollars in 000s) 2016 2015
Land and improvements $ 456 $ 456 Buildings 5,357 5,372 Furniture and equipment 2,714 2,706 Contruction in progress 358 - Total premises and equipment $ 8,885 $ 8,534
Less accumulated depreciation (4,823) (4,675)
Net premises and equipment $ 4,062 $ 3,859
December 31,
Depreciation expense for the years ended December 31, 2016 and 2015 was approximately $425,000 and $412,000, respectively.
28

29
J o n e s t o w n B a n k & T r u s t C o .
7. Bank Premises and Equipment (Continued)
The Bank leases land and office space under operating leases. Rental expense, including real estate taxes, for these leases was $249,000 and $218,000 for years ended December 31, 2016 and 2015 respectively. Future minimum rental commitments under these leases are as follows:
(Dollars in 000s)
2017 $ 197 2018 193 2019 150 2020 153 2021 157 Thereafter 1,075
Total $ 1,925
Years Ending December 31,
The bank entered in an agreement on October 7, 2016 with a contractor to build a new bank branch for $1,260,000 in Manheim, Pennsylvania, of which $252,000 had been paid at December 31, 2016. It is expected to be completed by June of 2017.
8. Deposits The composition of deposits is as follows:
(Dollars in 000s) 2016 2015
Demand, non-interest-bearing $ 48,051 $ 43,560 Checking with interest and money market 198,755 173,071 Savings 41,159 38,778 Time deposits greater then $250,000 16,971 10,020 Other time deposits 127,778 133,209
Total $ 432,714 $ 398,638
December 31,
At December 31, 2016, the scheduled maturities of time deposits are as follows:
(Dollars in 000s)
2017 $ 76,716 2018 25,316 2019 17,168 2020 14,691 2021 10,858
Total $ 144,749
Years Ended December 31,
29

30
J o n e s t o w n B a n k & T r u s t C o .
9. Employee Benefits The Bank has a defined contribution 401(k) plan for employees who meet the eligibility requirements set forth in the plan. All of the Bank’s employees that are 21 years and older are eligible for the plan. The Bank increased its match in 2013 to 100% of elective contributions of employees not to exceed 4% of the employee’s salary, plus 50% of the employees elective contribution that exceed 4% of their salary but not to exceed 6% of their salary. The Bank’s contributions to this plan were $202,000 in 2016 and $191,000 in 2015.
The Bank has a noncontributory defined benefit pension plan (the “Plan”) covering substantially all employees hired prior to February 1, 2006. The Plan’s benefit formulas generally base payments to retired employees upon their length of service and the employees’ average monthly compensation. This plan was frozen as of December 31, 2012 and no employees are accruing any more benefits.
The following table sets forth the Plan’s funded status and the amounts recognized in the Bank’s financial statements. The measurement date for purposes of these valuations was December 31, 2016 and 2015.
(Dollars in 000s) 2016 2015
Change in benefit obligation Benefit obligation at beginning of year $ 3,859 $ 4,106 Interest cost 165 160 Actuarial (gain) (15) (347) Benefits paid (79) (60) Settlements (107) - Benefit obligation at end of year 3,823 3,859
Change in plan assets Fair value of plan assets at beginning of year 3,156 2,965 Employer contribution 450 350 Actual return on plan assets 215 (98) Benefits paid (79) (61) Settlements (107) - Fair value of plan assets at end of year 3,635 3,156
Funded status (Included in other liabilities) $ (188) $ (703)
Amounts recognized in accumulated other comprehensive income (loss) consist of:
Net acturial loss $ (1,085) $ (1,162) Deferred tax benefit 370 397
Total $ (715) $ (765)
December 31,
30

31
J o n e s t o w n B a n k & T r u s t C o .
9. Employee Benefits (Continued) Net periodic pension expense included the following components:
(Dollars in 000s) 2016 2015
Interest cost $ 165 $ 160 Expected return on plan assets (217) (204) Net amortization and deferral 64 72
Net periodic pension expense $ 12 $ 28
Years Ended December 31,
The accumulated benefit obligation was $3,823,000 and $3,859,000 at December 31, 2016 and 2015 respectively. The following is a summary of actuarial assumptions used for the Bank’s pension plan:
2016 2015Discount rate 4.14% 4.34%Expected long-term return on Plan assets 7.00% 7.00%Rate of compensation increase N/A N/A
December 31,
The estimated net actuarial loss that will be amortized into net periodic pension cost over the next year is $60,000.
The selected long-term rate of return on Plan assets (7.0 percent) was primarily based on the asset allocation of the Plan’s assets. Analysis of the historic returns on these asset classes and projections of expected future returns were considered in setting the long-term rate of return. The Bank’s pension plan target asset allocations, by asset category, are as follows:
2016 2015Equities 65% 60%Fixed income 35% 39%Other 0% 1%
Total 100% 100%
December 31,
31

32
J o n e s t o w n B a n k & T r u s t C o .
9. Employee Benefits (Continued) The following table sets forth by level, within the fair value hierarchy, the Plan’s assets at fair value:
(Dollars in 000s) Level I Level II Level III TotalAssets:
Mutual funds: Equities Large-Cap Value $ 222 $ - $ - $ 222 Large-Cap Core 291 - - 291 Mid-Cap Core 258 - - 258 Small-Cap Core 134 - - 134 International Core 535 - - 535 Large Cap Growth 405 - - 405 Small-Cap Growth 140 - - 140 Fixed income Fixed Income- US Core 1,024 - - 1,024 Intermediate Duration 345 - - 345 Other - 230 - 230 Cash Equivalent 51 - - 51
Total assets at fair value $ 3,405 $ 230 $ - $ 3,635
(Dollars in 000s) Level I Level II Level III TotalAssets:
Mutual funds: Equities Large-Cap Value $ 173 $ - $ - $ 173 Large-Cap Core 243 - - 243 Mid-Cap Core 216 - - 216 Small-Cap Core 104 - - 104 International Core 496 - - 496 Large Cap Growth 375 - - 375 Small-Cap Growth 110 - - 110 Fixed income Fixed Income- US Core 915 - - 915 Intermediate Duration 304 - - 304 Other - 166 - 166 Cash Equivalent 54 - - 54
Total assets at fair value $ 2,990 $ 166 $ - $ 3,156
As of December 31, 2016
As of December 31, 2015
32

33
J o n e s t o w n B a n k & T r u s t C o .
9. Employee Benefits (Continued) The Bank expects to contribute $100,000 to its pension plan in 2017. The following benefit payments, which reflect expected future service, as appropriate, are expected to be paid:
(Dollars in 000s)
2017 $ 110 2018 114 2019 113 2020 117 2021 127 2022 - 2026 970
$ 1,551
Years Ended December 31,
10. Borrowed Funds The Bank has available a $25 million line with the FHLB of Pittsburgh. This line expires in February 2017. The interest rate on this line was 0.74 percent at December 31, 2016, and 0.43 percent at December 31, 2015. The outstanding balance under this line as of December 31, 2016 and 2015 was $6,000,000 and $17,947,000 respectively. The bank also has an unsecured $3 million line with the Atlantic Community Bankers Bank (ACBB), which was not used in 2016 or 2015. The Bank also entered into unsecured subordinated debt with ACBB in 2015, maturing in November 2025, at a fixed rate of 5.5% for five years and then a variable rate based on prime rate plus 0.50% for the last five years. The debt can be redeemed after November 2020. Long-term debt is composed of the following FHLB fixed-rate advances and subordinated debt:
(Dollars in 000s)Maturity Date Rate 2016 2015
October 2016 (Non-amortizing) 0.94 - 3,500 July 2017 (Non-amortizing) 1.39 5,300 5,300 July 2018 (Non-amortizing) 1.81 7,000 7,000 May 2023 (Amortizing 4.57 1,280 1,448 May 2023 (Amortizing) 4.68 694 785 November 2025 subordinated debt 5.50 3,000 3,000 (requires $150,000 quarterly payments beginning in November 2020)
17,274$ 21,033$
December 31,
33

34
J o n e s t o w n B a n k & T r u s t C o .
10. Borrowed Funds (Continued)
The following table represents maturities/repayments of the remaining FHLB advances at December 31, 2016 and subordinated debt:
(Dollars in 000s) Amount2017 5,571 2018 7,283 2019 297 2020 461 2021 926 Thereafter 2,736
Total $ 17,274
Borrowings from the FHLB are collateralized by certain qualifying assets of the Bank with an approximate value of $169,680,000 at December 31, 2016. The Bank has a maximum borrowing capacity with the FHLB of approximately $169,680,000 of which $26,774,000 is outstanding which includes a $6,500,000 letter of credit issued to a municipality to secure deposits.
11. Short-Term Borrowings
The following table represents the activity related to the Bank’s short-term borrowings under the $25 million line of credit with the FHLB of Pittsburgh:
(Dollars in 000s) 2016 2015
Balance at year-end $ 6,000 $ 17,947 Average balance outstanding during the year 6,434 9,551 Maximum amount outstanding at any month-end 27,968 17,947 Weighted-average interest rate: As of year-end 0.74 % 0.43 % Paid during the year 0.56 % 0.35 %
As of and for the Years Ended December 31,
12. Preferred Stock Small Business Lending Fund
On August 16, 2011, the Company received $4 million from the Small Business Lending Fund (“SBLF”). The SBLF is a voluntary program sponsored by the U.S. Treasury that encourages small business lending by providing capital to qualified community banks at favorable rates. The initial interest rate on the SBLF funds was 5 percent and have been decreased to as low as 1 percent because growth thresholds were met for outstanding small business loans. The Bank paid a 1 percent dividend for 2015. On November 6, 2015 all of this preferred stock was paid back to the U.S. Treasury.
34

35
J o n e s t o w n B a n k & T r u s t C o .
13. Related-Party Transactions The Bank has had banking transactions in the ordinary course of business with its executive officers, directors, principal stockholders, and their affiliated companies (related parties) on the same terms, including interest rates and collateral, as those prevailing at the time for comparable transactions with others. A summary of loan activity during the year ended December 31, 2016 is as follows:
Balance at Balance atDecember 31, December 31,
2015 Additions Amount Collected 2016
$2,457,000 $1,042,000 $737,000 $2,762,000
Deposits to related parties totaled $6,328,000 and $5,273,000 as of December 31, 2016 and 2015 respectively.
14. Off-Balance Sheet Commitments The Bank is a party to financial instruments with off-balance sheet risk in the normal course of business to meet the financing needs of its customers. These financial instruments include commitments to extend credit and letters of credit. Those instruments involve, to varying degrees, elements of credit risk in excess of the amount recognized in the balance sheet. The Bank’s exposure to credit loss in the event of nonperformance by the other party to the financial instrument for commitments to extend credit and letters of credit is represented by the contractual amount of those instruments. The Bank uses the same credit policies in making commitments and conditional obligations as it does for on-balance sheet instruments. Commitments to extend credit are agreements to lend to a customer as long as there is no violation of any condition established in the contract. Since many of the commitments are expected to expire without being drawn upon, the total commitment amounts do not necessarily represent future cash requirements. Commitments generally have fixed expiration dates or other termination clauses and may require payment of a fee. The Bank evaluates each customer’s creditworthiness on a case-by-case basis. The amount of collateral obtained, if deemed necessary by the Bank upon extension of credit, is based on management’s credit evaluation. Collateral held varies but may include personal or commercial real estate, accounts receivable, inventory, and equipment. Outstanding letters of credit written are conditional commitments issued by the Bank to guarantee the performance of a customer to a third party. The majority of these standby letters of credit expire within the next 12 months. The credit risk involved in issuing letters of credit is essentially the same as that involved in extending other loan commitments. The Bank requires collateral supporting these letters of credit, as deemed necessary. Management believes that the proceeds obtained through a liquidation of such collateral would be sufficient to cover the maximum potential amount of future payments required under the corresponding guarantees. The amount of the liability for guarantees under standby letters of credit issued is not material as of December 31, 2016 and 2015. A summary of the Bank’s financial instrument commitments is as follows:
(Dollars in 000s) 2016 2015
Commitments to extend credit $ 8,538 $ 14,698 Unfunded commitments 80,421 73,848 Standby letters of credit 6,712 6,708
Total $ 95,671 $ 95,254
December 31,
35

36
J o n e s t o w n B a n k & T r u s t C o .
15. Income Taxes The provision for federal income taxes consisted of the following:
(Dollars in 000s) 2016 2015
Current $ 1,428 $ 652 Deferred 171 842
Total $ 1,599 $ 1,494
December 31,Years Ended
Reconciliation of the statutory income tax expense computed at 34 percent to the income tax expense included in the statements of income is as follows:
(Dollars in 000s)% of % of
Pretax PretaxAmount Income Amount Income
Provision at statutory rate $ 2,064 34.0 % $ 1,929 34.0 %Tax exempt interest, net (373) (6.2) (321) (5.6) Life insurance (85) (1.4) (74) (1.3) Other, net (7) (0.1) (40) (0.7)
Actual tax expense and effective rate $ 1,599 26.3 % $ 1,494 26.4 %
Years Ended December 31,2016 2015
Net deferred tax assets consisted of the following components:
(Dollars in 000s) 2016 2015
Deferred tax assets:Allowance for loan losses $ 1,389 $ 1,324 Other pension adjustments 369 395 Nonaccrual loan interest 167 172 Net unrealized loss on securities 129 - Deferred loan fees 88 53 Deferred gains from sale of assets 83 83 Other 49 24 Total deferred tax assets 2,274 2,051
Deferred tax liabilities:Net unrealized gain on securities - (102) Accrued pension (305) (156) Premises and equipment (571) (605) Deferred loan fees costs (754) (559) Mortgage servicing rights (89) (95) Prepaid expenses (100) (113) Total deferred tax liabilities (1,819) (1,630) Net deferred tax assets $ 455 $ 421
As of December 31,
36

37
J o n e s t o w n B a n k & T r u s t C o .
16. Concentration of Credit Risk The Bank grants commercial, residential, and consumer loans to customers primarily located in Lebanon County, Pennsylvania. The concentrations of credit by type of loan are set forth in Note 4. Although the Bank has a diversified loan portfolio, its debtors’ ability to honor their contracts is influenced by the region’s economy.
17. Regulatory Matters
The Bank is subject to various regulatory capital requirements administered by the federal banking agencies. Failure to meet minimum capital requirements can initiate certain mandatory and possibly additional discretionary actions by regulators that, if undertaken, could have a direct material effect on the Bank’s financial statements. Under capital adequacy guidelines and the regulatory framework for prompt corrective action, the Bank must meet specific capital guidelines that involve quantitative measures of the Bank’s assets and liabilities and certain off-balance sheet items as calculated under regulatory accounting practices. The Bank’s capital amounts and classification are also subject to qualitative judgments by the regulators about components, risk weightings, and other factors. Quantitative measures established by regulation to ensure capital adequacy require the Bank to maintain minimum amounts and ratios (set forth in the following table) of Total, Tier I capital and Common Equity Tier I capital (as defined in the regulations) to risk-weighted assets (as defined) and of Tier I capital (as defined) to average assets (as defined). Management believes, as of December 31, 2016, that the Bank meets all capital adequacy requirements to which it is subject. As of December 31, 2016, the most recent notification from the Federal Deposit Insurance Corporation categorized the Bank as well capitalized under the regulatory framework for prompt corrective action. There are no conditions or events since that notification that management believes have changed the Bank’s category. The Bank’s actual capital amounts and ratios as of December 31 are also presented below:
(Dollars in 000s) Amount Ratio > Amount > Ratio > Amount > Ratio
Total capital ( to risk -weighted assets)
2016 $ 54,584 12.91 % $ 33,828 8.00 % $ 42,285 10.00 %2015 $ 51,334 12.73 % $ 32,262 8.00 % $ 40,328 10.00 %
Tier I capital ( to risk -weighted assets)
2016 $ 46,506 11.00 % $ 25,371 6.00 % $ 33,828 8.00 %2015 $ 43,293 10.74 % $ 24,197 6.00 % $ 32,262 8.00 %
Tier I capital ( to average assets)
2016 $ 46,506 9.41 % $ 19,769 4.00 % $ 24,711 5.00 %2015 $ 43,293 9.24 % $ 18,741 4.00 % $ 23,426 5.00 %
Common equity tier one capital ( to risk -weighted assets)
2016 $ 46,506 11.00 % $ 19,028 4.50 % $ 27,485 6.50 %2015 $ 43,293 10.74 % $ 18,148 4.50 % $ 26,213 6.50 %
To Be Well CapitalizedUnder Prompt Corrective
Action ProvisionsActualFor Capital
Adequacy Purposes
The Bank is subject to certain restrictions on the amount of dividends that it may declare without prior regulatory approval. At December 31, 2016, $36,984,000 of retained earnings was available for dividend declaration without prior regulatory approval, subject to the above regulatory capital requirements.
37

38
J o n e s t o w n B a n k & T r u s t C o .
18. Fair Value Management has established a fair value hierarchy that prioritizes the inputs to valuation methods used to measure fair value. The hierarchy gives the highest priority to unadjusted quoted prices in active markets for identical assets or liabilities (Level I measurements) and the lowest priority to unobservable inputs (Level III measurements). The three levels of the fair value hierarchy are as follows:
Level I: Unadjusted quoted prices in active markets that are accessible at the measurement date for identical, unrestricted assets, or liabilities.
Level II: Quoted prices in markets that are not active, or inputs that are observable either directly or
indirectly, for substantially the full term of the asset or liability. Level III: Prices or valuation techniques that require inputs that are both significant to the fair value
measurement and unobservable (i.e., supported with little or no market activity). An asset’s or liability’s level within the fair value hierarchy is based on the lowest level of input that is significant to the fair value measurement. All securities available for sale are priced using pricing models, quoted prices of securities with similar characteristics or using discounted cash flows and therefore are classified in the level 2 hierarchy. For financial assets measured at fair value on a recurring basis, the fair value measurements by level within the fair value hierarchy used at December 31, 2016 and 2015 are as follows:
(Dollars in 000s) Level I Level II Level III TotalAssets measured on a recurring basis:
Available-for-sale securities:Certificates of deposit $ - $ 2,632 $ - $ 2,632 U.S. government agencies - 1,000 - 1,000 Obligations of states and political subdivisions - 12,881 - 12,881 Mortgage-backed securities in government-sponsored entities - 29,873 - 29,873
Total $ - $ 46,386 $ - $ 46,386
(Dollars in 000s) Level I Level II Level III TotalAssets measured on a recurring basis:
Available-for-sale securities:Certificates of deposit $ 2,629 $ $ 2,629 U.S. government agencies - 1,990 - 1,990 Obligations of states and political subdivisions - 13,159 - 13,159 Mortgage-backed securities - in government-sponsored entities 30,362 30,362
Total $ - $ 48,140 $ - $ 48,140
As of December 31, 2015
As of December 31, 2016
Certain financial assets are measured at fair value on a nonrecurring basis in accordance with accounting principles generally accepted in the United States of America. Adjustments to the fair value of these assets usually result from the application of lower-of-cost-or-market accounting or write-downs of individual assets.
38

39
J o n e s t o w n B a n k & T r u s t C o .
18. Fair Value (Continued)
The following describes the valuation techniques used by the Bank to measure certain financial assets recorded at fair value on a nonrecurring basis in the financial statements. Other Real Estate Owned Certain assets such as other real estate owned (OREO) acquired through foreclosure are initially recorded at fair value of the property at the transfer date less estimated selling costs. At or near the time of foreclosure, real estate appraisals are obtained on the properties acquired through foreclosure. The real estate is then valued and subsequently carried at the lesser of the appraised value less estimated selling costs or the loan balance, including interest receivable at the time of foreclosure. Appraised values are typically determined utilizing an income or market valuation approach based on an appraisal conducted by an independent, licensed appraiser outside of the Bank using observable market data or on a recent sale offer (Level 2). However, if the appraisal for the acquired property is over two years old, then the fair value is considered Level 3. The estimate of costs to sell the property is based on historical transactions of similar holdings. There were three OREO properties with write-downs during the year ended December 31, 2016 and one with a write-down during the year ended December 31, 2015. Impaired Loans Loans of a commercial nature are designated as impaired when, in the judgment of management based on current information and events, it is probable that all amounts due will not be collected according to the contractual terms of the loan agreement. The measurement of loss associated with impaired loans can be based on either the observable market price of the loan, the fair value of the collateral (if collateral dependent), or the present value of expected future cash flows. Fair value is measured based on the value of the collateral securing the loan less estimated costs to sell or the expected present value of future cash flows. Collateral may be in the form of real estate or business assets including equipment, inventory, and accounts receivable. The value of the collateral is typically determined utilizing an income or market valuation approach based on an appraisal conducted by an independent, licensed appraiser outside of the Bank using observable market data (Level 2). However, if the collateral is a house or building in the process of construction or if an appraisal of the real estate property is stale, then the fair value is considered Level 3. The value of business equipment is based upon an outside appraisal if deemed significant, or the net book value of the applicable business’ financial statements if not considered significant using observable market data. Likewise, values for inventory and accounts receivable collateral are based on financial statement balances or aging reports (Level 3). Impaired loans with an allocation to the allowance for loan losses are measured at fair value on a nonrecurring basis. Any fair value adjustments are recorded in the period incurred as provision for loan losses on the statements of income. The fair value of impaired loans reported below is based on the total impaired loans with a specific allowance for loan loss allocation less the total allocations for such loans, while the fair value measurement level is based on the age of the underlying appraisal of the collateral securing the loans. Specific allocations to the allowance for loan losses for impaired loans were $150,000 and $263,000 at December 31, 2016 and 2015, respectively. There was $385,000 of loans held for sale with a fair value of $386,000 as of December 31, 2016. The fair value is determined by pricing of similar loans in the secondary market (Level 2). There were no loans held for sale as of December 31, 2015.
39
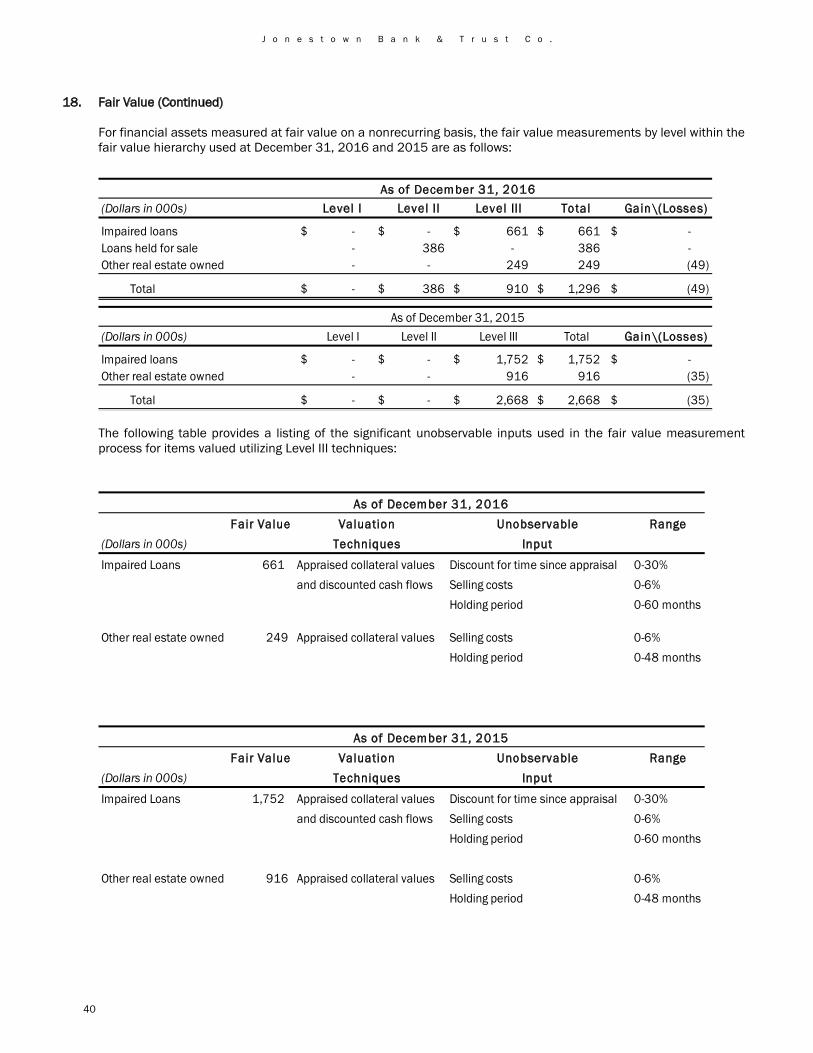
40
J o n e s t o w n B a n k & T r u s t C o .
18. Fair Value (Continued)
For financial assets measured at fair value on a nonrecurring basis, the fair value measurements by level within the fair value hierarchy used at December 31, 2016 and 2015 are as follows:
(Dollars in 000s) Level I Level II Level III Total Gain\(Losses)
Impaired loans $ - $ - $ 661 $ 661 $ - Loans held for sale - 386 - 386 - Other real estate owned - - 249 249 (49)
Total $ - $ 386 $ 910 $ 1,296 $ (49)
(Dollars in 000s) Level I Level II Level III Total Gain\(Losses)
Impaired loans $ - $ - $ 1,752 $ 1,752 $ - Other real estate owned - - 916 916 (35)
Total $ - $ - $ 2,668 $ 2,668 $ (35)
As of December 31, 2015
As of December 31, 2016
The following table provides a listing of the significant unobservable inputs used in the fair value measurement process for items valued utilizing Level III techniques:
Fair Value Valuation Unobservable Range(Dollars in 000s) Techniques Input
Impaired Loans 661 Appraised collateral values Discount for time since appraisal 0-30%and discounted cash flows Selling costs 0-6%
Holding period 0-60 months
Other real estate owned 249 Appraised collateral values Selling costs 0-6%Holding period 0-48 months
Fair Value Valuation Unobservable Range(Dollars in 000s) Techniques Input
Impaired Loans 1,752 Appraised collateral values Discount for time since appraisal 0-30%and discounted cash flows Selling costs 0-6%
Holding period 0-60 months
Other real estate owned 916 Appraised collateral values Selling costs 0-6%Holding period 0-48 months
As of December 31, 2016
As of December 31, 2015
40

41
J o n e s t o w n B a n k & T r u s t C o .
19. Fair Values of Financial Instruments The following information should not be interpreted as an estimate of the fair value of the entire Bank, since a fair value calculation is only provided for a limited portion of the Bank’s assets and liabilities. Due to a wide range of valuation techniques and the degree of subjectivity used in making the estimates, comparisons between the Bank’s disclosures and those of other companies may not be meaningful. The following methods and assumptions were used to estimate the fair values of the Bank’s financial instruments at December 31, 2016 and 2015.
Cash and due from banks and interest bearing balances with other banks The carrying amounts reported in the balance sheet for cash and short-term instruments approximate those assets’ fair values. Securities available for sale and held to maturity The Bank utilizes a third-party source to determine the fair value of its securities available for sale (carried at fair value) and held to maturity (carried at amortized cost). The methodology consists of pricing models based on asset class and includes available trade, bid, other market information, broker quotes, proprietary models, various databases and trading desk quotes, some of which are heavily influenced by unobservable inputs. The carrying amount of time certificates of deposit approximates its fair value. Loans held for sale The carrying amount of loans held for sale approximates its fair value. Loans receivable For variable rate loans that reprice frequently and with no significant change in credit risk, fair values are based on carrying values. The fair values for other loans (e.g., residential real estate and consumer loans) are estimated using discounted cash flow analyses, using interest rates currently being offered for loans with similar terms to borrowers of similar credit quality. Restricted investment in Bank stock The carrying amount of restricted investment in Bank stock approximates fair value. Accrued interest receivable and payable The carrying amount of accrued interest receivable and accrued interest payable approximates its fair value. Mortgage servicing rights The fair value of mortgage servicing rights is based on observable market prices, when available, or the present value of expected future cash flows. Deposits The fair values disclosed for demand deposits (e.g., interest and noninterest checking, passbook savings, and money market accounts) are, by definition, equal to the amount payable on demand at the reporting date (i.e., their carrying amounts). Fair values for fixed-rate certificates of deposit are estimated using a discounted cash flow calculation that applies interest rates currently being offered on certificates to a schedule of aggregated expected monthly maturities on time deposits. Short-term debit The amounts of short-term debt approximate their fair value. Long-term debt Fair values of long-term debt are estimated using discounted cash flow analysis, based on rates currently available to the Bank for advances from the FHLB with similar terms and remaining maturities. Off-balance sheet financial instruments Fair values for the Bank’s off-balance sheet financial instruments (lending commitments and letters of credit) are based on fees currently charged to enter into similar agreements, taking into account the remaining terms of the agreements and the counterparties’ credit standing.
41

42
J o n e s t o w n B a n k & T r u s t C o .
19. Fair Values of Financial Instruments (Continued) The estimated fair values of the Bank’s financial instruments were as follows at December 31, 2016 and 2015:
Carrying Fair(Dollars in 000s) Amount ValueFinancial assets:
Cash and due from banks $ 3,152 3,152 Interest Bearing Balnces with other Banks 14,081 14,081 Available-for-sale securities 46,386 46,386 Held-to-maturity securities 863 865 Loans held for sale 385 386 Net loans 417,028 423,803 Accrued interest receivable and dealer reserve 2,358 2,358 Restricted investment in Bank stock 1,510 1,510 Mortgage servicing rights 261 581
F inancial l iabil ities:Deposits $ 432,714 432,109 Short-term debt 6,000 6,000 Long-term debt 17,274 17,826 Accrued interest payable 125 125
2016
Carrying Fair(Dollars in 000s) Amount ValueFinancial assets:
Cash and due from banks $ 4,354 4,354 Interest Bearing Balnces with other Banks 8,978 8,978 Available-for-sale securities 48,140 48,140 Held-to-maturity securities 475 478 Net loans 397,697 407,641 Accrued interest receivable and dealer reserve 2,666 2,666 Restricted investment in Bank stock 2,194 2,194 Mortgage servicing rights 279 613
F inancial l iabil ities:Deposits $ 398,638 398,836 Short-term debt 17,947 17,949 Long-term debt 21,033 22,152 Accrued interest payable 124 124
2015
20. Contingencies
The Bank is subject to claims and lawsuits which arise primarily in the ordinary course of business. Based on information presently available and advice received from legal counsel representing the Bank in connection with any such claims and lawsuits, it is the opinion of management that the disposition or ultimate determination of any such claims and lawsuits will not have a material adverse effect on the financial position, results of operations or liquidity of the Bank.
42

43
J o n e s t o w n B a n k & T r u s t C o .
21. Subsequent Events Management has reviewed events occurring through February 22, 2017, the date the financial statements were available to be issued and one subsequent event occurred requiring disclosure. The Bank purchased land in Manheim, Pennsylvania for a new branch location for $1,500,000 on January 20, 2017. No other subsequent events occurred requiring recognition in the financial statements.
43

44
J o n e s t o w n B a n k & T r u s t C o .
This page intentionally blank.

Breaking Ground at the Manheim LocationFrom left: Eric A. Trainer, Director; Jeffrey L. Bohn, Vice Chairman of the Board; Edward L. Anspach, Second Vice Chairman and
Secretary of the Board; Glenn T. Wenger, Director; Troy A. Peters, President and CEO; Brian R. Miller, Director; Timothy D. Gingrich, Vice President of Operations; Richard J. Newmaster Jr., Chairman of the Board; Richard M. Rollman, Vice President of Lending;
DeeAnn D. Carpenter, Commercial Lender and Manheim Branch Manager; C. William Roth, CFO; Sallie A. Neuin, Director; and Terry L. Resanovich, Vice President and Senior Trust Officer of JBT Financial Services.
Architect’s Rendering of the Manheim Of f iceThe new office will be completed in late spring of 2017 at Penn Towne Center on Route 72, located next to the new Sheetz store already in business. This milestone was marked by an official Groundbreaking Ceremony held Monday,
December 12, 2016, at the site of the new branch. This is JBT’s thirteenth community office, and its second full-service banking location in Lancaster County.

Jonestown 2 West Market Street P.O. Box 717 Jonestown, PA 17038 717-865-2112
Investor Relations 717-865-4246
Grantville 10103 Jonestown Road P.O. Box 180 Grantville, PA 17028 717-469-0623
Ebenezer 1725 Route 72 North Lebanon, PA 17046 717-274-5421
Lebanon 122 Bowman Street Lebanon, PA 17046 717-273-0405
Newmanstown 25 East Main Street Newmanstown, PA 17073 610-589-1234
Cleona 421 East Penn Avenue Cleona, PA 17042 717-279-7655
Quentin Road 1765 Quentin Road Lebanon, PA 17042 717-279-7720
Palmyra 2 East Main Street Palmyra, PA 17078 717-641-0032 Northside Commons 101 Northside Commons Palmyra, PA 17078 717-838-2265 Ephrata 1001 Sharp Avenue Ephrata, PA 17522 717-733-5281 Cornwall Manor 1 Boyd Street P.O. Box 125 Cornwall, PA 17016 717-769-2818 Lebanon Valley Brethren Home 1200 Grubb Rd. Palmyra, PA 17078 717-838-7000
Manheim (Coming Soon) 1211 Lancaster Rd. Manheim, PA 17545
001CSN29A8
bankjbt.comThis statement has not been reviewed, or confirmed for accuracy or relevance, by the Federal Deposit Insurance Corporation.