a comparative analysis of selection schemes used …sushil/class/gas/papers/select.pdfa comparative...
TRANSCRIPT

A Comparative Analysis of Selection SchemesUsed in Genetic Algorithms
David E. Goldberg and Kalyanmoy DebDepartment of General Engineering
University of Illinois at Urbana-Champaign117 Transportation Building
104 South MathewsUrbana, IL 61801-2996
Abstract
This paper considers a number of selection schemes commonly used inmodern genetic algorithms. Specifically, proportionate reproduction, rank-ing selection, tournament selection, and Genitor (or «steady state") selec-tion are compared on the basis of solutions to deterministic difference ordifferential equations, which are verified through computer simulations.The analysis provides convenient approximate or exact solutions as wellas useful convergence time and growth ratio estimates. The paper rec-ommends practical application of the analyses and suggests a number ofpaths for more detailed analytical investigation of selection techniques.
Keywords: proportionate selection, ranking selection, tournament selection, Gen-itor, takeover time, time complexity, growth ratio.
Introduction1
Many claims and counterclaims have been lodged regarding the superiority of thisor that selection scheme in genetic algorithms (GAs), but most of these are basedon limited (and uncontrolled) simulation experience; surprisingly little analysis hasbeen performed to understand relative expected fitness ratios, convergence times, orthe functional forms of selective convergence. This paper seeks to partially alleviatethis dearth of quantitative information by comparing the expected performance of

Goldberg and Deb
70 four commonly used selection schemes:
1. proportionate reproduction;
2. ranking selection;
3. tournament selection;
4. Genitor (or "steady state") selection.
Specifically, deterministic finite difference equations are written that describe thechange in proportion of different classes of individual, assuming fixed and identicalobjective function values within each class. These equations are solved explicitlyor approximated in time using integrable ordinary differential equations. Thesesolutions are shown to agree well with computer simulations, and linear ranking(Baker, 1985) and binary tournament selection (Brindle, 1981) are shown to giveidentical performance in expectation. Moreover, ranking and tournament selectionare shown to maintain strong growth under normal conditions, while proportionateselection without scaling is shown to be less effective in keeping a steady pressuretoward convergence. Whitley's (1989) Genitor or "steady state" (Syswerda, 1989)selection mechanism is also examined and found to be a simple combination of blockdeath and birth via ranking. Analysis of this overlapping population scheme showsthat the convergence results observed by Whitley may be most easily explained bythe unusually high growth ratio Genitor achieves as compared to other schemes ona generational basis. The analysis also suggests that the premature convergencecaused by imposing such high growth ratios is one of the reasons Genitor requiresother fixes such as large population sizes or multiple populations.
In the remainder, the fundamental equation of population dynamics-the birth,life, and death equation-is described, and specific equations are written, solved,and compared to simulation results for each of the selection schemes. Differentschemes are then compared and contrasted, and the use of these analyses in practicalimplementations is discussed. The paper concludes by briefly recommending moredetailed stochastic analyses and another look at what the k-armed bandit problemcan teach us about selection.
2 Selection: A Matter of Birth, Life, and Death
The derivation of Holland's (1975) schema theorem starts by calculating the ex-pected number of copies of a schema under selection alone. The calculation is es-sentiallya continuity or conservation of individuals' relationships, where the sourcesand sinks of a particular class of individual are all accounted. Under selection alone,indi vid uals can only do one of three things: they may be born, they may live, or theymay die. If we consider these events to be moved along synchronously, time step bytime step, the following general birth, life, and death equation may be written:
(1)mi,t+l = mi,t + mi,t,b -mi,t,d,
where m is the number of individuals, the subscript i identifies the class of indi-vidual with common objective function value Ii, the subscript t is a time index(individual or generational), the subscript b signifies individuals being born, thesubscript d signifies dying individuals, and the lack of a b or a d subscript signifies

A Comparative Analysis of Selection Schemes
living individuals. In the usual nonoverlapping population model, the number ofindividuals dying in a generation is assumed to equal the number of living indi-viduals, mi,t,d = mi,t, and the whole matter hinges around the number of births:mi,t+l = mi,t,b. Careful consideration of birth, life, and death will become moreimportant when we analyze an overlapping population model.
The analysis may also be performed by calculating the expected proportions Pi,t+lrather than absolute numbers mi,t+l:
p'. 1 -p'. + p'. b -p. d (2)I,t+ -I,t I,t, I,t, ,
where the proportion P is obtained by dividing the class count m by the totalnumber of individuals in the population at that time. Here the subscripts band dare used as before to denote birth and death respectively.
In the sections that follow, specific equations are written and solved for each of theselection schemes mentioned above.
Proportionate Reproduction3
The name proportionate reproduction describes a group of selection schemes thatchoose individuals for birth according to their objective function values f. In theseschemes, the probability of selection p of an individual from the ith class in the tthgeneration is calculated as
.-Ii (3)Pl,t -,",,1: m- 1"/ -'L.,j=l :l.t 1
where k classes exist and the total number of individuals sums to n. Variousmethods have been suggested for sampling this probability distribution, includ-ing Monte Carlo or roulette wheel selection (De Jong, 1975), stochastic remainderselection (Booker, 1982; Brindle, 1981), and stochastic universal selection (Baker,1987; Grefenstette & Baker, 1989). As we are uninterested here in stochastic differ-ences, these schemes receive identical analytical treatment when we calculate their
expected performance.If we consider a nonoverlap ping population of constant size n and assume that nselections are made each generation according to the distribution of equation 3, itis a straightforward matter to calculate the expected number of copies of the ithclass in the next generation:
mi,t .n .Pitt;-mi,t+lIimi t _I-
.t
where it = L mi,tfi/n is the average function value of the current generation. Thisequation may be written in proportion form by dividing by the population size:
IiPOt-=-I, ItPi,t+l
This equation is solved explicitly in the next section.

72
~.?-Q.9
I.,oS'0~~g...0.
Figure 1: Various differential and difference equation solutions agree well with a repre-sentative computer simulation of proportionate reproduction using stochastic universalselection with two alternatives (r = 11/ h = 1.5).
Solving the proportionate reproduction equation
3.1
The proportionate reproduction equation (equation 5) may be solved quite directlyafter an interesting fact is noted. Imagine that a population of individuals growsaccording to the uncoupled, exponential growth equations: mi,t+l = mi,t/i. If thegrowth of the proportion of individuals is calculated by dividing through by thetotal population size at generation t + 1, we note that the resulting equation forthe proportions is identical to that used under the assumption of a fixed populationSize:
j -m- t f -p-tI I, I I,=
Lj fjmj,t Lj fjPj,t
f -m- t, "
Lj mj,t+lPi,t+l
Since the uncoupled equations may be solved directly (mi,t = ffmi,o) the impliedproportion equations can also be solved without regard for coupling. Substitut-ing the expression for m at generation t and dividing numerator and denominatorthrough by the total population size at that time yields the exquisitely simple so-lution:
If Pi,OPi,t = '"" . f ~ p. .(7)L..-J J 1,0
The solution at some future generation goes as the computation over a single gener-ation except that power functions of the objective function values are used insteadof the function values themselves. This solution agrees with Ankenbrandt's (1990)solution for k = 2, but the derivation of above is more direct and applies to k
alternatives without approximation.
A Comparative Analysis of Selection Schemes
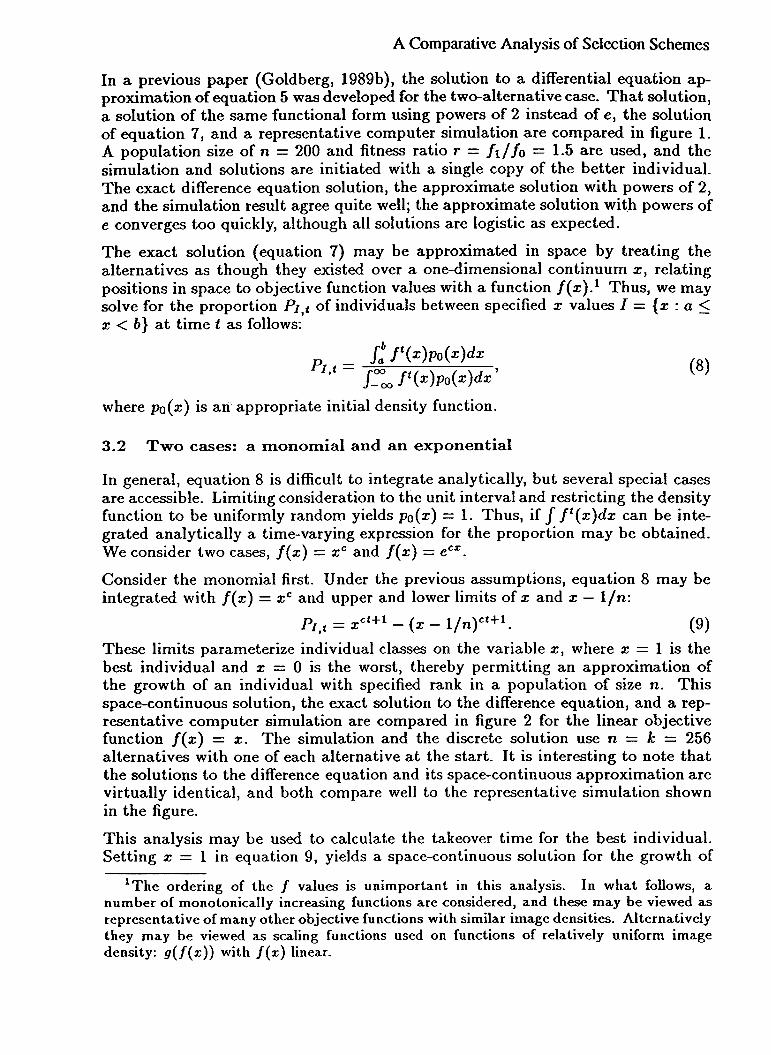
In a previous paper (Goldberg, 1989b), the solution to a differential equation ap-proximation of equation 5 was developed for the two-alternative case. That solution,a solution of the same functional form using powers of 2 instead of e, the solutionof equation 7, and a representative computer simulation are compared in figure 1.A population size of n = 200 and fitness ratio r = 11/10 = 1.5 are used, and thesimulation and solutions are initiated with a single copy of the better individual.The exact difference equation solution, the approximate solution with powers of 2,and the simulation result agree quite well; the approximate solution with powers ofe converges too quickly, although all solutions are logistic as expected.
The exact solution (equation 7) may be approximated in space by treating thealternatives as though they existed over a one-dimensional continuum x, relatingpositions in space to objective function values with a function l(x).l Thus, we maysolve for the proportion PI.t of individuals between specified x values I = {x : a ::;:x < b} at time t as follows:
(8)
p -J: ft(x)po(x)dxl,t -J~oo ft(x)po(x)dx'
where Po (x) is an appropriate initial density function.
Two cases: a monomial and an exponential
3.2
In general, equation 8 is difficult to integrate analytically, but several special casesare accessible. Limiting consideration to the unit interval and restricting the densityfunction to be uniformly random yields po(x) = 1. Thus, if f Jt(x)dx can be inte-grated analytically a time-varying expression for the proportion may be obtained.We consider two cases, J(x) = XC and J(x) = eC.t:.
Consider the monomial first. Under the previous assumptions, equation 8 may beintegrated with J(x) = XC and upper and lower limits of x and x -l/n:
PI,t = xct+l -(x -l/n)ct+l. (9)
These limits parameterize individual classes on the variable x, where x = 1 is thebest individual and x = 0 is the worst, thereby permitting an approximation ofthe growth of an individual with specified rank in a population of size n. Thisspace-continuous solution, the exact solution to the difference equation, and a rep-resentative computer simulation are compared in figure 2 for the linear objectivefunction J( x) = x. The simulation and the discrete solution use n = k = 256alternatives with one of each alternative at the start. It is interesting to note thatthe solutions to the difference equation and its space-continuous approximation arevirtually identical, and both compare well to the representative simulation shownin the figure.
This analysis may be used to calculate the takeover time for the best individual.Setting x = 1 in equation 9, yields a space-continuous solution for the growth of
IThe ordering of the f values is unimportant in this analysis. In what follows, anumber of monotonically increasing functions are considered, and these may be viewed asrepresentative of many other objective functions with similar image densities. Alternativelythey may be viewed as scaling functions used on functions of relatively uniform imagedensity: g(f(x)) with f(x) linear.

Goldberg and Deb
74
i0~~
0
oS0
g
"[£
Figure 2: A comparison of the discrete difference equation solution, the approximatecontinuous solution, and a representative simulation of SUS proportionate reproductionfor the function f(x) = x shows substantial agreement between simulation and eithermodel. The exact solution to the difference equation and the space-continuous solutionare virtually identical.
the best class:ct+ln-l
n
p'
t 1--
Setting this proportion equal to !!=l., we calculate the time when the populationn
contains n -1 best individuals, the takeover time t.:
ct. + 1 = lnfY(n_1\11) ' (11)1 -.og,n-~1
logn
As the exponent on the monomial increases, the takeover time decreases correspond-ingly. This helps explain why a number of investigators have adopted polynomialscaling procedures to help speed GA convergence (Goldberg, 1989a). The expres-sion 1_10;(,,-11 may be simplified at large n. Expanding log(n -1) in a Taylor series
J. -1';",'
about the value n, keeping the first two terms, and substituting into the expressionyields 1-10:(,,-11 ~ n Inn, the approximation improving with increasing n. Using
J. -1';",'
this approximation, we obtain the takeover time approximation
1t. = -(nlnn -1) (12)
c
Thus, the takeover time for a polynomially distributed objective function isO(n logn). It is interesting to compare this takeover time to that for an expo-nentially distributed (or exponentially scaled) function.

A Comparative Analysis of Selection Schemes
An exponential objective function may be considered similarly. Under the previousassumptions, equation 8 may be integrated using f(x) = eC,1; and the same limits ofintegration as before:
ecz:t(l -e-ct/n)PI,t = ct 1 \.LUje -
Considering the best group (setting x = 1) and solving for the takeover time (thetime when the proportion of the best group equals ~) yields the approximateequation as follows:
1t. = -n Inn. (14)c
It is interesting that under the unit interval consideration, both a polynomiallydistributed function and an exponentially distributed function have the same com-putational speed of convergence.
Time complexity of proportionate reproduction3.3
The previous estimates give some indication of how long a G A will continue untilit converges substantially. Here, we consider the time complexity of the selectionalgorithm itself per generation. We should caution that it is possible to place toomuch emphasis on the efficiency of implementation of a set of genetic operators.After all, in most interesting problems the time to evaluate the function is muchgreater than the time to iterate the genetics, t J ~ tga, and fiddling with operatortime savings is unlikely to payoff. Nonetheless, if a more efficient operator can beused without much bother, why not do so?
Proportionate reproduction can be implemented in a number of ways. The simplestimplementation (and one of the earliest to be used) is to simulate the spin of aweighted roulette wheel (Goldberg, 1989a). If the search for the location of thechosen slot is performed via linear search from the beginning of the list, each selec-tion requires O(n) steps, because on average half the list will be searched. Overall,roulette wheel selection performed in this method requires 0(n2) steps, because ina generation n spins are required to fill the population. Roulette wheel selectioncan be hurried somewhat, if a binary search (like the bisection method in numer-ical methods) is used to locate the correct slot. This requires additional memorylocations and an O( n) sweep through the list to calculate cumulative slot totals,but overall the complexity reduces to O( n log n), because binary search requiresO(log n) steps per spin and n spins.
Proportionate reproduction can also be performed by stochastic remainder selec-tion. Here the expected number of copies of a string is calculated as mi = li, and
the integer portions of the count are assigned deterministically. The remaind~rs arethen used probabilistically, to fill the population. If done without replacement, eachremainder is used to bias the flip of a coin that determines whether the structurereceives another copy or not. If done with replacement, the remainders are usedto size the slots of a roulette wheel selection process. The algorithm without re-placement is O(n), becau~e the deterministic assignment requires only a single pass(after the calculation of f, which is also O( n»), and the probabilistic assignment islikely to terminate in 0(1) steps. On the other hand, the algorithm when performed

Goldberg and Deb
76 with replacement takes on the complexity of the roulette wheel, because O( n) ofthe individuals are likely to have fractional parts to their m values.
Stochastic universal selection is performed by sizing the slots of a weighted roulettewheel, placing equally spaced markers along the outside of the wheel, and spinningthe wheel once; the number of copies an individual receives is then calculated bycounting the number of markers that fall in its slot. The algorithm is O( n), becauseonly a single pass is needed through the list after the sum of the function values iscalculated.
4
Baker (1985) introduced the notion of ranking selection to genetic algorithm prac-tice. The idea is straightforward. Sort the population from best to worst, assign thenumber of copies that each individual should receive according to a non-increasingassignment function, and then perform proportionate selection according to thatassignment. Some qualitative theory regarding such schemes was presented byGrefenstette and Baker (1989), but this theory provides no help in evaluating ex-pected performance. Here we analyze the performance of ranking selection schemessomewhat more quantitatively. A framework for analysis is developed by definingassignment functions and these are used to obtain difference equations for variousranking schemes. Simulations and various difference and differential solutions arethen compared.
Assignment functions: a framework for the analysis of ranking4.1
For some ranking scheme, we assume that an assignment function a has been devisedthat satisfies three conditions:
1. a(x) E R for x E [0,1].
2. a(x) ~ O.
3. f01 a( 1J)d1J = 1.
Intuitively, the product a(x )dx may be thought of as the proportion of individualsassigned to the proportion dx of individuals who are currently ranked a fraction xbelow the individual with best function value (here x = 0 will be the best and x = 1will be the worst to connect with Baker's formulation, even though this conventionis the opposite of the practice adopted in section 3).
With this definition, the cumulative assignment function /3 may be defined as theintegral of the assignment from the best (x = 0) to a fraction x of the current
population:
P(x) = fo~ a(~)d~. (15)
Analyzing the effect of ranking selection is now straightforward. Let Pi be theproportion of individuals who have function value better than or equal to Ii andlet Qi be the proportion of individuals who have function value worse than thatsame value. By the definitions above, the proportion of individuals assigned to the

A Comparative Analysis of Selection Schemes
proportion p..,t in the next generation is simply the cumulative assignment value ofthe current proportion:
Pi,t+l = fJ(Pi,t).
The complementary proportion may be evaluated as well:
Qi,t+l = 1 -{3(Pi,t) = 1 -{3(1 -Qi,t). (17)
In either case, the forward proportion is only a function of the current value and hasno relation to the proportion of other population classes. This contrasts stronglyto proportionate reproduction, where the forward proportion is strongly influencedby the current balance of proportions and the distribution of the objective func-tion itself. This difference is one of the attractions of ranking methods in that aneven,
controllable pressure can be maintained to push for the selection of betterindividuals. Analytically, the independence of forward proportion makes it possibleto calculate the growth or decline of individuals whose objective function valuesform a convex set. For example, if PI represents the proportion of individuals withfunction value greater than or equal to 11 and Q2 represents the proportion of in-dividuals with proportion less than f2, the quantity 1 -PI -Q2 is the proportionof individuals with function value between 11 and 12-
Linear assignment and ranking
4.2
The most common form of assignment function is linear: a( x) = Co -Cl x. Requiringa non-negative function with non-increasing values dictates that both coefficientsbe greater than zero and that Co ~ Cl. Furthermore, the integral condition requiresthat Cl = 2(co -1). Integrating a yields P(x) = Cox -(co -l)x2. Substituting thecumulative assignment function into equation 16 yields the difference equation
Pi,t+l = Pi,t [co -(co -I)Pi,J. (18)
The equation is the well known logistic difference equation; however, the restrictionson the parameters preclude any of its infamous chaotic behavior, and its solutionmust stably approach the fixed point Pi = 1 as time goes on.
In general, equation 18 has no convenient analytical solution (other than that ob-tained by iterating the equation), but in one special case a simplified solution canbe derived. When Co = Cl = 2, the complementary equation simplifies as follows:
(19)Qi,t+l = 1 -{3(1 -Qi,t) = Ql,t,
Sol ving for Q at generation t yields the following:
Since Q = 1 -P, the solution for ~ may be obtained directly as
Calculating the takeover time by substituting initial and final proportions of !iand!!=-! respectively and simplifying yields the approximate equation t. = log n +log(ln "n), where log is taken base 2 and In is the usual natural logarithm.

Goldberg and Deb
78 Other cases of linear ranking may be evaluated by turning to the type of differen-tial equation analysis used elsewhere (Goldberg, 1989b). Approximating the finitedifference by its derivative in one step yields the logistic differential equation
d~.a = cPi(l -Pi), 11)1)\
dtwhere C = Co -1. Solving by elementary means, we obtain the solution
1Pi t = n .
.1 + l-ri,o e-ctp" not,
The solution overpredicts proportion early on, because of the error made by approx-imating the difference by the derivative. This error can be corrected approximatelyby using 2 in place of e in equation 23. In either approximation the takeover timemay be calculated in a straightforward manner:
2t* = -log(n -1), (24)
cwhere the logarithm should be taken base e in the case of the first approximationand base 2 in the case of the second.
The two differential equation solutions, the exact solution to the difference equation,and a representative simulation using stochastic universal selection are shown infigure 3 for the case of linear ranking with Co = Cl = 2. Here a population ofsize n = 256 is started with a single copy of the best individual. The differenceequation solution and the simulation are very close to one another as expected.The differential equation approximations have the correct qualitative behavior, butthe solution using e converges too rapidly, and the solution using 2 agrees well earlyon but takes too long once the best constituents become a significant proportion ofthe total population.
Time complexity of ranking procedures4.3
Ranking is a two-step process. First the list of individuals must be sorted, and nextthe assignment values must be used in some form of proportionate selection. Thecalculation of the time complexity of ranking requires the consideration of these
separate steps.
Sorting can be performed in O( n log n) steps, using standard techniques. Thereafter,we know from previous results that proportionate selection can be performed insomething between O(n) and O(n2). Here, we will assume that a method no worsethan O(n logn) is adopted, concluding that ranking has time complexity O(n logn).
Tournament Selection5
A form of tournament selection attributed to unpublished work by Wetzel wasstudied in Brindle's (1981) dissertation, and more recent studies using tournamentschemes are found in a number of works (Goldberg, Korb, & Deb, 1989; Muhlenbein,1990; Suh & Van Gucht, 1987). The idea is simple. Choose some number ofindividuals randomly from a population (with or without replacement), select the

A Comparative Analysis of Selection Schemes
i()8~.,oS0
8
I£
Figure 3: The proportion of individuals with best objective function value grows a.s a logis-tic function of generation under ranking selection. A representative simulation using linearranking and stochastic universal selection agrees well with the exact difference equationsolution (co = Cl = 2). The differential equation approximations are too rapid or too slowdepending upon whether exponentiation is performed base e or base 2.
best individual from this group for further genetic processing, and repeat as oftenas desired (usually until the mating pool is filled). Tournaments are often heldbetween pairs of individuals (tournament size s = 2), although larger tournamentscan be used and may be analyzed. We start our analysis by considering the binarycase and later extend the analysis to general s-ary tournaments.
5.1
2Binary tournaments: s
Here we analyze the effect of a probabilistic form of binary tournament selection.2In this variant, two individuals are chosen at random and the better of the twoindividuals is selected with fixed probability p, 0.5 < p ~ 1. Using the notation ofsection 4, we may calculate the proportion of individuals with function value betterthan or equal to Ii, the proportion at the next generation quite simply:
Pi,t+l = p[2Pi,t(1 -Pi,t) + Pi:t] + (1 -p) Pi:t 0 (25)
Collecting terms and simplifying yields the following:
(2pPi,t+l 2pPi,t
2The probabilistic variation was brought to our attention by Donald R. Jones (personalcommunication, April 20, 1990) at General Motors Research Laboratory. We analyze thisvariant, because the deterministic version is a special case and because the probabilisticversion can be made to agree in expectation with ranking selection regardless of co.

Goldberg and Deb
80 Letting 2p = Co and comparing to equation 18, we note that the two equations areidentical. This is quite remarkable and says that binary tournament selection andlinear ranking selection are identical in expectation. The solutions of the previoussection all carry forward to the case of binary tournament selection as long as thecoefficients are interpreted properly (2p = Co and c = 2p -1).
Simulations of tournament selection agree well with the appropriate difference anddifferential equation solutions, but we do not examine these results here, because theanalytical models are identical to those used for linear ranking, and the tournamentselection simulation results are very similar to those presented for linear ranking.Instead, we consider the effect of using larger tournaments.
5.2 Larger tournaments
To analyze the performance of tournament selection with any size tournament,it is easier to consider the doughnut hole (the complementary proportion) ratherthan the doughnut itself (the primary proportion). Considering a deterministictournament3 of size s and focusing on the complementary proportion Qi, a singlecopy will be made of an individual in this class only when all s individuals in acompetition are selected from this same lowly group:
Qi,t+l = Qi,t, (27)
from which the solution follows directly:
Qi,t = Qi,fO' (28)
Recognizing that Pi = l-Qi, we may solve for the primary proportion of individualsas follows:
Solving for the takeover time yields an asymptotic expression that improves with..Increasmg n:
1t. = _1 [Inn + In(lnn)]. (30)ns
This equation agrees with the previous calculation for takeover time in the Co = 2solution to linear ranking selection when s = 2. Of course, binary tournamentselection and linear ranking selection (co = 2) are identical in expectation, and thetakeover time estimates should agree.
The difference equation model and a representative computer simulation are com-pared in figure 4 for a tournament of size s = 3. As before, a solution and arepresentative simulation are run with n = k = 256, starting with a single copyof each alternative. The representative computer simulation shown in the figurematches the difference equation solution quite well.
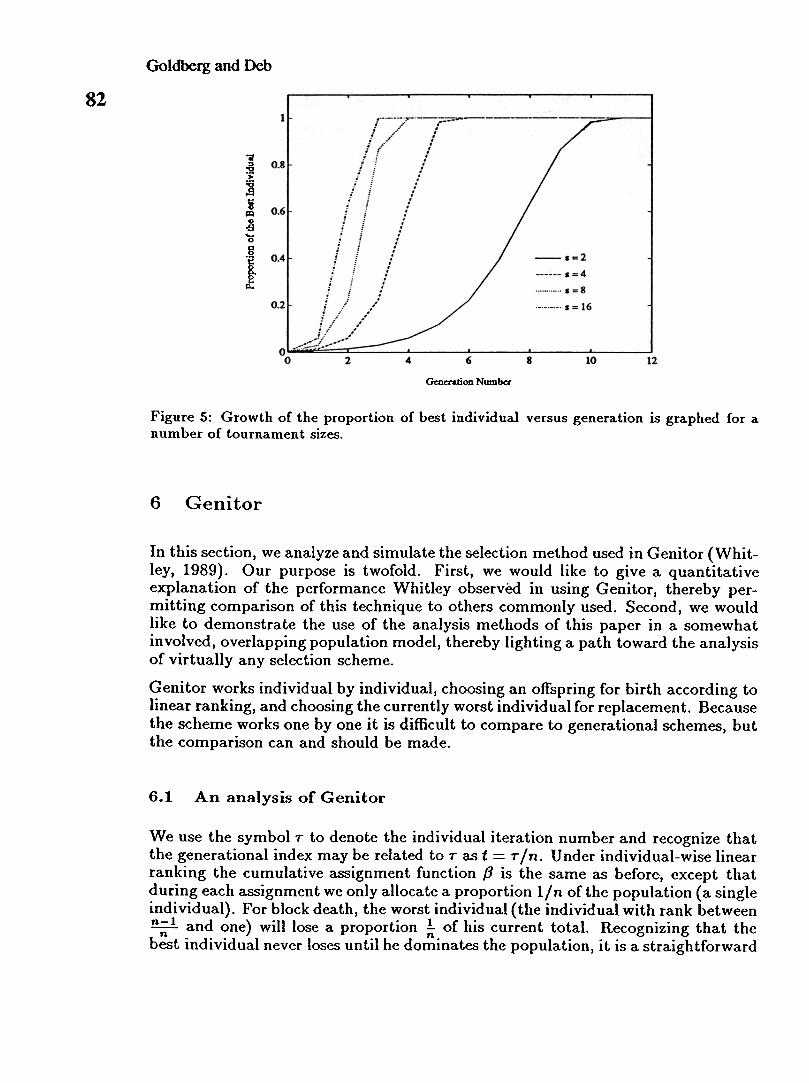
Figure 5 compares the growth of the best individual starting with a proportion 2kusing tournaments of sizes s = 2, 4, 8, 16. Note that as the tournament size increases,the convergence time is cut by the ratio of the logarithms of the tournament sizesas predicted.
3 Here we consider a deterministic competition, because the notion of a probabilistic
tournament does not generalize from binary to s-ary tournaments easily.

A Comparative Analysis of Selection Schemes
i0~~0
oS...0
B
"ien,
Figure 4: A comparison of the difference equation solution and a representative computersimulation with a ternary tournament (s = 3) demonstrates good agreement.
5.3
Time complexity of tournament selection
The calculation of the time complexity of tournament selection is straightforward.Each competition in the tournament requires the random selection of a constantnumber of individuals from the population. The comparison among those individu-als can be performed in constant time, and n such competitions are required to filla generation. Thus, tournament selection is D( n).
We should also mention that tournament selection is particularly easy to imple-ment in parallel. All the complexity estimates given in this paper have been foroperation on a serial machine, but all the other methods discussed in the paperare difficult to parallelize, because they require some amount of global information.Proportionate selection requires the sum of the function values. Ranking selection(and Genitor, as we shall soon see) requires access to all other individuals and theirfunction values to achieve global ranking. On the other hand, tournament selectioncan be implemented locally on parallel machines with pairwise or s-wise commu-nication between different processors the only requirement. Muhlenbein (1989)provides a good example of a parallel implementation of tournament selection. Healso claims to achieve niching implicitly in his implementation, but controlled ex-periments demonstrating this claim were not presented nor were analytical resultsgiven to support the observation. Some caution should be exercised in making suchclaims, because the power of stochastic errors to cause a population to drift is quitestrong and is easy to underestimate. Nonetheless, the demonstration of an efficientparallel implementation is useful in itself.
Goldberg and Deb
82
..:s:g>
]i~.,oS0
i
Generation Numb«
Figure 5: Growth of the proportion of best individual versus generation is graphed for anumber of tournament sizes.
6 Genitor
In this section, we analyze and simulate the selection method used in Genitor (Whit-ley, 1989). Our purpose is twofold. First, we would like to give a quantitativeexplanation of the performance Whitley observed in using Genitor, thereby per-mitting comparison of this technique to others commonly used. Second, we wouldlike to demonstrate the use of the analysis methods of this paper in a somewhatinvolved, overlapping population model, thereby lighting a path toward the analysisof virtually any selection scheme.
Genitor works individual by individual, choosing an offspring for birth according tolinear ranking, and choosing the currently worst individual for replacement. Becausethe scheme works one by one it is difficult to compare to generational schemes, butthe comparison can and should be made.
6.1 An analysis of Genitor
We use the symbol T to denote the individual iteration number and recognize thatthe generational index may be related to T as t = Tin. Under individual-wise linearranking the cumulative assignment function fJ is the same as before, except thatduring each assignment we only allocate a proportion l/n of the population (a singleindividual). For block death, the worst individual (the individual with rank between~ and one) will lose a proportion ~ of his current total. Recognizing that thebest individual never loses until he dominates the population, it is a straightforward

A Comparative Analysis of Selection Schemes
i(3
'8~.,-fJ0
8
I1:
Figure 6: Comparison of the differen<;e equation solution, differential equation solution,and computer simulations of Genitor for the function f(x) = x, n = k = 256. Linearranking with C.o = 2 is used, and the individual iteration number (r) has been dividedby the population size to put the computations in terms of generations. Solutions to thedifference and differential equations are so close that they appear as a single line on theplot, and both compare well to the representative computer simulation shown.
matter to write the birth, life, and death equation for an iteration of the ith class:
PitT + {3(PitT )/n,PitT + {3(Pi,T )/n -(PitT
if p.. <!!-=!..',T -n I
otherwise.Pi,T+l =
-!!.=l
)n '
A simplified exact solution of this equation (other than by iteration) is nontrivial.Therefore, we approximate the solution by subtracting the proportion at generationT from both sides of the equation, thereafter approximating the finite difference bya time derivative. The resulting equation is logistic in form and has the followingsolution:
Pt = coPoecot. (32)Co + (co -l)Po(ecot -1)
Note that the class index i has been dropped and that the solution is now written interms of the generational index t, enabling direct comparisons to other generationalschemes. The difference equation (iterated directly), the differential equation solu-tion, and a representative computer simulation are compared in figure 6, a graphof the proportion of the best individual (n = k = 256) versus generation. It is in-teresting that the solution appears to follow exponential growth that is terminatedwhen the population is filled with the best individual. The solution is logistic, butits fixed point is P = ~, which can be no less than 2 (1 < Co 52). Thus, by thetime any significant logistic slowing in the rate of convergence occurs, the solutionhas already crashed into the barrier at P = 1.
Goldberg and Deb
To compare this scheme to other methods, it is useful to calculate the free orearly growth rate. Considering only linear terms in the difference equation, weobtain PT+l = (1 + ~ )PT. Over a generation n individual iterations are performed,obtaining Pn = (1 + ~)n Po, which approaches ecopo for moderate to large n. Thuswe note an interesting thing. Even if no bias is introduced in the ranked birthprocedure (if Co = 1), Genitor has a free growth factor that is no less than e.In other words, unbiased Genitor pushes harder than generation-based ranking ortournament selection, largely a result of restricting death to the worst individual.When biased ranking (co> 1) is used, Genitor pushes very hard indeed. Forexample, with Co = 2, the selective growth factor is e2 = 1.389. Such high growthrates can cover a host of operator losses, recalling that the net growth factor / isthe product of the growth factor obtained from selection alone 4> and the schemasurvival probability obtained by subtracting operator losses from one:
/ = 4> [1 -!] , (33)
84
where { = LIP {IP, the sum of the operator disruption probabilities. For exam-ple, with Co = 2 and 4> = 7.389, Genitor can withstand an operator loss of{ = 1 -~ = 0.865; such an allowable loss would permit the growth of buildingblocks wltt8aefining lengths roughly 87% of string length. Such large permissible er-rors, however, come at a cost of increased premature convergence, and we speculatethat it is precisely this effect that motivated Whitley to try large population sizesand multiple populations in a number of simulations. Large sizes slow things downenough to permit the growth and exchange of multiple building blocks. Parallel pop-ulations allow the same thing by permitting the rapid growth of the best buildingblocks within each subpopulation, with subsequent exchanges of good individualsallowing the cross of the best bits and pieces from each subpopulation. U nfortu-nately, neither of these fixes is general, because codings can always be imaginedthat make it difficult to cut and splice the correct pieces. Thus, it would appearthat there still is no substitute for the formation and exchange of tight building
blocks.Moreover, we find no support for the hypothesis that there is something specialabout overlapping populations. This paper has demonstrated conclusively thathigh growth rates are acting in Genitor; this factor alone can account for the ob-served results, and it should be possible to duplicate Whitley's results through theuse of any selection scheme with equivalent duplicative horsepower. We have notperformed these experiments, but the results of this paper provide the analyticaltools necessary to carry out a fair comparison. Exponential scaling with propor-tionate reproduction, larger tournaments, or nonlinear ranking should give resultssimilar to Genitor, if similar growth ratios are enforced and all other operators and
algorithm parameters are the same.
Genitor's takeover time and time complexity6.2The takeover time may be approximated. Since Genitor grows exponentially untilthe population is filled, the takeover time may be calculated from the equation!!.=!. = l-ecot.. Solving for the takeover time yields the following equation:
nn
(34:1-In(
n -1t. -Co
A Comparative Analysis of Selection Schemes
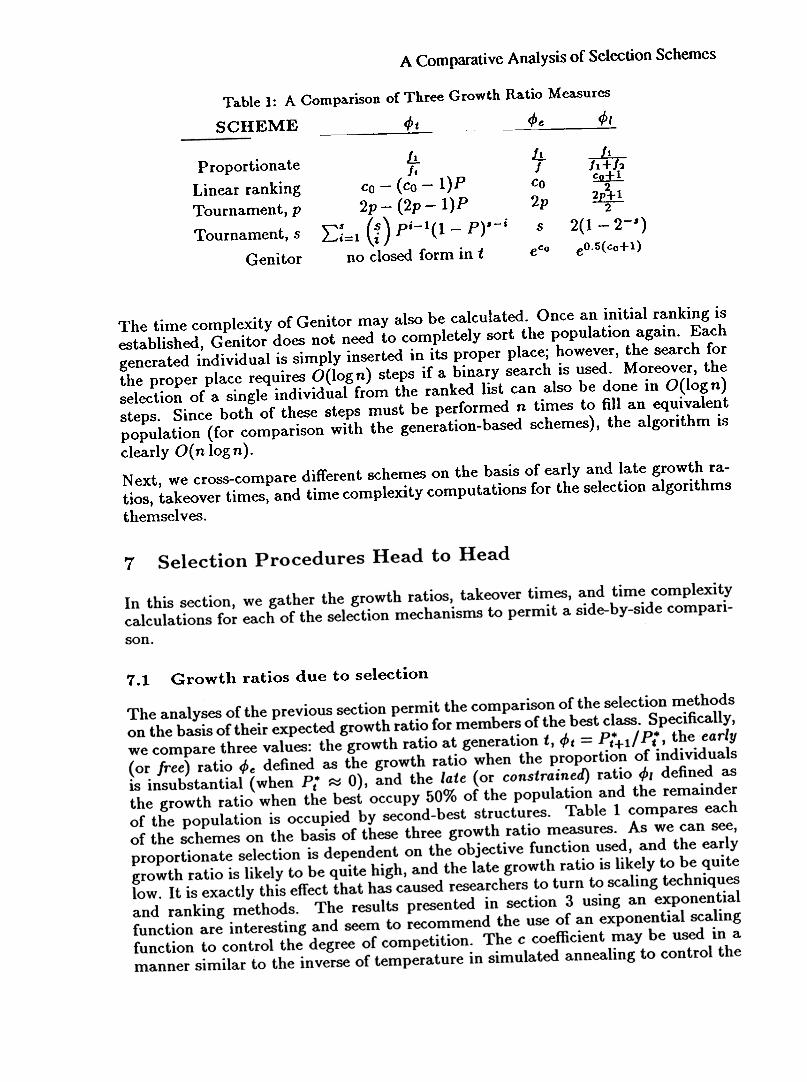
Table 1: A Comparison of Three Growth Ratio Measures
SCHEME 4>t 4>e 4>1
l!.J
Co
2p
s
eco
ProportionateLinear rankingTournament, pTournament, s
Genitor
-.lL-11+12~
2~2
2(1 -2-6)
eO.S(co+l)
.t!-Ic
Co -(co -l)P
2p -(2p -l)P
E~=l (i) pi-l(l -p)"-ino closed form in t
The time complexity of Genitor may also be calculated. Once an initial ranking isestablished, Genitor does not need to completely sort the population again. Eachgenerated individual is simply inserted in its proper place; however, the search forthe proper place requires O(logn) steps if a binary search is used. Moreover, theselection of a single individual from the ranked list can also be done in O(log n)steps. Since both of these steps must be performed n times to fill an equivalentpopulation (for comparison with the generation-based schemes), the algorithm is
clearly O(n logn).Next, we cross-compare different schemes on the basis of early and late growth ra-tios, takeover times, and time complexity computations for the selection algorithms
themselves.
7
Growth ratios due to selection
7.1

Goldberg and Deb
86 Table 2: A Comparison of Takeover Time Values
SCHEME t.
Proportionate XC
Proportionate ecxLinear ranking Co = 2
Linear ranking (cliff. eq.)Tournament pTournament s
Genitor
~(n Inn -1)!n In nC
logn + log(lnn)~ log(n -1 )co-1 '
same as linear ranking with Co = 2p_,1 [Inn + In(lnn)]n$ 1
-In(n -1)Co
accentuation of salient features (Goldberg, 1990).
As was mentioned earlier, linear ranking and binary tournament selection agree inexpectation, both allowing early growth ratios of between one and two, dependingon the adjustment of the appropriate parameter (co or p). Both achieve late ratiosbetween 1 and 1.5. Tournament selection can achieve higher growth ratios withlarger tournament sizes; the same effect can be achieved in ranking selection withnonlinear ranking functions, although we have not investigated these here. Genitorachieves early ratios between e and e2, and it would be interesting to compareGenitor selection with tournament selection or ranking selection with appropriatetournament size or appropriate nonlinear assignment function.
Takeover time comparison
Table 2 shows the takeover times calculated for each of the selection schemes. Otherthan the proportionate scheme, the methods compared in this paper, all converge insomething like O(log n) generations. This, of course, does not mean that real GAsconverge to global optima in that same time. In the setting of this paper, wherewe are doing nothing more than choosing the best from some fixed population ofstructures, we get convergence to the best. In a real GA, building blocks mustbe selected and juxtaposed in order to get copies of the globally optimal structure,and the variance of building block evaluation is a substantial barrier to convergence.Nonetheless, the takeover time estimates are useful and will give some idea how longa G A can be run before mutation becomes the primary mechanism of exploration.
Time complexity comparison
Table 3 gathers the time complexity calculations together. The best of the methodsare O(n), and it is difficult to imagine how fewer steps can be used since we mustselect n individuals in some manner. Of the O(n) methods, tournament selectionis the easiest to make parallel, and this may be its strongest recommendation, asGAs cry out for parallel implementation, even though most of us have had to makedo with serial versions. Whether paying the O( n log n) price of Genitor is worth itssomewhat higher later growth ratio is unclear, and the experiments recommendedearlier should be performed. Methods with similar early growth ratios and not-too-

A Comparative Analysis of Selection Schemes
Table 3: A Comparison of Selection Algorithm Time Complexity
SCHEME TIME COMPLEXITY
Roulette wheel proportionateRW proportionate w fbinary searchStochastic remainder proportionateStochastic universal proportionate
RankingTournament Selection
Genitor w fbinary search
O(n2)O(n logn)
O(n)O(n)
O( n In n)+ time of selectionO(n)
O(n logn)
different late growth ratios should perform similarly. Any such comparisons shouldbe made under controlled conditions where only the selection method is varied,however.
Selection:8 What Should We Be Doing?
This paper has taken an unabashedly descriptive viewpoint in trying to shed someanalytical light on various selection methods, but the question remains: how shouldwe do selection in GAs? The question is a difficult one, and despite limited empiricalsuccess in using this method or that, a general answer remains elusive.
Holland's connection (1973, 1975) of the k-armed bandit problem to the conflictbetween exploration and exploitation in selection still stands as the only sensi-ble theoretical abstraction of the general question, despite some recent criticism(Grefenstette & Baker, 1989). Grefenstette and Baker challenge the k-armed modelby posing a partially deceptive function, thereafter criticizing the abstraction be-cause the GA does not play the deceptive bits according to the early function valueaverages. The criticism is misplaced, because it is exactly such deceptive functionsthat the G A must playas a higher-order bandit (in a 3-bit deceptive subfunction,the GA must play the bits as an eight-armed bandit) and the schema theorem saysthat it will do so if the linkage is sufficiently tight. In other words, GAs will play thebandit problems at as high a level as they can (or as high a level as is necessary),and it is certainly this that accounts at least partially for the remarkable empiricalsuccess that many of us have enjoyed in using simple GAs and their derivatives.
Moreover, dismissing the bandit model is a mistake for another reason, because inso doing we lose its lessons about the effect of noise on schema sampling. Evenin easy deterministic problems-problems such as Li aiXi + b, ai, bE R, and Xi E{O, 1}-GAs can make mistakes, because alleles with small contribution to objectivefunction value (alleles with small ai) get fixed, a result of early spurious associationswith other highly fit alleles or plain bad luck. These errors can occur, because thevariation of other alleles (the sampling of the *'s in schemata such as **1**) is asource of noise as far as getting a particular allele set properly is concerned. Earlyon this noise is very high (estimates have been given in Goldberg, Korb, & Deb,1989), and only the most salient building blocks dare to become fixed. This fixationreduces the variance for the remaining building blocks, permitting less salient alleles

Goldberg and Deb
88 or allele combinations to become fixed properly. Of course, if along the way downthis salience ladder, the correct building blocks have been lost somehow (throughspurious linkage or cumulative bad luck), we must wait for mutation to restore them.The waiting time for this restoration is quite reasonable for low-order schemata butgrows exponentially as order increases.
Thinking of the convergence process in this way suggests a number of possible waysto balance or overcome the conflict between exploration and exploitation:
.Use slow growth ratios to prevent premature convergence.
.Use higher growth ratios followed by building block rediscovery through muta-tion.
.Permit localized differential mutation rates to permit more rapid restorationof building blocks.
.Preserve useful diversity temporally through dominance and diploidy.
.Preserve useful diversity spatially through niching.
.Eliminate building block evaluation noise altogether through competitive tem-plates.
Each of these is examined in somewhat more detail in the remainder of the section.
One approach to obtaining correct convergence might be to slow down convergenceenough so that errors are rarely made. The two-armed bandit convergence graphspresented elsewhere (Goldberg, 1989a) suggest that using convergence rates tunedto building blocks with worst function-difference-to-noise-ratio is probably too slowto be practical, but the idea of starting slowly and gradually increasing the growthratios makes some sense in that salient building blocks will be picked off with aminimum of pressure on not-so-salient allele combinations. This is one of the fun-damental ideas of simulated annealing, but simulated annealing suffers from its lackof a population and its lack of interesting discovery operators such as recombination.The connection between simulated annealing and GAs has become clearer recently(Goldberg, 1990) through the invention of Boltzmann tournament selection. Thismechanism stably achieves a Boltzmann distribution across a population of strings,thereby allowing a controllable and stable distribution of points to be maintainedacross both space and time. More work is necessary, but the use of such a mecha-nism together with well designed annealing schedules should be helpful in controllingGA convergence. As was mentioned in the paper, similar mechanisms can also beimplemented under proportionate selection through the use of exponential scalingand sharing functions.
The opposite tack of using very high growth ratios permits good convergence insome problems by grabbing those building blocks you can get as fast as you can,thereafter restoring the missing building blocks through mutation (this appearsto be the mechanism used in Genitor). This works fine if the problems are easy(if simple mutation can restore those building blocks in a timely fashion), and italso explains why Whitley has turned to large populations or multiple populationswhen deceptive problems were solved (L. Darrell Whitley, personal communication,September, 1989). The latter applications are suspect, because waiting for high-order schemata to be rediscovered through mutation or waiting for crossover to

A Comparative Analysis of Selection Schemes
splice together two intricately intertwined deceptive building blocks are both losingpropositions (they are low probability events), and the approach is unlikely to bepractical in gener~l.
It might be possible to encourage -more timely restoration of building blocks byhaving mutation under localized genic control, however. The idea is similar to thatused in Bowen (1986), where a set of genes controlled a chromosome's mutation andcrossover rates, except that here a large number of mutation-control genes wouldbe added to give differential mutation rates across the chromosome. For example,a set of genes dictating high (Pm ~ 0.5) or low (Pm ~ 0) mutation rate could beadded to control mutation on function-related genes (a fixed mutation rate could beused on the mutation-control genes). Early on salient genes could achieve highestfunction value by fixing the correct function-related allele and fixing the associatedmutation-control allele in the low position. At the same time, poor alleles wouldbe indifferent to the value of their mutation allele, and the presence of a numberof mutation-control genes set to the high allele would ensure the generation of asignificant proportion of the correct function-related alleles when those poorer allelesbecome salient.
This mechanism is not unlike that achieved through the use of dominance anddiploidy as has been explored elsewhere (Goldberg & Smith, 1987; Smith, 1988).Simply stated, dominance and diploidy permit currently out-of-favor alleles to re-main in abeyance, sampling currently poorer alleles at lower rates, thereby permit-ting them to be brought out of abeyance quite quickly when the environment isfavorable. Some consideration needs to be given toward recalling groups of allelestogether, rather than on the allele-by-allele basis tried thus far (the same commentapplies to the localized mutation scheme suggested in the previous paragraph), butthe notion of using the temporal recall of dominance and diploidy to handle thenonstationarity of early building block sampling appears sound.
The idea of preserving useful diversity temporally helps recall the notion of diversitypreservation spatially (across a population) through the notion of niching (Deb,1989; Deb & Goldberg, 1989; Goldberg & Richardson, 1987). If two strings sharesome bits in common (those salient bits that have already been decided) but theyhave some disagreement over the remaining positions and are relatively equal inoverall function value, wouldn't it be nice to make sure that both get relativelyequal samples in the next and future generations. The schema theorem says theywill (in ex.pectation), but small population selection schemes are subject to thevagaries of genetic drift (Goldberg & Segrest, 1987). Simply stated, small stochasticerrors of selection can cause equally good alternatives to converge to one alternativeor another. Niching introduces a pressure to balance the subpopulation sizes inaccordanc'e with niche function value. The use of such niching methods can form aneffective pressure to maintaining useful diversity across a population, allowing thatdiversity to be crossed with other building blocks, thereby permitting continuedexploration.
The first five suggestions all seek to balance the conflict between exploration andexploitation, but the last proposal seeks to eliminate the conflict altogether. Theelimination of building block noise sounds impossible at first glance, but it is ex-actly the approach taken in messy genetic algorithms (Goldberg, Deb, & Korb, 1990;Goldberg & Kerzic, 1990; Goldberg, Korb, & Deb, 1990). Messy GAs (mGAs) grow

Goldberg and Deb
90 long strings from short ones, but so doing requires that missing bits in a problemof fixed length be filled in. Specifically, partial strings of length k (possible buildingblocks) are overlaid with a competitive temp/ate, a string that is locally optimal atthe level k -1 (the competitive template may be found using an mGA at the lowerlevel). Since the competitive template is locally optimal, any string that gets a valuein excess of the template contains a k-order building block by definition. Moreover,this evaluation is without noise (in deterministic functions), and building blockscan be selected deterministically without fear; simple binary tournament selectionhas been used as one means of conveniently doping the population toward the bestbuilding blocks. Some care must be taken to compare related building blocks to oneanother, lest errors be made when subfunctions are scaled differently. Also, somecaution is required to prevent hitchhiking of wrong (parasitic) incorrect bits thatagree with the template but later can prevent expression of correct allele combi-nations. Reasonable mechanisms have been devised to overcome these difficulties,however, and in empirical tests mGAs have always converged to global optima ina number of provably deceptive problems. Additionally, mGAs have been shownto converge in time that grows as a polynomial function of the number of decisionvariables on a serial machine and as a logarithmic function of the number of decisionvariables on a parallel machine. It is believed that this convergence is correct (theanswers are global) for problems of bounded deception. More work is required here,but the notion of strings that grow in complexity to more completely solve moredifficult problems has a nice ring to it if we think in terms of the way nature hasfilled this planet with increasingly complex organisms.
In addition to trying these various approaches toward balancing or overcoming theconflict of exploration and exploitation, we must not drop the ball of analysis.The methods of this paper provide a simple tool to better understand the expectedbehavior of selection schemes, but better probabilistic analyses using Markov chains(Goldberg & Segrest, 1987), Markov processes, stochastic differential and differenceequations, and other techniques of the theory of stochastic processes should be triedwith an eye toward understanding the variance of selection. Additionally, increasedstudy of the k-armed bandit problem might suggest practical strategies for balancingthe conflicts of selection when they arise. Even though conflict can apparently besidestepped in deterministic problems using messy G As, eventually we must returnto problems that are inherently noisy, and the issue once again becomes germane.
Conclusions9
This.paper has compared the expected behavior of four selection schemes on the ba-sis of their difference ~uations, solutions to those equations (or related differentialequation approximations), growth ratio estimates, and takeover time computations.Proportionate selection is found to be significantly slower than the other three types.Linear ranking selection and a probabilistic variant of binary tournament selectionhave been shown to have identical performance in expectation, with binary tourna-ment selection preferred because of its better time complexity. Genitor selection,an overlapping population selection scheme, has been analyzed and compared tothe others and tends to show a higher growth ratio than linear ranking or binarytournament selection performed on a generation-by-generation basis. On the otherhand, tournament selection with larger tournament sizes or nonlinear ranking can
A Comparative Analysis of Selection Schemes
give growth ratios similar to Genitor, and such apples-to-apples comparisons havebeen suggested.
Additionally, the larger issue of balancing or overcoming the conflict of explorationand exploitation inherent in selection has been raised. Controlling growth ratios,localized differential mutation, dominance and diploidy, nic.hing, and messy GAs(competitive templates) have been discussed and will require further study. Ad-ditional descriptive and prescriptive theoretical work has also been suggested tofurther understanding of the foundations of selection. Selection is such a criticalpiece of the G A puzzle that better understanding at its foundations can only helpadvance the state of genetic algorithm art.
Acknowledgments
This material is based upon work supported by the National Science Foundationunder Grant CTS-8451610. Dr. Goldberg gratefully acknowledges additional sup-port provided by the Alabama Research Institute, and Dr. Deb's contribution wasperformed while supported by a University of Alabama Graduate Council Research
Fellowship.
References
Ankenbrandt, C. A. (1990). An extension to the theory of convergence and aproof of the time complexity of genetic algorithms (Technical Report CS/CIAKS-90-0010/TU) New Orleans: Center for Intelligent and Knowledge-based Systems,Tulane University.
Baker, J. E. (1985). Adaptive selection methods for genetic algorithms. Proceedingsof an International Conference on Genetic Algorithms and Their Applications, 100-111.
Baker, J. E. (1987). Reducing bias and inefficiency in the selection algorithm.Proceedings of the Second International Conference on Genetic Algorithms, 14-21.
Booker, L. B. (1982). Intelligent behavior as an adaptation to the task environ-ment. (Doctoral dissertation, Technical Report No. 243, Ann Arbor: University ofMichigan, Logic of Computers Group). Dissertation Abstracts International, 43(2),469B. (University Microfilms No. 8214966)
Bowen, D. (1986). A study of the effects of internally determined crossover andmutation rates on genetic algorithms. Unpublished manuscript, University of AI-abama,Tu~caloosa.
Brindle, A. (1981). Genetic algorithms for function optimization (Doctoral disserta-tion and Technical Report TR81-2). Edmonton: University of Alberta, Departmentof Computer Science.
De Jong, K. A. (1975). An analysis of the behavior of a class of genetic adaptivesystems. (Doctoral dissertation, University of Michigan). Dissertation AbstractsInternational, 36(10), 5140B. (University Microfilms No. 76-9381)
Deb, K. (1989). Genetic algorithms in multimodal function optimization (Master'sthesis and TCGA Report No. 88002). Tuscaloosa: University of Alabama, The
Goldberg and Deb
92 Clearinghouse for Genetic Algorithms.Deb, K., & Goldberg, D. E. (1989). An investigation of niche and species formationin genetic function optimization. Proceedings of the Third International Conference
on Genetic Algorithms, 42-50.
Goldberg, D. E. (1989a). Genetic algorithms in search, optimization, and machine
learning. Reading, MA: Addison-Wesley.
Goldberg, D. E. (1989b). Sizing populations for serial and parallel genetic algo-rithms. Proceedings of the Third International Conference on Genetic Algorithms,
70-79.Goldberg, D. E. (1990). A note on Boltzmann tournament selection for geneticalgorithms and population-oriented simulated annealing. Complex Systems, ./, 445-
460.Goldberg, D. E., Deb, K. & Korb, B. (1990). Messy Genetic Algorithms Revisited:Nonuniform Size and Scale. Complex Systems, ..{, 415-444.
Goldberg, D. E., & Kerzic, T. (1990). mGAJ.O: A Common Lisp implementationof a messy genetic algorithm (TCGA Report No. 90004). Tuscaloosa: Universityof Alabama, The Clearinghouse for Genetic Algorithms.
Goldberg, D. E., Korb, B., & Deb, K. (1990). Messy genetic algorithms: Motivation,analysis, and first results. Complex. Systems, 3, 493-530.
Goldberg, D. E., & Richardson, J. (1987). Genetic algorithms with sharing for mul-timodal function optimization. Proceedings of the Second International Conferenceon Genetic Algorithms, 41-49.
Goldberg, D. E., & Segrest, P. (1987). Finite Markov chain analysis of genetic algo-rithms. Proceedings of the Second International Conference on Genetic Algorithms,
1-8.Goldberg, D. E., & Smith, R. E. (1987). Nonstationary function optimizationusing genetic algorithms with dominance and diploidy. Proceedings of the SecondInternational Conference on Genetic Algorithms, 59-68.
Grefenstette, J. J. & Baker, J. E. (1989). How genetic algorithms work: A criticallook at implicit parallelism. Proceedings of the Third International Conference on
Genetic Algorithms, 20-27.
Holland, J. H. (1973). Genetic algorithms and the optimal allocations of trials.
SIAM .Journal of Computing, 2(2), 88-105.
Holland, J. H. (1975). Adaptation in natural and artificial systems. Ann Arbor,
MI: University of Michigan Press.
Muhlenbein, H. (1989). Parallel genetic algorithms, population genetics and combi-natorialoptimization. Proceedings of the Third International Conference on Genetic
Algorithms, 416-421.
Smith, R. E. (1988). An investigation of diploid genetic algorithms for adaptivesearch of nonstationary functions (Master's thesis and TCGA Report No. 88001).Tuscaloosa: University of Alabama, The Clearinghouse for Genetic Algorithms.

A Comparative Analysis of Selection Schemes
Suh, J. Y. &. Van Gucht, D. (1987). Distributed genetic algorithms (Technical Re-port No. 225). Blooomington: Indiana University, Computer Science Department.
Syswerda, G. (1989). Uniform crossover in genetic algorithms. Proceedings of theThird International Conference on Genetic Algorithms, 2-9.
Whitley, D. (1989). The Genitor algorithm and selection pressure: Why rank-basedallocation of reproductive trials is best. Proceedings of the Third InternationalConference on Genetic Algorithms, 116-121.

EDITED BY
GREGORY J.E. RAWLINS
MORGAN KAUFMANN PUBLISHERS
SAN MATEO, CALIfORNIA

Editor: Bruce M. Spatz
Production Editor: Yonie Overton
Production Artist/Cover Design:Susan M. Sheldrake
Morg<tn Kaufrn<tnn Publishers, Inc.
Editorial Office:2929 Campus Drive, Suite 260
San Mateo, CA 94403
@ 1991 by Morgan Kaufmann Publishers, Inc.All rights reserved
Printed in the United States of America
No part of this publication may be reproduced, stored in a retrieval system, or transmiued in any
form or by any means--electronic, mechanical, photocopying, recording, or otherwise-without
the prior wriUen permission of the publisher.
94939291
54321
Ubrary of Congress Cataloging in Publicatioo Data is available for this book.Ubrary of Coogress Catalogue Card Number: 91-53076
ISBN 1-55860-170-8