a comparative performance study of four-pole …
TRANSCRIPT

Lappeenrannan teknillinen yliopisto Lappeenranta University of Technology Jorma Haataja A COMPARATIVE PERFORMANCE STUDY OF FOUR-POLE INDUCTION MOTORS AND SYNCHRONOUS RELUCTANCE MOTORS IN VARIABLE SPEED DRIVES
Thesis for the degree of Doctor of Science (Technology) to be presented with due permission for public examination and criticism in the auditorium 1383 at Lappeenranta University of Technology, Lappeenranta, Finland on the 25th of June, 2003, at noon.
Acta Universitatis Lappeenrantaensis 153

ISBN 951-764-772-7 ISSN 1456-4491
Lappeenrannan teknillinen yliopisto
Digipaino 2003

ABSTRACT Lappeenranta University of Technology Acta Universitatis Lappeenrantaensis 153 Jorma Haataja A comparative performance study of four-pole induction motors and synchronous reluctance motors in variable speed drives Lappeenranta 2003 ISBN 951-764-772-7, ISSN 1456-4491 Design aspects of the Transversally Laminated Anisotropic (TLA) Synchronous Reluctance Motor (SynRM) are studied and the machine performance analysis compared to the Induction Motor (IM) is done. The SynRM rotor structure is designed and manufactured for a 30 kW, four-pole, three-phase squirrel cage induction motor stator. Both the IM and SynRM were supplied by a sensorless Direct Torque Controlled (DTC) variable speed drive. Attention is also paid to the estimation of the power range where the SynRM may compete successfully with a same size induction motor. A technical loss reduction comparison between the IM and SynRM in variable speed drives is done. The Finite Element Method (FEM) is used to analyse the number, location and width of flux barriers used in a multiple segment rotor. It is sought for a high saliency ratio and a high torque of the motor. It is given a comparison between different FEM calculations to analyse SynRM performance. The possibility to take into account the effect of iron losses with FEM is studied. Comparison between the calculated and measured values shows that the design methods are reliable. A new application of the IEEE 112 measurement method is developed and used especially for determination of stray load losses in laboratory measurements. The study shows that, with some special measures, the efficiency of the TLA SynRM is equivalent to that of a high efficiency IM. The power factor of the SynRM at rated load is smaller than that of the IM. However, at lower partial load this difference decreases and this, probably, brings that the SynRM gets a better power factor in comparison with the IM. The big rotor inductance ratio of the SynRM allows a good estimating of the rotor position. This appears to be very advantageous for the designing of the rotor position sensor-less motor drive. In using the FEM designed multi-layer transversally laminated rotor with damper windings it is possible to design a directly network driven motor without degrading the motor efficiency or power factor compared to the performance of the IM. UDC 621.313.32 : 621.313.33 Keywords: Induction motor, synchronous reluctance motor, transversally laminated synchronous reluctance motor.


ACKNOWLEDGEMENTS
I like to thank all the people who were involved in the process of this thesis. Especially I wish
to express my deepest gratitude to the supervisor of this thesis, professor Juha Pyrhönen, for
giving me the opportunity to carry out this research. His valuable comments and corrections, his
inspiring guidance and encouragement made it possible for me to carry through this work. I
would also like to thank my colleagues at LUT, D.Sc. Markku Niemelä and M.Sc. Mika
Neuvonen, who have developed the pilot DTC drive for the SynRM. I also want to thank Mr.
Tapio Haring from ABB for this interesting subject.
I wish to thank the pre-examiners of this doctoral thesis, Associate Professor Ewen Ritchie at
Aalborg University of Technology, Denmark, and Professor Tapani Jokinen at Helsinki
University of Technology, for their valuable comments and corrections.
The preparation of this thesis has been financially supported by the Foundation of Technology,
Ulla Tuominen Foundation, the Research Foundation of Lappeenranta University of
Technology, Jenny and Antti Wihuri Foundation, the Finnish Cultural Foundation and T-
Stenbacka Oy, which is greatly appreciated.
Many thanks are due to Mrs Julia Vauterin for her contribution to improve the language of the
manuscript.
I am deeply indebted to my parents, Eila and Mikko, for providing me a good basis for life.
Most of all and with all my heart I am grateful to my wife Marjo for her love, and to my
children, Katri, Karri and Petra, for giving me strength and motivation for this work.
Joutseno, June the 6th, 2003 Jorma Haataja


To my wife Marjo and my children Katri, Karri and Petra


CONTENTS
ABSTRACT ACKNOWLEDGEMENT CONTENTS ABBREVIATIONS AND SYMBOLS
1 INTRODUCTION…………………………......................................................…………15 1.1 Current AC drives and design of the motors for VSD ..............................................15 1.2 The present-day Induction Motor ..............................................................................16 1.3 Synchronous Reluctance Motor.................................................................................19 1.4 Vector presentations of the IM and SynRM..............................................................24 1.5 SynRM rotor constructions ........................................................................................38 1.6 Outline of the thesis....................................................................................................41 1.7 Scientific contributions of the thesis..........................................................................41
2 SYNCHRONOUS RELUCTANCE MOTOR…………………………………………...42 2.1 Inductance analysis of the SynRM ............................................................................42 2.2 Effect of cross saturation............................................................................................48 2.3 Stator leakage inductance...........................................................................................50 2.4 Effects of iron losses ..................................................................................................51 2.5 Supplying of the SynRM using a VSD......................................................................55 2.6 Conclusion..................................................................................................................71
3 ANALYSIS OF SYNCHRONOUS RELUCTANCE MOTORS BASED ON THE RATED VALUES OF INDUCTION MOTORS……….…….……....72
3.1 Induction motor efficiency.........................................................................................72 3.2 SynRM comparison with induction motor ................................................................73 3.3 Maximum torque ........................................................................................................81 3.4 SynRM power factor ..................................................................................................83 3.5 Efficiency ...................................................................................................................87 3.6 Conclusion..................................................................................................................90
4 DESIGN OF A SYNCHRONOUS RELUCTANCE MOTOR………….…...………….91 4.1 Calculation model ......................................................................................................91 4.2 Calculation....………………………………………………………………………92
4.2.1 Influence of the single flux barrier width ........................................................93 4.2.2 Influence of the flux barrier location ...............................................................96 4.2.3 Influence of the flux barrier number and width...............................................99 4.2.4 Influence of the pole span on the pole pitch ratio τ /τ p .................................102 4.2.5 Influence of the air-gap length .......................................................................104 4.2.6 Influence of the mechanical strutting.............................................................104
5 COMPARISON OF THE INDUCTION MOTOR AND SYNCHRONOUS RELUCTANCE MOTOR BASED ON THE TEST RESULTS……………………...107
5.1 Description of the test set-up ...................................................................................107 5.2 No-load test ..............................................................................................................109 5.3 Rated load temperature test......................................................................................112 5.4 Tests under load........................................................................................................113 5.5 The SynRM with damper winding...........................................................................119 5.6 Conclusion................................................................................................................123
6 CONCLUSION…………………………………………………………………………124 REFERENCES………………………………………………………………………………..126 APPENDIX A Construction of the 30 kW induction motor...………………………………..133 APPENDIX B The designed rotor photo……….………………...…………………………..134 APPENDIX C The measuring table ……………………………………………………….…135


ABBREVIATIONS AND SYMBOLS Roman letters A Slope of the zero torque line a Ratio of insulation B, b Air-gap flux density C Intercept with the zero torque line D Stator bore diameter d Sheet thickness eb Width of flux barrier em Electro motive voltage vector f Frequency I0 No-load current Is Stator current’s RMS value is Stator current vector IN Rated current Kc Carter factor ke External loss factor kf Stacking factor kh Hysteresis loss factor L’ l Stator stack effective length lb Length of flux barrier ld Per unit value Ib Base current Im Magnetising current imd Direct axis magnetising current imq Quadrature axis magnetising current is Stator curren vector L Inductance lb Base inductance Ld Direct axis inductance, Ld=Lsσd+Lmd ld Per unit d-axis inductance Lm Magnetising inductance Lmd Direct axis magnetising inductance Lmq Quadrature axis magnetising inductance Lsσ Stator leakage inductance Lsσd Direct axis stator leakage inductance Lsσq Quadrature axis stator leakage inductance Lrσ Rotor leakage inductance Lq Quadrature axis inductance, Lq=Lsσq+Lmq lq Per unit q-axis inductance m Number of phases N Number of turns in series per stator winding PI Load independent losses PL Load-dependent losses PN Rated power p Number of pole pairs pout Per unit output power Qs Number of stator slots Rcd. Rcq d-, q-axis iron loss resistances Rs Stator phase winding resistance

Rr Rotor resistance R Radius of rotor r Correlation factor rrr Rotor radial rib width rtr Rotor tangential rib width Tb Base torque Te Torque t Time te Per unit torque Ub Base voltage
su Stator voltage vector V Magnetic voltage Wins Sum of the widths of the flux barrier layers Wiron Sum of the widths of the iron layers (flux guides) WLL Stray-load loss Wtot Insulation ratio Greek letters δ Load angle δe Equivalent air-gap length δm Mechanical air-gap length δi Internal power angle δs Effective air-gap length η Efficiency ϕ Angle between the voltage and current vectors (as in cosϕ) κ External current angle κm Internal current angle µ0 Permeability of vacuum θr Rotor angle σ Conductivity τ Pole span τp Pole pitch ω Angular velocity ξ1 Fundamental wave winding factor ψ Flux linkage vector ψD Direct axis damper winding flux linkage ψm Air-gap flux linkage ψmd Direct axis component of the magnetising flux linkage ψmq Quadrature axis component of the magnetising flux linkage ψrd Direct axis component of the rotor flux linkage ψrq Quadrature axis component of the rotor flux linkage ψsd Direct axis component of the stator flux linkage ψsq Quadrature axis component of the stator flux linkage ψQ Quadrature axis damper winding flux linkage θr Rotor angle ζ Saliency ratio

Subscripts b Base value cd Direct axis iron loss component cq Quadrature axis iron loss component d Direct axis e External max Maximum value min Minimum value Loss Losses q Quadrature axis rb Rotor back rt Rotor tooth s Stator, a quality related to stator sb Stator back st Stator tooth Superscripts g General reference frame, general coordinates s Stator reference frame, stator coordinates r Rotor reference frame, rotor coordinates Acronyms AC Alternating Current ALA Axially Laminated Anisotropic CEMEP Comité Européen de Constructeurs de Machines Electriques et d'Electronique
de Puissance (European committee of manufacturers of electrical machines and power electronics)
DTC Direct Torque Control EC European Commission EMI Electro Magnetic Interference FEM Finite Element Method GTO Gate Turn Off (Thyristor) IGBT Insulated Gate Bipolar Transistor IGCT Integrated Gate Commutated Thyristor IEA International Energy Agency IM Induction Motor FC Frequency Converter LUT Lappeenranta University of Technology TLA Transversally Laminated Anisotropic SynRM Synchronous Reluctance Motor VSD Variable Speed Drive


15
1 INTRODUCTION The squirrel cage induction motor (IM) in industrial drives has maintained its top position for decades. The era of frequency converters began as it was aimed at speed control of squirrel cage machines. The so called scalar control of IM was, in principle, easy compared to the vector con-trol needed in magnetically unsymmetrical machines. The IM scalar control is still valid and the most popular alternative for most of the variable speed drive (VSD) applications. The develop-ment of power electronic motor controllers has, however, brought on the market new devices that are capable of driving all rotating field machines even in dynamically demanding applica-tions. This development has brought new motor types into focus. The synchronous reluctance motor (SynRM) and its properties in possible industrial drives are investigated in this thesis. 1.1 Current AC drives and design of the motors for VSD A variable speed drive consists of an electric motor and a frequency converter (FC) controlling the torque and the speed of the drive. Electric motors are by far the most important type of elec-tric load because they are used in all sectors and in a wide range of applications. Electric motors use over half of all electricity consumed in the developed countries; typically motors consume 60 % … 80 % of the electricity in the industrial sector and about 35 % of the electricity in the tertiary sector. The largest part is consumed by traditional synchronous and induction motors but also new motor types are emerging in the industry. For example, permanent magnet syn-chronous motors and synchronous reluctance motors may improve both drive performance and efficiency. The family of the electromagnetic rotating machines is shown in Fig. 1.1.
Synchronous machines
Synchronous reluctance machines
Separately excited machines
Permanent magnet machines
Asynchronous machines
Squirrel cage induction machine
Wound rotor induction machine
Alternating Current (AC) machines
Direct Current (DC) machines
Switched machines
Electromagnetic rotary mchines
Figure 1.1. The family of electromagnetic machines used in industrial applications.
Typical configurations of controlled AC drives given in (Leonhard 1995) are shown in Table 1.1. Some typical industrial applications are taken into account. The updated table gives a basis for discussion about different AC drive applications. The table considers the influence of the development of IGBTs and new IGCTs (Steimer 1999). Modern converters offer for different motor types control properties that are superior to those of the conventional DC drives. This consequently brings up the question of the right motor type for certain applications. Such machine types as permanent magnet synchronous motors (PMSMs), synchronous reluctance motors (SynRMs) or permanent magnet assisted synchro-nous reluctance motors (PMASynRMs) drives, which is a combination of the first two types, may also be used extensively in the future.

16
Table 1.1. Typical configurations of controlled AC-drives (Leonhard 1995 updated)
Converters
Machines
Synchronous motorwith permanentmagnet excitation
Synchronousreluctance motor
Squirrel-cageinduction motor
Double fed slip-ringinduction motor
Synchronous motorwith field and damperwindings
DC link converters Cycloconverterswith linecommutation(GTO)
Transistor inverters(IGBT)
Thyristorinverters(GTO, IGCT orGCT)
Thyristorinverters (GTO)
Load-commu-tated thyristorinverters (GTO)
Voltage-source converters (VSI)
Current-source converters (CSI)
High power (20-40 MW),low speed, gooddynamicperformance
Low to mediumpower (100 kW)
Medium power (3 MW), high power density
Low to medium power(500 kW),high speed,very good dynamicperformance (spindleand servo drives)
Medium to highpower (5 MW),good dynamicperformance (traction drives)
30 MW ACS6000SD(ABB)
Shaft generatorson ships(2 MW)
High power (20 MW),subsynchron-ous operation
High power 100 MW(ABB)
Low power (10 kW),very good dynamicperformance (servo drives). 3 MW wind-mill position sensor-less direct drives
High power(10 MW), lowspeed, very gooddynamicperformance
High power(100 MW), limited speed contiol range
Medium tohigh power(4 MW),high speed
1.2 The present-day Induction Motor The most common electric motor type for industrial use is the AC-three phase, low voltage, 4-pole, continuous duty, totally enclosed (IP55), fan cooled, asynchronous squirrel cage motor. Generally, it is estimated that these motors represent about 90 % of the total electrical energy consumption by electric motors (Frost 1994). Induction motors have gained this prevailing posi-tion because of their low price, simple network connection or inverter drive, good availability, simple construction and high reliability. During the latest century the IM factories have driven up and extremely improved their productivity. This, of course, forms a major obstacle to the adopting of new motor types for production. Some superior properties are needed before any changes can be done. The use of permanent magnets in low speed industrial machines seems to supply this demand. The significance of the SynRM remains more ambivalent and doubtful. The advantages of the SynRM compared to the induction motor are the synchronous rotation speed, possibility of sensorless control and a possibility to achieve a better or at least as good efficiency as achieved with induction motors.

17
In the latest decades the induction motor has been developed to produce higher and higher effi-ciencies in direct network drives. The new material properties give the designers new opportu-nities and modern calculation tools like Finite Element Method (FEM) combined with circuit simulators may improve the design remarkably. This is extremely valuable for the designing of induction motors for variable speed drives. The use of 2D or 3D FEM not only makes it possi-ble to produce the necessary initial machine parameters for the drive control but it also enables the designer to study the transient behaviour of the machine as e.g. the torque ripple. An exam-ple of this development is shown in Fig. 1.2. The Figure describes the improvement of the effi-ciency of the standard ABB motor series and of one high performance motor series. The oldest one of the motor series, MKB, manufactured by ASEA, came on the market in 1935. The new-est one, M3000, has been in production since 2001.
82
84
86
88
90
92
94
96
4 7.5 15 22 37 55Motor Power [ kW ]
Effic
ienc
y [ %
]
Class EFF1 (4 pole)M3000 2001M2AA 1996MBT 1989M 1972M 1966MBRC 1963MKB 1935
MKB 1935
Figure 1.2. Improvement of the efficiency of ABB’s 4-pole motors according to IEC 34-2 (Sjöberg 1997). The limiting curve for the EC/CEMEP agreement of the highest efficiency class level EFF1 is also given (EC-CEMEP 1999). The three-phase squirrel cage induction motor consumes approximately about 34 % (700 TWh) of the total electricity in the European Union. About 80 % of these motors are small power range (≤ 15 kW) 4-pole standard motors. It has been evaluated that using high efficiency EC/CEMEP EFF1 class motors and FCs more than 100 TWh of electricity could be saved an-nually in the EU (Haataja 2002a). Despite a general improvement of the efficiency of the IM, the efficiency values of induction motors produced by different manufacturers are still varying considerably, Fig. 1.3. The dots (• ∆ – etc.) in Fig. 1.3 show the efficiency values of motors manufactured by the major motor fac-tories and available on the market. These values are taken from the EURODEEM database and are given according to the IEC 34 standard. Also two entries from ABB Motors awarded with "IEA Award of Excellence” are shown in Fig. 1.3 (Haataja 1999a).

18
70
75
80
85
90
95
100
1 10 100Motor Power [ kW ]
Effic
ienc
y [ %
]
EFF1
EFF2
EFF3
"IEA Award of Excellence"- motors
Figure 1.3. Four pole, standard induction motor efficiencies as a function of power for different manufac-turers according to IEC 34-2 (EURODEEM 2000). The EC/CEMEP efficiency class limits for four-pole motors are also represented. The two distinguished dots indicate the IEA Hi-Motors competition results. The accuracy of the efficiency determination depends on the test method used and the precision of the loss determination by the test method. The methods used are IEC34-2, which is often preferred by the European manufacturers, and the American IEEE 112, which gives more accu-rate results (IEC 34-2 1972, NEMA 1993, IEEE 1991, Haataja 1999b). International standards set also many limitations to the design. For example, the maximum al-lowable direct line starting current limits the improvement of the motor performance. Seldom the motor is optimised for a VSD. The motors are normally designed for sinusoidal supply. There are no motor series designed specifically for inverter supply but standard motors are usu-ally used also in variable speed drives. Fig. 1.4 e.g. introduces a modern induction motor rotor design with double cage and closed rotor slots.
Figure 1.4. The cross section area of a squirrel cage rotor for a machine with number of rotor bars Q
r = 36.

19
This rotor type is not very well suited for the VSD using a pulse width modulated high switch-ing frequency inverter. The double cage is introduced in order to limit the starting current in direct network start. Regarding the VSD this is not necessary. It is obvious that for variable speed drives especially different rotor types for IMs should be designed. When a standard squir-rel cage motor is selected for a converter drive its continuous output power must – because of the increased losses – be derated in nominal operating conditions. With the lower output the increasing of the motor temperature is maintained at the originally designed level despite of the fact that the converter supply causes additional losses in the motor (Nee 1995, Haring 1999, Abrahamsen 2001). This deration is dependent on several factors in the total drive system, con-verter type and modulation, motor design, mechanical power transmission and control equip-ment. For example, in the case of an IM the direct line-starting current has no meaning at all and the measures to limit the starting current make the motor less efficient for the VSD. The rotor bars of the IM may thus be designed with a larger cross section area and thus reduce the rotor ohmic loss. In such a case it might be possible to select the rotor diameter a little bit smaller. By reducing the rotor diameter the depth of the stator slots may be increased and thus the stator resistance can be decreased by increasing the amount of copper in the stator slots. The reducing of the rotor outer diameter also results in lower friction losses, centrifugal force and noise. The IM VSD has two main weaknesses: 1. Estimating the rotor actual speed, especially at low speeds, is very difficult and requires rotor speed encoders in demanding drives and 2. the using of standard induction motors optimised for line starting that do not provide the user with the optimum performance in the VSD. 1.3 Synchronous Reluctance Motor In the following, the basics of the singly salient synchronous reluctance motors are introduced. The history of the SynRM is briefly described. Because the electromagnetic torque for the SynRM Trel consists only of the reluctance torque, the two most important parameters are de-rived: the direct and the quadrature axes’ inductances Ld and Lq. The thesis will consider only three-phase synchronous reluctance motors with stators similar to those of a standard three-phase IM. The principle of using the reluctance differences to produce the torque has been known for over 160 years. Before the discovery of the rotating magnetic field by Tesla in 1887 this first reluc-tance motor was close to the doubly salient synchronous reluctance motor, which is nowadays known as the switched reluctance motor. The first rotating-magnetic-field synchronous motor was, however, introduced by Kostko not earlier than in 1923 (Kostko 1923). In the literature there seems to be no uniform designation for singly salient synchronous reluc-tance motors. Frequently used names are: Reluctance motor (RM), Synchronous Reluctance Motor (SRM, Synchrel, SynRM) and Reluctance Synchronous Motor (RSM). In this thesis it is used the name and abbreviation Synchronous Reluctance Motor (SynRM). Fig. 1.5(a) shows a cross-sectional view of a singly salient RM consisting of a non-salient stator and a two-pole salient rotor, both constructed of high-permeability magnetic material. The fig-ure shows a three-phase stator winding although any number of phases is possible. Fig. 1.5(b) shows the cross-sectional view of a three-phase doubly salient RM.

20
Rotor
Stator
A+
A-
Magnetic axisof phase B
Magnetic axisof phase A
d-axis
q-axis
B- C-
C+ B+
Magnetic axisof phase C
a)
RotorStator
d-axis
q-axis
A-
A+
A+
A-
B+
B+
C+
C+C+
B- C+
B-
b) Figure 1.5. Basic three-phase one pole-pair variable reluctance motors: a) singly salient SynRM and b) doubly salient Switched Reluctance motor. In principle, the SynRM is similar to the traditional salient pole synchronous motor but does not have an excitation winding in the rotor. Before the development of today’s AC motor the vari-able speed drive technology motor was excited from a fixed frequency supply. In such a case, it is necessary that the SynRM includes a squirrel cage on the rotor to provide the starting torque. Otherwise, the rotor does not accelerate and synchronize with the supplying network. The squir-rel cage is also needed as a damper winding in order to maintain synchronism under pulsating load torques. The inclusion of a cage for line starting may impose conflicting requirements on the rotor design. Regarding the primitive models of these motors types the designing of a motor appeared to be a compromise between the needs of the cage winding and the need for a large saliency ratio. The line-start type “synchronous induction motors” have simple constructions, but the saliency ratio is too low to give a competitive performance compared to the IM. These early primitive models of SynRM used to have a low saliency ratio that was often achieved by removing some teeth from the conventional induction motor rotors. They were applied only for relatively small out-put power. The line-start type synchronous reluctance motors were developed particularly in the 1960’s (Lawrenson 1963, 1964, 1967, Lipo 1967). These early motor types are illustrated in Fig. 1.6. The design of these motor types is based on the induction motor of which the SynRM is a modification. The basis for the design of the rotor is the IM rotor with a die-cast cage and a single layer flux barrier. However, this is a way of approaching that should be given up. In order to achieve a good performance for the SynRM the designing of the rotor should be reconsidered.

21
a)
b)
c)
Figure 1.6. The early primitive types of the line-start SynRM a) and b) induction motor laminated rotor modifications c) single flux barrier solid rotor (Staton 1993a). Regarding the VSD the SynRM belongs to the category of brushless synchronous AC machines, which are sinusoidal current driven machines and use a standard quasi-sinusoidal distributed AC stator winding and inverter. The other main types of brushless synchronous AC machines are the permanent magnet synchronous motors (PMSM). The synchronous motor operates, as the names suggests, at a synchronous speed determined by the stator excitation frequency and the number of poles. The different types of brushless synchronous AC machines are shown in Fig. 1.7. The dotted areas represent steel, the white areas represent air and the dark grey areas represent permanent magnets.
a)
b)
c)
Figure 1.7. Brushless synchronous AC machines a) PMSM with internal permanent magnets (IPM) b) Synchronous reluctance motor (multi-barrier SynRM construction) and c) permanent magnet assisted syn-chronous reluctance motor PMASynRM. In the figure the dotted areas represent steel, the white areas represent air and the dark grey areas represent permanent magnets. Because the permeability of the present-day permanent magnet materials is close to air, the IPM motor produces also some reluctance torque because the inductances of the direct or d- and quadrature or q- axes are not equal. Because the magnetising inductance value is inversely pro-portional to the square of the pole-pair number, the reluctance torque may be significant only when the number of pole-pairs is small (1 … 3). The magnetic asymmetry of the rotor deter-mines the different axes in a SynRM. In this thesis, the d-axis is the direction, where the value of the magnetic circuit reluctance achieves the minimum and the q-axis is the direction, where the corresponding reluctance achieves the maximum. The d-axis reluctance consists mainly of the air-gap reluctance but the q-axis reluctance includes with this air-gap reluctance also the reluctance of the flux barriers.

22
The line-start SynRM can also be designed based on the SynRM construction where a cage or damper winding is placed on the flux barrier holes. The line-start SynRM rotor may thus be based also on the construction of a multiple barrier rotor with damper winding, Fig. 1.8. In this case, the rotor is primarily designed for a high performance SynRM and the damper windings have been added afterwards to the rotor construction.
Damper windings
Figure 1.8. The multi-barrier SynRM construction with damper winding. In frequency converter applications the damper cage fulfils the task of dampening the oscilla-tions in speed and increasing the torque change speed. The cage may also improve the mechani-cal strength of the rotor. In converter-fed synchronous machines the time harmonic contents of the stator currents, the stator magneto-motive force spatial harmonic contents and the air-gap region permeance variations induce currents in the damper. Today’s variable speed industrial drives are mostly based on standard one- or two-pole pair induction motors. These pole pair numbers are also suitable for the SynRM. The non-domestic applications for the SynRM in are
• industrial drives, • electrical road vehicles, rail-road traction, propulsion and auxiliaries.
The advantages of the SynRM VSD compared to IM drives generally mentioned are (Miller 1991):
• simple rotor construction with no vital need for the rotor cage in speed controlled drives
• no rotor ohmic losses • low inertia • synchronous running with easy speed control without encoders • easy field weakening compared to the PMSM

23
Generally, SynRM rotor losses are ignored because the rotor does not necessarily consist of a rotor cage. On the other hand, to achieve a high magnetising inductance the air-gap length of the SynRM must be small if a stator is used equal to the IM stator. The air-gap length may thus be smaller than that of the respective IM and this yields to iron losses in the rotor surface that are bigger than than those of the IM. A sophisticated motor design and especially the use of stator semi-magnetic slot wedges diminishing the air-gap permeance harmonic losses on the rotor surface may increase the efficiency of the SynRM even to be higher than that of the IM. The SynRM has another advantage over the IM: it offers the possibility of producing high qual-ity sensorless drives because of its synchronous running and large inductance ratio (Lsd > Lsq), which facilitates an accurate estimation of the rotor position. Considering the control accuracy in a sensorless control the SynRM is superior to the IM, especially at zero speed and at very low rotational speeds. According to Table 1.1 the SyRM is suitable only for low or medium power applications. Tradi-tionally, this motor type has been used in conveyor applications where line start synchronous reluctance motors are advantageous because of their synchronous steady state running. The other, poor properties of the models used on the market have just to be accepted in these appli-cations. According to the number of the papers published about SynRM in the latest decades, there seem to be an increasing interest towards the SynRM due the development of the modern AC motor drive technology. Research and development in the 90’s in the field of synchronous reluctance motors and drives have been focused on: • design and optimisation of transversally or axially laminated rotor structures: Until 1990 research on the SynRM was concentrated almost completely on the use of ALA type rotors since they can produce a very high saliency ratio. Mainly because of the iron loss (two to three times that of the multiple-barrier rotors) and fabricating problems related to the ALA type rotors the focus of research is now moved to the use of TLA rotors (Vagati 1992). • comparative analysis of synchronous reluctance motor and induction, permanent magnet,
or switched reluctance motors: At low speed the torque of the IM is limited and the control algorithms is complex. On the other hand, at low speed the losses in the SynRM might be low enough to relieve the need for an external fan. For certain applications (e.g high temperature applications) the absence of magnets may be an advantage. Many qualities that are claimed to be characteristic for the switched re-luctance motor are also offered by the the SynRM, but the SynRM uses a standard AC IM sta-tor. Like the IM, it is robust and brushless, and since it operates with a rotating magnetic field an inherently smooth and quiet operation is achieved (Staton 1993b). • vector control of SynRMs: The study of the control of SynRM has been focused on the torque vector control (Boldea 1991), including the effects of saturation and iron losses (Xu 1991) on the field oriented control (Matsuo 1994) and on the field weakening (Fratta 1994). The SynRM may thus be operated according to all known vector control methods • five phase synchronous reluctance motor: By increasing the number of phases (>3) of the SynRM some advantages can be noticed: a re-duced current per phase for higher reliability, a reduced common-mode voltage for less EMI, and an increasing of the redundancy in the machine winding and associated converter device for fault tolerance (Longya 1999).

24
• permanent magnet assisted synchronous reluctance motors: By adding a small amount of strong PMs it is possible to turn the SynRM into an interior per-manent magnet motor with a substantially enhanced field-weakening performance. In particular, it has been found that the widest field weakening performance is obtained when the PM flux-linkage ψm is equal to the product of Lqiq. The PM flux improves also the SynRM power factor and efficiency (Soong 2000, Murakami 2001). 1.4 Vector presentations of the IM and SynRM If the SynRM carries a damper winding the rotor-co-ordinate equations are similar to those of the IM. The stator voltage equation of all rotating field machines in vector form can be given as
tR
dd s
ssss
ss
ψiu += , (1.1)
which gives the stator flux linkage as a voltage integral
( )∫ −= tR dsss
ss
ss iuψ , (1.2)
where s
su , ssi , and s
sψ are the instantaneous stator voltage, current and flux linkage vectors in the stationary reference frame. By multiplying the stator voltage vector by rθje− the stator voltage may be presented in a rotor reference frame as
rsr
rsr
ssss
rs d
dr ψψiuu ωθ j
tRe j ++== −
. (1.3)
The product ω rψs
r is defined by the angular speed of the rotor reference frame. In Eq. (1.3) ωr is the rotor electrical rotational speed. In a general reference frame the co-ordinate axes rotate at a synchronous speed ωg, and the Eq. (1.3) is written as
gsg
gsg
ssgs d
d ψωψiu jt
R ++= . (1.4)
The rotor equation in the general reference frame is then
grrg
grg
rsgr )(
dd ψωωψiu −++= j
tR . (1.5)
Ignoring iron loss components and using the voltage Eqs. (1.4) and (1.5) a common equivalent circuit for an IM and a SynRM may be drawn

25
Rs
usg
isg Lsσ
ψsg
im
Lrσ
Rr
jωgψsg j(ωg-ωr)ψs
g
ψrg
irg
urg
Figure 1.9. The IM and SynRM equivalent circuit in a rotating (ωg) general reference frame. In the stator reference frame ωg = 0 and in the rotor co-ordinates ωg = ωr and thus Eqs. (1.4) and (1.5) are simplified respectively. Since the magnetising inductance of the SynRM is dependent on the rotor position the rotor dq-co-ordinates may conveniently be used in the evaluation. Using the two-axis theorem in the rotor dq-co-ordinates the Eq. (1.3) can be resolved also in direct and quadrature axis components as
sqrsd
sdssd dd
ψω++=tψiRu , (1.6)
sdrsq
sqssq dd
ψω−+=tψ
iRu . (1.7)
The stator flux linkages in stator co-ordinates in an IM and in a SynRM with damper windings consist of the stator leakage and the air-gap fluxes as
)( sr
ssm
sss
ss iiiψ ++= LL
vvσ , (1.8)
where mL
v is the magnetising inductance tensor representing the different axes’ inductances.
σsLv
is the stator leakage inductance tensor and sri is the rotor current vector (in the case of a
SynRM sD
sr ii = , which is the damper winding current).
In an IM we may abandon the tensor representation since the magnetising and leakage induct-ances of the IM are identical in the d- and q-axes directions Lmd = Lmq, (1.9) but for the SynRM the magnetising inductance (as well as the stator leakage inductance) is dif-ferent in the d- and q-axes Lmd > Lmq. (1.10) The tensor representation may be left out in this case by using the traditional d-q-axis represen-tation for the machine.

26
The stator leakage inductance is generally assumed to be independent of the rotor position and to be identical in the direct and quadrature axis direction. If the rotor structure contains cut-outs on the q-axis, Fig. 1.7b, the leakage inductance values of the axes are no longer, in principle, equal because the leakage inductance value is also a function of the air-gap length so Lsσq ≥ Lsσd. (1.11) The two equivalent circuits of the axes of the IM and SynRM in a synchronously rotating rotor frame (ωg = ωr) are shown in Fig. 1.10.
Rs
usd
isd
ψsqωr
Lsσ ird
ψsd
idm
ψmd
Lrσ
Rr
ψrd
Lmd
a)
Rsisd
ψsqωr
Lsσd iD
ψsd
imd
ψmd
ψD
usd Lmd
LDσ
RD
b)
Rs
usq
isq
ψsdωr
Lsσ irq
ψsq
imq
ψmq
Lrσ
Rr
ψrq
Lmq
c)
Rsisq
ψsdωr
Lsσq iQ
ψsq
imq
ψmq
ψQ
usq Lmq
LQσ
RQ
d)
Figure 1.10. The d-axis equivalent circuit of a) an IM and b) SynRM and the q-axis equivalent circuit of c) an IM and d) a SynRM. For the IM Lrσ and Rr are the rotor leakage and resistance parameters referred to the stator. For the SynRM LDσ and LQσ are the d- and q- axes damper windings leakage inductances and RD and RQ are the d- and q- axes damper winding resistances referred to the stator. The vector diagrams of the IM in stationary reference frame fixed to stator and the SynRM in rotor oriented reference frame at steady state are shown in Fig. 1.11.

27
ϕ
-em
is
ir
ψs
ψr
ψrσ
ψsσψmim
RsisjωLsσis
us
Rrir
jωLrσir
em
er
θr=ωrt
d-axis
y-axis
q-axis
x-axis
a)
ϕ
δ
is
id
jωisqLq
iq
us'
usisRs
jωisdLd
ψd
ψqψm ψsσd
ψs
jωisLsσ
κd-axis
q-axis
-em
ψsσq
x-axis
y-axis
θr
b) Figure 1.11. Vector diagram of a) an induction motor in xy- stationary reference frame fixed to the stator and b) a synchronous reluctance machine in dq- rotor oriented reference frame in steady state. is is the stator current vector, ir is the rotor current vector, κ is the angle between the d-axis and the stator current (in SynRM), ψs is the stator flux linkage, ψm is the air-gap flux linkage, ψsσ is the stator leakage, em is the air-gap electro motive voltage, us is the stator voltage and θr is the rotor angle. The SynRM angle δ is called the load angle. An analogous load angle might be determined for the IM by selecting the angle be-tween the rotor and stator flux linkages. ϕ is the power factor angle. In the following the quantities of an AC system may be expressed in a dimensionless form, in so-called per unit (p.u.) values. This enables easy comparison of motors of different dimen-sions. The base values marked using subscript b are defined as
Nb 2II = , (1.12a)
322 N
NphasebU
UU == (1.12b)
b
bb I
UZ = , (1.13)
N
Nb ω
PT = . (1.14a)
B
Nb T
Tt = . (1.14b)
The different parts of the impedance can then be expressed in per unit values as

28
Rp.u.=b
s
ZR
, (1.15)
ld=b
db
ZLω
, (1.16a)
lq=b
qb
ZLω
, (1.16b)
Fig. 1.12 introduces the calculated per unit stator current, rotor current and magnetising currents of an induction motor as a function of per unit torque. The stator current and the d-axis q-axis currents of a SynRM as a function of per unit torque are also represented.
0 0.5 1 1.5 2 2.5 30
0.5
1
1.5
2
2.5
3
Torque p.u
Cur
rent
p.u
.
Stator current
Rotor current
Magnetizing current
a)
0
0.5
1
1.5
2
2.5
3
0 0.5 1 1.5 2 2.5 3
Torque p.u.
Cur
rent
p.u
.q-axis current
d-axis current
Stator current
b)
Figure 1.12. a) The stator, rotor and magnetising currents in per unit values of a four-pole 30 kW IM and b) the stator, q-axis and d-axis currents in per unit values of a four-pole 30 kW SynRM as a function of the motor per unit torque. The magnetising current and the d-axis current decrease as the air-gap voltage de-creases with the increasing torque. The stator current armature reaction in an IM is to a large degree eliminated by the magneto-motive force of the rotor current. The small sum of the stator and the rotor current vectors is the air gap flux linkage magnetising current im. In the SynRM there are no armature reaction elimi-nating currents in the rotor. This clearly indicates that it is more difficult to produce a high power factor with the SynRM. The larger the d-axis inductance is the smaller the no load cur-rent of the SynRM remains. And when the q-axis inductance becomes smaller the q-axis current will have less influence on the air gap flux and the power factor of the machine will be better. The Ld/Lq ratio is thus an extremely important factor determining the performance of the SynRM. The electro-magnetic torque of all rotating field machines may be given as a vector presentation
( )sse 23 iT ×= ψp . (1.17)
The vector presentation, however, is not always very useful and thus the scalar version for the torque may be written using different reference frames as
( )sdsqsqsde 23 iipT ψψ −= . (1.18)

29
The torque of the IM may be calculated most conveniently in the stator co-ordinates using the torque
( )sysxsxsye 23 iipT ψψ −= , (1.19)
where the x-axis currents isx, is the direct axis current component and isy is the quadrature axis current component in the stator reference frame. The x,y–axes are fixed to the stator. For a SynRM the stator flux linkage may be given as
sqsdsqqsdds jj ψψ +=+= iLiLψ . (1.20) The inductances Ld and Lq are variables and are dependent on self and cross saturation of the axes. Cross saturation is the magnetic coupling between the fictitious d- and q-axis windings of the machine. These aspects will be studied in chapter 2. Fig 1.13 gives for the stator current vector is and flux linkage ψs components
ψs
κ
q-axis is
d-axis
Figure 1.13. SynRM flux linkage and current vectors.
κcosssd i=i , (1.21a) κsinssq i=i , (1.21b)
κψ cossdsd iL= , (1.21c) κψ sinsqsq iL= . (1.21d)
Using the equivalence [ ])sin()sin(cossin 21 βαβαβα ++−= , the torque Eq. (1.17)
gives
( ) κ2sin43 2
sqde iLLpT −= . (1.22) The inductance difference between the d-and q-axis inductances is not constant. Due to self and cross saturation it varies with both the d-and q-axis currents of the machine. The maximum theoretical torque in a SynRM with a known current is thus found when the cur-rent-d-axis angle is π/4.

30
The SynRM maximum torque producing load angle δt,max can be solved with a constant voltage supply, if the magnetising current im and the stator flux linkage modulus Ψsare given. The stator current modulus is assumed to be unlimited here. The stator flux linkage components and the stator current components in the rotor reference frame can be expressed as a function of the stator flux linkage load angle δ.
)cos(ssd δΨΨ = , (1.23)
)sin(ssq δΨΨ = , (1.24)
)cos(1s
dsd δΨ
Li = , (1.25)
)sin(1s
qsq δΨ
Li = . (1.26)
The torque can be expressed as a function of the load angle:
⋅−⋅=×= )cos(1)sin()sin(1)cos(
23
23
sd
ssq
ssse δψδψδψδψψLL
pipT , (1.27)
)cos()sin(1123
dq
2s δδψ
−=
LLp , (1.28)
)2sin(21
23
dq
qd2s δψ
−=
LLLL
p , (1.29)
which corresponds to the reluctance power part of the salient pole synchronous machine power. The more traditional expression is the expression for p.u. power pout
)2sin(22
3
qd
qd2seout δ
ωω
−==
llll
uptp , (1.30)
where bU
u ss
ψω= . (1.31)
If the inductances are assumed to be independent from the load angle the maximum torque pro-ducing load angle can be found by differentiating Eq. (1.28) with respect to the load angle and finding zero for the derivative

31
−⋅+
−−⋅=
∂
∂)cos(11)cos()sin(11)sin(
23
dq
2s
dq
2s
e δψδδψδδ LLLL
pT
(1.32)
Setting (1.32) to zero yields
( ) 011cos112dq
2s
2
dq
2s =
−−
−⋅
LLLLψδψ . (1.33)
The solution is
21)cos( =δ . (1.34)
This gives the maximum torque producing power angle δ = π/4 The torque in the per unit value as a function of the load-angle and current angle is given in Figs. 1.14a and 1.14b. The stator flux linkage used in the calculation presented is based on a 230 V grid voltage 50 Hz frequency. The parameters used in the calculations are listed in Table 1.2. Table 1.2. The values of the calculations
Parameter Value Motor power 30 kW Motor voltage 400 V Current 65.6 A Motor speed 1500 rpm Pole number 4 Stator resistance 98.5 mΩ Stator leakage inductance 1 mΗ Iron + mechanical losses 890 W Quadrature-axis inductance Lq 7 mH lq 0.2 p.u.
In the torque calculations the self and mutual saturation of the inductances as well as the effect of the iron losses are ignored.

32
0
0.5
1
1.5
2
0 10 20 30 40 50 60 70 80 90
Load-angle [electrical degs]
Torq
ue p
.u.
L d/L q= 5
L d/L q= 10
L d/L q= 50
a)
0
0.5
1
1.5
2
0 10 20 30 40 50 60 70 80 90
Current angle [electrical degs]
Torq
ue p
.u.
L d/L q= 10
L d/L q= 50
L d/L q= 5
b)
Figure 1.14. The calculated reluctance torque as a function of a) the load-angle and b) the current angle. The saliency ratio Ld/Lq is a parameter. The calculated torque values do not take into account saturation or iron loss effects and there-fore the given torque values are too optimistic. In a constant voltage supply the stator current angle with respect to the rotor d-axis producing the maximum torque is large and differs signifi-cantly from the current supply theoretical value κ = π/4 as calculated in Eq. (1.22). If the effect of the stator resistance on the power factor value is ignored, the power factor cosϕ can be estimated from Fig. 1.11b as

33
κδϕ −+≈2π
. (1.35)
At the maximum SynRM torque load-angle the power factor angle reaches the value of
κδϕ −+≈2π
maxt,max t, = κ−+2π
4π
= κ−4
3π. (1.36)
At the motor operation area the current angle is in the range of
∈
2π,0κ , (1.37)
At the maximum torque the SynRM power factor is thus less than
<
4πcosmaxt,δ = 0.707. (1.38)
If the stator resistance and the iron losses are ignored and the inductances are assumed to be not depending of the load angle, the maximum power factor ϕt,max can be found from the equations as
ss
emaxt,cos
impuT ω
ϕ = , (1.39)
Using Eqs (1.17), (1.31) and (1.39) the power factor is
( )( ) ( ) 2
sq2
sd2
sqq2
sdd
sqsdqdcosiiiLiL
iiLL
++
−=ϕ . (1.40)
The maximum power factor producing current angle can be found by differentiating Eq. (1.40) with respect to the current axes ratio isd/isq and finding zero for the derivative
q
d
sd
sq
LL
ii
= . (1.41)
According to Eq. (1.40) the power factor achieves its maximum when the current angle is
q
darctanLL
=κ . (1.42)
and the maximum power factor is
1
1cos
q
d
q
d
max+
−
=
LLLL
ϕ . (1.43)

34
Fig. 1.15a and 1.15b show the respective power factor values as a function of the load-angle and current vector angle. The saliency ratio is a parameter.
0
0.1
0.2
0.3
0.4
0.5
0.6
0.7
0.8
0.9
1
0 15 30 45 60 75 90
Load angle [electrical degs ]
Pow
er fa
ctor
L d/L q= 50
L d/L q= 10
L d/L q= 5
a)
00.10.20.30.40.50.60.70.80.9
1
15 30 45 60 75 90
Current angle [electrical degs]
Pow
er fa
ctor L d/L q=50
L d/L q=10
L d/L q=5
b)
Figure 1.15. The calculated power factor as a function of a) the load-angle and b) current angle. The sali-ency ratio Ld/Lq in the calculations is a parameter. The leakage inductance Lsσ has been ignored. From Figs. 1.14 and 1.15a it can be noticed that the maximum torque and maximum power fac-tor values are achieved at different load angles. The Figs. 1.15a and 1.15b show also that the

35
maximum power factor values are achieved at lower load angles and higher current angles as the saliency ratio increase. The 30 kW four-pole IM per unit static torque in direct network starting as a function of per unit slip is illustrated in Fig. 1.16.
Figure 1.16. The 30 kW four-pole IM torque per unit and power factor values as a function of the motor slip. From Fig. 1.16 it can be noticed that the IM maximum torque may be achieved at a different slip than the maximum power factor. The calculated power factors for the 30 kW four-pole IM and SynRM as a function of the motor output power are illustrated in Fig. 1.17. The inductance parameters in the calculation of the SynRM are set so that the quadrature axis inductance is kept constant and the direct axis induc-tance limits the no-load current of the SynRM to be equal to the no load current value of the IM at saliency ratio value of 10.
0 0.5 1 1.5 200.10.20.30.40.50.60.70.80.9
1
Pow
er fa
ctor
Motor load p.u.
a)
0
0.1
0.2
0.3
0.4
0.5
0.6
0.7
0.8
0.9
1
0 0.5 1 1.5 2
Pow
er fa
ctor
L d/L q=50
L d/L q=10
Ld/Lq=5
Motor load p.u.
b) Figure 1.17. Calculated power factors as a function of the motor partial load for a) the IM and b) SynRM. For the SynRM the saliency ratio Ld/Lq in the calculations is a parameter. The leakage inductances Lsσ have been ignored. The highest power factor values are found using only very small air-gap lengths – smaller than the IM air-gap length.

36
From Fig. 1.17 it can be noticed that a SynRM with a high saliency ratio achieves a good power factor also at lower partial loads. To achieve for the SynRM a nominal point power factor equal to that of the IM the d-axis magnetising inductance of the SynRM must be higher than the mag-netising inductance of the IM. This aspect will be discussed more in detail in chapters 2 and 3. The vector diagram in Fig. 1.18 illustrates the SynRM power factor value when the saliency ratio is Ld/Lq = 5, the load angle is δ = 37.5° and the current angle is κ = 75.4°. These values have been marked with small circles in Figs. 1.16a and 1.16b.
d-axis
is
κ=75.4
us
cosϕ=0.614 δ=37.5
ψq
ψd
q-axis
o
o
Figure 1.18. The SynRM vector diagram. The SynRMs efficiency at different saliency ratios is estimated as
LossOut
Out
PPP+
=η , (1.44)
MechFes2
se
e
+++=
PRImTT
ωω
η , (1.45)
MechFes2sqdqd
2 's
qdqd2 '
s
)2sin()(
)2sin()(
+++−
−=
PRImIILLUm
IILLUm
δ
δη . (1.46)
To simplify the evaluation in this case the loss component PFe+Mech consists of the no-load iron losses and the mechanical losses and the effects of the stray load losses are ignored. The load dependent iron losses are ignored. The calculated results as a function of the load angle and current angle are shown in Fig. 1.19. The values used in the calculations are given in Table 1.2. Because the quadrature axis inductance is quite independent of the air-gap length, this axis inductance is chosen for the initial parameter where the d-axis inductance is calculated using the saliency ratio.

37
80
82
84
86
88
90
92
94
96
0 20 40 60 80
Load-angle [electrical degs]
Effic
ienc
y
L d/L q=50
L d/L q=10
L d/L q=5
a)
80
82
84
86
88
90
92
94
96
20 30 40 50 60 70 80 90
Current angle [electrical degs]
Effic
ienc
y
L d/L q=50
L d/L q=10
L d/L q=5
b)
Figure 1.19. The calculated efficiency as a function of a) the load-angle and b) current angle. The saliency ratio Ld/Lq in the calculations is a parameter. The calculated efficiency values are relative optimistic. This may be explained by the fact that, firstly, the torque values were calculated using current values which do not take into account the effect of iron losses and, secondly, the inductance values used ignore saturation.

38
1.5 SynRM rotor constructions When designing a rotor for a high performance SynRM it should be found the largest possible inductance ratio to guarantee the best power factor and the best efficiency for the machine. No primitive solutions can thus be allowed and the solution should most probably consist of multi flux barrier features. Fig. 1.20a. introduces an approach suggesting a design which produces a quite small q-axis inductance because of the large air gap. But, at the same time the d-axis in-ductance remains small and thus the inductance ratio remains in the rang of 2 … 3 which does not produce good enough properties for the motor. This rotor type does not bring the satisfac-tory performance results and can not compete e.g. with the performance of the IM. The synchronous reluctance motor needs a high saliency ratio to be competitive with the induc-tion motor. To achieve a high saliency ratio there are, in principle, two different possible ways of manufacturing the synchronous reluctance motor rotor: with transversal laminations (TLA) Fig. 1.20(b) or with axial laminations (ALA) Fig. 1.20(c).
a) b) c)
Figure 1.20. Synchronous reluctance rotor designs: (a) Salient pole rotor (b) Transversally Laminated Ani-sotropic (TLA) rotor and (c) Axially Laminated Anisotropic (ALA) rotor. Transversely laminated rotors (TLA) are made of standard flat laminations, where the flux bar-riers are punched in order to obtain the preferred flux paths. In the ALA type rotor laminations are interleaved with nonmagnetic material. The ALA type rotor has been introduced in the lit-erature since 1923 (Kostko 1923, Douglas 1956, Cruickshank 1966, El-Antably 1985). The TLA type rotor is decribed e.g. in (Kurscheidt 1961, Brickman 1965). The ribs of the TLA type rotor fundamentally reduce the q-axis reluctance and so this rotor type has inherently a lower saliency ratio than the same shape ALA-type motor where no ribs are needed. Magnetic tangential webs have the advantage that they make the rotor surface smooth and thus decrease the volume of the air-gap flux harmonics. The flux barriers reduce the q-axis flux and increase thus the saliency ratio. The TLA rotor type is probably the only model that can be manufactured at moderate costs and for this reason factories producing squirrel cage IMs are concentrating their interest on this type. Regarding the rotor surface losses caused by the air gap spatial harmonics the thin transversal laminations also are beneficial. However, with this rotor type it may not be possible to reach the largest possible inductance ratios.

39
The ALA-type rotor structure makes it possible to use numerous flux barriers and to leave the tangential and inner ribs out and thus to achieve the highest possible inductance ratios. In the ALA type rotor numerous flux barriers are used to decrease the air gap flux spatial harmonic contents and to reduce the torque ripple and iron losses. Stator slot openings create air gap flux density variations that readily induce the eddy currents in the ALA-structure. Thus, the lamina-tions must be thin and highly resistive. However, the ALA-rotor is more difficult and probably much more expensive to manufacture than a squirrel cage rotor. Bomela (1999) suggests the skewing of the SynRM rotor by one slot pitch to reduce the torque ripple drastically (from more than 20 % to less than 5 %). This skewing has only a little effect on the average torque. The sheets of the TLA-type rotor are much easier to skew than the inter-leaved sheets of the ALA-type rotor. The torque ripple can also be reduced by chording the sta-tor windings. Based on (Bomela 1999) chording has little effect on the torque ripple of the SynRM while it significantly reduces the average torque. On the other hand, this analysis con-siders only rotors with a number of flux barriers that is less than the number of the stator slots. The number of flux barriers of the ALA-type rotor is not that limited as that of the TLA-type rotor. For reasons of manufacturing the TLA type motor appears to be the better alternative for the induction motor than the ALA type motor. The TLA type motor can be built at low costs and its rotor can be skewed to decrease the torque ripple. In recent years a number of studies has been done to compare the performance of induction mo-tors and synchronous reluctance motors. The studies are mainly focusing on the motor effi-ciency and power factor. The feasible SynRM rotor types that are comparable with the IM are the transversally laminated (TLA) and the axially laminated (ALA) rotors. Due to its ribs the TLA-rotor has a lower saliency ratio than the ALA-type. However, the TLA-motor appears to be the better alternative for the IM since it can be manufactured using the same kind of punch-ing tools as used for the manufacturing of the rotor laminations of an IM. The TLA skewed ro-tor needs a relatively small air gap to improve the inductance ratio. Table 1.3 gives some ex-tracts from the IM vs. SynRM comparisons. Table 1.3. Induction motor and synchronous reluctance motor comparison Power [kW]
Pole Num-ber
Saliency ratio
Rotor Type
Efficiency [%]
SynRM IM
Power factor SynRM IM
Reference
11 6 ALA 94 91 0.89 0.78 El-Antably 1985
0.12 4 9.09 ALA 66 62.6 0.86 0.697 Staton 1993a 11 4 11.19 ALA 89.55 88.2 0.855 0.867 Staton 1993a 11 4 10.86 TLA 89.63 88.2 0.850 0.867 Staton 1993a 6 4 11.16 TLA 88.0 88.8 0.853 0.688 Staton 1993a 6 4 11.56 ALA 88.25 88.8 0.856 0.688 Staton 1993a
7.5 4 9.6 ALA 85.5 87.5 0.81 0.72 Soong 1993a 0.65 4 9.5 ALA 77.3 74.1 Fletcher 1995b
4 4 8.8 TLA 87.1 83.4 0.81 0.81 Gertmar 1995 1.5 4 7.5 ALA 71.2 75 0.63 0.78 Hippner 1996 7.5 4 12.5 ALA 81.6 87.3 0.937 0.84 Chalmers 1998 0.2 4 7.5 TLA 73.3 70.9 Kiriyama 1998 35 4 TLA 86 83 Senjyu 1998 35 4 ALA 81 83 Senjyu 1998 5.5 4 TLA 89.6 85 0.68 0.83 Bomela 1998 37 4 TLA 92.4 92.1 0.76 0.82 Bomela 1998

40
Generally, the studied SynRMs are based on the frame of a small or medium power four-pole standard induction motor and both the TLA and ALA type rotor are used. In the reference pa-pers the SynRMs are driven by current controlled converters with a position sensor. In a consid-erable number of the papers the efficiency of the SynRM is considered to be better and the power factor lower than those of the competing IM. The power factor values of the SynRMs characterize the saliency ratio of the motor. Staton (1993b) has fed the IM with a sinusoidal supply at 11 kW power, but when supplied from an inverter the motor power has been derated to 6 kW to provide the variable speed 10:1 speed ratio with a constant torque. Despite of the values given in the papers (Table 1.3) it is not at all very straightforward to reach any conclusions concerning the performance superiority between the SynRM and the IM. The performance of the motors are very much dependent on the control method used in the drive. The results given for the SynRMs are reached using some current control. For the SynRMs shown in Table 1.3, the following control strategies were used [Betz 1993]:
1) Maximum Torque Control (MTC), where maximum torque/ampere is obtained by set-ting the load angle δ = π/4.
2) Maximum Rate of Change of Torque Control (MRCTC), where the load angle is set to be δ = tan-1ζ.
3) Maximum Power Factor Control (MPFC), where the load angle is set to 4) be δ = tan-1ζ 0,5. 5) Constant Current in Inductive Axis Control (CCIAC), where the constant current is
maintained in the d-axis and the torque is manipulated by the q-axis current. The control strategies used for the IM are not mentioned in the papers, which makes the com-parison even more difficult. In most of the papers the power factor of the SynRM is lower compared to the power factor of the IM. On the other hand, the major part of the papers come to the conclusion that the effi-ciency of the SynRM is better than that of the IM. The articles, however, are quite old and for this reason the efficiencies of the competing induction motors seem not to be very high. The efficiencies of the induction motors have enhanced during the latest years and thus the competi-tion in efficiency has grown even tougher. The efficiency of a high efficiency IM is difficult to reach with a SynRM

41
1.6 Outline of the thesis The main goal of this thesis is to present a theoretical and practical SynRM vs. IM comparison and to design a synchronous reluctance motor for an industrial frequency converter drive within the constraints given by the initiator of the work. One of the main constraints is that the stator of the original induction motor must be utilized for the designing of the SynRM. Another obvious constraint is to study more specifically the performance of the TLA-rotor type because it offers some important manufacturing benefits compared to the ALA-rotor. The research work of this thesis is structured as follows: • studying of methods to design and analyse the performance of the synchronous reluctance
motor. • comparing the SynRM and induction motor performances. • designing a technically competitive synchronous reluctance motor for variable speed appli-
cation. The thesis is divided into six chapters. The fundaments, the goals and the motivation for this work are given in chapter 1. Chapter 2 introduces a background theory of the iron loss mecha-nism and the behaviour of the dq-axes inductances in reluctance machines. Chapter 3 considers the possibilities of replacing four-pole induction motors by synchronous reluctance motors in the power range from 1.1 kW up to 90 kW in variable speed drives. Chapter 4 discusses the synchronous reluctance performance analysis using the finite element method and gives a com-parison between the measured and the calculated values. The rotor design evolution of the SynRM using the finite element method is also given. An experimental evaluation of the syn-chronous reluctance motor and comparison with the induction motor torque output is given in chapter 5. Chapter 6 provides a summary of the work. Ideas for further investigation are sug-gested. 1.7 Scientific contributions of the thesis This thesis shows that using the stator of the same size three-phase induction motor the effi-ciency of the transversally laminated SynRM is equivalent to that of a corresponding high effi-ciency IM in variable speed drives. However, the power factor on the SynRm is somewhat lower than the power factor of an IM. By redesigning the stator it might be possible to reach more competitive values for the power factor. Using the FEM designed multi-layer transversally laminated rotor with damper windings it is possible to design a directly network driven motor without degrading the motor efficiency or power factor compared to the performance of the IM. The power factor of the SynRM at rated load is smaller than that of the IM. However, at lower partial load this difference decreases and this, probably, brings that the SynRM gets a better power factor in comparison with the IM. The big rotor inductance ratio of the SynRM allows a better estimating of the rotor position. This appears to be very advantageous for the designing of the rotor position sensor-less motor drive. The calculation methods developed in the thesis give accurate results. Comparison between the calculated and measured values shows that the design methods are reliable. A new application of the IEEE 112 measurement method is developed and used especially for determination of stray load losses in laboratory measurements.

42
2 SYNCHRONOUS RELUCTANCE MOTOR In this chapter the effects of the self and cross saturation and iron losses on the synchronous reluctance motor performance are described. The cross saturation between the d- and q-axes means that the axes inductances may not be considered independent. A more thorough introduc-tion to cross saturation is given in chapter 2.2. Two main rotor types (ALA and TLA) and their properties are studied. Also the effect of the rotor position with respect to the stator slot openings is described. The direct and the quadrature axes inductances Ld and Lq introduced in chapter 1 consist of the magnetising inductances Lmd and Lmq and the leakage flux inductances Lsdσ and Lsqσ of the re-spective axes as Ld = Lmd + Lsdσ, (2.1) Lq = Lmq + Lsqσ. (2.2) Here, it is first assumed that there is no cross-saturation between the axes: Lmd = f(Id,0), Lmq = f(0, Iq). If cross saturation is taken into account the inductances may be expressed as Lmd = f(Id, Iq), Lmq = f(Id, Iq). The effect of cross saturation will be analysed in section 2.2. If the iron loss effects are taken into account the magnetising currents imd, imq are not equivalent to id, iq. The effect of the iron losses will be analysed in section 2.3. 2.1 Inductance analysis of the SynRM To estimate the magnetising inductances analytical or FEM calculations may be used. The latter method offers the possibility to solve the flux path more exactly and to take into account also the rotor position and the self and cross saturations. The fundamental magnetising inductance Lm of a saturated, uniform air-gap AC machine may be expressed as (Vogt 1996)
21
2
s
0m '
πξ
δµ
=
pNDLmL , (2.3)
where µ0 - the permeability of vacuum, m - the number of phases, δs - the effective air-gap, D - the stator bore diameter, L´ - the stator stack effective length, N - the number of turns in a phase, p - the number of pole pairs, ξ1 - the fundamental winding factor. The effective air-gap length δs takes normally into account also the effect of the self-saturation in the iron parts as

43
etot
s δδδ
⋅=VV , (2.4)
ertstrbsb
s 2)(2δδ
δ
δ
VVVVVV ++++
= , (2.5)
where Vtot - the total magnetic voltage (mv) of the machine, Vδ - mv in the air-gap, Vsb - mv in the stator yoke, Vrb - mv in the rotor yoke, Vst - mv in the stator tooth, Vrt - mv in the rotor tooth, δe - the equivalent air-gap, but it may also include the cross saturation effects and thus produce the right inductance values in a cross-saturated machine as well. The equivalent air-gap δe is calculated by multiplying the mechanical air-gap length δm by the Carter factor kC (Carter 1901).
mCe δδ k= . (2.6) The Carter factor accounts for the effect that the flux density drops under the stator and rotor slots, which can be seen from Fig. 2.2b. If a rotor with no tangential ribs is used (as in ALA type rotors), also the effect of the rotor “slot” opening should be considered. A wide “cut-out” in the rotor surface affects the respective axis value in a same way. This would make the calcu-lation of the Carter factor or the effective air-gap length more complicated because the re-placement of a rotating slot opening should be considered. In the case of the TLA type motor without cut-outs, the rotor is closed and thus the rotor surface is smooth. As it has been shown in Eq. 1.17 the torque production of the SynRM is proportional to the difference of the magnetising inductances of the axes. Thus, if the SynRM stator is kept equiva-lent to that of the IM the length of the active parts, the winding factor, air-gap diameter and the number of turns in the series per stator winding are the same. The main limiting parameter for the SynRM magnetising inductance, according to Eq. (2.3), is the air-gap length. To maximise the d-axis inductance the flux guides should ideally have the same shape as the flux path shown in Fig 2.1a. And to minimise the q-axis flux linkage the flux barriers should be perpendicular to the flux lines, as it is shown in Fig. 2.1b. The risk of self-saturation occurring on the d-axis flux path is high as the d-axis flux density in the d-axis iron parts is high. The flux barriers reduce the q-axis flux so that the risk of saturation on the q-axis flux path is remarkably lower. This effect is illustrated in Figs. 2.1c and 2.1.d. The flux solutions are calculated for the experimental SynRM introduced later in the thesis. The nominal values of the experimental machine are, UN = 400 V, IN = 66 A, IdN = 10 A, IqN = 65 A, Dδ = 215 mm, δ = 0.4 mm.

44
a)
b)
c) d)
Figure 2.1. Synchronous reluctance motor flux plots a) in the d-axis and b) in the q-axis and the relative permeability of the material in c) the d-axis and d) the q-axis with Id= Iq. According to Fig. 2.1c, the most saturated areas on the d-axis flux-path are the stator teeth. There occurs slight saturation also on the rotor’s first three flux guides from the centre and in the stator yoke between the d-axis poles. The saturation in the innermost flux guide is lower than in the next two ones. The respective stator tooth meets the maximum flux and is the most heavily saturated. This means that to decrease the saturation on the d-axis the amount of iron in the stator should be increased. However, as in fact the amount of the stator copper should also be increased, this makes optimisation difficult. In the q-axis (Fig. 2.1d) only the rotor ribs and webs are saturated. In no-load the fundamental current in the rotor bars of an IM is very low and thus the rotor situation corresponds to that of the SynRM. If the number and the width of IM rotor bars are equal to the SynRM flux guides and if the air-gap length is kept the same it may be assumed that also the d-axis inductances will be the same.
( ) ( )SynRMmdIMm LL ≈ . (2.7) In the following, the cross saturation effect is taken into account using the so-called reluctivity matrix. To estimate the reluctivity matrix used in the cross-saturation FEM calculations first the fluxes in the d-axis direction and the q-axis direction are calculated using the appropriate cur-rent values. The reluctivities of each element are stored in the reluctivity matrices. Both matri-ces are then unified to one cross-saturation reluctivity matrix by selecting the maximum reluc-

45
tivity for each element. This, in practice, enables the use of different permeabilities in the d- and q-axes directions in the FEM-calculations. The results achieved (see Fig. 2.20) with this method seem to coincide well with the experimental torque measurement results. Thus, in the FEM cal-culation the d- axis inductance Lmd(id, iq) can be found from
d
qdd1pph1
d
mdqdmd ˆ
)ˆ,ˆ(ˆ'π3
),(i
iiblN
iiiL δ
τξψ== , (2.8)
where
mdi - the peak value of the d- axis stator current,
mqi - the peak value of the q- axis stator current,
ξ1 - the fundamental winding factor, Nph - the number of turns in series per phase, τp - the pole pitch,
δd1b - the peak value of the fundamental wave of the d-axis air-gap flux density, The pole pitch τp is determined as
pD
⋅⋅= 2
πpτ , (2.9)
where D - the stator bore diameter, p - the pole pair number. The field plots of the solved FEM-problem and the air gap flux density distribution for the TLA-type motor are illustrated in Fig. 2.2.
a)
Angle [mechanical radians]
b) Figure 2.2. a) The solved FEM-problem of the prototype motor and b) the air-gap normal flux density distribution (distorted curve) and the fundamental wave of the air-gap flux density (sine wave). In the figure Id= 10 A, which correspond with the no-load current at the used motor model air-gap length (0.3 mm).

46
In a rough analytical estimation for the q-axis reluctance the equation used for the d-axis may be used by increasing the q-axis air-gap length as to contain also the sum thickness of the flux barriers and the effects of the saturated iron ribs and webs. The analytical estimation of the q-axis inductance is difficult because the path of the q-axis flux is not that straightforward. Also the permeability of the q-axis iron is complicated to determine. Using equation (2.3) the q-axis inductance may be written
21
2
bs
0mq '
πξ
δµ
+≈
∑ pNDl
lmL
n
, (2.10)
where lb is the length of each flux barrier and n is the number of flux barriers. This equation does not take into account the effect of saturation in the ribs and webs or cut-outs. Therefore, the q-axis inductance value of the transversally laminated type structure using Eq. (2.10) gives too low values compared to the results given by the FEM calculations. Taking Lmd and Lmq from equations (2.10 and 2.11) gives a possibility to determine the induc-tance ratio. According to Soong (1993), however, the intrinsic saliency ratio ζi, which is the maximum possible saliency ratio for a given motor geometry, may be simplified defined as
sq
mi δ
ζpr
LL
=≡ , (2.11)
where r is the radius of the rotor. Similarly, the intrinsic magnetising saliency ratio ζmi
smq
mmi δ
ζpar
LL
=≡ . (2.12)
where a is the ratio of the insulation thickness wins to the sum of the insulation and lamination thickness (wins + wlam). This intrinsic saliency ratio is the maximum saliency ratio theoretically achievable with a given motor geometry. Practical motors generally achieve, depending on their design, unsaturated saliency ratios that are only 20 … 40 % of the given ratio. The q-axis inductive may thus be evaluated using the saliency ratio equations shown above and calculating the d-axis inductance as
mi
mdmq ζ
LL ≡ . (2.13)
The magnetic field solution and the air-gap flux density distribution for a TLA-type motor are illustrated in Fig. 2.3.

47
q-axis
d-axis
a)
Angle [mechanical radians]
b) Figure 2.3. a) The q-axis flux and b) the air-gap flux density distribution (distorted curve) and the funda-mental wave of the air-gap flux density (sine wave). In the figure Iq= 55 A. Table 2.1. Comparison between analytical formulas and FEM-analysis of ALA-type and TLA-type SynRM rotors. Id = Iq, air-gap length is 0.8 mm, insulation ratio w = 0.5, r = 107.2 mm, pole pair number p=2.
Parameter Analytical FEM (ALA) FEM (TLA) Lmd [mH] 130 105 120 Lmq [mH] Eq. (2.10) 4.4 2.3 19 Lmq [mH] Eq. (2.13) 3.9 2.3 19
According to the result of Table 2.1 the d-axis inductances for TLA and ALA type rotors are quite equivalent, as for the q-axis inductance the difference is remarkable. It may be assumed that the higher d-axis inductance of the TLA type rotor is caused by the smoother rotor surface, which decreases the effect of air-gap harmonics. This effect is illustrated in Fig. 2.4 which shows the air-gap flux density and its harmonic content at a current value of 10 A for TLA and ALA type rotors.
Angle [mechanical radians] a)
Angle [mechanical radians] b)
Figure 2.4. The air-gap flux densities for a) a TLA type and b) a ALA type SynRM rotor using a 10 A peak current and an 0.4 mm air-gap length. The corresponding harmonic flux density amplitudes are shown in Table 2.2.

48
Table 2.2. The air-gap flux density values for different harmonics Harmonic order TLA B [T] ALA B [T]
1. 0.878 0.799 5. 0.018 0.073 7. 0.032 0.011 11. 0.024 0.133 13. 0.258 0.127
According to Fig. 2.4 and Table 2.2 the tangential ribs in the TLA type rotor seem to reduce the superharmonic contents of the air-gap flux density. Because especially the d-axis inductance is very sensitive to saturation it is used a very low current value for the comparison between the analytical and FEM-calculations. According to the results, Eqns. (2.10) and (2.13) give quite equal results for the unsaturated inductances, es-pecially for the TLA type rotor. With the analytical equations the q-axis inductance adopts val-ues that are much higher than the FEM calculated respective values. This is referred mainly to the ribs and webs, which decrease the reluctance. 2.2 Effect of cross saturation If the iron is magnetically linear, the flux generation processes in d-axis and q-axis are inde-pendent, so
mdmdmd iL=ψ , (2.14)
mqmqmq IL=Ψ . (2.15) The magneto-motive force acting on the d-axis affects, however, the ability of the q-axis mag-neto-motive force to create flux and vice versa, i.e the flux generation processes in the d- and q-axis are not independent of each other. In this case, the modelling of the cross-saturation may be given as:
),( mqmdmdmd iiψψ = , (2.16)
),( mdmqmqmq iiψψ = . (2.17) Assuming that the machine is symmetrical
0when,0 mdmd == iψ even though 0mq ≠i , (2.18)
0when,0 mqmq == iψ even though 0md ≠i . (2.19) Thus, the functions (2.14) and (2.15) may be defined in the following forms:
mdmqmdmdmd ),( iiiL=ψ , (2.20)
mqmdmqmqmq ),( iiiL=ψ . (2.21)

49
The FEM calculated effects of the self and the mutual inductance cross saturations are here given only for test motor 5. This TLA-type motor is introduced later in chapter 4. The magnet-ising inductance values are shown in Figs. 2.5a and 2.5b. The currents in the figures are rms values.
0.10
0.20
0.30
0.40
0.50
2 7 12d-axis current [ A ]
Lm
d ind
ucta
nce
[ H ]
I q = 0 A
I q = 7 A
I q = 14 A
I q = 28 A
I q = 39 A
I q = 55 AI q = 64 A
a)
0.015
0.025
0.035
0.045
0.055
0.065
0.075
0.085
0.095
0 5 10 15 20 25 30 35 40 45 50 55 60 65q-axis current [ A ]
Lm
q ind
ucta
nce
[ H ]
I d= 0 A
I d= 7 A
I d= 14 A
b)
Figure 2.5. FEM calculated self- and cross-saturation effects for the test SynRM 5 a) d-axis and b) q-axis inductances. The q- and d-axis currents respectively are used as parameters.

50
These figures indicate clearly that the effect of cross saturation is significant especially for the d-axis inductance and may not usually be neglected in the analysis of the synchronous reluc-tance motor behaviour. 2.3 Stator leakage inductance The leakage inductances of the SynRM are generally defined applying the same analytical equations as used for the induction motors (Richter 1954, 1967). The reasons for this are that in the SynRM it may be used a stator equivalent to the IM stator and, on the other hand, these tra-ditional equations give accurate enough results, especially, since the per unit stray inductance is small compared to the magnetising inductances. Because at steady state the rotor of the SynRM rotates at synchronous speed there exists neither rotor current nor rotor leakage flux. Thus, the leakage inductance may be expressed only for the stator. Of course, there occurs some kind of leakage flux also in the rotor because of the conducting iron sheets or real damper windings. However, at synchronous speed there is no need to study this phenomenon in detail. According to the equations by Richter (1963, 1967) for the stray inductances and the parameters shown in Appendix A the results are given in Figure 2.6. These results are valid for the geome-try of the original 30 kW four-pole ABB squirrel cage motor. The air-gap length is a variable.
0.0E+00
2.0E-04
4.0E-04
6.0E-04
8.0E-04
1.0E-03
1.2E-03
1.4E-03
1.6E-03
1.8E-03
2.0E-03
0.2 0.3 0.4 0.5 0.6 0.7 0.8Air-gap length [ mm ]
Indu
ctan
ce [
H ]
Skew inductanceCoil end inductanceTooth-top inductanceSlot inductanceAir-gap inductance
Figure 2.6. Four-pole ABB 30 kW induction motor’s stator leakage inductance as a function of the air-gap length. The original air-gap length of the motor is 0.8 mm. The leakage inductance is proportional to the length of the air-gap. As it is shown in Fig. 2.6, decreasing the air-gap length from the initial value of 0.8 mm down to 0.3 mm would increase the total leakage flux inductance of the initial induction motor stator by about 40 %. On the other hand, in the pilot SynRM the air-gap width on the d-axis is not equivalent to the respec-tive value on the q-axis because of the cut-out. The main target of the rotor cut-out is to de-crease the magnetising inductance of the respective axis and increase thus also the reluctance torque. The cut-out, however, decreases also the stator d-axis leakage inductance and decreases thus the motor power factor slightly. In the prototype motor the q-axis maximum air-gap length is 10 mm, as for the d-axis the corre-sponding value is only 0.4 mm. The d-axis magnetising currents lie mainly in the q-axis area.

51
Because the q-axis air-gap length is so wide, the d-axis leakage inductance consists mainly of the air-gap length independent inductance parameters, which are the slot- and the coil-end leak-age flux inductances. In assuming this the d-axis leakage inductance in the case of the prototype motor is about 70 % lower that the corresponding value of the d-axis. However, the q-axis air-gap is not so long in the whole q-axis pole area but only one third of the slots are in the q-axis cut-out area and thus this effect is remarkably reduced. Since the leakage inductance is small compared to the magnetising inductances a constant value corresponding to the d-axis air-gap length for Lsσ is used in the analytical evaluations. When using the FEM-approach the variation of the leakage in different axes is automatically taken into account except for the effects of the end windings leakage. The end winding leakage induc-tance is in these cases assumed to be a constant. 2.4 Effects of iron losses For motor vector control purposes the stator iron losses may usually be neglected. However, for the designing a SynRM the iron losses are an important factor because they may decrease torque production in a considerable way. For this reason, the iron loss resistances are introduced in the equivalent circuits. The effects of the iron losses on the torque production of synchronous reluctance motors were discussed in Refs (Longya 1991, Betz 1992, Levi 1995). The equivalent circuits including the iron loss components are shown in Fig. 2.7. In the figure the resistances Rcd and Rcq, represent the equivalent steady state core losses in the motor (Longya 1991). If the iron loss components are included the direct and quadrature axis current components are isd = imd − icd, (2.22) isq = imq + icq, (2.23) where icd and icq express the iron loss components.
Rs
Rcd
isd imd
icd
Ψmqω
Lmd
Lsσd
usd
a)
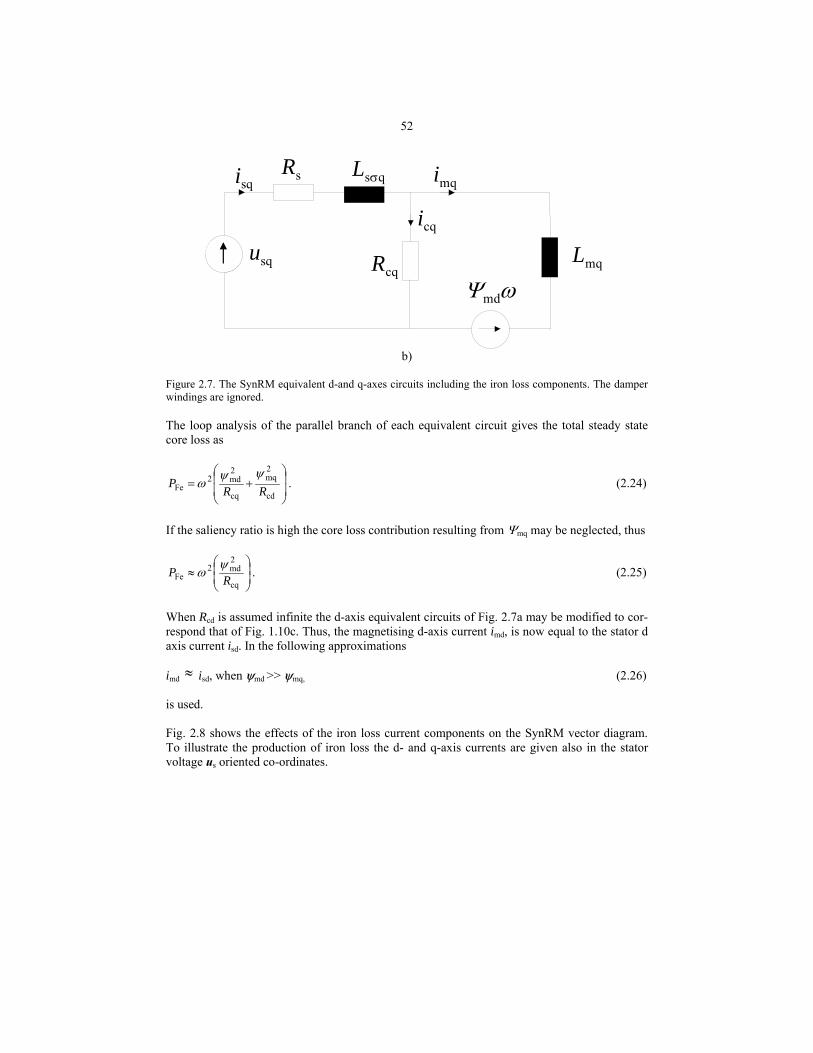
52
Rs
Rcq
imq
icq
Lmq
isqLsσq
Ψmdω
usq
b)
Figure 2.7. The SynRM equivalent d-and q-axes circuits including the iron loss components. The damper windings are ignored. The loop analysis of the parallel branch of each equivalent circuit gives the total steady state core loss as
+=
cd
2mq
cq
2md2
Fe RRP
ψψω . (2.24)
If the saliency ratio is high the core loss contribution resulting from Ψmq may be neglected, thus
≈
cq
2md2
Fe RP
ψω . (2.25)
When Rcd is assumed infinite the d-axis equivalent circuits of Fig. 2.7a may be modified to cor-respond that of Fig. 1.10c. Thus, the magnetising d-axis current imd, is now equal to the stator d axis current isd. In the following approximations imd ≈ isd, when ψmd >> ψmq, (2.26) is used. Fig. 2.8 shows the effects of the iron loss current components on the SynRM vector diagram. To illustrate the production of iron loss the d- and q-axis currents are given also in the stator voltage us oriented co-ordinates.
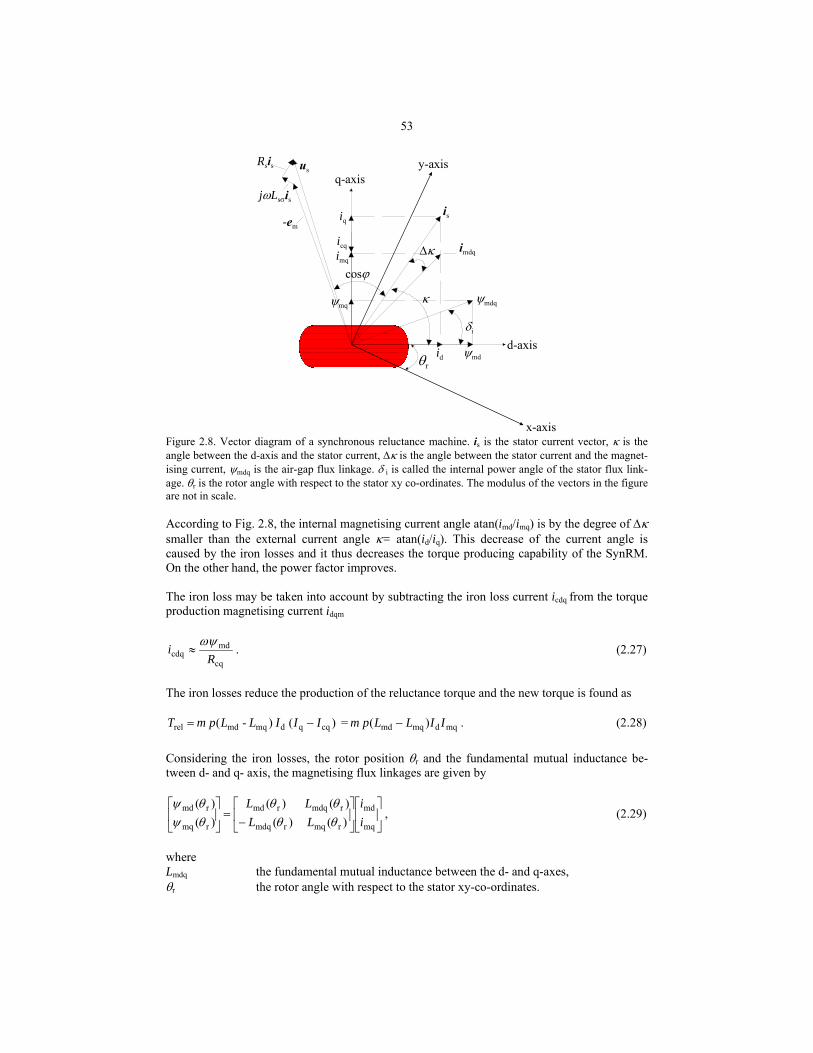
53
iq
d-axis
q-axis
imq
ψmq
id
is
imdq
κ
∆κ
δi
y-axis
x-axis
θr
icq
-em
cosϕ
us
jωLsσis
Rsis
ψmdq
ψmd
Figure 2.8. Vector diagram of a synchronous reluctance machine. is is the stator current vector, κ is the angle between the d-axis and the stator current, ∆κ is the angle between the stator current and the magnet-ising current, ψmdq is the air-gap flux linkage. δ i is called the internal power angle of the stator flux link-age. θr is the rotor angle with respect to the stator xy co-ordinates. The modulus of the vectors in the figure are not in scale. According to Fig. 2.8, the internal magnetising current angle atan(imd/imq) is by the degree of ∆κ smaller than the external current angle κ= atan(id/iq). This decrease of the current angle is caused by the iron losses and it thus decreases the torque producing capability of the SynRM. On the other hand, the power factor improves. The iron loss may be taken into account by subtracting the iron loss current icdq from the torque production magnetising current idqm
cq
mdcdq R
iωψ
≈ . (2.27)
The iron losses reduce the production of the reluctance torque and the new torque is found as
)( )-( cqqdmqmdrel IIILLpmT −= = mqdmqmd )( IILLpm − . (2.28) Considering the iron losses, the rotor position θr and the fundamental mutual inductance be-tween d- and q- axis, the magnetising flux linkages are given by
−
=
mq
md
rmqrmdq
rmdqrmd
rmq
rmd
)()()()(
)()(
ii
LLLL
θθθθ
θψθψ
, (2.29)
where Lmdq the fundamental mutual inductance between the d- and q-axes, θr the rotor angle with respect to the stator xy-co-ordinates.

54
The instantaneous torque Te in the rotor reference frame including the iron loss components is
)(23
mdmqmqmde iipT ψψ −= . (2.30)
The iron losses have two effects; firstly, they reduce the output power and, secondly, they in-crease the external current angle. There are two methods to solve iron losses in the FEM calculations; the time-harmonic or the time-stepping method. The time-harmonic method is a relatively fast method to analyse the machine performance at steady state. The equation used in FEM to calculate the iron loss power density Fe'dP in steady state is
f5.1
e2
222
hFe 67.8)ˆ(()ˆ(6
πˆ'd kfBkfBdfBkP
⋅++=
σ , (2.31)
where B - the maximum fundamental flux density of the element under investigation kh - the hysteresis loss coefficient, σ - the conductivity, ke - the excess loss coefficient, d - the sheet thickness and kf - the stacking factor. The loss constants kh and ke are determined by curve fitting to measured iron loss data measured on a single-sheet test rig (Mueller 1995). Table 2.4 shows the coefficients used and determined from the curve fitting the information that is supplied by the sheet manufacturer (Surahammar 1998). Table 2.4. The iron loss coefficients used in the calculations
Coefficient Value Material DK-70 Hysteresis loss kh [WsT-2m-3] 152 Conductivity σ [(Ωm)-1] 4⋅106 Excess loss ke [W(Ts-1)-3/2m-3] 2.32 Sheet thickness d [m] 0.5⋅10-3 Stacking factor kf 0.98
The iron loss calculation can be done also in a periodic state (time-stepped calculation over one complete period) including also the harmonics effect.
∫ ∫
+
+=
T Ttkt
tBkt
tBd
TkfBktP
T 0 0f
5.1
e
222
f2
hFe d)(dd)(
dd
12π1ˆd'd1 σ . (2.32)

55
The motor iron loss is found by integrating Eqs. (2.31) or (2.32) over the total magnetic circuit volume. In the time-stepping calculation one complete period must be resolved, which correspondingly increases the calculation time and the requirements for the computer memory. The FEM calcu-lated iron loss values for both stator and rotor iron of the IM and the TLA-type SynRM are pre-sented in Table 2.5. Table 2.5. The effects of the harmonic fields on the iron losses of the IM (air-gap length δ = 0.8 mm) and TLA-type SynRM (air-gap length δ = 0.4 mm, stator slot with slot wedges). The measured iron loss values are shown in parenthesis. In the load test the IM was supplied by the electric grid and the SynRM by a DTC converter. In the no-load values the additional losses are ignored and in no-load test both motors were supplied by the grid.
Total iron loss 50 Hz (time-harmonic) [W]
Stator iron loss (time-stepping) [W]
Rotor iron loss (time-stepping) [W]
Total iron loss (time-stepping) [ W ]
No-load (IM) 274 284 22 306 (422) Full-load (IM) 270 350 32 382 (496) No-load (SynRM) 275.5 485 110 595 (690) Full-load (SynRM) 275.5 796 242 1038 (1058)
The time-harmonic calculation results obtained for the IM and the SynRM are quite equal be-cause the calculations do not take into account the effects of the harmonic fields. The majority of the harmonic iron losses occur on the rotor surface, where losses are caused by the flux pul-sation under the stator slots. The air-gap length used for the SynRM is 0.4 mm and 0.8 mm for the IM and thus the surface losses are much more intense in the SynRM than in the IM. The SynRM stator slots include semi-magnetic slot-wedges, which reduce the permeance harmonics on the rotor surface. The time-harmonic calculation method ignores these pulsation losses and therefore gives far too optimistic results for the SynRM. According to the results, the time-harmonic iron loss values of the IM are about 35 % lower compared to the measured iron losses without additional losses. For the SynRM the corresponding error at no-load is about 70 %. Bertotti (1991) mentions several factors that explain the lower calculated iron loss results for the IM: the occurring of eddy current losses in the rotor cage, and the actual deterioration of the material properties during the lamination punching and core assemblage, which have not been modelled, and also the fact that the calculations have been carried out using a two-dimensional model, where the machine end effects have been ignored. The transient calculated iron losses for both the no-load and full load test for the IM are about 25 % lower than the measured losses. This relation is also lower for the SynRM iron losses and thus the correlation between the transient FEM calculation and the measured values is quite good. The measurements of the motor iron losses are evaluated later in chapter 5. According to the calculated values, the flux density does not change a lot as a function of the load. Therefore, it may be assumed that the correlation coefficients do not change dramatically as a function of the load. 2.5 Supplying of the SynRM using a VSD In chapter 1, the torque and the other motor performance parameters have been evaluated as-suming the inductances to be constant. In the evaluation of the stator flux, the voltage drop in the stator windings have been taken into account and the currents of the axes are calculated us-ing the fluxes and inductances of the axes. Actually, the inductances of the axes saturate as a function of the flux of the axes and thus the saliency ratio does not stay constant as a function of the torque. In the following, the performance of the pilot SynRM is studied using the measured

56
currents of the axes and the saturated model of the inductances of the axes. The inductance models used are based on the FEM calculations obtained from the pilot motor introduced later in chapter 5. In the VSD, a constant d-axis current may be used at speeds below the base speed to keep the flux constant (constant flux control). The so-called constant current angle control offers an al-ternative control method. The current angle control is defined as the control of the current vec-tor angle κ of the machine to obtain the best performance in terms of torque-to-current ratio or power factor (Trübenbach 1993, Betz 1992). The VSD system used in the measurements in chapter 5 is based on the constant flux linkage direct torque control, where the stator flux link-age in the stator reference frame is estimated as in Eq. 1.2. If the stator resistance is neglected the stator voltage squared is u2 = ω2[(Ldisd)2 + (Lqisq)2] = ω2 2
sψ . (2.33)
The equation is rearranged to
2
2
2sq
2
2sd
qd/1/1
=+
ωu
Li
Li . (2.34)
This is an equation of an ellipse in isd, isq plane centred at (0, 0) with axes 2a = 2(u/ω) / Lq major 2b = 2(u/ω) / Ld minor The axes are inversely proportional to the angular frequency ω. Varying the stator frequency and voltage is the technique preferred in most variable-speed IM and SynRM drive applications. As it is shown in Eq. 2.33 the voltage of an electrical machine is linearly dependent on the angular frequency ω. If a balance set of three-phase sinusoidal volt-ages at a frequency f=ω /2π are applied to the stator, it results in a balanced set of currents, which establishes a flux-density distribution Bδ in the air-gap with the following properties:
1. it has a constant amplitude and 2. it rotates with a constant speed, also called the synchronous speed.
The synchronous speed in a p-pole motor, supplied by frequency f, can be obtained as
pfπ2
s =ω , (2.35)
which is synchronized to the frequency f of the applied voltages and currents to the stator wind-ings. At a certain frequency, ωb the voltage u reaches the maximum voltage available from the in-verter. Below this frequency, the flux modulus is kept constant but, if it is desired to increase the speed to be above this frequency, the flux modulus must be decreased. The speed range be-low ωb is called the base speed area, the constant flux area or the constant torque area. The

57
speed range above ωb is traditionally called the field weakening area or the constant power area. The boundary frequency ωb is called the base frequency of the nominal frequency. The behav-iour of ideal drive characteristics stator voltage u ignoring the voltage drop in the stator resis-tance, motor flux ψ, output torque T and output power Pout are illustrated in Fig. 2.9
ωb
u
ω a)
ωb
ψ
ω b)
ωb
T Constant torque Constant power
ω
1/ω
c)
ωb
Pout
ω
d) Figure 2.9. Ideal drive characteristics a) input voltage u, b) motor flux Ψ, c) output torque T and d) output power Pout. The ωb is the rated speed. Fig. 2.10 shows the envelope curves of the stator current vector is, the stator flux linkage vector ψs and the stator back electro magnetic voltage vector em for the load angle δ ∈ [0, π].
Air-gap voltage limit ellipse
Stator flux limit circle
ψdid
Current limit ellipse
d-axis
q-axis
iqis
ψq
ψs
-em
δ
Figure 2.10. Envelope curves for the stator current vector is, the stator flux linkage vector ψs and the stator back electro magnetic voltage vector em. The vectors are not in scale in the figure. In Fig. 2.10 the back electro motive voltage draws an ellipse because of the voltage drop in the stator windings as a function of torque. On the other hand, the control system keeps the flux linkage constant. The stator current envelope curve is an ellipse because of the magnetic asym-metry of the machine. The increasing voltage drop in the stator windings reduces the magnetis-ing current as the torque increases and thus also the magnetising flux decreases.
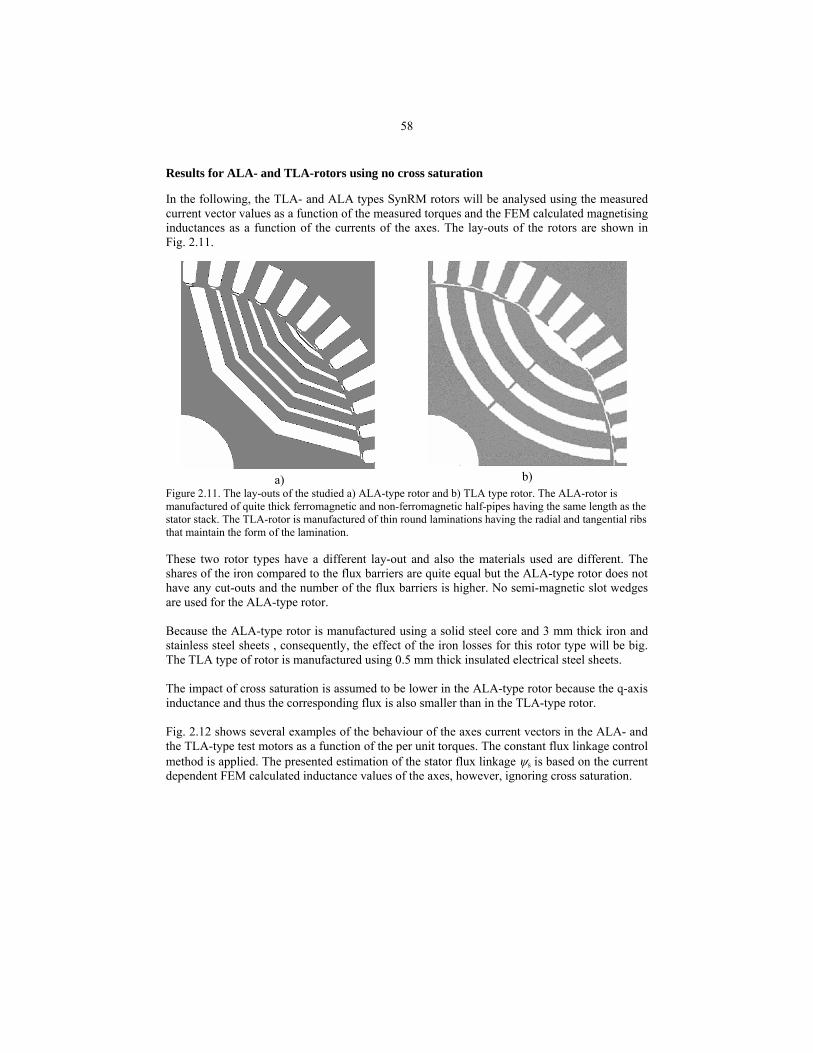
58
Results for ALA- and TLA-rotors using no cross saturation In the following, the TLA- and ALA types SynRM rotors will be analysed using the measured current vector values as a function of the measured torques and the FEM calculated magnetising inductances as a function of the currents of the axes. The lay-outs of the rotors are shown in Fig. 2.11.
Figure 2.11. The lay-outs of the studied a) ALA-type rotor and b) TLA type rotor. The ALA-rotor is manufactured of quite thick ferromagnetic and non-ferromagnetic half-pipes having the same length as the stator stack. The TLA-rotor is manufactured of thin round laminations having the radial and tangential ribs that maintain the form of the lamination. These two rotor types have a different lay-out and also the materials used are different. The shares of the iron compared to the flux barriers are quite equal but the ALA-type rotor does not have any cut-outs and the number of the flux barriers is higher. No semi-magnetic slot wedges are used for the ALA-type rotor. Because the ALA-type rotor is manufactured using a solid steel core and 3 mm thick iron and stainless steel sheets , consequently, the effect of the iron losses for this rotor type will be big. The TLA type of rotor is manufactured using 0.5 mm thick insulated electrical steel sheets. The impact of cross saturation is assumed to be lower in the ALA-type rotor because the q-axis inductance and thus the corresponding flux is also smaller than in the TLA-type rotor. Fig. 2.12 shows several examples of the behaviour of the axes current vectors in the ALA- and the TLA-type test motors as a function of the per unit torques. The constant flux linkage control method is applied. The presented estimation of the stator flux linkage ψs is based on the current dependent FEM calculated inductance values of the axes, however, ignoring cross saturation.
a)
b)

59
I d = -1.22*T + 9.92
I q = 61.77*T - 0.43
0
10
20
30
40
50
60
70
0 0.2 0.4 0.6 0.8 1
Torque p.u.
Cur
rent
[ A
]
0.95
0.98
1.00
Flux
link
age
p.u
.
Measured I d
Measured I q
Estimated ψ s
Estimated ψ md
a)
I q = 61.87*T + 0.11
I d = -1.80*T + 11.770
10
20
30
40
50
60
70
0 0.2 0.4 0.6 0.8 1Torque p.u.
Cur
rent
[ A
]
0.9
0.95
1
Flux
link
age
p.u.
Measured I d
Measured I q
Estimated ψ s
Estimated ψ md
b)
Figure 2.12. The measured stator direct and quadrature axes current rms components Id and Iq using FC for a) the ALA-type and for b) the TLA-type rotor SynRM as a function of per unit torque. The equations of the trend-lines are also shown. The estimated stator and direct axes magnetising flux linkages per unit values are also given. The current measurement is based on the motor line current measured total value, which is divided into the d- and q-axis values according to the knowledge obtained from the DTC-controller.

60
It may be noticed from Fig. 2.12 that for both motor types the d-axis flux linkage decreases slightly (by about 2 … 2.5 %) as a function of the torque, as it is described in Fig. 2.10. For the ALA type motor the stator flux linkage reduces slightly as for the TLA type motor it slightly increases as a function of the torque. According to Fig. 2.10, the stator flux linkage should stay constant or slightly be reduced due to the stator resistance voltage drop as the torque increases. The stator flux error in Fig. 2.12 results from the fact that the cross saturation and the load de-pend iron losses (additional losses) and the voltage drop in the stator windings have been ig-nored.
The FEM calculated axes inductances for the ALA-type rotor with 0.3 mm air-gap length and for the TLA-type rotor with slot-wedges and with air-gap length 0.4 mm is shown in Fig. 2.13. The figure and the equations presented do not include the effect of cross saturation.
L mq = 0.02*I q-0.31
L md = 0.96*I d-0.73
0.00
0.05
0.10
0.15
0.20
0.25
0 10 20 30 40 50 60 70d- and q-axis effective currents [ A ]
Indu
ctan
ce [
H ] L md _03_ALA
L mq _03_ALA
a)
L md = 1.22*I d-0.79
L mq = 0.11*I q-0.49
0.00
0.05
0.10
0.15
0.20
0.25
0.30
0.35
0 10 20 30 40 50 60 70d- and q-axis effective currents [A]
Indu
ctan
ce [
H ]
L md_04_TLA
L mq_04_TLA
2 p.u.
6 p.u.
1 p.u.
Indu
ctan
ce p
.u.
3 p.u.
4 p.u.
5 p.u.
7 p.u.
8 p.u.
9 p.u.
0 p.u.
b)
Figure 2.13. FEM calculated 30 kW test SynRM d- and q-axis inductances for a) the ALA-type and b) the TLA-type SynRM as a function of the currents of the axes. The air-gap length of the ALA-type motor is 0.3 mm. The air-gap length of the TLA-type motor is 0.4 mm and the stator includes semi-magnetic slot wedges. In the figure cross saturation has not been taken into account. The motor model is delta con-nected.

61
Even though the ALA-type rotor has a smaller air-gap length it has lower d-axis inductances compared to the TLA-type rotor, which may be explained by the non-ferromagnetic sheets in the rotor construction. This, according to Carter’s theory, increases the air-gap length. Because the ALA-type rotor has no radial or tangential ribs the q-axis inductance is significantly lower compared to the TLA-type rotor. Using the axes currents shown in Fig 2.12 and the inductance equations shown in Fig. 2.13 the following torque estimation as a function of load angle may be presented, Fig. 2.14. The esti-mated saliency ratios and measured torque values are also shown.
0
0.2
0.4
0.6
0.8
1
1.2
0 2 4 6 8 10 12Load angle [electrical degs]
Torq
ue p
.u.
0
5
10
15
20
25
30
35
40
Salie
ncy
ratio
Ld/L
q
Measured T
Calculated T
L d/L q
a)
0
0.25
0.5
0.75
1
1.25
0 4 8 12 16 20 24 28Load angle [electrical degs]
Torq
ue p
.u.
0
2
4
6
8
10
12
14
Salie
ncy
ratio
Ld/L
q
Calculated T
L d/L q
Measured T
b)
Figure 2.14. The measured and calculated per unit torque values as a function of the estimated load angle for a) the ALA type and b) the TLA-type SynRM. The torque dependent saliency ratio is also given.

62
Using the measured currents vector values and the FEM estimated inductance values without taking account the effect of cross saturation or iron losses the relative error between the meas-ured and the estimated torque value is the biggest on the high torque value. It may be noticed from Fig. 2.14 that the saliency ratios do not stay constant as a function of the torque. As the torque increases the direct axis current reduces and thus the value of the d-axis inductance increases likewise. According to Fig. 2.13, the q-axis inductance reduces much less even though the q-axis current changes much more than the d-axis current. The control method used above (SynRM-DTC) is based on constant stator flux linkage. The corresponding current angle as a function of the torque is given in Fig. 2.15. Also the power factor using Eq. (1.36) as a function of per unit torque is shown.
30
40
50
60
70
80
90
0 0.2 0.4 0.6 0.8 1
Torque p.u.
Cur
rent
ang
le [e
lect
rical
deg
s]
0.50
0.60
0.70
0.80
0.90
1.00
Pow
er fa
ctor
Power factor Current angle
a)
20
30
40
50
60
70
80
90
0 0.2 0.4 0.6 0.8 1
Torque p.u.
Cur
rent
ang
le [e
lect
rical
deg
s]
0.2
0.3
0.4
0.5
0.6
0.7
0.8
0.9Po
wer
Fac
tor
Power factorCurrent angle
b)
Figure 2.15. The estimation of the current angle and power factor as a function of the torque. a) the ALA-rotor, b) the TLA rotor. The high power factor values are obtained with high direct axis magnetising in-ductances (small air-gap) and high inductance ratios. The high surface losses in the ALA-rotor are not taken into account for the calculating of the power factor.
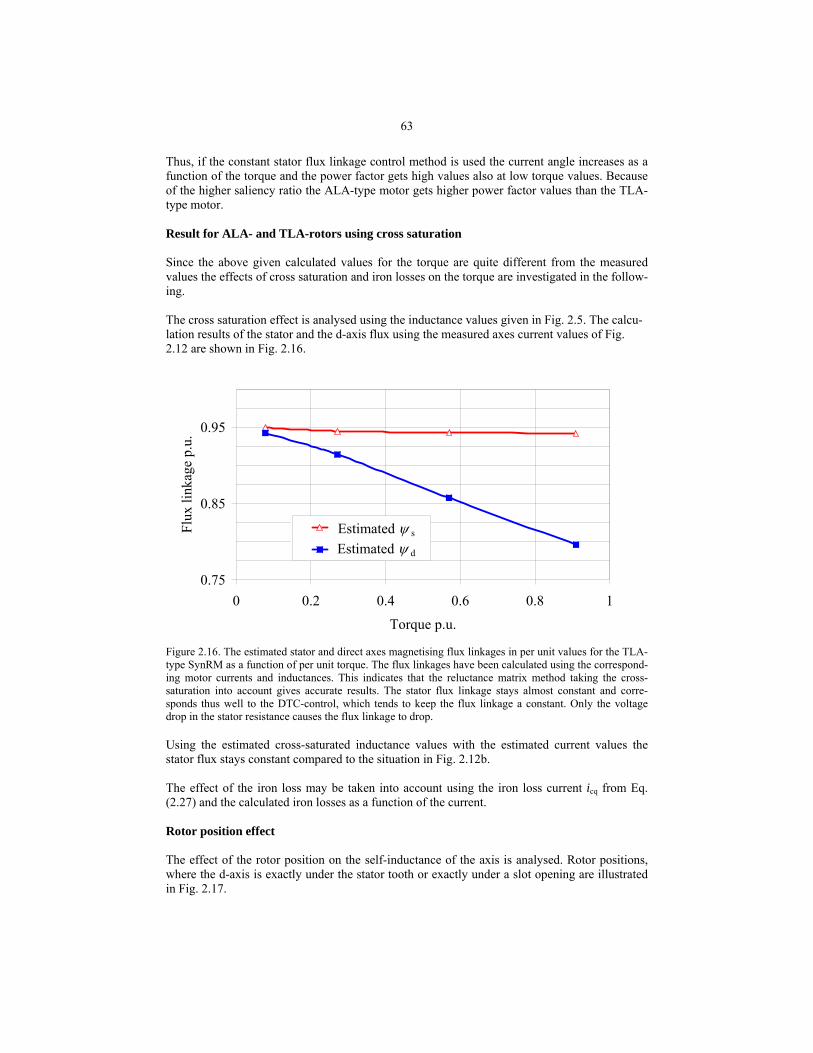
63
Thus, if the constant stator flux linkage control method is used the current angle increases as a function of the torque and the power factor gets high values also at low torque values. Because of the higher saliency ratio the ALA-type motor gets higher power factor values than the TLA-type motor. Result for ALA- and TLA-rotors using cross saturation Since the above given calculated values for the torque are quite different from the measured values the effects of cross saturation and iron losses on the torque are investigated in the follow-ing. The cross saturation effect is analysed using the inductance values given in Fig. 2.5. The calcu-lation results of the stator and the d-axis flux using the measured axes current values of Fig. 2.12 are shown in Fig. 2.16.
0.75
0.85
0.95
0 0.2 0.4 0.6 0.8 1
Torque p.u.
Flux
link
age
p.u.
Estimated ψ s
Estimated ψ d
Figure 2.16. The estimated stator and direct axes magnetising flux linkages in per unit values for the TLA-type SynRM as a function of per unit torque. The flux linkages have been calculated using the correspond-ing motor currents and inductances. This indicates that the reluctance matrix method taking the cross-saturation into account gives accurate results. The stator flux linkage stays almost constant and corre-sponds thus well to the DTC-control, which tends to keep the flux linkage a constant. Only the voltage drop in the stator resistance causes the flux linkage to drop. Using the estimated cross-saturated inductance values with the estimated current values the stator flux stays constant compared to the situation in Fig. 2.12b. The effect of the iron loss may be taken into account using the iron loss current icq from Eq. (2.27) and the calculated iron losses as a function of the current. Rotor position effect The effect of the rotor position on the self-inductance of the axis is analysed. Rotor positions, where the d-axis is exactly under the stator tooth or exactly under a slot opening are illustrated in Fig. 2.17.

64
a)
b)
Figure 2.17. Rotor positioned at resulting a) Ldmax and Lqmin and b) Ldmin and Lqmax. According to obtained calculation results, the effect of the rotor position on the axis self-inductance values is minor in the transversally laminated type rotor. This is mainly due to the tangential rib, which equalizes the effect of stator slot reluctance. There are used two different methods to analyse the effect of the rotor position on the cross saturation and thus on the torque production: the rotating of the stator current vector keeping the rotor locked or the rotating of both the stator current vector and the rotor. In the locked rotor model the effect of the rotor position is taken into account by turning the rotor by half a slot pitch and by defining the average torque using the maximum and minimum torque values as
toothopeningslot
openingslot min
toothopeningslot
toothmaxaverage ττ
τττ
τ+
⋅++
⋅= TTT , (2.36)
where the τslot opening is the width of the stator slot opening in the stator surface and τtooth the width of the stator tooth as it is illustrated in Fig.2.18.
τtooth
τslot opening
Figure 2.18 Stator slot detail. Fig. 2.19 shows an example of the torque calculated with FEM with the rotating current vector in the locked rotor model in two different rotor positions. A torque curve calculated using Ld and Lq without cross saturation is also given. The self-saturation is taken into account.

65
0.00
0.25
0.50
0.75
1.00
1.25
0 20 40 60 80Current angle [ electrical degs ]
Torq
ue p
.u.
T (L d(I d,0),L q(0,I q))
T max
T min
T average
Measured T
Figure 2.19. The torque values as a function of the current angle. The marks Tmin and Tmax indicate the rotor positions where the d-axis inductance reaches its maximum or minimum values. A measured torque point using the external current angle value of 80° as well as a calculated torque curve using Ld and Lq without cross saturation is also given. According to Fig. 2.19, the difference between the maximum and the minimum torque values at a nominal current value of 55.6 A seems to reach its biggest value at a current angle of about 60 degrees where the gap between the maximum and average torque value is about 0.04 p.u. If cross saturation is ignored (T(Ld(Id)), Lq(0, Iqm)) the torque gets lower values at smaller current angles but bigger values as the current angle increases. The average torque values differ only slightly from the measured values at the rated load point. The torque ripple using the locked rotor torque calculation method may be evaluated as
Torque ripple = %100average
minmax ⋅−
TTT . (2.37)
Using the parameters of Fig. 2.19 the torque ripple is at nominal current 15.9 %, which is lower than when the rotating rotor model is used, as it is introduced next. The locked rotor method has the disadvantage that it does not allow to evaluate the effect of skewing the rotor. In the following, the effects of the iron losses are evaluated using the FEM calculated iron loss values as a function of the per unit current. The FEM calculated PFe(FEM) results are compared to the measured iron loss values, Fig. 2.20.

66
P Fe(FEM) = 569.28*I + 468.72
500
600
700
800
900
1000
1100
0.1 0.3 0.5 0.7 0.9 1.1 1.3
Current p.u.
Iron
loss
[ W
]
Measured values
FEM calculated values
Figure 2.20. The FEM calculated iron loss line as a function of the per unit current and the sum of the measured no-load and load depend iron losses. Using the iron loss line equation from Fig. 2.20 and the estimation of the d-axis flux linkage ψmd from Fig. 2.12, the iron loss resistance Rcq may be calculated as.
( )Fe(FEM)
2md
cq PR
ψω≈ . (2.38)
The calculated iron loss resistance and iron loss current values are given in Fig. 2.21.
0
50
100
150
200
250
0 0.2 0.4 0.6 0.8 1
Torque p.u.
Iron
loss
resi
stan
ce [
Ω ]
0
0.5
1
1.5
2
2.5
3
3.5
4Ir
on lo
ss c
urre
nt I
cq [
A ]
Iron loss resistance
Iron loss current
Figure 2.21. The calculated iron loss resistance and iron loss current values as a function of the torque. According to the result shown in Fig. 2.21, the iron loss resistance does not stay constant as a function of the torque. This may be due to the increasing leakage flux, which increases the vol-ume of the load dependent iron losses. On the other hand the iron losses increase the iron loss current component as a function of the load. Using the iron loss current component the behaviour of the internal magnetising current angle as a function of the torque is shown in Fig. 2.22.

67
0
10
20
30
40
50
60
70
80
90
0 0.2 0.4 0.6 0.8 1
Torque p.u.
Cur
rent
ang
le [e
lect
rical
deg
s ]κ
κ m
Figure 2.22. Curves of the external current angle κ and the internal current angle κm values as a function of the per unit torque. Even though the iron loss increases as a function of the torque, the gap between the external and the internal current angles reduces. This is because the share of the iron loss current component compared to the total current component decreases. The iron loss current component saturates the motor iron but it does not produce the torque. This saturation effect of the iron loss component is not present in the equivalent circuit of the SynRM in Fig. 2.7. In the following, this saturation effect of the iron loss is taken into account in the calculation model. The model uses the motor reluctivity matrix, which is produced by using the motor total input current. In the torque production the absence of the iron loss compo-nent is taken into account by decreasing the torque producing current vector modulus by the iron loss component, Fig 2.23b. The comparing results without the iron loss effect are shown in Fig. 2.23a.
0.00
0.20
0.40
0.60
0.80
1.00
1.20
0 10 20 30 40 50 60 70 80 90Current angle [ electrical degs ]
Torq
ue p
.u.
I =1.07 p.u.
I =0.89 p.u.
I =0.51p.u.
I =0.32 p.u.
Measured
a)

68
0.00
0.20
0.40
0.60
0.80
1.00
1.20
0 10 20 30 40 50 60 70 80 90Current angle [ electrical degs ]
Torq
ue p
.u.
I =1.00 p.u.
I =0.59 p.u.
I =0.33p.u.
I =0.23 p.u.
Measured
b)
Figure 2.23. The torque values as a function of the current angle when a) the iron loss effect is ignored and b) the iron loss effect is taken into account. The measured torque values as a function of the external cur-rent angle are also shown. When it is used the reluctivity matrix, which takes into account the total input current saturation effect, and the magnetising current, where the iron loss current component is taken out, the re-sults obtained are quite accurate compared to the measured values. Similarly, the reluctivity matrix and the reduced current vector methods may be used in the ro-tating rotor model. In this model the estimated internal current angle is used. The calculated results are shown in Fig. 2.24.
0.00
0.25
0.50
0.75
1.00
1.25
54 56 58 60 62 64 66
Rotor angle [ Mechanical degs ]
Torq
ue [
Nm
]
I mdq=0.23, κ m=21 degs
I mdq=0.59, κ m=71 degsI mdq=1.0, κ m=79 degsI mdq=0.59, κ m=71 degs
I mdq=0.33, κ m=52 degsMeasured torque value lines
Figure 2.24. The FEM calculated torque values as a function of the rotor angle. The iron loss effects are taken into account in the current modulus and in the current angle. The comparing measured torque value lines are also shown.

69
Even though some estimation of the torque ripple in the locked rotor model can be calculated fairly easily if only the maximum and minimum torque values for a certain current vector and rotor positions are found the rotating rotor model has the advantage over the locked rotor model that it offers the possibility studying the rotor geometry effects on the torque performance in detail as a function of the rotor mechanical rotation. This enables the designing of a rotor that gives less torque ripple. Chapter 4.2.3 introduces the method in more detail. Fig. 2.25 compares the results of the rotating rotor model method compared with the results of the non-rotating method and the measured values. The torque calculation marks used in the fig-ure are T(Lmd(Id,0),Lmq(0,Iq)) Torque calculated using Eq. (1.22) using axis self induct-
ances. T(Lmd(Id, Iq),Lmq(Id,Iq)) As previous but using axes cross saturation. T(Lmd(Id, Iq),Lmq(Id,Iq),Imq) Torque calculated using Eq. (2.28) taking into account the
effect of iron loss current. T(Is,κe,θr) Torque achieved from FEM rotating rotor and current vec-
tor model. The iron loss effect is taken into account in the current angle value used and in the current modulus. The saturation of the total current is taken into account using the appropriate reluctivity matrix.
0
0.2
0.4
0.6
0.8
1
1.2
0.2 0.4 0.6 0.8 1.0 1.2
Current p.u.
Torq
ue p
.u.
T (L md(I d,0),L mq(0,I q))
T (L md(I d,I q),L mq(I d,I q))
Measured T
T (L md(I d,I q),L mq(I d,I q),I mq)
T (I s,κ m,θ r)
Figure 2.25. The calculated and measured torque values as a function of the per unit current. The calcula-tion method is a parameter. According to Fig. 2.25 the optimal calculated torque values compared to the measured values are achieved with the rotating rotor model. Also the method where the iron loss current compo-nent is taken into account in the calculation gives quite reasonable results. The effect of the cross saturation and the iron losses on the saliency ratio is illustrated in Fig. 2.26. In the case of rotor rotation, the saliency ratio is evaluated by using the q-axis inductances from Fig. 2.5 and by setting the d-axis inductance to be a variable. The d-axis inductance is thus calculated from torque equation (1.22).

70
2
4
6
8
10
12
14
0.0 0.2 0.4 0.6 0.8 1.0 1.2
Current p.u.
Salie
ncy
ratio
L d(I d,0)/L q(0,I q)
L d(I d,I q)/L q(I d,I q)L d(I d,I q,κ m,θ r)/L q(I d,I q,κ m,θ r
)
Figure 2.26. The saliency ratio as a function of the measured per unit current. The cross saturation and the cross saturation with the effect of iron losses in the current angle and the rotor rotation are parameters. The leakage flux inductances are set constant. In Fig. 2.26 the saliency ratio increases as a function of the current when the cross saturation and the iron losses with cross saturation are taken into account. The effect of the cross satura-tion on the saliency ratio seems to be more significant than the effect of the evaluated iron losses. Because the load-dependent additional losses, especially for the ALA-type rotor, are very con-siderable the measured efficiency curves as a function of the per unit torque for these two rotors are shown below, Fig. 2.27. The ALA-rotor is manufactured of 3 mm thick steel and stainless steel plates. The ALA-rotor core is of solid material. The TLA-rotor is manufactured of 0.5 mm electrical steel laminations. According to the results in Fig. 2.27 the ALA-rotor should be manufactured of much thinner and more resistive material than the material of the prototype rotor. Also skewing of the ALA rotor might be of great importance in minimising the rotor losses.
68 %
72 %
76 %
80 %
84 %
88 %
92 %
96 %
0.00 0.25 0.50 0.75 1.00Torque p.u.
Effic
ienc
y
ALA-type
TLA-type
Figure 2.27. The measured efficiency values of the ALA-type and the TLA-type SynRM as a function of the per unit torque (Haataja 2000).
71
Even though the saliency ratio of the ALA-motor is very high the motor efficiency is rather poor. This is due to the high eddy current losses in the thick laminations of the rotor with no skewing. The stator slot openings cause large magnetic flux density variations on the edges of the thick ALA-laminations thus causing large losses. The ALA-rotor should be manufactured using very thin, high resistivity and possibly skewed laminations in order to avoid excessive rotor losses. Increasing the air gap length of the test-ALA-motor decreases the motor power factor but improves the efficiency because of the reduced iron losses. The final result, however, is not at all satisfactory. The ALA-rotor certainly offers a high potential in theory but probably the manufacturing difficulties will efficiently arrest its success in the future. At least, the ALA-rotor type requires a manufacturing technique that is totally different from that of the IM and the TLA-rotor SynRM. According to the study, the ALA-rotor produces a very high inductance ratio and thus a good power factor. However, a careful design and the selection of the materials, especially the insula-tion material, must be performed in order to avoid excessive rotor losses and a poor efficiency. 2.6 Conclusion The SynRM needs a large inductance ratio to produce good properties. Especially the d-axis inductance must be large and this requires a small air gap. It is easier to produce a large induc-tance ratio by using the ALA-type rotor, but especially this rotor type suffers from rotor surface eddy current losses. Using suitable materials and a geometry preventing the eddy currents might give very good properties for a SynRM equipped with this rotor type. The TLA-rotor is, how-ever, much more easier to manufacture than the ALA-rotor and is, consequently, of greater in-terest for the electrical machines manufacturing industry. Because of the easy manufacturing of the TLA-rotor type this type will be investigated in this thesis in the next paragraphs.
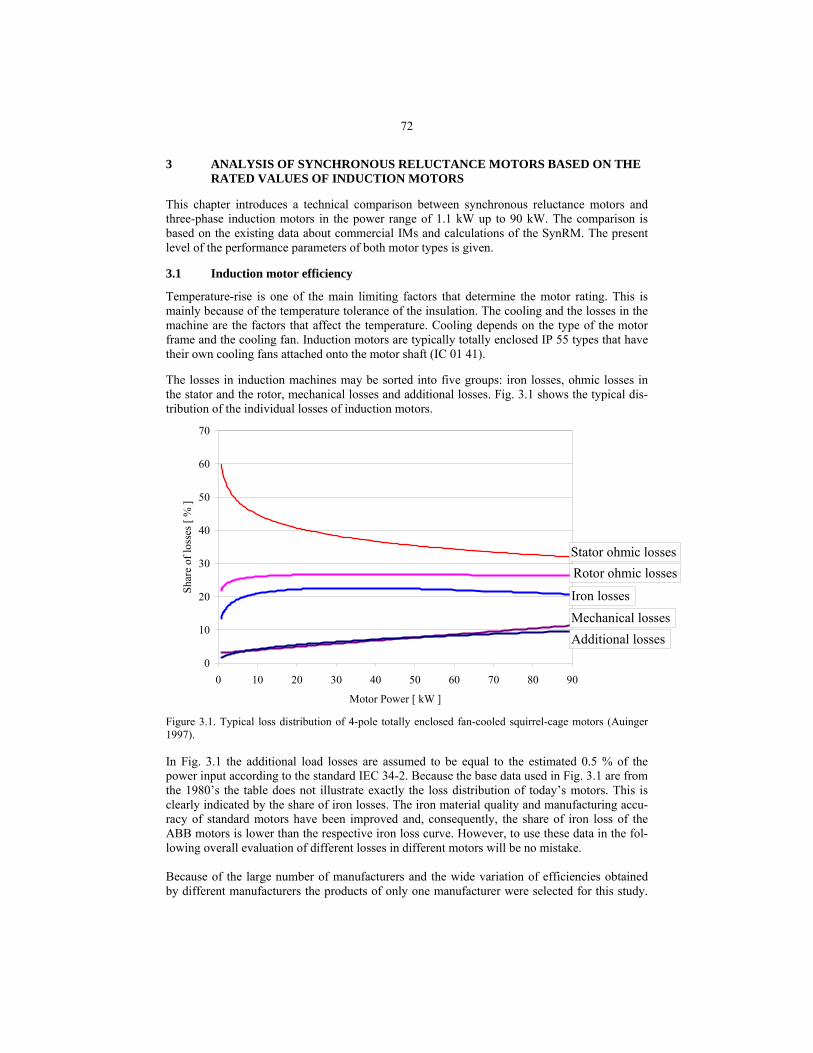
72
3 ANALYSIS OF SYNCHRONOUS RELUCTANCE MOTORS BASED ON THE RATED VALUES OF INDUCTION MOTORS
This chapter introduces a technical comparison between synchronous reluctance motors and three-phase induction motors in the power range of 1.1 kW up to 90 kW. The comparison is based on the existing data about commercial IMs and calculations of the SynRM. The present level of the performance parameters of both motor types is given. 3.1 Induction motor efficiency
Temperature-rise is one of the main limiting factors that determine the motor rating. This is mainly because of the temperature tolerance of the insulation. The cooling and the losses in the machine are the factors that affect the temperature. Cooling depends on the type of the motor frame and the cooling fan. Induction motors are typically totally enclosed IP 55 types that have their own cooling fans attached onto the motor shaft (IC 01 41). The losses in induction machines may be sorted into five groups: iron losses, ohmic losses in the stator and the rotor, mechanical losses and additional losses. Fig. 3.1 shows the typical dis-tribution of the individual losses of induction motors.
0
10
20
30
40
50
60
70
0 10 20 30 40 50 60 70 80 90
Motor Power [ kW ]
Shar
e of
loss
es [
% ]
Additional lossesMechanical losses
Rotor ohmic losses
Iron losses
Stator ohmic losses
Figure 3.1. Typical loss distribution of 4-pole totally enclosed fan-cooled squirrel-cage motors (Auinger 1997). In Fig. 3.1 the additional load losses are assumed to be equal to the estimated 0.5 % of the power input according to the standard IEC 34-2. Because the base data used in Fig. 3.1 are from the 1980’s the table does not illustrate exactly the loss distribution of today’s motors. This is clearly indicated by the share of iron losses. The iron material quality and manufacturing accu-racy of standard motors have been improved and, consequently, the share of iron loss of the ABB motors is lower than the respective iron loss curve. However, to use these data in the fol-lowing overall evaluation of different losses in different motors will be no mistake. Because of the large number of manufacturers and the wide variation of efficiencies obtained by different manufacturers the products of only one manufacturer were selected for this study.

73
The reason for selecting ABB motors is their leading position on the motor market, and the product’s high level of motor efficiency in the studied power range 1.1 kW … 90 kW. In Fig. 3.2 the motor data of the ABB products are indicated.
70
75
80
85
90
95
100
1 10 100Motor Power [ kW ]
Effic
ienc
y [ %
]
Figure 3.2. The efficiencies of the ABB four-pole, standard induction motors as a function of the power. The data are collected from the EURODEEM database (EURODEEM 2000). 3.2 SynRM comparison with induction motor It is obvious that there is not yet achieved a similar level of experience in the designing of syn-chronous reluctance motors as it is attained e.g. in the designing of induction machines. There are no catalogues available about SynRMs because their volume of commercial production is minor. One fundamental element in this thesis has been the designing and studying of a SynRM using a stator frame and winding equivalent to that of the high efficiency 30 kW IM by ABB. For that reason, the general comparison of the SynRM and IM presented here is based on exist-ing data of commercial IMs. The stator stacks and the air-gap lengths, the used material quali-ties and the numbers of turns in the stator slots are given values that are used for commercial IMs. Most of the IM values used in the general evaluation are based on the EURODEEM data-base. At first, an overview of some preceding studies is presented. The comparison uses the values for the same stator frame, windings and air-gaps utilising the data given in chapters 1 and 2. The evaluation is based on the efficiencies of the motors, estimations of typical loss distribu-tions at each power level, no-load and full-load current values and power factors. In the evalua-tion a virtual 400 V star connection is assumed to be irrespective of the actual connection of the motor. The IM stator inductance at a given air-gap may be evaluated using the equation
2s
2
0sσmds
1 RIULLL −
≈+=ω , (3.1)

74
where Lsσ is the stator leakage inductance, U the rated phase voltage, I0 the no-load current and Rs the stator resistance. The results of Eq. (3.1) are illustrated below in Fig. 3.7. Eq. (3.1) does not take into account the effect of iron losses but the error thus made is minor because of the low power factor of the no load current. The no-load current consists of the magnetising current Im and the iron loss current IFe. I0 = Im + IFe. (3.2) The share of the magnetising current of the no-load current is big. This share is evaluated as a function of the motor power by comparing the iron loss resistance RFe to the magnetising induc-tance Lm at the rated frequency 50 Hz of the motor. The value of the iron loss resistance is esti-mated by calculating the iron losses PFe from the total losses using Fig. 3.1 and estimating the magnetising voltage to be 98 % of the total voltage as
FeR = ( )
mP
U
Fe
298.0 (3.3)
The magnetising inductance is calculated by using the equation presented below in Fig. 3.7. The ratio Im/I0 is shown in Fig. 3.3.
0.94
0.95
0.96
0.97
0 20 40 60 80 100
Motor Power [ kW ]
Shar
e of
Im
/I0
I m/I 0
Figure 3.3. The ratio Im/I0 as a function of the motor power. It can be noticed from Fig. 3.3 that the relative influence of the iron loss resistance decreases as a function of motor power size. In the following the average value of 0.96 is used to calculate the magnetising current from the total no-load current so that Im = 0.96 I0. A curve of the ABB 400 V, 50 Hz and four-pole IM no-load currents as a function of the motor power is shown in Fig. 3.4.

75
I 0 = -0.002*P 2 + 0.76*P + 1.16
0
10
20
30
40
50
60
1 10 100Motor Power P [ kW ]
No-
Load
Cur
rent
I0
[A]
Figure 3.4. No-load currents of the ABB 400 V, 50 Hz four-pole motor as a function of the motor power. The rated currents of the respective IM are shown in Fig. 3.5.
I N = 1.76*P + 1.58
0
20
40
60
80
100
120
140
160
180
0 10 20 30 40 50 60 70 80 90
Motor Power P [ kW ]
Cur
rent
IN
[ A
]
Figure 3.5. Rated currents of the ABB induction motor as a function of the motor power. The stator resistance is evaluated utilising the efficiency values of the ABB motor shown in Fig 3.2 and a state of art estimation of typical loss distribution in Fig. 3.1. According to the estimation shown above the stator resistance may be calculated using equation

76
2N
CusNN
s
11
Im
PR
⋅
⋅−=
χ
η, (3.4)
where IN is the rated current, χCus the share of the stator ohmic losses and m the number of phases. The results based on the values of the ABB catalogue standard motors are shown in Fig. 3.6.
R s = 11.84*P -1.47
0.01
0.1
1
10
1 10 100Motor Power P [ kW ]
Stat
or re
sist
ance
Rs [
Ω ]
Figure 3.6. The stator resistances of the ABB motor as a function of the output power. The estimated magnetising inductance Lm used in the evaluation is calculated using no-load current values of ABB motors (Fig. 3.4) as
0mm 96.0
98.0I
UI
EL
ωωδ ≈= . (3.5)
The coefficient 0.98 takes into account the voltage drop in the stator winding and the share on the magnetising current 0.96 from the total no-load current. Fig. 3.7. illustrates the estimated results of the magnetising inductance Lm of the ABB induction motors and the stator inductance with leakage flux inductance Ld = Lm+Lsσ based on Eq. (3.1).
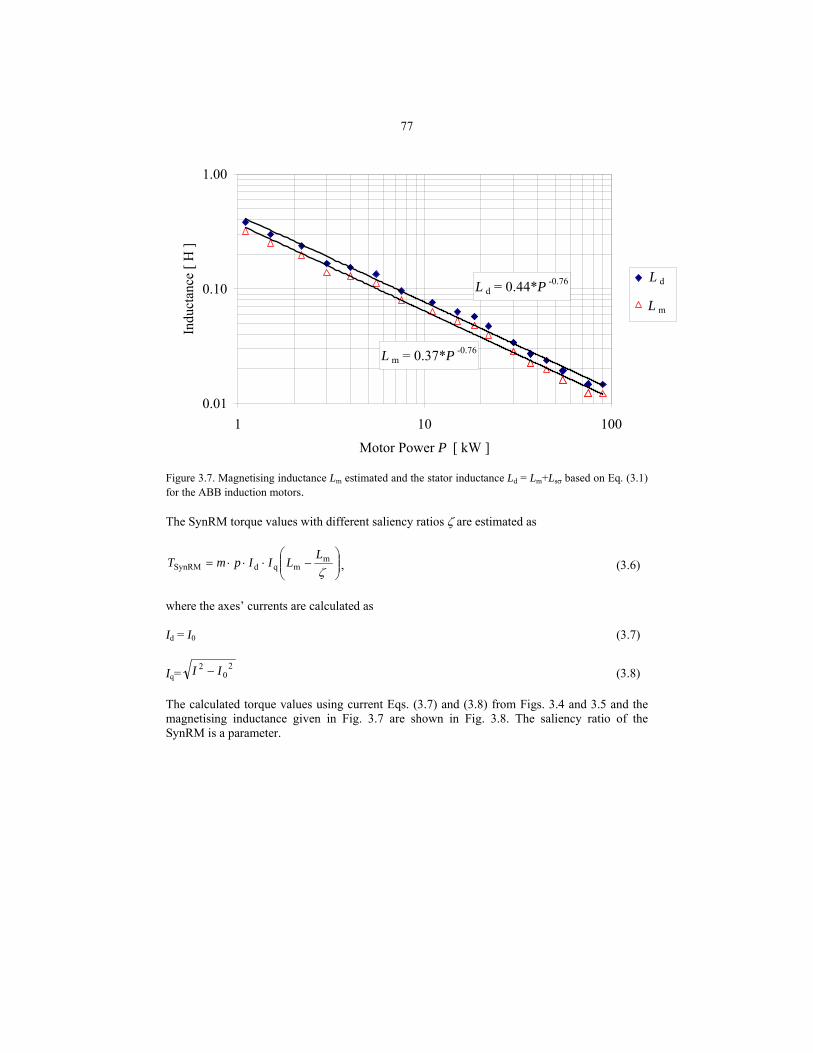
77
L m = 0.37*P -0.76
L d = 0.44*P -0.76
0.01
0.10
1.00
1 10 100
Motor Power P [ kW ]
Indu
ctan
ce [
H ]
L d
L m
Figure 3.7. Magnetising inductance Lm estimated and the stator inductance Ld = Lm+Lsσ based on Eq. (3.1) for the ABB induction motors. The SynRM torque values with different saliency ratios ζ are estimated as
−⋅⋅⋅=
ζm
mqdSynRML
LIIpmT , (3.6)
where the axes’ currents are calculated as Id = I0 (3.7)
Iq=2
02 II − (3.8)
The calculated torque values using current Eqs. (3.7) and (3.8) from Figs. 3.4 and 3.5 and the magnetising inductance given in Fig. 3.7 are shown in Fig. 3.8. The saliency ratio of the SynRM is a parameter.

78
0
100
200
300
400
500
600
700
0 10 20 30 40 50 60 70 80 90 100Motor Power [ kW ]
Torq
ue [
Nm
]
IM
L d/L q= 50
L d/L q=10
L d/L q=5
Figure 3.8. The torque values of different four-pole, 50 Hz synchronous reluctance motors compared to the torque of same size induction motor torque. The induction motor power lies on the x-axis. The syn-chronous reluctance motors have d-axis magnetising inductances equal to the magnetising inductance of the original IM. The current values of the axes are assumed to be according to Eqs (3.6) and (3.7). The saliency ratio Ld/Lq is a parameter. Fig. 3.8 proves that if it is used a SynRM d-axis inductance having the same size as that of the IM the same current level does not produce a high enough torque in the SynRM unless the sali-ency ratio is unrealistically high. To lower the d-axis current and to produce more torque the d-axis magnetising inductance of the SynRM must thus be increased. If the stator of an IM is used in a SynRM the air-gap length of the SynRM should be decreased to achieve a comparative torque per current ratio. By decreasing the air-gap length the d-axis inductance increases and the d-axis current decreases. The decreasing of the d-axis current im-proves also the motor power factor. The main disadvantage of the smaller air-gap is that espe-cially the rotor surface iron losses increase because of the intensified spatial harmonics. In the following the magnetising inductance is estimated as a function of the air-gap length. The total magnetising inductance Lm is
21
2
s
0
mm '
πξ
δµ
ω
=≈
pNDLm
IEL . (3.9)
Decreasing of the air-gap affects almost inversely the magnetising inductance. The accuracy of this assumption deteriorates from the impact of the effective air-gap length, which takes into account the Carter coefficient and the mmf of the ferromagnetic parts. The relative ratio be-tween the real air-gap δ and the effective air-gap δs decreases as a function of the motor power. This inverse air-gap effect is used to convert the magnetising inductance values given in Fig. 3.7 to the decreased air-gap length δ2 as

79
)()( 1m2
12m δ
δδ
δ LL ≈ . (3.10)
The air-gap length δ2 follows Richter’s air-gap length δ1 equation for four-pole motors
31 145.01.0 P+=δ (3.11)
but the length is scaled so that the air-gap length is 0.4 mm at 30 kW and the minimum value for the air gap length at 1.1 kW is 0.2 mm. The adjusted air-gap length is shown in Fig. 3.9. The fixing of the 30 kW motor air-gap length is based on the results from the pilot motor presented in chapter 5.
0
0.1
0.2
0.3
0.4
0.5
0.6
0.7
0.8
0 20 40 60 80 100
Motor Power [ kW ]
Air-
gap
leng
th [
mm
]
δ 1
δ 2
Figure 3.9. The illustration of the IM (δ1) and the SynRM (δ2) air-gap lengths as a function of the power. The respective magnetising inductance values calculated using the decreased air-gap length (δ2) are given in Fig. 3.10. The proportional value of the initial air-gap value δ1 shown in Fig. 3.7 is also given.

80
L m(δ 1) = 0.37*P -0.76
0.01
0.1
1
1 10 100
Motor Power [ kW ]
Indu
ctan
ce [
H ]
L m(δ 2) = 0.43*P -0.75
Figure 3.10. The calculated machine magnetising or d-axis inductance values using the initial (δ1) and the adjusted air-gap length (δ2) as a function of the power. The SynRM torque production using the decreased air-gap δ2 is shown in Fig. 3.11. In the cal-culation the d-axis magnetising flux ψmd is set equal with the initial motor as
)()()()(
2m
1m1d2d δ
δδδLLII = . (3.12)
0
100
200
300
400
500
600
700
800
900
0 10 20 30 40 50 60 70 80 90 100Motor Power [ kW ]
Torq
ue [
Nm
]
L d/L q=50
L d/L q=10
L d/L q=5
IM
Figure 3.11. The SynRM torque using the decreased air-gap length and initial d-axis flux as a function of the IM power. The saliency ratio is a parameter (Ld/Lq = 50, 10, 5). The IM catalogue torque values are also shown. The induction motor power lies on the x-axis.

81
According to Fig. 3.11 the decreased air-gap produces a reluctance torque that is high enough to compete with the original IM. The results illustrated in Fig. 3.11 ignore both the effect of satu-ration and iron losses, which both decrease the reluctance torque. For this reason the results obtained are somewhat optimistic. The effect of the air-gap length to the SynRM vector diagram has been illustrated in Fig. 3.12.
iq(δ1)
d-axis
q-axis
ψmq(δ1)
ψmdid(δ1)
is(δ1)
Ψmdq
κ
∆κ
δm
-em
cosϕ
us
jωLsσis
Rsis
iq(δ2)
id(δ2)
ψmq(δ2)
is(δ2)
Figure 3.12. Comparison of the vector diagrams of the SynRM at the original air-gap length (δ1) and the decreased air-gap length δ2. The absolute value of the current and the d-axis flux are set constants. According to Fig. 3.12 the decreasing air-gap length increases the motor power factor and the motor output torque assuming that the increase of iron losses is minor. The share of the air-gap reluctance of the total q-axis reluctance is low and thus the decreasing of the air-gap length does not affect remarkably the quadrature axis inductance meanwhile the d-axis inductance increases rapidly. Thus, decreasing the air-gap length increases the SynRM saliency ratio, the torque per current ratio and the power factor. In this analysis the effect of the increasing iron losses caused by the harmonics are ignored. Decreasing the air-gap length will increase remarkably the effect of the air-gap harmonics. This again increases both no-load and load dependent losses of the motor. On the other hand, the decreasing air-gap length increases also the stator leakage inductance, which further has a negative effect on the motor power fac-tor. 3.3 Maximum torque The maximum torque is one of the performance elements of the motor. The estimated maxi-mum torque values for the SynRM using Eqs. (1.29) and (1.34) are represented in Fig. 3.13. The respective relative value for the IMs maximum torque is between 2.4 … 3.2 (average 2.9).

82
0
0.5
1
1.5
2
2.5
3
3.5
1 10 100Motor Power [ kW ]
Max
imum
torq
ue p
.u.
0
100
200
300
400
500
600
700
Torq
ue [
Nm
]
T max (ζ =10)
T N
T max (ζ =10) / T N
Figure 3.13. The four-pole SynRM maximum torque at saliency ratio 10 and initial IM air-gap length as a function of the motor output power. According to the results shown in Fig. 3.13 the maximum torque is generally lower than in IMs. Normally, according to IEC34, the maximal torque must be at least 160 % of the rated torque. The saliency ratios, which produce at least 160 % of the rated torque, are illustrated in Fig. 3.14. The figure shows also the corresponding maximum torque.
0
2
4
6
8
10
12
14
16
1 10 100
Motor Power [ kW ]
Salie
ncy
ratio
01002003004005006007008009001000
Torq
ue [
Nm
]
T max
ζ (T max)
Figure 3.14. Necessary saliency ratios and the maximum torque values as a function of the motor output power for four-pole SynRMs producing 160 % TN according to IEC. The original IM air-gap length is used.

83
According to Fig. 3.14, to produce a high enough maximum torque in larger motors (PN > 15 kW) a saliency ratio higher than 10 is needed if the initial IM air-gap length is used. In smaller sizes the SynRM is thus much more competitive than in higher power ranges. 3.4 SynRM power factor In the following the 30 kW IM and SynRM power factors have been analysed using motor per-unit components. The per-unit values express the quantities in a dimensionless form. The cur-rents of the axes have been defined as
sN
ss I
Ii = , (3.13)
ϕcossq ii = , (3.14a)
ϕsinsd ii = , (3.14b)
dd
1i
L = , (3.15)
1i
L = . (3.16)
Using the IM rated load power factor value from Fig. 3.18, the 30 kW motor power-producing current iq = 0.84, so the magnetising current value is id = 0.54. The magnetising flux is set to ψm = 1.0 p.u and thus the magnetising inductance is Lm = 1.84 p.u. The stator resistance Rs is 0.01 p.u. of the motor total impedance. Fig. 3.15b proves that using the same current and inductance parameters and neglecting the stator resistance component, the SynRM in Fig. 3.15a with a saliency ratio of 10 gets a power factor value of 0.75, and if the stator resistance is included the value is 0.76 in.
ϕSynRM=41.7
d-axis
κ
us
is=1
id=0.54 idLd=1.0 p.u.
jωiqLq
q-axis
jωidLd
ψs
iq=0.84
iqLq=0.15 p.u.8.8
ϕIM=32.9
8.8
a)
ϕ=40.8
d-axis
κ
us
is=1
id=0.54 idLd=1.0 p.u.
jωiqLq
q-axis
jωidLd
ψs
iq=0.84
iqLq=0.15 p.u.8.8
32.9
7.9
isRs
us'
b)
Figure 3.15. A vector diagram of a SynRM for determining the power factor using corresponding IM per-unit parameter values. The iron loss current components are not considered. If the stator resistance is ig-nored the power factor cosϕ = 0.75 (Fig. a.) and if it is included cosϕ = 0.76 (Fig. b).

84
The SynRM power factor as a function of the saliency ratio neglecting stator resistance is repre-sented in Fig. 3.16.
0
0.1
0.2
0.3
0.4
0.5
0.6
0.7
0.8
0.9
0 10 20 30 40 50Saliency ratio
Pow
er F
acto
r
Figure 3.16. The SynRM rated point power factor as a function of the saliency ratio. The d-axis magnetis-ing inductance has been set equal to the IM magnetising inductance. According to Figs. 3.15 and 3.16, if the d-axis current is kept constant the power factor of the SynRM could not be better than that of the corresponding value of the IM. To improve the SynRM power factor to a level better than that of the corresponding IM the d-axis magnetising current vector should be smaller. To calculate the SynRM power factor while including the possibility of taking into account the stator resistance following equation (Feng 1993) is applied
( )( ) ( )qds
22s
22d
22q
2
sqd
cossincossin
cossincossincos
LLRRLL
RLL
−+++
+−=
κκωκκω
κκκκωϕ
(3.17)
where the current angle κ is the angle between the rotor d-axis and stator current vector and assuming the q-axis flux minor. It can be noticed from Eq. (3.17) that the power factor of the SynRM increases as the d-axis inductance and the stator resistance increase. The increase of the latter component is not advis-able because it increases the stator ohmic losses. The decrease of the q-axis inductance im-proves also the power factor. The value of the trigonometric factor sinκ cosκ reaches its maximum at the angle 45°. Because the angle between the d-axis flux vector and the stator cur-rent vector affects heavily also the saturation level of the inductances the angle 45° may not produce the maximum power factor as it has been shown in Fig. 1.16. The stator current is a function of the power factor value and thus the power factor affects the stator windings ohmic losses. The stator ohmic losses make up the largest share of the IM losses as shown in Fig. 3.1. The power factor of an IM increases as a function of the load and motor rated power. This effect is illustrated in Fig. 3.17.
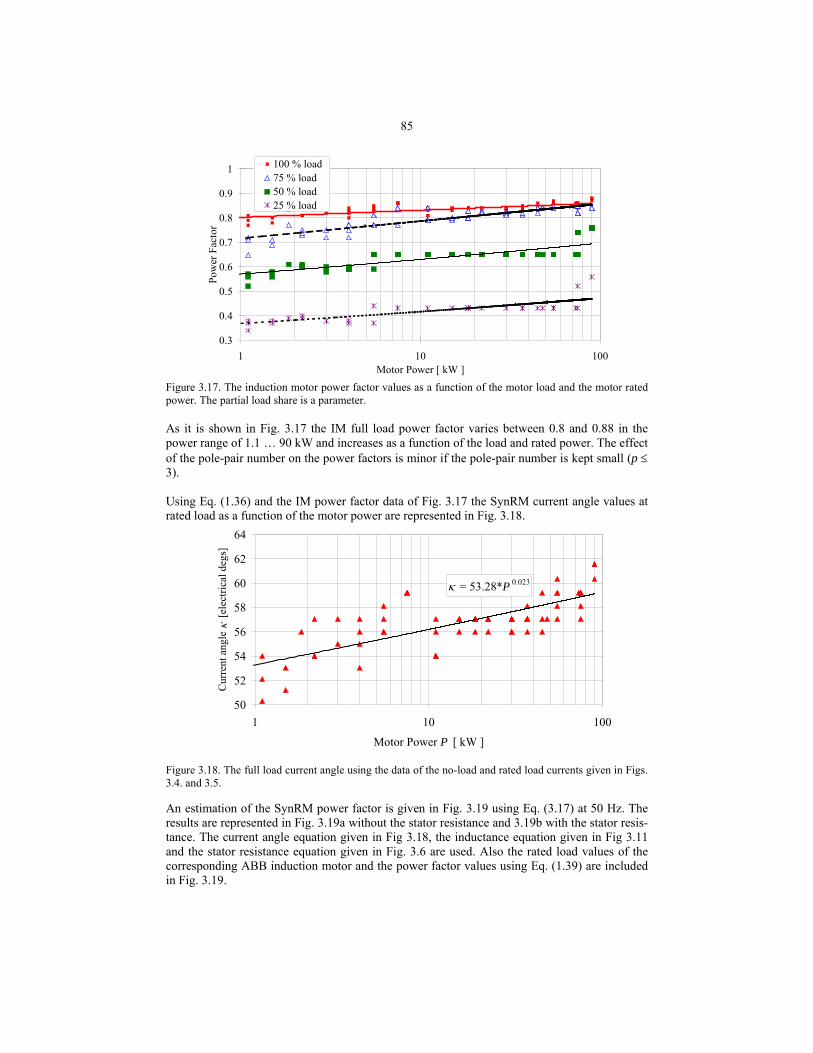
85
0.3
0.4
0.5
0.6
0.7
0.8
0.9
1
1 10 100Motor Power [ kW ]
Pow
er F
acto
r
100 % load75 % load50 % load25 % load
Figure 3.17. The induction motor power factor values as a function of the motor load and the motor rated power. The partial load share is a parameter. As it is shown in Fig. 3.17 the IM full load power factor varies between 0.8 and 0.88 in the power range of 1.1 … 90 kW and increases as a function of the load and rated power. The effect of the pole-pair number on the power factors is minor if the pole-pair number is kept small (p ≤ 3). Using Eq. (1.36) and the IM power factor data of Fig. 3.17 the SynRM current angle values at rated load as a function of the motor power are represented in Fig. 3.18.
κ = 53.28*P 0.023
50
52
54
56
58
60
62
64
1 10 100
Motor Power P [ kW ]
Cur
rent
ang
le κ
[ele
ctric
al d
egs]
Figure 3.18. The full load current angle using the data of the no-load and rated load currents given in Figs. 3.4. and 3.5. An estimation of the SynRM power factor is given in Fig. 3.19 using Eq. (3.17) at 50 Hz. The results are represented in Fig. 3.19a without the stator resistance and 3.19b with the stator resis-tance. The current angle equation given in Fig 3.18, the inductance equation given in Fig 3.11 and the stator resistance equation given in Fig. 3.6 are used. Also the rated load values of the corresponding ABB induction motor and the power factor values using Eq. (1.39) are included in Fig. 3.19.

86
0.6
0.65
0.7
0.75
0.8
0.85
0.9
0.95
1
1 10 100Motor Power [ kW ]
Pow
er F
acto
r
IM 100 % load
ζ =5 Eq.1.43
ζ =10 Eq.1.43
ζ =10 Eq.3.17
ζ =5 Eq.3.17
ζ =50 Eq.3.17
a)
0.6
0.65
0.7
0.75
0.8
0.85
0.9
1 10 100Motor Power [ kW ]
Pow
er F
acto
r
IM 100 % load
ζ =5 Eq.1.43
ζ =10 Eq.1.43
ζ =10 Eq.3.17
ζ =5 Eq.3.17
ζ =50 Eq.3.17
b)
Figure 3.19. The IM and SynRM power factor as a function of the motor power and different saliency ratios using Eqs. (1.39) and (3.17). a) ignoring the stator resistance and b) including the effect of the stator resistance. The d-axis magnetising inductance is calculated for the initial IM air-gap. If the air-gap length is kept equal to the IM air-gap according to Fig. 3.19 a saliency ratio as high as 50 is needed to attain the power factor level of the induction motor. The difference be-tween the IM and SynRM power factor becomes only slightly smaller at smaller loads. The IM power factor is increasing as a function of the motor power but, according to Fig 3.19b, the power factor of the SynRM seems to stay quite stable in the given power range. At a low sali-ency ratio (ζ=5) and ignoring the stator resistances Eq. (3.17) gives values that are quite equal to the values of Eq. (1.39). As the saliency ratio increases also the difference between these two

87
equations increases. At the same time, the effect of stator resistance decreases because the dif-ference of the used current angle in Eq. (3.17) and the maximum power factor current angle of Eq. (1.38) is becoming bigger. For saliency ratio 5 the maximum power factor current angle according to Eq. (1.38) is 66 electrical degrees and according to Fig. 3.19 the average current angle is about 56 electrical degrees. For saliency ratio 10 the current angle according to Eq. (1.38) is 72 degrees and for saliency ratio 50 the corresponding value is 82 degrees while the respective value using Eq. (3.17) has stayed constant at 56 degrees. 3.5 Efficiency The efficiency of the SynRM might be assumed to be higher than the efficiency of a corre-sponding induction motor because of the absence of the rotor ohmic losses. Since, however, the power factor of an IM is often better than the power factor of a SynRM and the per unit slip of a larger IM is small the discussion brought up here cannot be straightforward. According to the results presented in the previous section the torque production of a SynRM is heavily propor-tional to the d-axis magnetising inductance of the motor. According to Eq. (3.9) the increasing of the d-axis inductance can be achieved by decreasing the air-gap length, by increasing the number of stator winding turns or by increasing the size of the rotor. Since the IM has been developed already for a considerable long time it can be assumed that the thickness of the stator yoke has reached its optimum value. Because the load current values of the SynRMs are assumed equal to those of the respective IM increasing the stator bore is not here investigated. If the length and the cross sectional dimensions of the SynRM stator structure are kept the same as those of the corresponding IM also the shape of the stator slot is assumed to be equivalent to that of the corresponding IM. Increasing the number of the stator winding turns would increase the inductance values but it also decreases the cross sectional area of the winding wires. The reduction of the stator conductor cross-sectional area would with no change in load current in-crease the stator ohmic losses. Because the stator ohmic losses increase when using equal slot cross section with the IM this eventuality has not been investigated in this thesis. At equal load current the stator ohmic loss will increase also in the case where the stator stack length is in-creased and the number of coils is kept equal. Increasing the stator stack length with the same number of coils increases the inductance. This, however, causes that also the stator winding length increases. The increase of the coil length increases the winding resistance and thus with the equivalent load current also the stator ohmic loss. According to Fig. 3.10 the air-gap of an IM increases as a function of the power. To increase the SynRM d-axis inductance value the air-gap length of the SynRM must be made smaller than that of the corresponding IM. The reduction of the air-gap length brings some disadvantages. One major problem is the increase of iron and windage losses. If the stator slot openings are kept equal to the corresponding IM stator values, fitting a semi-magnetic slots wedge may re-duce both of the losses. The semi-magnetic slot wedges reduces the harmonics in the air-gap flux density distribution and thus the magnitude of iron losses. The slot wedges also make the stator surface smoother and reduce the windage loss. If it is assumed that the stator slot wedges smoothen the harmonic content of the air-gap flux to an equal level as that of the corresponding IM, then the rotor ohmic loss is the only element that may increase the SynRM efficiency to become higher than the corresponding IM efficiency. On the other hand, it may be assumed that the SynRM has generally a lower power factor than the corresponding IM. The SynRM torque per current ratio cannot be higher than that of the respec-

88
tive IM. It can also be assumed that the SynRM with a lower air-gap length and a similar stator construction has more air-gap flux harmonics than the corresponding IM. From this point of view, the advantage from the absence of rotor ohmic loss must be remarkable to achieve an efficiency higher than the efficiency of a competing IM. This proves that the SynRM may com-pete successfully with the IM at low rated powers. In the examination of the impact of rotor ohmic losses on SynRM efficiency it has been as-sumed that the iron or the mechanical losses do not differ from the corresponding IM values. Also it has been assumed that the saliency ratio is so high that the motor power factor is equal to the IM value. Fig. 3.20 shows the absolute reducing effect of rotor loss to ABB four-pole IM efficiency as a function of the motor power.
0.0
0.5
1.0
1.5
2.0
2.5
3.0
3.5
4.0
1 10 100
Motor Power [ kW ]
Effic
ienc
y [%
-uni
t]
Figure 3.20. The effect of four-pole IM rotor ohmic losses on the ABB motor efficiencies. According to Fig. 3.20 the effect of the rotor ohmic losses on the motor efficiency decreases as the motor rated power increases. The impact of the rotor ohmic losses at a power range below 15 kW are more significant, about 3.0 %-unit than at higher powers. The impact of the rotor losses on the motor efficiency is illustrated in Fig. 3.21. The figure shows also the efficiency limit for EFF1.
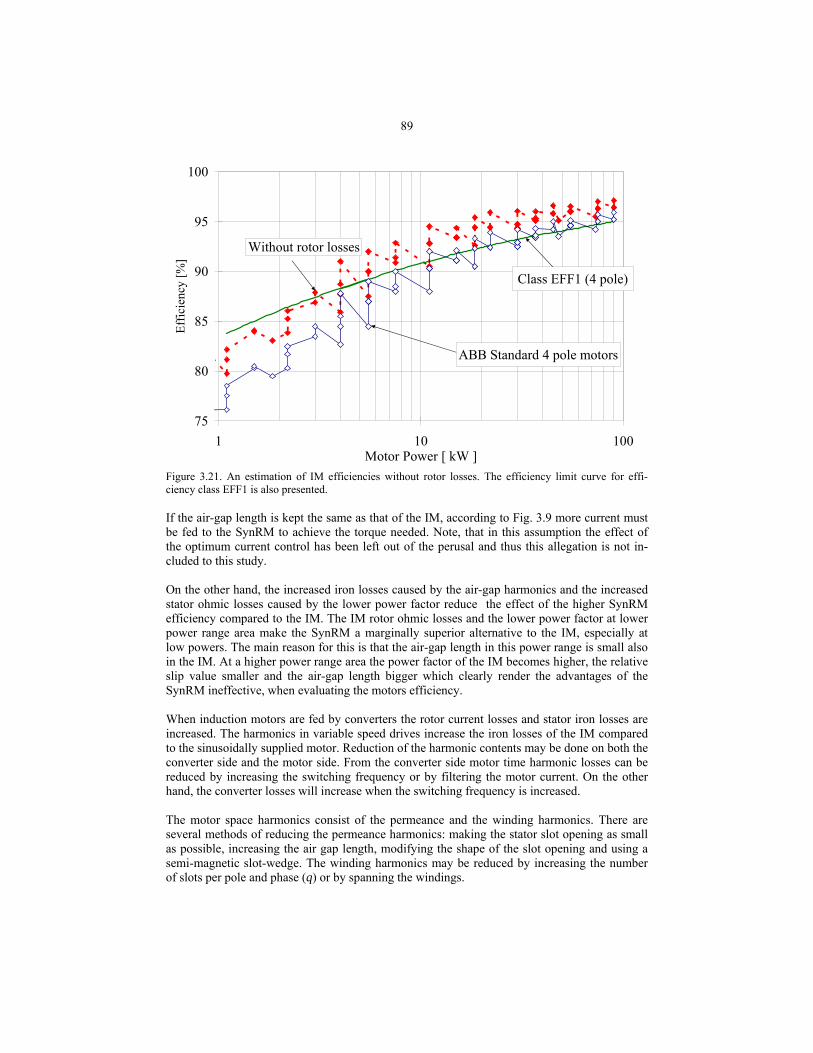
89
75
80
85
90
95
100
1 10 100Motor Power [ kW ]
Effic
ienc
y [%
]
Without rotor losses
Class EFF1 (4 pole)
ABB Standard 4 pole motors
Figure 3.21. An estimation of IM efficiencies without rotor losses. The efficiency limit curve for effi-ciency class EFF1 is also presented. If the air-gap length is kept the same as that of the IM, according to Fig. 3.9 more current must be fed to the SynRM to achieve the torque needed. Note, that in this assumption the effect of the optimum current control has been left out of the perusal and thus this allegation is not in-cluded to this study. On the other hand, the increased iron losses caused by the air-gap harmonics and the increased stator ohmic losses caused by the lower power factor reduce the effect of the higher SynRM efficiency compared to the IM. The IM rotor ohmic losses and the lower power factor at lower power range area make the SynRM a marginally superior alternative to the IM, especially at low powers. The main reason for this is that the air-gap length in this power range is small also in the IM. At a higher power range area the power factor of the IM becomes higher, the relative slip value smaller and the air-gap length bigger which clearly render the advantages of the SynRM ineffective, when evaluating the motors efficiency. When induction motors are fed by converters the rotor current losses and stator iron losses are increased. The harmonics in variable speed drives increase the iron losses of the IM compared to the sinusoidally supplied motor. Reduction of the harmonic contents may be done on both the converter side and the motor side. From the converter side motor time harmonic losses can be reduced by increasing the switching frequency or by filtering the motor current. On the other hand, the converter losses will increase when the switching frequency is increased. The motor space harmonics consist of the permeance and the winding harmonics. There are several methods of reducing the permeance harmonics: making the stator slot opening as small as possible, increasing the air gap length, modifying the shape of the slot opening and using a semi-magnetic slot-wedge. The winding harmonics may be reduced by increasing the number of slots per pole and phase (q) or by spanning the windings.

90
3.6 Conclusion The advantages of the SynRM compared to the induction motor result mainly from the syn-chronous rotational speed and the high Ld/Lq ratio. The lighter rotor of the SynRM makes it marginally suitable for servo motor drives where a high power per weight ratio is required. However, the maximum torque of the SynRM is normally not large enough for servo applica-tions where very high maximum torque values are needed. At the same time, the SynRM rotor construction is weaker than that of the IM. Generally, the absence of the rotor bars is also con-sidered to be one of the benefits of the SynRM. However, according to the experience of the author, the addition of damper windings or bars to the rotor decrease the torque oscillations and may, in some cases, increase the mechanical strength of the rotor. Because the only currents induced to the rotor bars are caused by the air-gap harmonics, the share of these losses remains small. If no damper windings are used, the SynRM calls always for a converter supply. The SynRM needs a smaller air-gap than the IM to produce an acceptable fundamental power factor. This is a major disadvantage that may considerably complicate the use of the SynRM applications where the IM air-gap is increased according to the regulations. Such applications are e.g. the explosion proof applications. The smaller air-gap causes some other disadvantages. The efficiency of the motor suffers from the rotor surface losses. Therefore, it is suggested that better iron materials should be used for the SynRM than for the IM. The heat sources in the SynRM rotor are the iron losses caused by the air-gap flux harmonics. Thus, if the air-gap harmonics can be decreased to a tolerable level using for example semi-magnetic slot wedges it can be assumed that the heat rise of a SynRM rotor is lower than that of the corresponding IM rotor. This is an advantage compared to the IM because, especially in closed induction motors the rotor is always more difficult to cool than the stator. If a standard induction motor is selected for a converter drive the continuous output power must be derated. With the lower output the temperature rise of the motor is maintained at the original level in spite of the fact that converter supply has caused additional losses in the motor. The reduction level depends on several factors in the converter and motor system , which are the converter type and modulation, the motor design and control equipment. Each of these factors can occur in several variants. According to converter manufacturer’s own guidelines this derating varies from 0 % up to 20 % at normal frequency. If the induction motor is loaded below its normal frequency this derating volume must increase up to 50 % or an external cooling system must be used. When the supply frequency of the IM is lowered in an FC drive the p.u. slip increases and weakens the efficiency of the IM. In this case, the synchronous running of the SynRM is a benefit. At its lowest speeds the SynRM will be superior with respect to its efficiency. More accurate rotor speed control is enabled with the SynRM synchronous speed and rotor high saliency ratio Ldm / Lqm than it is possible with the IM with slip. Thus, with the SynRM high quality speed control without a rotor position encoder for very low speeds and even for zero speed is possible. In non steady state operation with the fluctuations of the load torque the ab-sence of a damper winding sets high challenges for the motor control system.

91
4 DESIGN OF A SYNCHRONOUS RELUCTANCE MOTOR The aim of this chapter is to find a rotor design suitable for the TLA-SynRM using the same stator as it is designed for the standard four-pole 30 kW induction motor. The variables investi-gated here are the length of the air-gap, the width and location of the flux barriers and the width of the tangential and radial rotor ribs. Also the width of the rotor q-axis cut-out are analysed. The design is carried out using the two-dimensional finite element method, 2D FEM. The SynRM rotor structure must be designed in such a way that it is possible to achieve the maxi-mum torque per current ratio with minimum torque ripple. The calculation method used to evaluate the torque takes into account the effect of cross saturation between the d- and q-axis inductances, but the effect of the iron losses on torque production is ignored. 4.1 Calculation model The different rotor structures are analysed utilising commercial FEM software packages. The dimensions of the stator are kept the same as in the original 30 kW four-pole IM. The design is based on a 48-slot machine with full pitch stator windings. The number of turns in series per phase is also kept equal to the corresponding induction motor value. Fig. 4.1 shows the variables investigated in the FEM model. The arc radius origin x2, y2 is also shown in the figure. The selection of this origin is based on the flux line solution of a four-pole machine. According to the figure selecting this point makes the flux guides about to conform the form of flux lines, see e.g. Fig. 2.1.
rrr
R
x2, y2
rtr
en
x1, y1
rn
½ τ½ τp
δ
Figure 4.1. The synchronous reluctance rotor quarter and the parameters investigated. The parameters shown in Fig. 4.1 are 1. rr - rotor radius 2. rn - nth arc radius 3. rtr - tangential rib width 4. rrr - radial rib width 5. en - nth flux barrier width 6. τ - d-axis pole span 7. τp - d-axis pole pitch

92
With parameters number 2 and 5 it is possible to investigate the effect of the flux barrier num-ber as well as the location and width on the motor torque. In the transversally laminated type the rotor tangential and radial ribs (parameters 3 and 4) must be set non-zero for mechanical reasons. These parameters have a strong negative effect on the SynRM motor properties. The effect of the air-gap length is studied by changing the rotor radius (parameter 1). The bore of the stator is fixed. The effect of rotor q-axis cut-out is studied by changing the d-axis pole span τ value. The nominal torque and the torque ripple are analysed using a rotating FEM model. The fun-damental air-gap flux wave iron losses are investigated in chapter 2.4 using both magneto-dynamic and magneto-transient FEM models. In order to achieve a low q-axis inductance the ribs of the transverse laminated type rotor should be as thin as mechanically possible. A rule of thumb for the punching of the lamination should be considered, which is that the rib width should not be less than the thickness of the laminations itself (Kamper 1996), which, in this case, is 0.5 mm. 4.2 Calculation The FEM solvers used to analyse the different SynRM rotor designs are non-linear, two-dimensional, magneto-static solver in a Cartesian frame. The 48-stator-slot structure has four slots per pole and per phase. The slot pitch is thus 7.5 mechanical degrees. In the following in-vestigations the effects of the different parameters on the torque production are studied with the aid of stepped calculations keeping a constant rms current 55 A and current angle of 60° electri-cal degrees. Because the angular step is 0.5 degrees totally 15 simulation steps must be calcu-lated to achieve one slot pitch. The only modification in the stator done is the addition of semi-magnetic slot wedges. The wedges are used to make the air-gap region permeance function more uniform since more flux is led under the stator slot opening than without wedges. The relative permeability of the mag-netic slot wedge varies between µr = 2 … 4 and it has a high resistivity. Choosing the material is a question of optimisation between the power factor of the machine and the harmonic losses on the rotor surface. Increasing the permeability of the slot-wedge flattens the permeance func-tion, but also increases the leakage flux. Figs. 4.2a and 4.2b show the effect of the slot-wedge in comparison with a normal slot opening.
a)
semi-magneticwedge
b)
Figure 4.2. a) Flux plot in a stator slot section without a semi magnetic wedge. b) Flux plot in a stator slot section as a result of using a wedge (Pyrhönen 1993). The relative permeability of the slot wedge used in the figure is µr=10.

93
In the FEM models there are used several layers of elements across the air-gap. This enables the producing of similar triangle elements in the motor air-gap when the rotor is rotated which then increases the accuracy of calculating the motor torque. The number of elements is high because the air-gap of the SynRM is small. The number of element points in the layers is 180 per pole. It may thus be used the Maxwell stress tensor method to calculate the rotor electromagnetic torque. However, the calculation of the torque of a SynRM is remarkably more demanding than the calculation of the torque of an IM because of the very small air-gap length of the SynRM. The angle from the middle of a stator tooth to the middle of the next stator tooth is 7.5°. In the original induction motor the stator winding is a full pitch single layer winding and each slot carries 13 conductors. The stator stack length is 205 mm, the air-gap diameter 215 mm and sta-tor outer diameter 323 mm. For the initial SynRM prototype an air-gap length of 0.3 mm is used. The original induction motor has an air-gap of 0.8 mm. The length of the 4-pole motor fundamental wave is 180° in geometrical degrees along the air-gap. By selecting the rotation angle to be 0.5° the arc of one pole pair (90°) is divided into 180 parts for the FEM-analysis. In the following sections (4.2.1) … (4.2.5) the tangential rib thick-ness is kept constant at 2 mm. When the rotor rotates through the angle from the centre of one stator tooth to the centre of the next stator tooth, all the ripple effects of the torque caused by permeance variations may be studied. 15 different rotor positions are needed to calculate the required 7.5° distance. The torque wave for the 7.5° distance along the air-gap is constructed of the torque values calculated in the different rotor positions. The torque ripple is then calculated with respect to the mean value of the torque. The calculation procedure is the following (Salo 2000):
1. Draw the stator geometry, build the stator mesh and set the boundary conditions. 2. Draw the rotor geometry, build the rotor mesh and set the boundary conditions. 3. Copy the rotor mesh and rotate it by 0.5°. Set the boundary conditions. Join the stator
mesh to the rotor mesh. Repeat this 15 times. The result is 15 joined meshes, one for each rotor position.
4. Calculate the winding currents for each rotor position to maintain the dq-reference frame current as a constant
5. Set the FEM-problems for each rotor position. 6. Solve the FEM-problem for each rotor position with the 2D-FEM-calculation. 7. Calculate the torque of the solved FEM-problem for each rotor position. 8. Construct the torque wave from the torque values calculated in the different rotor posi-
tions, when the rotor rotates through the angle from the centre of one stator tooth to the centre of the next stator tooth.
4.2.1 Influence of the single flux barrier width The effect of one single flux barrier width has been investigated by changing the width of one barrier as it is described in Fig. 4.3. At each step the flux guide width is increased by 2 mm.

94
Figure 4.3. Modification of one flux barrier width e1. The calculated torque values as a function of the rotor angle are shown in Fig. 4.4. The single barrier width is a parameter. It may generally be assumed that the torque production volume first increases from the initial value as a function of the barrier width. This is because the d-axis flux path reluctance is not remarkably increasing while the q-axis flux path reluctance increases rapidly. Of course, there exists a limit after which the torque starts to decrease while the flux barrier gets larger.
0
0.25
0.5
0.75
1
54 56 58 60 62 64 66Rotor angle [ mechanical degs ]
Torq
ue p
.u.
12 mm10 mm8 mm6 mm4 mm2 mm
Figure 4.4. The torque of a single-flux-barrier-rotor as a function of the rotor angle and dq-reference frame constant current vector over one stator slot pitch in the best torque producing range. The flux barrier width is a parameter. The torque of the original IM corresponds to unity p.u. torque. I = 55 A, and the current vector angle is 60º in dq-co-ordinates. According to Fig. 4.4 the maximum and average level of the torque is increasing as a function of the barrier width but, on the other hand, also the torque ripple increases. Using this constant current vector model the air-gap flux varies a lot mainly because of the saturation in the stator teeth and tangential rib. This saturation and thus also the torque ripple effect increase when the flux barrier width grows, which then increases the irregularity in the flux distribution in the air-gap. This irregularity in the air-gap flux density is also a function of the current amplitude, so that at lower current vector amplitudes the saturation in the stator teeth decreases and thus also the torque ripple effect decreases.

95
The data shown in Fig 4.4 are analysed by calculating the average, maximum and minimum torque values from one slot pitch in Fig. 4.5.
0
0.25
0.5
0.75
1
0 4 8 12 16 20 24Flux barrier width e1 [ mm ]
Torq
ue p
.u.
T MaxT Av.T Min
Figure 4.5. The maximum, minimum and average per unit torque values as a function of one flux barrier width. The torque of the original IM corresponds to unity p.u. torque. I = 55 A and the current vector angle is 60º in dq-co-ordinates. While increasing the single flux barrier width the average torque first increases from the initial 2 mm value of the flux-barrier-width 0.25 p.u. up to 0.6 p.u. at 8 mm width value. After this, the slope of the torque value increase seems to “saturate”. As the flux barrier width increases, an increasing part of the flux is starting to go through the radial rib, which also starts to saturate as a function of the increasing flux. 7 According to Fig. 4.5 the absolute difference between the maximum and minimum torque, which means the torque ripple, seems to reach its lowest value at the flux barrier width 4 mm. While the q-axis inductance is decreasing as a function of the flux barrier width also the d-axis inductance is decreasing because of the increasing saturation of the rib. This flux plot situation has been illustrated in Fig. 4.6, where flux plots at barrier widths of 6 mm and of 18 mm are shown. The amount of flux lines through the barrier in the first mentioned case is 9 as the corre-sponding value in the latter case is only 6. The current angle vectors used in these figures are equal.
a)
b)
Figure. 4.6. The flux plots with flux barrier widths of a) 6 mm and b) 18 mm without radial ribs.

96
According to Fig. 4.6, with the increase of the width of the flux barrier the flux is channelled to go through the tangential rib path or back to the stator using the shorter way. Even though the current vectors used in Fig. 4.6 are equal the place of the maximum flux seems to move towards the d-axis direction. The same effect can also be noticed from Fig. 4.3, where the place of the rotor angle producing the maximum torque is also moving as a function of the flux barrier width. 4.2.2 Influence of the flux barrier location The effect of the location of the one single flux barrier with constant width is investigated by moving the barrier as shown in Fig 4.7. The moving is done so that at each step the d-axis flux guide width is increased by 2 mm so that the flux barrier moves 2 mm towards to the flux bar-rier arc radius initial point. The width of the flux barrier used here is set equal to the width given in previous chapter (6 mm). The flux barrier width used is also equal to the stator slot average width (6 mm). The average stator slot width is calculated using the slot bottom width and the largest slot width.
Figure 4.7. The direction of the flux barrier movement. The relationships between the flux barrier movement and the calculation numbers are clarified in Fig. 4.8. The width of each line is 2 mm which makes that a flux barrier occupies the area of three arcs. The flux barrier number code 1-2-3 may be interpreted so that the barrier end is lo-cated between lines 1, 2, 3, 4 as it is shown in Fig. 4.8.

97
Figure. 4.8. The model used in the calculation of the flux barrier location effect. A flux plot for the flux barrier address number 1, 2, 3 is also given. Each division corresponds to 2 mm on the rotor surface. According to Fig. 4.8 the flux barrier is for the first time totally under the stator slot in this ini-tial rotor position when using the barrier address numbers 2 – 6. Because there is a wide varia-tion possibility of flux barrier numbers only some of the flux barrier torque values as a function of the rotor angle are shown in Fig. 4.9. The number code means that e.g. flux barrier 1-2-3 is located between the lines 1 and 4.
0.00
0.25
0.50
0.75
1.00
55 57 59 61 63 65
Rotor Angle [mechanical degs]
Torq
ue p
.u.
Barrier 1-2-3 Barrier 2-3-4 Barrier 3-4-5 Barrier 4-5-6 Barrier 5-6-7 Barrier 6-7-8 Barrier 7-8-9 Barrier 8-9-10
Figure 4.9. The torque of a single-flux-barrier-rotor as a function of the rotor angle. The flux barrier posi-tion is a parameter. The torque of the original IM corresponds to unity p.u. torque. I = 55 A and the current vector angle is 60º in dq-co-ordinates. In Fig. 4.9 the most ripple-less torque over one slot pitch rotation is achieved using barrier num-ber 4-5-6 and 8-9-10. None of the flux barrier positions produces a totally smooth torque. This means that in order to avoid a torque ripple when using several flux barriers the positions of the flux barriers should be selected so that their sum torque ripple is minimised.

98
The torque produced by a single-flux-barrier-rotor as a function of the barrier location is repre-sented in Fig. 4.10. The data shown in Fig 4.10 are analysed by calculating the average, maxi-mum and minimum torque values over one slot pitch.
0
0.25
0.5
0.75
1
0 2 4 6 8 10 12 14 16 18 20 22 24 26 28 30
Line number
Torq
ue p
.u. T max.
T average
T min.
Figure. 4.10. The maximum, minimum and average torques as a function of the flux barrier starting loca-tion. The line numbers are given in Fig. 4.8. According to Fig. 4.10, in a one-flux-barrier-rotor-motor the torque ripple reaches its minimum at the line numbers 4 and 8. This is because the cogging torques in both ends of the flux barrier compensate each other in these flux barrier positions. The main flux variations are also mini-mised in these points. As the flux barrier starts to move - between calculation points 1 to 9 - the average torque seems to increase from the value 0.5 p.u up to 0.6 p.u. After that point has been reached the respective torque value starts to decrease. It can be assumed that after calculation point 9 the d-axis flux does not remarkably increase and most of the q-axis flux meets the flux barrier. The flux plot situations in different calculation points are shown in Fig. 4.11. The share of the flux lines go-ing through the barrier of the total flux lines is given in Table 4.1.
a)
b)
c)
d)
Figure. 4.11. The flux plots as a function of the flux barrier position. The places of the flux barrier are a) 1-2-3, b) 6-7-8, c) 15-16-17 and d) 28-29-30. The current vectors used in the figures are equal. Table 4.1. The share of the flux lines going through the flux barrier as a function of the flux barrier loca-tion. Flux barrier location Share of the flux lines going through the single flux barrier 1-2-3 9/17 (53 %) 6-7-8 9/18 (50 %) 15-16-17 7/18 (39 %) 28-29-30 2/18 (10 %)
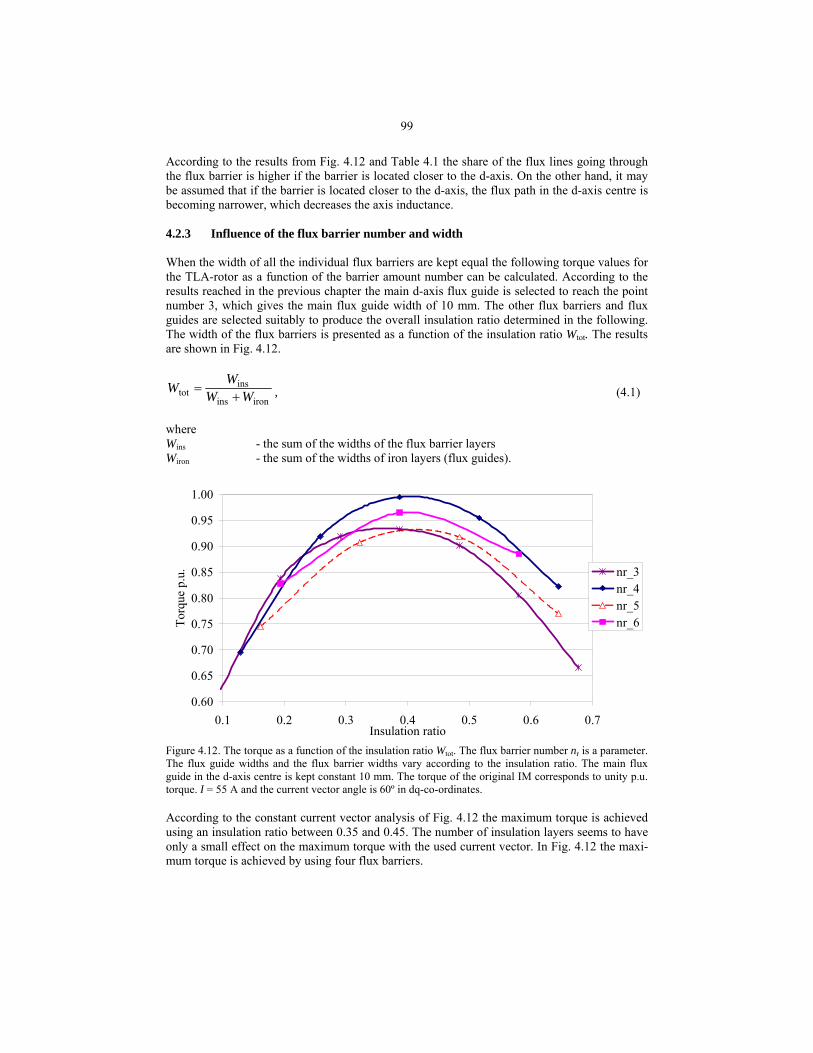
99
According to the results from Fig. 4.12 and Table 4.1 the share of the flux lines going through the flux barrier is higher if the barrier is located closer to the d-axis. On the other hand, it may be assumed that if the barrier is located closer to the d-axis, the flux path in the d-axis centre is becoming narrower, which decreases the axis inductance. 4.2.3 Influence of the flux barrier number and width When the width of all the individual flux barriers are kept equal the following torque values for the TLA-rotor as a function of the barrier amount number can be calculated. According to the results reached in the previous chapter the main d-axis flux guide is selected to reach the point number 3, which gives the main flux guide width of 10 mm. The other flux barriers and flux guides are selected suitably to produce the overall insulation ratio determined in the following. The width of the flux barriers is presented as a function of the insulation ratio Wtot. The results are shown in Fig. 4.12.
ironins
instot WW
WW+
= , (4.1)
where Wins - the sum of the widths of the flux barrier layers Wiron - the sum of the widths of iron layers (flux guides).
0.60
0.65
0.70
0.75
0.80
0.85
0.90
0.95
1.00
0.1 0.2 0.3 0.4 0.5 0.6 0.7Insulation ratio
Torq
ue p
.u. nr_3
nr_4nr_5nr_6
Figure 4.12. The torque as a function of the insulation ratio Wtot. The flux barrier number nr is a parameter. The flux guide widths and the flux barrier widths vary according to the insulation ratio. The main flux guide in the d-axis centre is kept constant 10 mm. The torque of the original IM corresponds to unity p.u. torque. I = 55 A and the current vector angle is 60º in dq-co-ordinates. According to the constant current vector analysis of Fig. 4.12 the maximum torque is achieved using an insulation ratio between 0.35 and 0.45. The number of insulation layers seems to have only a small effect on the maximum torque with the used current vector. In Fig. 4.12 the maxi-mum torque is achieved by using four flux barriers.

100
According to Boldea (1991) values in the range 0.33 … 0.40 are recommended. Lipo (1991) suggests the use of value 0.33 in order to reduce the rotor iron loss. Soong (1995) used the value 0.5 to find a reasonable performance. All of these reference recommendations are for the axially laminated type rotor. In the following the widths of the flux barriers are set equal to the width of the flux guide. Thus, selecting of four flux barriers sets the width of one barrier used in the model to be 6 mm (Wtot = 0.40), which is, according to the result presented in chapter 4.3, a recommendable value for the flux barrier width. Four separate flux barriers are selected in the final rotor. The torque ripple then consists of the sum of the cogging torques of these four barriers. In the following the torque ripple using different flux barrier combinations is investigated. The number of the flux barriers inside the rotor is limited to three. The fourth flux barrier is located on the surface of the rotor forming the q-axis cut-out. The results of the torque ripple as a func-tion of the flux barrier combinations is shown in Fig. 4.13. The flux barrier combination marks used in the figure may be presented as: Combination 1: flux barriers on arcs 1-2-3, 9-10-11, 17-18-19 Combination n: flux barriers on arcs n-.(n + 1)-(n + 2), (n + 8)-(n + 9)-(n + 10), (n + 2 · 8)-(n + 2 · 8 + 1)-(n + 2 · 8 + 2).
0
10
20
30
40
50
60
70
1 2 3 4 5 6 7 8 9 10 11 12
Flux barrier combinations
Torq
ue ri
pple
[ %
]
Ripple
Figure 4.13. The ripple of the different flux barrier combinations. The torque of the original IM corre-sponds to unity p.u. torque. I = 55 A and the current vector angle is 60º in dq-co-ordinates. Using the flux barrier arcs 3-4-5, 11-12-13 and 19-20-21 the total flux ripple remains quite low as it is shown in Fig. 4.14. The lowest torque ripple value is achieved using the combination 7 which are the arcs 7-8-9, 15-16-17 and 23-24-25, but in this case the fourth flux barrier would be located too close to the rotor surface. Thus, selection number 3 is chosen. The torque ripple curves of the selected four flux barriers are illustrated in Fig. 4.14.

101
-0.25
0.00
0.25
55 57 59 61 63 65
Rotor Angle [mechanical degs]
Torq
ue ri
pple
p.u
. Barrier 3-4-5 Barrier 11-12-13 Barrier 19-20-21 Barrier 27-28-29 Sum
Figure 4.14. The torque curves of four separate flux barriers and the sum curve of these. The torque of the original IM corresponds to unity p.u. torque. I = 55 A and the current vector angle is 60º in dq-co-ordinates. According to Fig. 4.14 the torque ripple of the selected flux barrier combination is 21.6 %. Skewing the rotor slightly may reduce this torque ripple. The calculation results of the effect of skewing on the torque ripple are given in Fig. 4.15 as a function of the skewing angle.
0
5
10
15
20
25
0.0 0.5 1.0 1.5 2.0 2.5 3.0 3.5 4.0 4.5 5.0
Skewing angle [mechanical degs]
Torq
ue ri
pple
[%]
Figure 4.15. The torque ripple of the selected flux barrier combination as a function of the skewing angle. The torque of the original IM corresponds to unity p.u. torque. I = 55 A and the current vector angle is 60º in dq-co-ordinates. According to Fig. 4.15 the minimum torque ripple is achieved at a skewing angle of 4.0 de-
grees, which is practically the value of one stator slot pitch (atan
lQR
s
π2 = 3.9°). The torque

102
ripple using a rotor skewed by four degrees is 2.8 % with the current vector used. For a 1500 rpm machine this is a reasonably good value and may compete well with the IM torque ripple. Fig. 4.16 shows the value for the corresponding IM torque ripple at nominal load. The IM has no rotor skewing. Evaluation is done using the magneto-transient FEM model.
-0.1
-0.05
0
0.05
0.1
0.15
0.000 0.005 0.010 0.015 0.020
Time [ s ]
Torq
ue ri
pple
p.u
.
Figure 4.16. The torque ripple of the IM at nominal load (194 Nm). The ripple is about 18 % of the nomi-nal torque. 4.2.4 Influence of the pole span on the pole pitch ratio τ /τ p The torque-current-ratio increases by increasing the air-gap width in the q-axis direction. With this method the d-axis flux path reluctance is kept quite stable as the q-axis reluctance in-creases. The limit for the pole-span-to-pole-pitch-ratio is the value where the ratio between the d- and q-axes inductances starts to decrease. Fig. 4.17 shows the rotor structure with a pole span.
½ τ½ τp
Figure 4.17. The rotor structure with a pole span caused by the q-axis cut-out.

103
The torque values as a function of the pole span angle are shown in Fig. 4.18
0.94
0.96
0.98
1.00
1.02
1.04
1.06
0.60 0.65 0.70 0.75 0.80 0.85 0.90 0.95 1.00
τ / τ p
Torq
ue p
.u.
Figure 4.18. The behaviour of the torque as a function of the pole span angle. The torque of the original IM corresponds to unity p.u. torque. I = 55 A and the current vector angle is 60º in dq-co-ordinates. According to Fig. 4.18 the maximum torque-current-ratio is achieved using a cut-out producing at the pole span ratio 0.67. This gives a result which is quite similar to the corresponding value introduced by Boldea (1996). The pole span increases the nominal torque by about 10 %. The respective torque ripple values are shown in Fig. 4.19.
0
10
20
30
40
50
60
0.60 0.65 0.70 0.75 0.80 0.85 0.90 0.95 1.00
τ / τ p
Torq
ue ri
pple
[ %
]
Figure 4.19. The variations of the torque ripple as a function of the pole span angle without skewing. In this figure the value of the torque ripple is slightly differing from the corresponding value in Fig. 4.15 because in the case here the torque ripple is calculated using three inner flux barriers at the same time. The minimum torque ripple is achieved at a higher pole span angle than the corresponding maximum average torque. Because the difference of the pole span angles between these two extreme values is quite small it is recommended to select a lower torque ripple value. The fact is that a higher pole span angle brings a wider flux guide and thus more rigidity in the rotor structure.

104
4.2.5 Influence of the air-gap length The air-gap length affects the direct axis inductance, the stator leakage flux inductance, the iron losses and the mechanical loss values. Decreasing the air-gap length increases effectively the d-axis inductance. The air-gap length effect on the q-axis inductance is minor because of its rela-tively large reluctance consisting of the rotor inner flux barriers. Fig. 4.20 illustrates the effect of the air-gap length on the axis self-inductance. The rotor type shown in this figure is axially laminated and the lay-out of the rotor is the same as that described in Fig. 2.9a. The estimation of the d-axis current values producing a constant d-axis flux are marked by means of circles.
0.000.050.100.150.200.250.300.350.400.45
0 10 20 30 40 50 60 70Axes currents [ A ]
Indu
ctan
ce [
H ]
L dm(0.3 mm)
L dm(0.4 mm)
L dm(0.5 mm)
L qm(0.3 mm)
L qm(0.4 mm)L qm(0.5 mm)
Figure 4.20. The axially laminated type SynRM d- and q-axis inductances as a function of the currents of the axes. The air-gap length is a parameter. The white circles indicate the current values corresponding to the constant d-axis flux. 4.2.6 Influence of the mechanical strutting In the transversally type SynRM rotor structure the mechanically weakest items are the tangen-tial and the radial ribs. The general rule is that wider flux guides make the rotor mechanically stronger and more braced and thus the number and the width of the flux barriers are mechani-cally limited (Kamper 1996). The widths of the tangential and radial ribs must increase as a function of the motor size because the mechanical forces inside the motor increase. The q-axis flux path reluctance of the transversally laminated reluctance motor consist of the air-gap, the individual radial ribs, the tangential rib and the sum of the equal flux barrier reluc-tances. In the following the effect of different rib widths on the torque production is investi-gated. Radial rib The model has a 2 mm wide tangential rib and a cut-out. The effect of the radial rib width on the average torque and to torque ripple is described in Table 4.2.

105
Table 4.2. The average and torque ripple as a function of the width of the radial rib. The tangential rib is constant 2 mm.
Width of radial rib [ mm ] Average torque p.u. Torque ripple [ % ] 0 1.02 17.1 1 1.01 17.9 2 0.99 19.3 4 0.97 21.9
The increase of the radial rib increases also the q-axis inductance and decreases thus the aver-age torque. The increase of the q-axis inductance decrease also the saliency ratio and increases thus also the effect of the cross saturation as it is mentioned in chapter 4.1. The torque curves of different tangential rib widths as a function of the rotation angle are repre-sented in Fig. 4.21.
0.8
0.9
1.0
1.1
55 57 59 61 63
Rotor Angle [mechanical degs]
Torq
ue p
.u. r rr = 0
r rr = 1
r rr = 2
r rr = 4
Figure 4.21. The torque curves as a function of the rotation angle. The radial rib width is a parameter and the tangential rib width is constant 2 mm. The torque of the original IM corresponds to unity p.u. torque. I = 55 A and the current vector angle is 60º in dq-co-ordinates. The rotor has four flux barriers and no skew-ing. The radial rib width is selected to be 1 mm. This also fulfils the general rule mentioned above, that the width must by bigger than the lamination thickness. Tangential rib Table 4.3 gives the results for the rotor tangential rib as a function of the rib rtr width. In Fig. 2.11 the lay-out of the rotor model is introduced. The rotor is an ALA-type when the tangential rib width is 0 mm. The model has no radial rib and has six flux barriers. Table 4.3. The average and torques ripple as a function of tangential rib width. The model used has no radial rib as it is shown in Fig. 2.11a.
Width of tangential rib [ mm ] Average torque p.u. Torque ripple [ % ] 0 1.02 42.6 1 1.00 30.2 2 0.96 24.7 3 0.93 17.8

106
According to Table 4.3 the average torque decreases as a function of the tangential rib thickness but the torque ripple reduces. It is shown in Fig. 2.4 that the reduce of the air-gap harmonics contents causes a decreasing of the torque ripple. The torque curves of different tangential rib widths as a function of the rotation angle are repre-sented in Fig. 4.22.
-0.25
-0.15
-0.05
0.05
0.15
0.25
56 57 58 59 60 61 62 63 64Rotation angle [mechanical degs]
Cog
ging
torq
ue p
.u.
r tr=0 r tr=1 r tr=2 r tr=3
Figure 4.22. The torque curves as a function of the rotation angle. The tangential rib width is a parameter and the model does not contain a radial rib. The torque of the original IM corresponds to unity p.u. torque. I = 55 A, and the current vector angle is 60º in dq-co-ordinates. The rotor has six flux barriers and no skewing. 4.3 Conclusion According to the calculations the maximum torque was achieved in this case using four flux barriers. The minimum torque ripple with these four flux barriers was achieved using an insula-tion ratio of 0.4, which was obtained using a flux barrier width of 6 mm and a flux guide width of 10 mm. The fourth flux barrier consists of the rotor surface cut-out in the q-axis area. The width of the cut-out was selected compromising the maximum torque productivity and the torque ripple. The widths of the radial ribs and the tangential rib were chosen to be three times as large (1.5 mm) as the thickness of the iron steel sheet used in the machine (0.5 mm) mainly to maximise the mechanical ruggedness. The selected wide ribs reduce the torque ripple but decrease also the torque productivity.

107
5 COMPARISON OF THE INDUCTION MOTOR AND SYNCHRONOUS RE-LUCTANCE MOTOR BASED ON THE TEST RESULTS
This chapter introduces the results of the laboratory measurements. Chapters 2 and 4 already discussed some of the results by comparing them with the calculated values. Because there is no established standard for the measuring of an inverter fed SynRM or induction motor, the IEEE 112 B method for sinusoidally fed poly-phase induction motor is applied in this work. This U.S. standard is recommended for efficiency measurements in the power range of 0,75... 190 kW. The calculation forms for input-output tests of motors with segregation of losses and smoothing of stray load losses are shown in Appendix C. The forms follow the IEEE 112 Std 112-1996 method B. The iron and mechanical losses of both the induction motors and SynRMs are meas-ured using sinusoidal voltage. This is explained more detailed in the following. A DC-machine is used to load the motor. The motor torque is measured by a torque transducer. The DC-machine has an electronic control that sets the load torque and holds it steady while readings are being taken. The measuring consists of several steps, the rated load temperature test, the load test and no-load test. The apparent total loss (input minus output) is segregated into various components with stray-load loss defined as the difference between the apparent total loss and the sum of the conventional losses. The value of the stray-load loss thus determined is plotted vs. the torque squared, and a linear regression is used to reduce the effect of random errors in the test meas-urements. The smoothed stray-load loss data are used to calculate the final value of the total loss and the efficiency. 5.1 Description of the test set-up The SynRM rotor structure is designed and manufactured based on the standard 30 kW four-pole induction machine stator. Both the induction and SynR-motor are supplied by a prototype sensorless direct torque controlled (DTC) variable speed drive. The SynRM rotor is transverse laminated. To eliminate cogging the rotor is skewed by one sta-tor slot pitch. The designed rotor photo is shown in appendix B. All motor configurations are tested in the laboratory in order to evaluate the effects of the changes made, Fig. 5.1. The length of the air-gap and the effect of stator slot-wedges are the variables that are investigated.

108
f1f2
Norma D6100
Test motorTnP
GPIB
Uph = 0 - 400 V f = 0 - 440 Hz
UIP
Vibro MeterTM 285 (500 Nm)
TnP
DCS 500-8070 kVA Synchronous machine
75 kW squirrel cageinduction motor
55 kW DC machine
Coupling
PC
DC
AC
a)
Test motorTnP
55 kW DC machine
GPIB
UIP
Vibro MeterTM 285 (500 Nm)
TnP
DCS 500-80Norma D6100
f1f2
ACS 600
AC
DC
PC
b) Figure 5.1. The test arrangements of the motors in the load tests a) sinusoidal supply, b) DTC-supply. The identification numbers and the constructions of the motors are given in Table 5.1. Table 5.1. The test motors
Motor no.
Features
1 Sinusoidally fed standard high efficiency induction motor, air-gap 0.8 mm 2 Inverter fed standard induction motor, air-gap 0.8 mm 3 Inverter fed standard induction motor + semi magnetic slot-wedge, air-gap 0.8 mm 4 SynRM, air-gap length 0.3 mm 5 SynRM, air-gap length 0.3 mm + semi magnetic slot-wedge 6 SynRM, air-gap length 0.4 mm + semi magnetic slot-wedge 7 SynRM, air-gap length 0.4 mm + semi magnetic slot-wedge + damper windings
Motor number 1 is the original standard induction motor, the stator construction of which is used also for the SynRM construction. The effect of the variable speed drive on the efficiency of the standard induction motor is investigated in motor drive system 2. To run the motor it is used an ABB ACS600 frequency converter, which applies the direct torque control (DTC) sys-tem. The effect of semi magnetic slot wedges is investigated in both cases, the IM (motor 3) and the SynRM (motors 5 and 6). The effect of damper windings in the SynRM is investigated with motor 7.
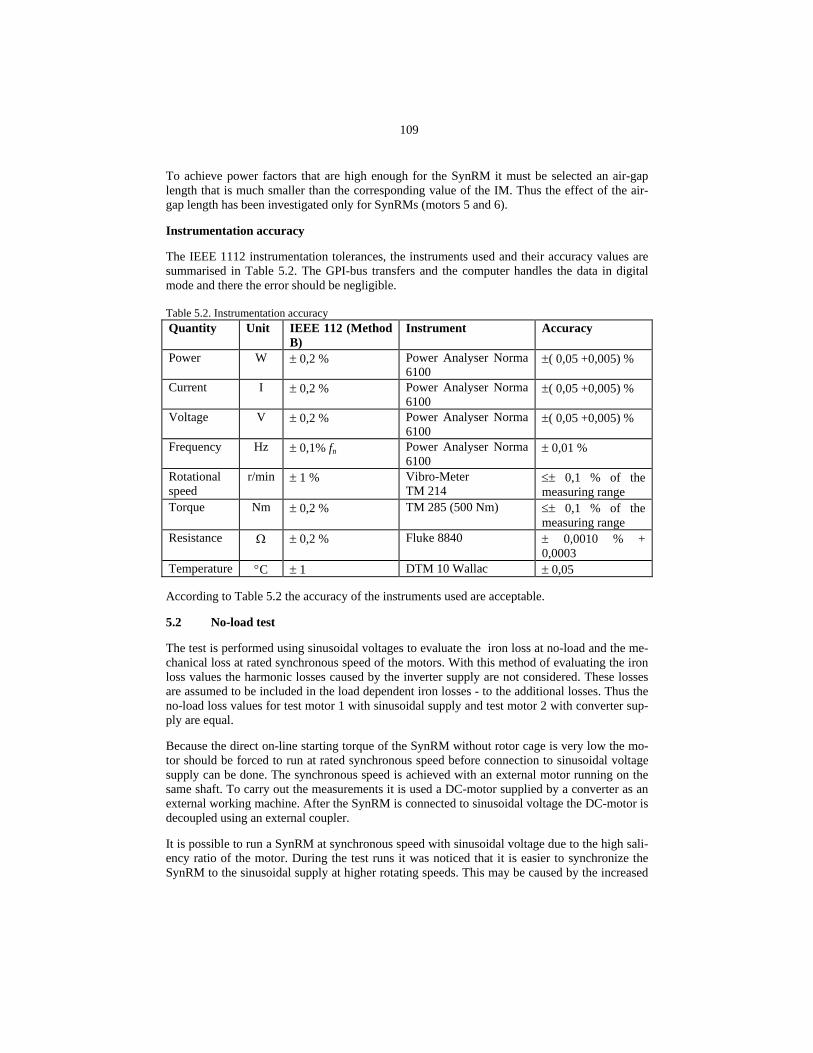
109
To achieve power factors that are high enough for the SynRM it must be selected an air-gap length that is much smaller than the corresponding value of the IM. Thus the effect of the air-gap length has been investigated only for SynRMs (motors 5 and 6). Instrumentation accuracy The IEEE 1112 instrumentation tolerances, the instruments used and their accuracy values are summarised in Table 5.2. The GPI-bus transfers and the computer handles the data in digital mode and there the error should be negligible. Table 5.2. Instrumentation accuracy Quantity Unit IEEE 112 (Method
B) Instrument Accuracy
Power W ± 0,2 % Power Analyser Norma 6100
±( 0,05 +0,005) %
Current I ± 0,2 % Power Analyser Norma 6100
±( 0,05 +0,005) %
Voltage V ± 0,2 % Power Analyser Norma 6100
±( 0,05 +0,005) %
Frequency Hz ± 0,1% fn Power Analyser Norma 6100
± 0,01 %
Rotational speed
r/min ± 1 % Vibro-Meter TM 214
≤± 0,1 % of the measuring range
Torque Nm ± 0,2 % TM 285 (500 Nm) ≤± 0,1 % of the measuring range
Resistance Ω ± 0,2 % Fluke 8840 ± 0,0010 % + 0,0003
Temperature °C ± 1 DTM 10 Wallac ± 0,05 According to Table 5.2 the accuracy of the instruments used are acceptable. 5.2 No-load test The test is performed using sinusoidal voltages to evaluate the iron loss at no-load and the me-chanical loss at rated synchronous speed of the motors. With this method of evaluating the iron loss values the harmonic losses caused by the inverter supply are not considered. These losses are assumed to be included in the load dependent iron losses - to the additional losses. Thus the no-load loss values for test motor 1 with sinusoidal supply and test motor 2 with converter sup-ply are equal. Because the direct on-line starting torque of the SynRM without rotor cage is very low the mo-tor should be forced to run at rated synchronous speed before connection to sinusoidal voltage supply can be done. The synchronous speed is achieved with an external motor running on the same shaft. To carry out the measurements it is used a DC-motor supplied by a converter as an external working machine. After the SynRM is connected to sinusoidal voltage the DC-motor is decoupled using an external coupler. It is possible to run a SynRM at synchronous speed with sinusoidal voltage due to the high sali-ency ratio of the motor. During the test runs it was noticed that it is easier to synchronize the SynRM to the sinusoidal supply at higher rotating speeds. This may be caused by the increased

110
energy carrying in the inertia mass and by the smaller relative slip between the rotating mag-netic field and the rotor. Because the ambient temperature in the laboratory is kept constant the no-load tests are carried out in each case with a cold motor. It is assumed that applying this method of measuring the accuracy needed for this test will be achieved. For this reason, it is unnecessary to do any tem-perature or input power stabilisation before the no-load measurement readings can be started. The reading of the input power is equal to the sum of the no-load motor losses. Subtracting the stator ohmic loss (at the temperature of this test) from the input gives the sum of the friction, windage, and core losses. Fig. 5.2 shows the measured values for the induction motor, Fig. 5.2(a), and for the SynRMs, Fig. 5.2(b), at no-load.
P Motor 1 = 0.0011*U 2 + 0.59*U + 259.29
P Motor 3 = 0.003*U 2 - 0.0007*U + 181.75
0
100
200
300
400
500
600
700
800
900
1000
0 100 200 300 400Voltage U [ V ]
No-
load
loss
es [
W ]
No-load loss, Motor 1Core+mech. loss, Motor 1No-load loss, Motor 3Core+mech. loss, Motor 3
a)
P Motor 5 = 0.0025*U 2 + 0.93*U + 35.94
P Motor 4 = 0.0054*U 2 - 1.95*U + 1087.1
PMotor 6 = 0.0021*U 2 + 1.36*U - 0.80
0
200
400
600
800
1000
1200
1400
150 200 250 300 350 400 450Voltage U [ V ]
No-
load
loss
es [
W ]
No_load loss, Motor 4Core and mech. loss, Motor 4No_load loss, Motor 5Core and mech. loss, Motor 5No_load loss, Motor 6Core and mech. loss, Motor 6
b)
Figure 5.2. No-load test measured values using sinusoidal voltage for a) the induction motor and b) the SynRMs

111
The iron losses can be calculated from the equations shown in Figs. 5.2(a) and 5.2(b) after the mechanical losses have been determined. For the evaluation of the iron losses a 400 V supply voltage is used. The core loss is separated from the friction and windage losses by reading the voltage, the cur-rent, and the power input at the rated frequency and at voltage ratings from the rated voltage down to a point where further voltage reduction starts to increase the current. The power input minus the stator ohmic loss is plotted vs. voltage, and the curves obtained are extrapolated to zero voltage. The interception with the zero voltage axis is the sum of the friction and windage losses. In this test the mechanical loss is determined more accurately by plotting the input power minus the stator ohmic loss against the voltage squared for lower voltage range, figure 5.3.
P Motor 3 = 0.003*U 2 + 182.38
P Motor 1 = 0.0042*U 2 + 270.23
0
100
200
300
400
500
600
0 10000 20000 30000 40000 50000 60000Volts U squared [ V2]
Loss
es [
W ]
Core+mech. loss, Motor 1
Core+mech. loss, Motor 3
a)
P Motor 6 = 0.0045*U 2 + 189.11
P Motor 5 = 0.0037*U 2 + 201.81
P Motor 4 = 0.0034*U 2 + 300.15
200
300
400
500
600
700
800
0 20000 40000 60000 80000 100000 120000 140000 160000
Volts U squared [ V2 ]
Loss
es [
W ]
Core and mech. loss, Motor 4
Core and mech. loss, Motor 5
Core and mech. loss, Motor 6
b)
Figure 5.3. Motor core and mechanical loss curves against the voltage squared for a) the induction motors and b) the SynRMs.

112
The results of the no-load tests are given in Table 5.3. The values are evaluated utilising the curve fittings of figures 5.2(a) … 5.3(b). Table 5.3. No-load motor data with sinusoidal 400 V supply (cold motor) Measured values Motor
1 Motor
2 Motor
3 Motor
4 Motor
5 Motor
6 Stator ohmic loss [ W ] 88 88 101 24 22 41 Stator and rotor iron loss [ W ] 422 422 461 870 605 690 Mechanical loss [ W ] 270 270 182 300 202 189 Total no-load loss [ W ] 780 780 744 1194 829 920 No-load current [ A ] 19.8 19.8 20.3 10.9 10.5 12.2 Table 5.3 proves that the total no-load losses of the tested SynRMs are higher than those of the IMs. This is mainly caused by the higher no-load iron losses. The smallest no-load losses for the SynRMs are achieved with the air-gap length 0.3 mm using semi-magnetic slot wedges. According to Fig 5.3(b) in the SynRM constructions the inserting of the semi-magnetic slot wedges and also the increase of the air-gap length decrease the mechanical losses. A smooth and bigger air-gap decreases the friction of air. In the case of the induction motor, the semi-magnetic slot wedges (motor 3) decrease the motor power factor and increase thus the stator current. With a higher no-load current the no-load iron losses seem to increase. In the induction motor, which has a relatively big air-gap length, the effect of the wedges on the rotor surface iron loss is quite negligible. The mechanical losses seem to differ in a considerable way. However, the big differences may also be explained by slight changes in the mechanics due to several rotor changes. The SynRM rotor without damper windings is about 20 % lighter than the IM rotor because it does not contain a rotor cage and, therefore, the mass of iron is smaller. A lighter rotor has the benefit that it decreases the mechanical losses of the motor. When comparing the motors hav-ing a semi magnetic slot-wedge it may be noticed that, even though the rotor surface of the IM is smoother than that of the SynRM and even though the SynRM has a smaller air-gap length the mechanical losses are quite equal. The same observation may be done regarding the motors having no semi magnetic slot-wedge. The cut-outs (Fig. 4) on the SynRM rotor surface may increase the windage losses because the air-gap length is not smooth.
In the SynRM the effect of the slot wedges on the no-load iron losses is remarkable because the air-gap of the SynRM is narrower compared to that of the induction motor. Increasing the air-gap length of the SynRM increases also the no-load current. During the test a couple of stator slot wedges are lost which may be the reason for the increasing of the iron losses. On the other hand, the load dependent iron losses and also the mechanical losses decrease. 5.3 Rated load temperature test For the performing of the load tests the motors are coupled to a DC-machine that is operated at rated current until it was thermally stable. Because the temperature of the SynRM prototype DTC controller behaves unstably at high load the measured values do not reach the 125 % value in any of the measured cases. The measured motors have quite high efficiencies and, therefore, it is important that the actual temperature of operation is monitored and used for evaluation. The reduced losses of the motor

113
reduce the temperature rise in the motor. Otherwise, the insulation class temperature values for the windings should be used for the determining. High efficiency motors generally operate be-neath the permitted temperature rise.
The stator ohmic loss PCu,S for three-phase machines is equal to equation PCu,S = 1.5 I2 Rs, (5.1) where I is the measured rms current per line terminal at a specified load and Rs is the DC resis-tance between any two line terminals corrected to the specified temperature. In this test the measurement of the temperature is done after a rapid shutdown. The stator resistance behaviour is measured as a function of time. These readings and a fitted curve (with a mathematical for-mula) are been plotted in figure 5.4.
R s = 0.206e-0.0002*t
0.195
0.196
0.197
0.198
0.199
0.2
0.201
0.202
0.203
0.204
0.205
0.206
0 50 100 150 200 250 300Time delay t [ s ]
Stat
or re
sist
ance
Rs [
Ω ]
Figure 5.4. The resistance values as a function of time measured after a heating test for the sinusoidally supplied IM. This stator resistance measurement is unique because in all measured motors it is used the same stator which is warmed in a same time and using the same current. The only temperature correc-tion that should be done is caused by different ambient temperatures. 5.4 Tests under load The motor is loaded by a DC-machine regenerating drive. The load tests are carried out to de-termine the efficiency, the fundamental power factor, the speed, the current, and the tempera-ture rise of the motor. The measured values of the power factors for the induction motors and SynRMs as a function of power are shown in Fig. 5.5.

114
0.50
0.55
0.60
0.65
0.70
0.75
0.80
0.85
0.90
0 5 10 15 20 25 30 35Motor Power [ kW ]
Pow
er fa
ctor
Motor 5Motor 4SynRMMotor 1Motor 3Motor 2
5
4
6
2
31
Figure 5.5. The fundamental power factors of the induction motors and SynRMs as a function of the motor output power. According to Fig. 5.5, at a lower load range the power factors of the SynRMs are higher com-pared to the values of the induction motors. The benefit of the small d-axis air-gap is empha-sized in this area.
According to the results the power factors of variable frequency supplied induction motors are higher than the power factor of the corresponding sinusoidally supplied induction motor below the rated power area. The semi-magnetic slot-wedges decrease the harmonic losses but this ef-fect remains quite minor in the range of higher power. Above this power the fundamental power factors of VF driven motors seem to fall. Compared to the induction motor with a frequency converter supply the power factors of the SynRMs behave quite similarly. The value starts to decrease at a certain load point. For the SynRMs this load point appears at a lower power than for the induction motor drives. Accord-ing to figure 5.5, motor 5 with semi magnetic slot-wedge has a higher power factor than the respective motor 4 without semi magnetic slot-wedge. It is assumed that the power factor in-creases as a result of the increased saliency ratio. The d-axis inductance increases more than the q-axis inductance. Because of the rotor cut-out the leakage flux inductance in the q-axis is somewhat smaller than in the d-axis. The increased air-gap length in motor 6 decreases the power factor because of the decreased d-axis inductance and thus decreased saliency ratio. Because of the decreased d-axis inductance more d-axis current is needed, which then reduces the current angle κ. The measured differences of efficiencies between the induction motor with FC or sinusoidal voltage supply are shown in Fig. 5.6.

115
89.0
89.5
90.0
90.5
91.0
91.5
92.0
92.5
93.0
93.5
0 5 10 15 20 25 30 35
Motor Power [ kW ]
Effic
ienc
y [ %
]
Motor 1Motor 2Motor 3
Figure 5.6. The induction motors’ efficiencies as a function of the motor power. As it can be noticed from Fig. 5.6 the efficiencies of the motors 2 and 3 with converter supply are decreasing compared to the efficiency of the motor with sinusoidal supply, especially at full load. This efficiency decrease of the converter fed motors is caused by two phenomena. The harmonic losses in the motor increase remarkably. Also the copper losses increase since the motor is running in a slight field weakening at its nominal speed. This field weakening is typi-cal for DTC inverters that maintain a certain voltage reserve for dynamic changes in the torque. Converter fed motors reach their highest efficiency values at partial load values that are lower than those of the sinusoidally supplied motor. This is caused by the load dependent losses that are more considerable in the FC fed motors than in the sinusoidally fed motor. The efficiency maximum partial load point is dependent on the share of the load independent losses PI (core loss and mechanical loss) and load-dependent losses PL (stator and rotor I2R loss and stray load loss) (Auinger 1987). The efficiency reaches its maximum value at the partial load point P*
NL
I* PPP
P = . (5.2)
The difference between the standard motor with and without semi-magnetic slot-wedges in converter supply is interesting to note. The semi-magnetic slot-wedges affect both the no-load and the load dependent losses. The stator semi-magnetic slot-wedges smoothen the stator inner surface, and decrease thus the windage losses. They also smoothen the flux density distribution on the rotor surface, as it is discussed earlier in chapter 4.2, and reduce thus the permeance har-monics generated rotor surface losses.

116
The measured differences between the SynRMs with FC supply are shown in Fig. 5.7. The ef-fect of semi-magnetic slot wedges (motors 5 and 6) and the increase of the air-gap length (mo-tor 6) are illustrated. Fig. 5.7 shows that the efficiencies of motors 5 and 6 are quite equal. The interesting aspect of the difference between the motor without semi-magnetic slot-wedges (motor 4) and the motors with semi-magnetic slot-wedges (motors 5 and 6) is analysed more detailed below. The increase of the air-gap length moves the efficiency maximum to a higher partial load.
85
86
87
88
89
90
91
92
93
94
5 10 15 20 25 30 35
Motor Power [ kW ]
Effic
ienc
y [ %
]
Motor 6Motor 5Motor 4
Figure 5.7. The efficiencies of the SynRM prototypes as a function of the motor power. Stray-load loss The stray-load loss will be separately calculated for each load point by subtracting from the apparent total loss the stator ohmic loss at rated temperature of the test, the core loss, the fric-tion and windage loss, and the rotor ohmic loss corresponding to the measured values of the slip. Calculation will be done for each of the approximately equally-spaced load points. Smooth stray-load loss data are obtained by using a linear regression analysis based on the ex-pression of the stray-load loss as a function of the square of the load torque WLL = AT2 + C, (5.3) where WLL is the stray-load loss as plotted vs. torque squared, T is the torque, A is the slope and C is the intercept with the zero torque line. If the slope is negative or if the correlation factor r is less than 0.9, the worst point should be deleted and then the regression should be repeated. If this increases r to 0.9 or larger, the second regression should be used; if not, or if the slope is still negative, the test is unsatisfactory. The linear regression data for SynR-motors are shown in Fig. 5.8.

117
Motor 6 = 0.012*T 2 - 87.60r 2 = 0.91
Motor 4 = 0.018*T 2 - 628.38r 2 = 0.90
Motor 5 = 0.019*T 2 + 229.43r 2 = 0.82
-800
-600
-400
-200
0
200
400
600
800
1000
0 5000 10000 15000 20000 25000 30000 35000
Torque T squared [ Nm2 ]
Stra
y-lo
ad lo
sses
[ W
]
Stray load loss, Motor 5Stray load loss, Motor 6Stray load loss, Motor 4
Figure 5.8. Plot of Stray-Load loss vs. Torque Squar ed for 30 kW SynRM. The stray-load losses vs. torque squared of the measured motor are shown in Fig. 5.9. Fig. 5.9 illustrates the measured effect of the semi-magnetic slot-wedges and of the air-gap length on the stray load additional losses.
0
100
200
300
400
500
600
700
800
0 5 10 15 20 25 30 35 40Motor Power [ kW ]
Stra
y lo
ad lo
ss [
W ]
Motor 4Motor 5Motor 6Motor 2Motor 3Motor 1
4
5
6
22
3
1
Figure 5.9. The corrected stray-load losses of the different motors as a function of the motor ouput power.

118
Table 5.4 gives an abstract of the components, origin, type and locations of the load dependent additional losses. Table 5.4. Leakage flux (load) stray losses (Schwarz 1964)
Component Origin Type and location Surface losses Gap leakage (harmonic) flux Stator and rotor core losses Tooth-pulsation losses Gap leakage (harmonic) flux Stator and rotor core losses Tooth-pulsation, squirrel-cage circulating current losses
Gap leakage (harmonic) flux Rotor ohmic losses
Stator-harmonic, circulating current losses
Gap leakage (harmonic) flux Rotor ohmic losses
Stator-slot eddy-current losses Slot leakage flux Stator ohmic losses Rotor-slot eddy-current losses Slot leakage flux Abnormal rotor I2R loss at
high slip only Stator-overhang eddy-current losses
Overhang leakage flux Stator core loss
Rotor-overhang eddy-current losses
Overhang leakage flux Abnormal rotor core loss at high slip only
According to Fig. 5.9 the increase of the air-gap length in the SynRM (motor 6) decreases the additional losses. If the air-gap length is kept constant (motors 4 and 5) the effect of the semi-magnetic slot-wedges on the additional losses is minor. SynRM additional losses are mainly caused by the gap leakage harmonic flux. The effect of the slot harmonics on the SynRM addi-tional losses can be ignored because there are no current conductors in the rotor. Because the stators of these motors are equal the air-gap flux harmonic contents of the induc-tion motor are smaller compared to the respective SynRM harmonic contents, mainly because of the wider air-gap length. The rotor surface of both motors are smooth and the air-gap length is constant, except in the cut-out areas of the SynRM q-axes. Table 5.5 shows the results of the measured different losses based on the load test. The values are evaluated using the measuring report of IEEE 112 method B. The measuring table of motor 6 is given in appendix C.

119
Table 5.5. Estimated and IEEE temperature corrected motor data at rated power 30 kW Motor 1 Motor 2 Motor 3 Motor 4 Motor 5 Motor 6
Efficiency [ % ] 92.4 91.9 92.1 90.5 91.6 92.0 Power factor 0.80 0.78 0.79 0.77 0.82 0.72
Nominal Current [A] 55 61 61 65 65 66 Iron loss [ W ] 422 422 461 870 605 690
Mechanical loss [ W ] 270 270 182 300 202 189 Stator ohmic loss [W] 1051 1192 1210 1334 1312 1373 Rotor ohmic loss [W] 650 552 584 - - - Additional loss [W] 74 213 145 635 633 368
Load dependent losses [W] 1775 1957 1939 1969 1945 1740 Total loss [W] 2467 2649 2581 3140 2753 2619
According to Table 5.5 the total losses of the best SynRM construction give values equal to the losses of the respective induction motor construction in the converter supply. The largest losses are measured with the SynRM construction with the smallest air-gap length and without semi-magnetic slot wedges to dampen the air gap spatial harmonics. With the slot wedges the total losses of the frequency converter supplied IM can be slightly reduced compared to the losses of the frequency converter supplied IM without slot wedges. Using slot wedges the iron loss on no-load are higher and the power factor on load remains higher. The slot wedges seem to reduce the windage losses in every case. However, the mechanical losses are easily affected by the bearing arrangement of the motor. The same motor frame was used in every measurement. The bearings were changed when necessary. This easily causes tens of watts of variation in the me-chanical losses in the motors. As it can be noticed from Table 5.5, there is no significant difference between the total losses of the best SynRM (motor 6) and the losses of the standard induction motor in converter supply. This is mainly the result of factors that are caused by the absence of the rotor ohmic losses. The smallest load losses are achieved with the air-gap length 0.4 mm and with semi-magnetic slot wedges. According to Table 5.5, when the motor air-gap length is kept the same the semi-magnetic slot wedges decrease the mechanical and load depended iron losses of both the IM and SynRM. In the case of the SynRM the semi-magnetic slot wedges reduce the no-load iron losses but in the case of the IM the no-load iron losses increase.
In a variable speed drive the standard 30 kW induction motor efficiency without semi-magnetic slot-wedges (motor 2) is quite equal to the efficiency of the best SynRM with slot wedges (mo-tor 6). The SynRM without slot-wedges has an efficiency that is 1.7 %-units lower at rated power.
5.5 The SynRM with damper winding The starting and pull-out performances of the SynRM with damper winding construction intro-duced in Fig. 1.8 are shown in Figs. 5.10. In the following the motor is called motor 7.

120
-500-400-300-200-100
0100200300400500
0 2 4 6 8 10 12
Time [ s ]
Torq
ue [
Nm
]
a)
-400
-300
-200
-100
0
100
200
300
400
500
0.0 0.5 1.0 1.5 2.0 2.5 3.0 3.5
Time [ s ]
Torq
ue [
Nm
]
b)
Figure 5.10. SynRM with damper windings a) measured starting torque at no-load b) the pull-out torque test at lower voltage (100 V). Fig. 5.10a shows that the starting time is quite long and the torque contains oscillation. The poor starting performance is an indication of the fact that the rotor cage and rotor magnetic path are not at all optimal for an asynchronous start. According to Fig. 5.11 the rotor seems to be-have similarly compared to induction motors. The flux is not penetrating the rotor to a large degree at high slip.
Figure 5.11 SynRM with damper windings direct grid fed start-up flux penetration, blocked rotor. The results of the SynRM with damper winding no-load test are illustrated in Figs. 5.12 … 5.13.

121
0
200
400
600
800
1000
1200
0 100 200 300 400 500
Volts [ V ]
No-
load
Los
s [ W
]
0
2
4
6
8
10
12
14
16
18
20
Cur
rent
[ A
]
Total lossIron and mech. lossNo-load current
Figure 5.12. Motor 7 no-load and core + mechanical loss curves and no-load current curve plotted against the voltage.
P Motor 7 = 0.0038*U 2 + 265.34
0
200
400
600
800
1000
1200
0 50000 100000 150000 200000 250000Volts U squared [ V^2 ]
Loss
es [
W ]
Iron and mech. loss
Figure 5.13. Motor 7 core and mechanical loss curve plotted against the voltage square. The network supply load test for the SynRM without damper windings was not done since it is impossible to start the motor directly to the network. Also, without dampening the motor does not maintain synchronism. Thus, the evaluation of the damper windings effect in direct supply can not be discussed here. The differences between the FC fed SynRM without damper wind-ings and the network supplied SynRM with damper winding are shown in Figs. 5.14a and 5.14b. Both motors have semi-magnetic slot wedges and the same air-gap length.

122
88.5
89.0
89.5
90.0
90.5
91.0
91.5
92.0
92.5
93.0
5 10 15 20 25 30 35Motor Power [ kW ]
Effic
ienc
y [ %
] Motor 7Motor 6
a)
0.60
0.65
0.70
0.75
0.80
5 10 15 20 25 30 35Motor Power [ kW ]
Pow
er fa
ctor
Motor 7Motor 6
b)
Figure 5.14. SynRM with damper windings (motor 7) and without damper winding (motor 6) DTC FC fed a) efficiency and b) power factor values as a function of the torque. According to Fig. 5.14 the SynRM with damper winding has a higher or equivalent power fac-tor and corresponding efficiency values compared to the SynRM without damper winding and fed by the DTC FC in the load area below 50 % of the nominal load. At higher load the power factor of motor 6 is lower due to the flux reduction caused by the voltage drop in the FC. Thus, to produce the same torque higher stator current is needed. This increases mainly the q-axis current, which reduces the power factor.

123
Because of the higher power factor the stator ohmic losses are lower in motor 7 but there occurs load dependent additional losses in the damper winding as it is shown in Fig. 5.15.
0
50
100
150
200
250
300
350
400
450
0 5 10 15 20 25 30Motor Power [ kW ]
Loss
es [
W ]
Motor 7
Motor 6
7
6
Figure 5.15. The corrected stray-load loss as a function of motor output power. The damper winding is a parameter. 5.6 Conclusion
In this chapter it is shown that the IEEE 112 test method B is an acceptable method for the evaluating of the share of losses in both induction and synchronous reluctance motors in con-verter supply. The effect of semi-magnetic slot-wedges in the stator slot openings has been in-vestigated as a parameter for both motor types. According to the results obtained the slot wedges decrease the total losses in both motor types in a variable speed drive. The effect of the air-gap length has been examined for the SynRM. The increased SynRM air-gap length de-creases also the total losses of the motor. In a variable speed drive, the losses of the SynRM with slot-wedges remain lower than those of the standard induction motor without slot-wedges. At rated load the iron and additional losses of the SynRM are over 60 % higher than those of the standard induction motor in variable speed drives. The induction motors rotor ohmic losses are higher than the “extra” iron losses of the SynRM. Despite of this, the total losses of the SynRM are rather equal to or larger than the losses of the IM. This is explained by the fact that the lower power factor of the SynRM increases the stator ohmic losses of SynRM. According to the results obtained in this study it may be concluded that in order to achieve a SynRM produc-ing an efficiency that is considerably higher compared to the original induction motor efficiency the rotor magnetic circuit of the SynRM should be manufactured of a better iron material.

124
6 CONCLUSION The aim of this research work was to study the properties of the SynRM and to see whether it can compete in performance with high efficiency standard induction motors in power ranges typical for low voltage IMs used in industrial applications. The benefit of the SynRM with respect to the IM is that there are no copper losses in the rotor. Leaving the rotor cage out is thus, in principle, possible. However, the presence of the rotor cage might help in several ways: It binds the rotor laminations together to produce a firm construction; it also helps to control the machine during transients acting as a damper winding; and it makes a direct network start possible. With respect to the motor performance – especially the full load power factor – the absence of the rotor currents is not only a benefit but also a problem. In larger induction motors the power factor is high – in the range of 0.9. This is possible since the rotor current acts as a compensating current for the stator armature reaction. The sum magneto-motive force of the stator and the rotor magnetises the IM air-gap. Since there is no current in the SynRM rotor, especially the quadrature axis inductance of the SynRM should be extremely small. Otherwise, the stator armature reaction inevitably produces for the SynRM – by turning the air-gap flux linkage away from the d-axis – a power factor that is lower than the power factor of a good IM. The low quadrature axis inductance brings forward some problems concerning the power electronic control of the SynRM. E.g. a high switching frequency is needed to avoid a large current ripple in the q-axis current. The power factor of both motor types may be increased by maximising the direct axis magnetising inductance. Specifically the magnetising inductance of the SynRM should be large. This, unfortunately, requires a smaller air-gap than it has been used traditionally in IMs. The smaller air-gap brings some disadvantages with it. Firstly, the manufacturing of a SynRM must be more accurate and becomes thus probably more expensive than the manufacturing of an IM. Secondly, the rotor surface losses caused by the air-gap spatial harmonics are increased at the same time as the air-gap is diminished. This, thirdly, requires the use of slot wedges or other methods to smoothen the air-gap flux density. This also suggests the use of better magnetic circuit material, which again increases the cost of the SynRM. On the other hand, the prototype motor was constructed using exactly the same parts coming from a normal IM production line. The assembling of a small air-gap rotor progressed well and without any problems. It might thus be concluded that the manufacturing technology at least in ABB’s Vaasa factory is accurate enough for the producing of TLA-rotor SynRMs with low air-gaps. The study shows that, with some special measures, the efficiency of the TLA SynRM is equivalent to that of a high efficiency IM. The power factor at nominal load will probably remain smaller and thus the stator of the SynRM should be, contrary to this study, designed particularly for the SynRM. It might be even assumed that using more copper and less stator core material a more suitable resistance and better inductance values for the machine may be possibly achieved – at least the q-axis inductance should become a little smaller, which unexpectedly could improve the power factor. Compared to the TLA-rotor machine the ALA-rotor structure offers better possibilities to produce larger inductance ratios. A high inductance ratio might be achievable even with an air-gap slightly larger than that of the TLA-rotor machine. This may probably bring a better power

125
factor than that of an IM. The ALA-rotor iron losses, however, are sensitive to the spatial air-gap harmonics. The ALA-type rotor must thus be manufactured of high-resistivity thin laminations to avoid excessive iron losses. Also the methods of manufacturing are totally differing from those applied for the manufacturing of a TLA-rotor. The latter may be manufactured using the same tools which are used for the producing of IMs. The ALA-type rotor might for this reason be out of discussion for the time being. One benefit of the SynRM remains to be discussed. The big rotor inductance ratio is of a considerable use for the estimating of the rotor position of the motor. This again is shown to be very advantageous for the designing of the rotor position sensorless drive. For example the laboratory test results in this thesis have partly been reached using a sensorless SynRMDTC drive. It is probably easier to achieve an accurate sensorless speed control with a SynRM drive than with an IM drive. The slip of an IM makes the accurate estimation of speed extremely difficult. Paper machine drives for example require a speed accuracy of 0.1%. This accuracy may not be achieved with present-day position sensorless IM drives as for a position sensorless SynRM drive this level may easily be achieved. Also the partial load good properties of the synchronous reluctance motor might be encouraging. Often industrial motors run at partial loads and, in such cases, the SynRM might be a better choice than an IM. The adding permanent magnets to the SynRM rotor may be one alternative to improve the SynRM performance and especially its power factor and efficiency. Using PM material may improve the motor power factor and consequently reduce the motor current. The reduced currents also reduce the motor stator ohmic losses. On the other hand, the reluctance torque reduces the quantity of the expensive PM material needed and makes this solution cheaper than the corresponding permanent magnet motor (Haataja 2002b).

126
REFERENCES
Abrahamsen 2001 Abrahamsen F., Blaabjerg F., Pedersen, J.K., Thoegersen P.B., Efficiency-optimized control of medium-size induction motor drives, IEEE Transactions on Industry Applications, Vol. 37, Issue: 6 , Nov.-Dec. 2001, pp. 1761 -1767
Auinger 1997 Auinger H, 1997, Considerations about the determination of the ef-ficiency of electric machines, Energy efficiency Improvements in electrical motors and drives, pp. 284– 304, Springer, 1997. ISBN 3-540-63068-6.
Bertotti 1991 Bertotti G., Boglietti A., Chiampi M., Chiarabaglio D., Fiorillo F., Lazzari M., An improved estimation of iron losses in rotating elec-trical machines, IEEE Transactions on Magnetics, vol. 27 Issue: 6 Part: 2 , Nov. 1991, pp. 5007 –5009
Betz 1992
Betz R.E., Jovanovic, M., Lagerquist, R., Miller, T.J.E., Aspects of the control of synchronous reluctance machines including saturation and iron losses, Conference Record of the 1992 IEEE Industry Ap-plications Society Annual Meeting, vol. 1, pp. 456–463.
Betz 1993 Betz R.E., Lagerquist R., Jovanovic M., Miller T.J.E., Middleton R.H., Control of synchronous reluctance machines, IEEE Transactions on Industry Applications, vol. 29, Issue: 6, 1993, pp. 1110 -1122.
Boldea 1991
Bolde I., Nasar S.A., Emerging electric machines with axially lami-nated anisotropic rotors: A review, 1991, Electrical machines and power syst. vol. 19, pp. 673-704.
Bomela 1998 Bomela X.B., Jackson S.K., Kamper M.J., Performance of small anf medium power flux barrier rotor reluctance synchronous machine drives, International conference on Electrical Machines 1998. pp. 95–99.
Bomela 1999 Bomela X.B., Kamper M.J., Effect of stator chording and rotor skewing on average torque and torque ripple of reluctance synchro-nous machine, Africon, 1999 IEEE, vol. 2, pp. 687–690.
Brinkman 1965
Brinkman J., Theorische und experimentele Untersuchungen an einem Motor mit verbesserter Ausnutzung des Reaktionsprinzips, Dissertation, Fakultät für Maschinenwesen der Technischen Hochschule Carolo-Wilhelmina, Braunschweig, Jan. 1965.
Carter 1901 Carter F. W. 1901. Air-Gap Induction. Electrical World and Engineering vol. XXXVIII, No 22. 884 - 888.

127
Chalmers 1998
Chalmers B.J., Musaba L., Design and field-weakening performance of a synchronous reluctance motor with axially laminated rotor. IEEE Transactions on Industry Applications, vol. 34. Issue: 5 , Sept.-Oct. 1998, pp. 1035 –1041.
Cruickshank 1966 Cruickshank A.J.O., Menzier R.W., Anderson A.F., Axially laminated anisotropic rotors for reluctance motors, Proc. Lost, Elect, Eng., vol 113, pp. 2058-2060, Dec. 1966.
Douglas 1956 Douglas J.F.H., 1956. The theory of anisontropic field structures in synchronous machines.Transaction on AIEE. Vol 75. pp. 84-86.
El-Antably 1985 El-Antably A., Hudson T. L. The design and steady-state performance of a high-eficiency reluctance motor. Conference record of the 1985 Industry Applications Society, New York, pp. 770 – 776.
EURODEEM 2000 http://iamest.jrc.it/projects/eem/eurodeem.htm (date 270303)
Feng 1993 Feng X. Belmans R., Verdyck D., Geysen W., 1993. Reluctance motor with a radially-laminated rotor using anisotropic material. Conference Record of the IEE Sixth International Conference on Electrical Machines and Drives, pp. 79–84.
Fletcher 1995 Fletcher J.E, Design, analysis and control of a synchronous reluctance machine, Dissertation, Heriot-Watt University, 1995.
Fratta 1987
Fratta A., Vagati A., A reluctance motor drive for high dynamic performance applications, Conference Record of the 1987 IEEE IAS Annual Meeting, Atlanta, GA, pp. 295-302.
Fratta 1989
Fratta A., Vagati A., Villata F., On the evolution of AC machines for spindle drive applications, Conference Record of the 1989 IEEE Industry Applications Society Annual Meeting, vol. 1, pp. 699–704.
Fratta 1992 Fratta A., Vagati A., 1992. A reluctance motor drive for high dynamic performance applications, IEEE Transactions on Industry Applications, vol. 28 Issue: 4 , July-Aug. 1992, pp. 873–879.
Fratta 1994
Fratta A., Petrache C., Franceschini G., Troglia G.P., A simple current regulator for flux-weakened operation of high performance synchronous reluctance drives, Conference Record of the IEEE Industry Applications Society Annual Meeting, 2-6 Oct 1994, vol. 1, pp. 649 –657.
Frost 1994 Frost & Sullivan consults, 1994, European integral horsepower motor market. Research report.

128
Gertmar 1995 Gertmar L., Rydholm B., Designs of synchronous reluctance motors
and performance comparisons with asynchronous motors, Interna-tional Symposium on Electric Power Engineering (June 1995/Stockholm), Royal Institute of Technology and IEEE Power Engineering Society, Electrical machines and drives, pp. 286– 291.
Haataja 1999a
Haataja J., Härkönen H., IEA Hi-Motors Competition, Energy effi-ciency Improvements in electrical motors and drives, pp. 540– 545, Springer 1997. ISBN 3-540-63068-6.
Haataja 1999b
Haataja J., Pyrhönen J.,Approaching the truth in induction motor efficiency, Energy efficiency Improvements in electrical motors and drives, pp. 320– 327, Springer 1997. ISBN 3-540-63068-6.
Haataja 2000
Haataja J., Pyrhönen J., Synchronous reluctance motor: an alterna-tive to induction motor, International Conference of Electrical Ma-chines ICEM2000, 28-30.8. 2000, Helsinki, pp. 1762– 1766.
Haataja 2002a
Haataja J., Pyrhönen J., Energy saving potential using high effi-ciency motor technology in EU, Research report, Lappeenranta Uni-versity of technology. Department of electrical engineering. 49 pages. 2002.
Haataja 2002b
Haataja J., Pyrhönen J., Permanent magnet assisted synchronous reluctance motor, an alternative motor in variable speed drives, ringer. 3rd International Conference of Energy efficiency in motor driven systems EEMODS’ 02. Treviso Italy, 18-20.9.2002.
Haring 1999
Haring T., Design of motors for inverter operation, Energy effi-ciency Improvements in electrical motors and drives, pp. 26– 38, Springer, 1997. ISBN 3-540-63068-6.
Hippner 1996 Hippner M., Harley R.G., 1996. Design aspects of axially laminated synchronous reluctance motors. IEEE AFRICON 4th , vol. 1, pp. 173–177.
IEC 34-2 1972
IEC 34-2 Standard, Methods for determining losses and efficiency of rotating electrical machinery from tests (excluding machines for traction vehicles), 1972.
IEEE 1991 IEEE Standard Test Procedure for Polyphase Induction Motors and Generators, IEEE Std 112 1991.
Kamper 1996 Kamper M., Design optimisation of cageless flux barrier rotor reluc-tance synchronous machine, Dissertation, University of Stellen-bosch, 1996.
Kostko 1923 Kostko J.K., Polyphase reaction synchronous motors. Journal AIEE 1923, vol. 42, pp. 1162 – 1168.

129
Kurscheidt 1961
Kurscheidt P., Theoretische und experimentelle Untersuchung einer neuartigen Reaktionsmaschine. Dissertation, Fakultät für Maschinenwesen und Elektrotechnik der Rheinisch-Westfälischen Technischen Hochschule, Aachen, Jan. 1961.
Lawreson 1963
Lawreson P.J., Agu L.A., A new ununexcited synchronous machine, Proc. IEE, vol. 110, No. 7, 1963, pp. 1275.
Lawreson 1964
Lawreson P.J., Theory and performance of polyphase reluctance machines, Proc. IEE, vol. 111, No. 8, pp. 1435 – 1445, Aug. 1964.
Lawreson 1967
Lawreson P.J., Gupta S.K., Deveploments in the performance and theory of segmental-rotor reluctance motor, Proc. IEE, vol. 117, No. 6, pp. 645 – 653, May 1967.
Leonhard 1995 Leonhard W., AC drives with macroelectronic power supply and microelectronic control, flexible sources of controlled mechanical energy, Proceedings of the IEEE International Symposium on Indus-trial Electronics, 1995. ISIE '95, vol.1, pp. 1 –11.
Levi 1995
Levi E. Impact of iron loss on behaviour of vector controlled induc-tion machines, Conference Record of the 1994 IEEE Industry Appli-cations Society Annual Meeting, vol. 1, pp. 74 –80.
Lipo 1967 Lipo T.A., Krause P.C., Stability analysis of a reluctance-synchronous machine, IEEE Trans. PAS, vol. 86, No. 7, pp. 825 – 834, July 1967.
Lipo 1991 Lipo T.A., Synchronous reluctance machine, a viable alternative for AC drives, Electr. Mach. Power Syst., vol. 19, pp. 659 – 671, 1991.
Longya 1991 Longya X., Xingyi X., Lipo T.A., Novotny D.W., Vector control of a synchronous reluctance motor including saturation and iron loss. IEEE Transaction on Industry applications, vol. 27, No. 5, pp. 977– 985.
Longya 1999 Longya X., Baoguo W., Comparison study of rotor structures for five-phase synchronous reluctance machines, Conference Record of the 1999 IEEE Industry Applications 1999. Thirty-Fourth IAS An-nual Meeting. vol. 2, pp. 846 – 853.
Matsuo 1994 Matsuo T., Lipo T.A., 1994. Rotor design optimisation of synchro-nous reluctance machine. Conference Record of the 1994 IEEE In-dustry Applications Society Annual Meeting, vol. 1, pp. 627–634.
Miller 1991 Miller T.J.E., Hutton A., Cossar C., Staton D.A., Design of a synchronous reluctance motor drive., IEEE Transactions on Industry Applications, July-Aug. 1991, vol. 27, Issue 4, pp. 741–749.

130
Mueller 1995 Mueller M.A., Williamson S., Flack T.J., Atallah K., Baholo B.,
Howe D., Mellor P.H., Calculation of iron losses from time-stepped finite element models of cage induction machines, Electrical Machines and Drives, 1995, Seventh International Confer-ence on (Conf. Publ. No. 412), pp. 88.
Murakami 2001 Murakami H., Honda Y., Sadanaga Y., Ikkai Y., Morimoto S., Ta-keda, Y. Optimum design of highly efficient magnet assisted reluc-tance motor, Conference Record of the 2001 IEEE Industry Applica-tions Thirty-Sixth IAS Annual Meeting, vol. 4, pp. 2296 – 2301.
Nee 1995 Nee H.P., Rotor slot design of inverter-fed induction motors, Seventh International Conference on Electrical Machines and Drives, 1995, pp. 52 –56.
NEMA 1993
NEMA Standards Publication No. MG 1-1993, Motors and Genera-tors.
Pyrhönen 1993
Pyrhönen J., Kurronen P., Properties of High-Speed Solid-Rotor Induction Machines, Research Report, Lappeenranta University of Technology, Department of Energy Technology, EN A-19, 1993, 24 pages.
Richter 1954
Richter R., Elektrische Maschinen IV Die Induktionsmaschinen, Zweite, Verbesserte Auflage, Basel/Stuttgart, Verlag Birkhäuser. 440 pages.
Richter 1963
Richter R., Electrische Machinen, Synchronmaschinen und Einankerumformer. 3rd edition, Verlag Birkhäuser. Basel/Stuttgart. German. 692 pages.
Richter 1967
Richter R., Elektrische Maschinen, Erster Band: Allgemeine Berechnungselemente, Die Gleichstrommaschinen. Basel/Stuttgart, Verlag Birkhäuser. 691 pages.
Salo 2000 Salo J., Heikkilä T., Pyrhönen, J., Haring, T., New low-speed-torque permanent magnet synchronous machine with buried magnets, Pro-ceedings of the ICEM2000 Conference, Helsinki, Finland, 28-30 August 2000. vol 3. pp. 1246-1250.
Schwarz 1964
Schwarz K., K., Surwey of basic stray losses in squirrel-cage induction motors, Proc.IEE vol. 111, No. 9, pp. 1565 – 1574. 1964.
Senjyu 1998 Senjyu T., Omoda A., Uezato K., High efficiency control of syn-chronous reluctance motors using extended filter. Power Electronics Specialists Conference, 1998. PESC 98 Record. 29th Annual IEEE, vol. 2, pp. 1309–1314.
Sjöberg 1997 Sjöberg S., 1997, Motor developments and energy efficiency. Energy efficiency Improvements in electrical motors and drives, Springer.

131
International Conference EEMODS’ 95, pp. 102–112. Soong 1993 Soong W.L., Staton D.A., Miller T.J.E., Validation of lumped-circuit
and finite-element modelling of axially-laminated brushless motors, Sixth International Conference on Electrical Machines and Drives, 1993, pp. 85 –90.
Soong 1995
Soong W.L., Staton D.A., Miller T.J.E., 1993. Design of a new axi-ally-laminated interior permanent magnet motor. IEEE Transactions on Industry Applications, , vol. 31, Issue: 2 , Mar/Apr 1995, pp. 358 –367.
Soong 2000
W.L. Soong, N.E. Ertugrul, “Field-Weakening Performance of Inte-rior Permanent Magnet Motors,” IEEE Industry Applications Society Annual Meeting, Rome, 2000, vol. 1, pp. 416-423.
Staton 1993a Staton D.A., Miller T.J.E., Wood S.E., 1993. Maximising the sali-ency ratio of the synchronous reluctance motor. Electric Power Ap-plications, IEE Proceedings-Electric Power Applications, vol. 140, Issue: 4, July 1993 pp. 249–259.
Staton 1993b Staton D.A., Soong, W.L., Miller, T.J.E. 1993 Unified theory of torque production in switched reluctance and synchronous reluc-tance motors, Conference Record of the 1993 IEEE Industry Appli-cations Society Annual Meeting, pp. 185–193, vol. 1.
Steimer 1999 Steimer P.K., Steinke J.K., Gruning H.E., A reliable, interface-friendly medium voltage drive based on the robust IGCT and DTC technologies, Annual Meeting Conference Record of the 1999 IEEE Industry Applications, Thirty-Fourth IAS, vol. 3, pp. 1505 -1512
Surahammar 1998 Surahammar Bruk, Non-oriented fully processed electrical steel, SIR-Gruppen/VK-Tryck Sweden, 98-09.
Trübenbach 1993
Trubenbach R.A., Mackay A.T., Kamper M.J., Performance of a reluctance synchronous machine under vector control, 24th Annual IEEE Power Electronics Specialists Conference Re-cord, 1993. PESC '93, pp. 803 –808.
Vagati 1992 Vagati A., Franceschini G., Maragiu I., Troglia G.P., 1992. Design criteria of high performance synchronous reluctance motors. Con-ference Record of the 1992 IEEE Industry Applications Society An-nual Meeting, vol. 1, pp. 66–73.
Vagati 1996 Vagati A., Fratta A., Franceschini G., Rosso P.M., AC motors for high-performance drives: a design-based comparison, Conference Record of the 1995 IEEE Industry Applications, Thirtieth IAS An-nual Meeting, IAS '95, vol. 1, pp. 725 – 733.

132
Vagati 1999 Vagati A., Canova A., Chiampi M., Pastorelli M., Repetto M., Im-
provement of synchronous reluctance motor design through finite-element analysis. Conference Record of the 1999 IEEE Industry Ap-plications Conference, vol. 2, pp. 862–871.
Vagati 1999 Vagati A., Canova A., Chiampi M., Pastorelli M., Repetto M., Im-provement of synchronous reluctance motor design through finite-element analysis. Conference Record of the 1999 IEEE Industry Ap-plications Conference, vol. 2, pp. 862–871.
Vas 1996 Vas P., Drury W., Electrical machines and drives: present and future, MELECON '96, 8th Mediterranean Electrotechnical Conference, May 13-16 1996, Bari, Italy, Industrial applications in power sys-tems, computer science and telecommunications, vol. 1, pp. 67–74.
Vogt 1983 Vogt K., Elektrische Maschinen, Berechnung rotierender elektrischer Maschinen. Dritte bearbeitete Auflage, Berlin, Veb Verlag Technik, 1983, 500 p.
Vogt 1996 Vogt K., Berechnung elektrischer Maschinen, Weinheim : VCH, cop. 1996.
Xu 1991
Xu L, Xu X., Lipo T.A., Novothy D.W., Vector control of a synchronous reluctance motor including saturation and iron loss, IEEE Trans. Industry Applications, vol 27., no. 5, Sept 1991, pp. 977-987.
Zhao 1997 Zhao J., Kamper M.J., van der Merwe F.S., On-line control method to reduce mechanical vibration and torque ripple in reluctance syn-chronous machine drives, 23rd International Conference on Control and Instrumentation IECON 97, vol. 1, pp. 126–131.
Zhu 1993
Zhu J.G., Hui S.Y.R., Ramsden V.S., Discrete modelling of magnetic cores including hysteresis, eddy current and anomalous losses, Sci-ence, Measurement and Technology, IEE Proceedings A , vol. 140, Issue: 4 , Jul 1993, pp. 317 –322.
Zhu 1998 Zhu J.G., Ramsden V.S., Improved formulations for rotational core losses in rotating electrical machines, Transactions on Magnetics, IEEE, vol. 34 Issue: 4, Part: 2, July 1998, pp. 2234 –2242.

133
APPENDIX A Construction of the 30 kW induction motor
Table A1. Stator slot parameter. Constants Symbol Value Unit Slot opening x1 3.8 mm Slot width 2 x2 7.7 mm Slot width 3 x3 9.9 mm Slot height 1 y1 1.0 mm Slot height 2 y2 1.0 mm Slot height 3 y3 16.85 mm Slot height 4 y4 23.8 mm
y4
y1y2
x1
y3
x2
x3
Figure A1. Stator slot
Table A2. Data of the initial IM. Constants Symbol Value Unit Nominal power PN 30 kW Stator inner diameter D 215 mm Length l 205 mm Pole pair p 2 Air-gap diameter δm 0.8 mm Number of stator slots Qs 48 Number of wires / slot Nst 13 Number of rotor bars Qr 36 Steel quality DK 70 Stator outer diameter 323 mm Connection D Voltage UN 400 V
Table A3. Rotor bar parameter. Constants Symbol Value Bar width 1 x1 6.0 mm Bar width 2 x2 2.5 mm Bar width 3 x3 6.6 mm Bar width 4 x4 2.9 mm Bridge height 1 y1 0.7 mm Bar height 2 y2 5.7 mm Bar height 3 y3 8.0 mm Bar height 4 y4 3.05 mm Bar height 5 y5 21.2 mm Bar height 6 y6 1.45 mm
213.4
y1
y2
y3
y4
y5
y6
x4
x3
x2
x1
Figure A2. Rotor bar

134
APPENDIX B The designed rotor photo In Fig. B.1. the photo is shown of the rotor constructions of the optimum designed TLA-type 30 kW SynRM rotor.
Figure B.1. Skewed rotor with rotor lamination.

135
APPENDIX C THE MEASURING TABLE OF MOTOR 6 IEEE Std 112-1996Method B
Design SynRM Frame ST200M Powe 30 kW Phase 3Fequency 50 Volts 690 / 400 Synchronous r/min 1500
p 4k 225 (Al)k1 234.5 (Copper)k2 9.549 T (Nm)
Average Cold Stator Winding Resistance Between Terminals1 0.1614 Ohm2 Ambient Temperature, in °C 21
Rated Load Heat Run Stator Winding Resistance Between Terminals3 0.2063 Ohm4 Decrees C Temperature Rise Time rating 89.43 °C 5 Ambient Temperature, in °C 22
Load, in % of ratedItem Description 25 50 75 100
6 Ambient Temperature, in °C 22 22 22 22Rated Load Heat Run Stator Winding Resistanc 0.21 0.21 0.21 0.21
7 Stator Winding Temperature, in °C 89.4 89.4 89.4 89.48 Frequency, in Hz 50 50 50 509 Synchronous speed, in r/min 1500 1500 1500 150010 Slip speed, in r/min 0 0 0 011 Speed, in r/min 1500 1500 1500 150012 Line-to-Line Voltage*, in V 399.3293 400 402 40613 Line Current, in A * 20 29 48 5914 Stator Power, in W 9255 15377 25083 2972615 Core Loss, in W 690 690 690 69016 Stator I 2R Loss, in W 121 266 720 106417 Power Across Air Gap, in W 8444 14421 23673 2797218 Rotor I 2R Loss, in W 0 0 0 019 Friction and Windage Loss, in W 189 189 189 18920 Total Conventional Loss, in W 1000 1145 1599 194321 Torque, in Nm 54 91 149 17622 Dynamometer Correction -1 -1 -1 -123 Corrected Torque, in Nm 53.00 89.50 148.00 175.4024 Shaft Power, in W 8325 14059 23248 2755225 Apparent Total Loss, in W 930 1318 1835 217426 Stray-Load Loss, in W -70 237 231
Intercept -82.13Slope 0.011608Correlation Factor 0.95
27 Stator I 2R Loss, in W, at (t s) °C 122.07 268.36 726.59 107428 Corrected Power Across Air Gap, in W 8443.28 14418.98 23666.76 2796229 Correacted Slip, in r/min 0.00 0.00 0.00 030 Corrected Speed, in r/min 1500.00 1500.00 1500.00 150031 Roter I 2R Loss, in W, at (t s) °C 0.00 0.00 0.00 032 Corrected Stray-Load Loss, in W 32.61 92.98 254.27 35734 Corrected Shaft Power, in W 8221.56 14136.89 23223.38 2741635 Shaft Power, in hp 11.03 18.96 31.14 3736 Efficiency, in % 88.8 91.9 92.6 92.237 Power Factor, in % 0.68 0.76 0.75 0.72
t t = temperature of stator winding as determined from stator resistance or temperature detector during test.* calculations for wye connection
IEC34-2 Summation of losses
Load, in % of rated 25 50 75 100Power Factor, in % 67.7 75.8 74.6 72.1Efficiency, in % 90.0 91.4 92.7 92.7Speed, in r/min 1500 1500 1500 1500Line Current, in A 19.77 29.31 48.23 58.65


ACTA UNIVERSITATIS LAPPEENRANTAENSIS
109. PESONEN, MAUNO. Applying AHP and A´WOT to strategic planning and decision making: case studies in forestry and forest industry. 2001. U.s. Diss. 110. Proceedings of Fifth International Seminar on Horizontal Steam Generators. Ed. by Juhani Vihavainen. 2001. 255 s. 111. LAINE, PERTTI. Kohti vesiensuojelun aikaa: veden laadun muutokset eteläisellä Saimaalla. 2001. 264 s. Väitösk. 112. SILVENTOINEN, PERTTI. Electromagnetic compatibility and EMC-measurements in DC-voltage link converters. 2001. 115 s. Diss. 113. TERVONEN, ANTERO. Laadun kehittäminen suomalaisissa yrityksissä. 2001. 206 s. Väitösk. 114. SALMINEN, ANTTI. The effects of filler wire feed on the efficiency, parameters and tolerances of laser welding. 2001. 82 s., liitt. Diss. 115. HORTTANAINEN, MIKA. Propagation of the ignition front against airflow in packed beds of wood particles. 2001. U.s. Diss. 116. IKONEN, JOUNI. Improving distributed simulation in a workstation environment. 2001. U.s. Diss. 117. WU, HUAPENG. Analysis, design and control of a hydraulically driven parallel robot manipulator. 2001. U.s. Diss. 118. REUNANEN, ARTTU. Experimental and numerical analysis of different volutes in a centrifugal compressor. 2001. 150 s. Diss. 119. TAAVITSAINEN, VELI-MATTI. Strategies for combining soft and hard modelling in some physicochemical problems. 2001. U.s. Diss. 120. SAVOLAINEN, RAIJA. The use of branched ketene dimers in solving the deposit problems related to the internal sizing of uncoated fine paper. 2001. U.s. Diss. 121. SARAVIRTA, ALI. Project success through effective decisions: case studies on project goal
setting, success evaluation and managerial decision making. 2001. 286 s. Diss. 122. BLOMQVIST, KIRSIMARJA. Partnering in the dynamic environment: the role of trust in
asymmetric technology partnership formation. 2002. 296 s., liitt. Diss. 123. KARVONEN, VESA. Development of fiber recovery process. 2002. U.s. Diss. 124. KÄYHKÖ, JARI. The influence of process conditions on the deresination efficiency in mechanical pulp washing. 2002. 87 s., liitt. Diss. 125. SAVOLAINEN, PEKKA. Modeling of non-isothermal vapor membrane separation with thermodynamic models and generalized mass transfer equations. 2002. 179 s. Diss. 126. KÄRKKÄINEN, HANNU. Customer need assessment: Challenges and tools for product innovation in business-to-business organizations. 2002. U. s. Diss. 127. HÄMÄLÄINEN, MARKKU. Spray coating technique as a surface treatment for woodcontaining paper grades. 2002. 121 s. Diss. 128. RANTA, TAPIO. Logging residues from regeneration fellings for biofuel production – a GIS-
based availability and supply cost analysis. 2002. 182 s. Diss. 129. KUOSA, MAUNU. Numerical and experimental modelling of gas flow and heat transfer in the air gap of an electric machine. 2002. 97 s. Diss.

130. LAITINEN, NIINA. Development of a ceramic membrane filtration equipment and its applicability
for different wastewaters. 2002. U. s. Diss. 131. SUNDQVIST, SANNA. Market orientation in the international context: Antecedents, consequences and applicability. 2002. U. s. Diss. 132. TORKKELI, MARKO. Technology selection and group decision support systems: Case studies
on supporting strategic technology selection processes. 2002. U.s. Diss. 133. KYRKI, VILLE. Local and global feature extraction for invariant object recognition. 2002. 115 s.
Diss. 134. HEIKKILÄ, TANJA. Permanent magnet synchronous motor for industrial inverter applications –
analysis and design. 2002. 109 s. Diss. 135. HUTTUNEN, PENTTI. Data-parallel computation in parallel and distributed environments. 2002.
U.s. Diss. 136. LIU, YONG. On sliding mode control of hydraulic servo systems and a manipulator. 2002. U.s. Diss. 137. JUHANTILA, OLLI-PEKKA. Establishing intercompany relationships: Motives and methods for
successful collaborative engagement. 2002. 281 s. Diss. 138. PREIS, SERGEI. Practical applications of a systematic approach to the chemical abatement of
pollutants in water and air. 2002. 234 s. Diss. 139. TIIHONEN, JARI. Influence of stationary phase and eluent properties on chromatographic
separation of carbohydrates. 2002. U. s. Diss. 140. KILKKI, JUHA. Automated formulation of optimisation models for steel beam structures. 2002.
85 s., liitt. Diss. 141. LENSU, LASSE. Photoelectric properties of bacteriorhodopsin films for photosensing and information processing. 2002. 114 s. Diss. 142. KAURANNE, TUOMO. Introducing parallel computers into operational weather forecasting.
2002. U.s. Diss. 143. PUUMALAINEN, KAISU. Global diffusion of innovations in telecommunications: Effects of data aggregation and market environment. 2002. 153 s. Diss. 144. SARRETTE, CHRISTINE. Effect of noncondensable gases on circulation of primary coolant in nuclear power plants in abnormal situations. 2003. 114 s. Diss. 145. SAARENKETO, SAMI. Born globals – internationalization of small and medium-sized
knowledge-intensive firms. 2002. 247 s. Diss. 146. IKONEN, KIRSI. Metal surface and subsurface inspection using nondestructive optical methods.
2002. U.s. Diss. 148. KOUVO, PETRI. Formation and control of trace metal emissions in co-firing of biomass, peat,
and wastes in fluidised bed combustors. 2003. U.s. Diss. 149. MOOSAVI, ALI. Transport properties of multi-phase composite materials. 2003. U.s. Diss. 150. SMOLANDER, KARI. On the role of architecture in systems development. 2003. U.s. Diss. 151. VERENICH, SVETLANA. Wet oxidation of concentrated wastewaters: process combination and
reaction kinetic modeling. 2003. U.s. Diss.
152. STÅHLE, PIRJO, STÅHLE, STEN & PÖYHÖNEN, AINO. Analyzing dynamic intellectual capital: System-based theory and application. 2003. 191 s.