a comparative analysis of four methods for detecting
TRANSCRIPT

A COMPARATIVE ANALYSIS OF FOUR METHODS FOR DETECTING NITROGEN IN A HETEROGENEOUS SERPENTINE LANDSCAPE: THE
POTENTIAL INFLUENCE OF FIRE AND HABITAT
By
David Franklin
A Thesis
Presented to The Faculty of Humboldt State University
In Partial Fulfillment of the Requirements for the Degree
Master of Arts In Biological Sciences
May 2009

A COMPARATIVE ANALYSIS OF FOUR METHODS FOR DETECTING NITROGEN IN A HETEROGENEOUS SERPENTINE LANDSCAPE: THE
POTENTIAL INFLUENCE OF FIRE AND HABITAT
by
David Franklin Approved by the Master's Thesis Committee: Erik S. Jules, Major Professor Date
Michael R. Mesler, Committee Member Date
Frank J. Shaughnessy, Committee Member Date
Brian S. Arbogast, Committee Member Date
Michael R. Mesler, Graduate Coordinator Date
Chris Hopper, Interim Dean for Research and Graduate Studies Date

iii
ABSTRACT
A comparative analysis of four methods for detecting nitrogen in a heterogeneous serpentine landscape: the potential influence of fire and habitat
David Franklin
Ultramafic parent materials in northern California and southwestern Oregon
have given rise to one of the largest serpentine regions in the world. This area is
dominated by sparse, fire-prone coniferous forests and shrublands which are apparently
highly nutrient limited. Fire is the primary disturbance in these unique ecosystems, yet
little is known about how fire influences soil nutrient dynamics. I utilized the large,
~202,000 ha Biscuit Fire of 2002 to compare nitrogen levels in burned versus unburned
serpentine sites. A variety of methods are used to quantify nitrogen and nitrogen
transformations in the field. Methods comparisons, however, are generally compared in a
laboratory setting and rarely in the field. I compared three commonly used methods, plus
a novel approach, to assess the effect of fire on two different habitats within a nutrient-
poor serpentine landscape. I used soil sampling, ion exchange resin bags, and a hybrid
soil sampling/resin bag method to compare burned and unburned areas five years after
the fire. Nitrogen was quantified in both wetland and upland habitats, as these were
expected to be affected differently by fire. No effect of the fire was detected in wetland
habitats using any method, yet estimates of ambient levels of nitrogen varied among
methods. There was, however, a mixed signal in the upland areas; the ion exchange resin

iv
bags identified a significantly more nitrogen in unburned plots, while soil sampling
detected no such difference. Additionally, no difference in soil nitrogen was detected
between wetland and upland areas. My study demonstrates that conclusions about the
role of fire on nitrogen dynamics can be strongly influenced by the methods of nitrogen
detection used. Unlike comparisons carried out under controlled laboratory conditions,
my work does not establish whether one method is better than another, only that it is
possible to reach different conclusions depending which method one uses. Lastly, due to
a lack of pre-burn data, as well as the five year time lag between the fire and sampling,
and inconsistent estimates of soil nitrogen availability by various methods, my study does
not provide firm conclusions about how fire affects nitrogen in serpentine habitats. To
my knowledge, my study represents the first assessment of fire on soil nitrogen, as well
as the first comparison between wetlands and uplands in serpentine habitats of northern
California and Oregon. More research is needed to determine the effects of fire on soil
nitrogen, and refinements need to be made to methodologies for quantifying nitrogen in
these habitats. I discuss future research directions that could help elucidate the role of
fire on nitrogen dynamics on serpentine soils as well as possible avenues for refining the
methodologies for quantifying nitrogen.

v
DEDICATION
Dedicated to Edward S. Franklin

vi
ACKNOWLEDGEMENTS
I would like to thank my parents and family, without their love and support, I could not have done any of this. I would also like to thank my advisor, Dr. Erik Jules, for many things, most of all his patience.
I’d like to thank my committee, Dr. Michael Mesler, Dr. Frank Shaughnessy, and Dr. Brian Arbogast.
I’d also like to thank Dr. Jeffrey Abell, Lewis McCrigler, Anthony Baker, Marty Reed, Sheilah Lillie, John Bolling, Rosalind Litzky, George Meindl, Pakki Reath, Alison Young, Glenn Elliott, Sean Quillen, Kiera Freeman, Heather Perry, Jean-Paul Kennedy, Courtney Lockerby, Timothy Guida, Benjamin Crain, Dave Hoskins, Grant Eberle, Cheryl Satter, Allyson Carroll, Dr. William Bigg, Dr. Lisamarie Windham-Myers, Dr. David Orwig, Scott Harris, and Amber MacKenzie.
This study was made possible by funding from the Native Plant Society of Oregon and a Humboldt State University Masters Grant.

vii
TABLE OF CONTENTS
ABSTRACT ....................................................................................................................... iii
DEDICATION .................................................................................................................... v
ACKNOWLEDGEMENTS ............................................................................................... vi
TABLE OF CONTENTS .................................................................................................. vii
LIST OF TABLES ............................................................................................................. ix
LIST OF FIGURES ............................................................................................................. x
INTRODUCTION ............................................................................................................... 1
MATERIALS AND METHODS ...................................................................................... 10
Study System ......................................................................................................... 10
Nitrogen Quantification......................................................................................... 12
Study Design ......................................................................................................... 14
Laboratory Procedures .......................................................................................... 16
Nitrogen Analysis .................................................................................................. 17
Statistical Analyses ............................................................................................... 17
N availability ............................................................................................. 17
N transformations ...................................................................................... 19
RESULTS.......................................................................................................................... 23
Between Habitat N Availability ............................................................................ 23
Within Habitat N Availability ............................................................................... 23
Single Method Analysis ........................................................................................ 24
Nitrogen Transformations ..................................................................................... 25

viii
DISCUSSION ................................................................................................................... 31
The Effect of Fire on Soil N .................................................................................. 31
Differences in Soil N Among Serpentine Habitats ............................................... 35
Lysimeter Method ................................................................................................. 37
Conclusions and Recommendations...................................................................... 39
LITERATURE CITED ..................................................................................................... 41

ix
LIST OF TABLES
Table Page 1 Characteristics for serpentine sites where N was measured. A fen and upland
plot were used (except where noted) at each site. Latitude and longitude are given as decimal degrees. Size refers to fen size only. ...................................... 20
2 A three factor repeated measures ANCOVA run on both the soil core and the
IER bag method simultaneously (** indicates significance at 0.05). ................. 26 3 Results of two factor repeated measures ANCOVA for the lysimeter and
ISC/IERB methods (** indicates significance at 0.05). ...................................... 27 4 Univariate analyses for each nitrogen quantification method individually
analyzing the difference in N between burned and unburned fens. .................... 30

x
LIST OF FIGURES
Figure Page 1 Devices utilized to quantify N. At left is a resin bag. They are filled with
~10 g each of anion and cation ion exchange resin, and installed directly in the soils of both fens and uplands. To the right of it is a soil core, which was used to sample soil in fens and uplands. At the upland sites, an additional soil core was installed, and capped with a resin bag at the bottom (the ISC/IERB method). At the right is a PVC housing that was installed in the fens as a container for an IER bag (resin based lysimeter). ................................ 21
2 Map of the study area used to assess N in serpentine fen and upland sites.
Each symbol represents a fen-upland pair, where hollow symbols represent those sites that were burned in the 2002 Biscuit Fire, and solid symbols represent those that did not burn. ........................................................................ 22
3 Soil N availability as measured by soil cores and resin bags in fens
(Darlingtonia californica symbol) and uplands (Pinus jeffreyi symbol). Upper panels represent soil N quantified by the soil core method, lower panels represent soil N as quantified by IER bag method................................... 28
4 Soil N availability in fens and uplands varies by quantification method.
Upper panels represent fen habitats, and lower panels represent upland habitats. Letters denote statistical significance at 0.05 for post-hoc multiple comparison tests for 2 factor ANOVA comparing fire and method. .................. 29

1
INTRODUCTION
The term ‘serpentine’ is used to describe one of the world’s most unique soil
types, derived from ultramafic parent material generally made up of antigorite, chrysotile,
and lizardite (Borine 1983, Mills and Roath 1984). Soils derived from serpentine
bedrock tend to be high in heavy metals, characterized by a low nutrient content, and
have a low Ca2+/Mg2+ ratio (del Moral 1982, Turitzin 1982, Mansberg and Wentworth
1984). Vegetation on serpentine soils tends to be slow growing, of stunted appearance
compared to vegetation on non-serpentine soils, and xeromorphic (Whittaker 1954,
Proctor and Woodell 1975, Kruckeberg 1984). Macronutrient limitation (nitrogen and
phosphorus) is generally considered to play a stronger role in controlling vegetation on
these soils than the low Ca2+/Mg2+ ratio or toxic elements in the soil (nickel, chromium,
and cobalt; Proctor and Woodell 1975). Despite difficulties experienced by plants
growing in these soils, serpentine regions almost universally harbor high levels of
biological diversity and unique endemic species (Brooks 1987). For example, in
California, plants endemic to serpentines make up 10% of the state’s flora, even though
serpentine habitat occupies only 1.4% of the area in the state (Harrison et al. 2000, Wolf
2001).
Serpentine soils of northwestern California and southwestern Oregon harbor
many unique vegetation types that are wholly or partially restricted to serpentine soils
(Kruckeberg 1984). An example of one of these unique floristic components is

2
Darlingtonia californica (Sarraceniaceae), which grow in small, isolated, and perennially
wet areas that are botanically distinct from the surrounding upland matrix where D.
californica is absent (Whittaker 1960). The success of the insectivorous D. californica
suggests that these ecosystems are limited by N and/or P, as carnivory is generally
viewed as an adaptation to low soil nutrient levels that would be disadvantageous in more
fertile soils (Ellison et al. 2003, Ellison and Farnsworth 2005). Fertilization experiments
in nearby serpentine ecosystems support the hypothesis that these soils are N and/or P
limited (Turitzin 1982, Huenneke et al. 1990). There have been no documented
fertilization experiments in D. californica fens. Darlingtonia californica fens and the
nearby uplands represent an opportunity to study two systems that are subject to the same
macroenvironmental factors, yet are botanically distinct over distances of less than 10 m
(Whittaker 1960, Kruckeberg 1984).
The primary disturbance in the serpentine ecosystems of California and Oregon is
fire (Atzet and Martin 1991, Skinner 2003a, Skinner 2003b). Although little work has
been done on fire frequencies on serpentine, some evidence indicates that fire
differentially affects upland areas and fens (Skinner 2003a, Skinner 2003b, Cramer
2005). Before fire-suppression efforts, upland areas experienced a fire return interval
eight to 30 years (Skinner 2003a) or eight to 15 years (Taylor and Skinner 2003), whereas
fens experience fire every 18 to 42 years (Skinner 2003b). Given the large differences in
soil moisture and organic content, it is likely that fen and upland soil N availability would
be affected by fire in quite different ways. However, due to the dearth of studies in this
region, little is known about the effect of fire on soil N.
3
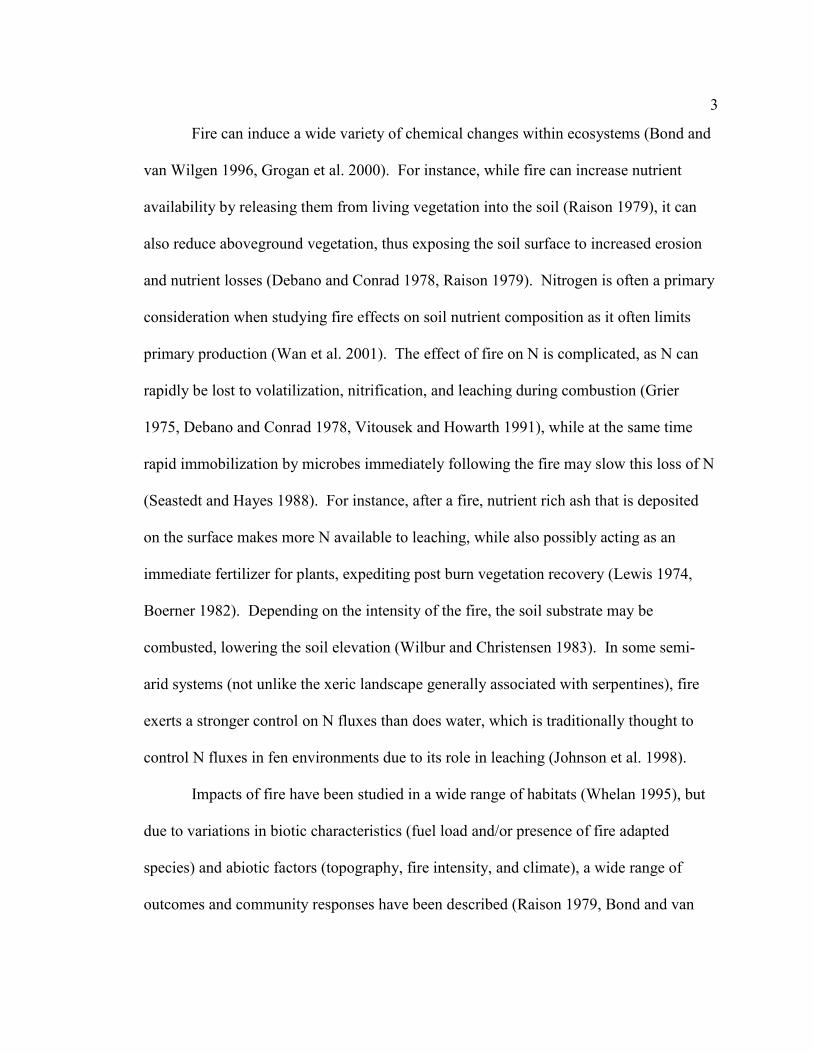
Fire can induce a wide variety of chemical changes within ecosystems (Bond and
van Wilgen 1996, Grogan et al. 2000). For instance, while fire can increase nutrient
availability by releasing them from living vegetation into the soil (Raison 1979), it can
also reduce aboveground vegetation, thus exposing the soil surface to increased erosion
and nutrient losses (Debano and Conrad 1978, Raison 1979). Nitrogen is often a primary
consideration when studying fire effects on soil nutrient composition as it often limits
primary production (Wan et al. 2001). The effect of fire on N is complicated, as N can
rapidly be lost to volatilization, nitrification, and leaching during combustion (Grier
1975, Debano and Conrad 1978, Vitousek and Howarth 1991), while at the same time
rapid immobilization by microbes immediately following the fire may slow this loss of N
(Seastedt and Hayes 1988). For instance, after a fire, nutrient rich ash that is deposited
on the surface makes more N available to leaching, while also possibly acting as an
immediate fertilizer for plants, expediting post burn vegetation recovery (Lewis 1974,
Boerner 1982). Depending on the intensity of the fire, the soil substrate may be
combusted, lowering the soil elevation (Wilbur and Christensen 1983). In some semi-
arid systems (not unlike the xeric landscape generally associated with serpentines), fire
exerts a stronger control on N fluxes than does water, which is traditionally thought to
control N fluxes in fen environments due to its role in leaching (Johnson et al. 1998).
Impacts of fire have been studied in a wide range of habitats (Whelan 1995), but
due to variations in biotic characteristics (fuel load and/or presence of fire adapted
species) and abiotic factors (topography, fire intensity, and climate), a wide range of
outcomes and community responses have been described (Raison 1979, Bond and van

4
Wilgen 1996). Thus, generalizations about the role of fire on soil nutrients are difficult to
make, and it is crucial to continue to quantify the effects of fire in many diverse
ecosystems (Grogan et al. 2000). Studies on the fire effects on serpentine plant
communities are rare, where the effects of fire on serpentine plant succession and
diversity have been described (McCoy et al. 1999, Safford and Harrison 2004), but fire
effects on soil N dynamics have not been addressed.
Nitrogen plays a key role in many biological processes and is a limiting nutrient
in many terrestrial ecosystems (Chapin III et al. 1986, Vitousek and Howarth 1991,
Vitousek and Field 1999), including most serpentine ecosystems (Proctor and Woodell
1975, Turitzin 1982, Huenneke et al. 1990). Due to the importance of N for ecosystem
productivity, understanding soil N has been an integral part of ecological science since
quantification methods were developed (Keeney 1980, Binkley and Hart 1989). Over the
past 50 years, there has been a proliferation of methods used to quantify soil N
availability and N transformations, such as mineralization, both in situ as well as in
laboratory settings. Methods used to assess soil N include, for example, tension
lysimeters, simple soil collection, and the application of synthetic resins (Keeney 1980,
Binkley and Hart 1989). Understandably, most studies of terrestrial ecosystems choose
only one method, which provides few opportunities to compare methods within a single
study. Comparisons of methods are generally restricted to summary articles, meta-
analyses, and laboratory studies; where in situ comparative experiments are rare (Keeney
1980, Binkley and Hart 1989). There are a few studies, however, that compare methods
directly to one another (for examples see Binkley and Matson 1983, Raison et al. 1987,

5
Hart and Firestone 1989, Knoepp and Swank 1995, and Brye and Slaton 2003, Johnson et
al. 2005), but results aren’t consistent across studies and further explorations and
comparisons are necessary, especially to expand the range of ecosystems explored.
Additionally, these studies are generally biased towards N-saturated agricultural systems
(Brye and Slaton 2003), or ecosystems where N is not considered to be a limiting factor
(Binkley et al. 1986, Raison et al. 1987, Adams et al. 1989, Binkley et al. 1992, Knoepp
and Swank 1995, Johnson et al. 2005).
While there are many ways to quantify N, the most direct method is by collecting
soil directly, extracting it with a strong salt either in the field or in the lab to mimic plant
uptake (Bremner 1965), and using an autoanalyzer to quantify N levels in the solution.
Soil cores are generally collected using a metal or plastic polyvinyl chloride (PVC) tube,
though PVC has become the preferred medium due to its low cost, chemical inertness
(galvanized metal is Zn coated which may inhibit soil N mineralization), and thermal
properties (Raison et al. 1987, Binkley and Hart 1989). A less labor intensive method
involves the use of synthetic ion exchange resins (IER). Ion exchange resins are
synthetically manufactured substances that have a highly adsorptive surface, large surface
area, and a strong negative or positive surface charge. Ion exchange resins placed in bags
in the soil adsorb ions from solution, which can be extracted later with a strong salt
solution (Binkley and Hart 1989). The latter is then assayed for ion content using an
autoanalyzer. Ion exchange resins have found a practical application in ecological
research for over 50 years (Amer et al. 1955, Sibbeson 1977, Qian and Schoenau 2002),
and provide a way to measure nutrient availability with minimal cost, labor, and soil

6
disturbance (Binkley and Hart 1989). Other methods, such as collecting
groundwater/porewater using lysimeters or soil sampling with soil cores are hampered by
short time intervals between successive collections, whereas resins can be left in the field
for up to a year (Susfalk and Johnson 2002). Additionally, ion exchange resins are more
sensitive to on site factors than other methods simply because they are left to absorb N
over a time period when site factors, like precipitation, may change. Furthermore, IER
bags may be more sensitive than soil sampling to differences in net N mineralization, ion
mobility, moisture regime, and competition for N (Binkley and Matson 1983, Hart and
Firestone 1988).
In addition to N availability, many researchers are interested in N transformations,
such as N mineralization and nitrification, and again, there are a variety of methods
available for both in situ and laboratory incubations. Laboratory incubations (either
aerobic or anaerobic), while good for gaining an idea of soil N transformation potential
under optimal conditions, tend to lack the relevance of in situ incubations where soils are
exposed to natural temperature fluctuations as well as (in some methods) natural moisture
regimes (Hart and Firestone 1989). Two of the most popular and widely applied methods
used to quantify N transformations are the buried bag method (i.e. placing soil in
polyethylene bags and incubating them in situ, Eno 1960) and isotopic pool dilutions
using 15N methods. The latter involve injecting labeled isotopes of N that naturally occur
at very low concentrations into the soil and tracking the ratio of 15N:native 14N as the 14N
is metabolized by microbes into other forms, thus increasing the relative percentage of
15N in the soil (Davidson et al. 1991). These two methods are widely considered to be

7
the most accurate for measuring gross N transformations over time. Both methods have
their drawbacks, as buried polyethylene bags isolate the soil from any moisture
variations, which may strongly influence N dynamics (Binkley and Hart 1989). Isotopic
(15N) methods can be expensive and require quantification of background levels in
various N pools, which can be difficult and time consuming (Högberg 1997). However,
there is a hybrid method of measuring N transformations, known as the in-situ-soil-
core/ion-exchange-resin-bag (ISC/IERB) method, which was developed by Di Stefano
and Gholz (1986) and refined by Brye et al. (2002b). After using a PVC tube to collect a
soil core, the intact PVC tube/soil core assembly is ‘capped’ at the bottom with a resin
bag and replaced into the hole in the ground the original soil core created, similar to the
buried bag method (Eno 1960). This setup allows the resin bag to trap any nutrients
leaching out of the soil core and allows the researcher to quantify nutrient
transformations within the PVC core, while maintaining ambient soil temperature and
moisture regimes. Additionally, since the IER bag is situated entirely within the PVC
core, it is protected from root penetration and local weather conditions that would cause
the bag to disintegrate (Susfalk and Johnson 2002). Net N mineralization is calculated as
the sum of ammonium nitrogen (NH4+-N) and nitrate nitrogen (NO3
--N) over time:
[(NO3--N + NH4
+-N)Final – (NO3--N + NH4
+-N)Initial] + (NO3--N + NH4
+-N)Resin =NMin
after Brye et al. (2003). Net nitrification is calculated the same way, omitting the NH4+-
N in each term.

8
A major challenge inherent in quantifying soil N by any method is that nutrients
are not evenly distributed throughout the soil profile (Binkley and Hart 1989).
Additionally, if a sampling regime is maintained for a long enough period of time, the
repeated samplings may disturb the substrate, and hence alter N cycling regimes and soil
N levels. I sought to design a method for deploying IER bags that would simultaneously
control for soil heterogeneity as well as minimize soil disturbance attributed to sampling.
I developed a method to use a PVC housing to act as a semi-permanent site installation
for an IER bag in areas with significant groundwater flows. This new method, termed a
resin-based lysimeter, can be repeatedly sampled without disturbing the soil profile,
except for the initial installation.
Ion exchange resins have been applied in a lysimeter format (a device for
collecting soil water, generally with the intent of testing the collected water for nutrient
concentrations) to sample soil solution twice before (Sakadevan et al. 1994, Susfalk and
Johnson 2002). One study used a highly invasive (significant perturbation of the soil
profile) lysimeter setup (Sakadevan et al. 1994), whereas the other was used to quantify
solution N in snowmelt (Susfalk and Johnson 2002). This is the first time a resin-based
lysimeter (hereafter lysimeter) has been implemented to sample soil solution N in
wetlands.
I took advantage of a large natural fire that burned on serpentine soils in
California and Oregon in 2002 to assess the effect, if any, the fire had on soil N
availability and transformations in both xeric upland and mesic fen habitats. Despite
sampling five years after the fire (2007), I had reason to believe that any differences

9
between burned and unburned sites would still be evident, as N cycling can take longer
than four years to recover following some fires (Christensen and Muller 1975, Binkley et
al. 1992, Monleon et al. 1997, Brye et al. 2002a, Knoepp et al. 2004, Sherman et al.
2005). My work addressed two primary questions. First, does N availability in
serpentine habitats vary between habitat types (fen vs. upland) and burned and unburned
sites? Second, how do different methods (Figure 1) of quantifying N influence the
detection of variation in N? In other words, would different conclusions be made about
the effect of fire and habitat on N availability if only one method had been used?

10
MATERIALS AND METHODS
Study System
My study was conducted in the Siskiyou Mountains of northern California and
southwestern Oregon during the summer of 2007 (Figure 2). The climate of this area is
Mediterranean, with cool winters (mean January minimum temperature = 0° C) and warm
dry summers (mean July maximum temperature = 31.7° C; mean annual precipitation =
154 cm, with only 4 cm falling between June and August). Soils in southwestern Oregon
are in the Pearsoll Series (clayey-skeletal, magnesic, mesic Lithic Dystroxerepts),
Eightlar Series (clayey-skeletal, magnesic, mesic Typic Dystroxerepts), or Dubakella
Series (clayey-skeletal, magnesic, mesic Mollic Haploxeralfs; Borine 1983) whereas soils
in northern California are in the Walnett Series (loamy-skeletal, parasesquic, mesic Ultic
Haploxeralfs) or Jayell Series (fine, parasesquic, mesic Typic Dystroxerepts; Mills and
Roath 1984). All soils in the study area are rocky, well drained, and no deeper than 155
cm (but generally closer to 81 cm deep) (Borine 1983, Mills and Roath 1984). Upland
habitats within the study area are characterized by a sparse tree layer of Pinus jeffreyi,
Pinus attenuata, and to a lesser extent Pseudotsuga menziesii. A well-developed shrub
layer is dominated by Arctostaphylos spp., Quercus vaccinifolia, Lithocarpus densiflorus
var. echinoides, and Rhamnus californica. There is also a diverse layer of ephemeral
spring forbs and graminoids that senesce by mid-summer (Whittaker 1960). While the
term ‘fen’ may not be accurate as a technical term for these wetlands (not all of them
exhibited the significant organic soil development that are a trademark of fens), the term

12
has been used historically to describe wetland areas in northern California and
southwestern Oregon where D. californica grows (Whittaker 1960), and I will use this
convention from hereon. The fens are characterized by a highly diverse assemblage of
forbs and graminoids in addition to D. californica that are distinct from the upland
habitats (Whittaker 1954, Whittaker 1960, Frost and Jules 2007) and a water table that is
at or within a few centimeters of the surface (D. Franklin pers. obs.). Overstory
vegetation in the fens is sparse and generally limited to marginal areas, however there are
occasional Chamaecyparis lawsoniana growing directly in the fens (Cramer 2005, Frost
and Jules 2007).
A large forest fire burned approximately 202,000 ha of the Siskiyou Mountains of
northern California and southwestern Oregon (the Biscuit Fire; USDA Forest Service and
BLM 2004) from July to September 2002. Much of this area is underlain by serpentine
parent material. The distribution of serpentine outcrops, due to generally shallow
bedrock, had a profound effect on the fire, resulting in a very heterogeneous pattern of
burning, where some areas burned much more intensely than others (Thompson et al.
2007).
Nitrogen Quantification
Soil N levels were quantified four different ways. Ion exchange resin bags were
constructed out of nylon stockings and fishing line with 10 grams each of REXYN™
Amberlite IRA 402 Anion Resin and REXYN™ Amberlite IRA 200 Cation Resin (Alfa
Aesar, Ward Hill, MA, USA; Figure 1). Any ions already on resins were removed by

13
soaking them in 2N KCl for at least 24 hours prior to deployment, then rinsing with
distilled deionized water. These were buried in the soil to a depth of 10-15 cm,
depending on substrate availability. Additionally, soil samples were collected using PVC
cores. These cores are 5.2 cm by 30 cm, beveled at one end to minimize soil compaction
on installation (after Brye and Slaton 2003, Figure 1), and they were driven into the soil
with a rubber mallet to a depth of 22 cm. The PVC core and soil were then removed, and
the soil inside the core was collected into sterile Whirl-Pak ™ bags (Nasco, Fort
Atkinson, WI, USA).
The third method for quantifying soil N is the ISC/IERB method (see
Introduction), which was used to gain an understanding of N transformations. Soils were
collected following the same method as the soil cores, however, a soil core capped with a
resin bag was left to incubate at the sites between sampling dates. Finally, PVC housings
(resin based lysimeters; Figure 1) were buried in the soil to act as permanent housings for
IER bags. These were 10 cm by 35.5 cm with 5-7 cm slits in the side and bottom to
allow water flow over an IER bag placed in the bottom of the chamber and were buried to
a depth of 42 cm, unless the soil substrate was too shallow or rocky, in which case they
were buried to a depth of 35 cm. Side slits were never exposed above the soil surface at
either depth. The housings were capped with a PVC screw top to prevent atmospheric
deposition of N as well as any other possible contamination. In summary, the four
methods used were buried IER bags, PVC soil core, the ISC/IERB method, and resin
based lysimeters (PVC housings with an IER bag inside (Figure 1).
14
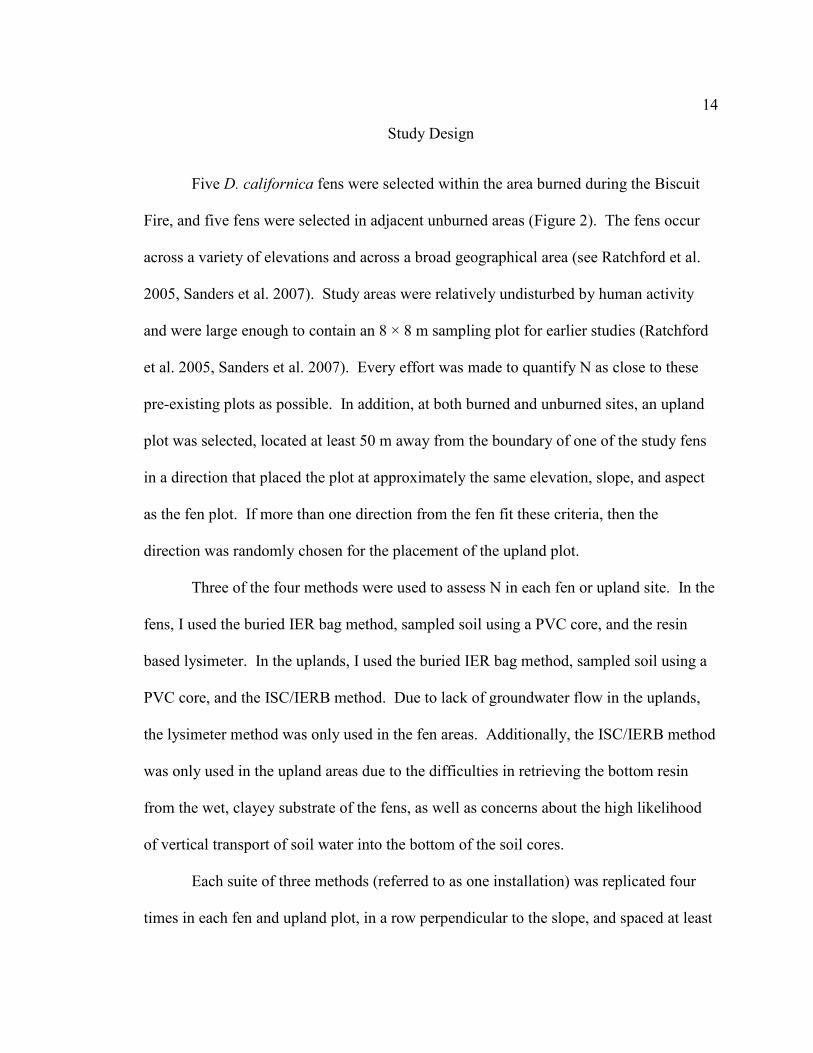
Study Design
Five D. californica fens were selected within the area burned during the Biscuit
Fire, and five fens were selected in adjacent unburned areas (Figure 2). The fens occur
across a variety of elevations and across a broad geographical area (see Ratchford et al.
2005, Sanders et al. 2007). Study areas were relatively undisturbed by human activity
and were large enough to contain an 8 × 8 m sampling plot for earlier studies (Ratchford
et al. 2005, Sanders et al. 2007). Every effort was made to quantify N as close to these
pre-existing plots as possible. In addition, at both burned and unburned sites, an upland
plot was selected, located at least 50 m away from the boundary of one of the study fens
in a direction that placed the plot at approximately the same elevation, slope, and aspect
as the fen plot. If more than one direction from the fen fit these criteria, then the
direction was randomly chosen for the placement of the upland plot.
Three of the four methods were used to assess N in each fen or upland site. In the
fens, I used the buried IER bag method, sampled soil using a PVC core, and the resin
based lysimeter. In the uplands, I used the buried IER bag method, sampled soil using a
PVC core, and the ISC/IERB method. Due to lack of groundwater flow in the uplands,
the lysimeter method was only used in the fen areas. Additionally, the ISC/IERB method
was only used in the upland areas due to the difficulties in retrieving the bottom resin
from the wet, clayey substrate of the fens, as well as concerns about the high likelihood
of vertical transport of soil water into the bottom of the soil cores.
Each suite of three methods (referred to as one installation) was replicated four
times in each fen and upland plot, in a row perpendicular to the slope, and spaced at least

15
6 m from each neighbor in order to encompass as much site variability as possible as well
as to prevent sampling the same groundwater as it percolates downslope. In one case, the
fen was smaller than the required 18 m, so installations were spaced approximately 4 m
apart. Following initial installation, sites were visited three times during the summer of
2007, every four weeks. Because of the difficulty in accessing remote sites, and in
processing large volumes of samples, the number of sites studied was small (n=10 for
fens and n=10 for uplands, where five of each were burned), and I have taken a
conservative approach to interpreting my data.
Researchers wore latex gloves whenever handling samples in both the field and
the laboratory to prevent contamination. Since there were no easily discernable soil
horizons present, all soils inside the core were collected and homogenized. All collected
soils and resins were kept cold (~5°C) until they could be processed, generally 72 hours
at most.
From August to September 2006, installations were placed in seven (out of an
eventual total of ten) fen-upland pairs. Four fens-upland pairs were in California in the
Smith River National Recreation Area, and three were in the vicinity of Cave Junction,
Oregon (Figure 2. Due to time constraints, the remaining three fen-upland pairs were
installed in late April-early May 2007 in conjunction with the commencement of
sampling, and were located in the Cave Junction area.

16
Laboratory Procedures
In the laboratory, all containers and filters were acid washed with 2 N HCl and
rinsed three times with DI in order to remove any trace nutrients that may have
contaminated samples. All soils from cores and the ISC/IERB methods were sieved to 5
mm to remove large rocks, plant roots, and any other biological debris as well as to
homogenize the sample. A subsample of approximately 20 g was removed from the total
sample for measurement of gravimetric water content. All soils were dried in aluminum
tins for 36 hours at 60-75 °C, and then reweighed after cooling. A second subsample of
approximate 20 g of field wet soil was added to 100 ml of 2 N KCl, shaken vigorously,
then statically incubated for 48 hours. Samples were then filtered by vacuum filtration
(BD Falcon Filters, Franklin Lakes, NJ, USA with Whatman GF/F 7 µm glass fiber
filters, Fisher Scientific, Pittsburgh, PA, USA), and the filtrate collected for analysis.
All collected IER bags that were either buried directly in the soil, from inside the
lysimeters, or from the bottom of the ISC/IERB core were dried in aluminum tins at 60-
75 °C for 36 hours, weighed, added to 100 ml of 2 N KCl, shaken vigorously, and
statically incubated for 48 hours. The IER bags were then removed from solution, and
the solute collected and stored for future analysis. Some IER bags broke, either over the
course of incubation due to a variety of site factors (i.e. shearing on a rock during
installation or puncturing by an actively growing plant root), or were damaged in the
process of collecting them. When this occurred, every attempt was made in both the field
and laboratory to retrieve as much resin as possible from broken IER bags. In the case of

17
broken bags, the resin-KCl mixture was vacuum filtered according to the same protocol
as the soils, and the resins discarded. Intact IER bags were thoroughly rinsed in distilled
deionized water, then re-immersed in 2N KCl for at least 24 hours prior to redeployment
in the field.
Nitrogen Analysis
All samples were analyzed on a segmented flow autoanalyzer (Bran+Luebbe
AA3, Norderstedt, Germany) for NH4+ (berthelot reaction, method G-175-96 Rev 12),
NO3-+NO2
- (cadmium reduction followed by azo dye formation, method G-172-96 Rev
10), and NO2- (azo dye formation, method G-173-96 Rev 8). NO3
- and NO2- peak
absorbance was measured at 550 nm, and NH4+ peak absorbance was measured at 660
nm. Samples were run with a 2N KCl buffer to match the filtrate concentrations. NO3-
content was determined by subtracting NO2- from NO3
-+NO2- measurements.
Statistical Analyses
N availability
Throughout my analyses, all tests will be run for NH4+-N and NO3
--N separately,
as these represent two different pools of plant available N present in the soil. Thus, each
individual statistical test was run twice, once for NH4+-N and once for NO3
--N. Since
samples were collected through the growing season, I first used repeated measures
ANCOVA to assess what role sample collection date had on soil N availability. Because
the soil core method and the buried IER bag method were replicated in each habitat, I

18
assessed N measures derived from these methods simultaneously. In these ANCOVAs,
the main factors were habitat type (fen vs. upland), fire treatment (burned vs. unburned)
and method (buried IER bag vs. soil core). Covariates included were elevation and
distance to the coast (Table 1). Both elevation and distance to the coast are suspected to
play a significant role in governing fire intensity, and distance to coast is known to have a
strong influence on vegetation (Frost et al. 2004). Additionally, fens were not evenly
distributed along a longitudinal gradient (mean distance to coastburned = 29.7 km, mean
distance to coastunburned = 36.8 km, Figure 2). I also ran two-factor repeated measures
ANCOVAs for the other two methods (lysimeter and ISC/IERB) separately, omitting
habitat as a main factor. Each method was analyzed twice, once for NH4+-N, and once
for NO3--N. Covariates remained the same in these later tests.
Because date of sampling did not influence either NH4+-N or NO3
--N, the data
were averaged over the growing season to produce one measure per site for each method.
Next, for the soil core method and buried IER bag method, a three factor ANCOVA was
used to assess the effect habitat, burn history, and method had on NH4+-N and NO3
--N
availability. I then used a two factor ANCOVA to assess the effect of sample method
and fire on NH4+-N and NO3
--N in each habitat separately. Covariates used in the
ANCOVAs were the same as in the repeated measures analysis, however, the size of the
fen was included as a covariate for fen analyses. Pairwise comparisons were made with
Fishers least significant difference multiple comparison post-hoc test.
In order to determine how using a single method of N quantification would affect
interpretation of fire effects in this ecosystem, a series of one factor ANOVAs were used
19
to assess differences in both NH4+-N and NO3
--N in burned and unburned plots. One test
was run for each method in each habitat.
N transformations
I used a one way ANCOVA to assess the effect of fire on N mineralization and
nitrification. Elevation, distance to coast, and soil moisture were used as covariates. Soil
moisture was included as a covariate due to its strong role in controlling N
transformations (Binkley and Hart 1989). All statistical tests were conducted using
Number Cruncher Statistical Systems 2004 (Hintz 2004), except for the repeated
measures ANCOVA, which was conducted using SPSS (SPSS 2008). All data met the
parametric assumptions for ANOVA tests. Additionally, results for interaction terms and
covariates that were not significant at at least 0.1 are not reported.

20
Site name Burn Status Latitude (dd) Longitude (dd) Elevation (m) Distance to coast (km) Size (m2)
Cedar Root Burned 41.979 -123.951 434.8 21.092 250
Dragonfly Unburned 41.896 -124.002 512.5 16.979 950
Greg's Burned 41.977 -123.949 524.9 21.293 500
L.E. Horton Burned 41.937 -124.005 489.7 16.523 800
Lone Mountain Unburned 42.051 -123.745 494.7 45.411 1500
Maureen's (Wetland only) Unburned 42.240 -123.675 409.5 36.109 200
New (Upland only) Unburned 42.023 -123.773 550.5 23.258 200
South Side Unburned 42.233 -123.659 423.5 60.550 1500
Upper Days Gulch 1 Burned 42.229 -123.713 474.6 55.478 900
Upper Days Gulch 2 Burned 42.227 -123.713 473.2 34.131 900
Whiskey Creek Unburned 42.023 -123.773 524.6 38.573 875
Table 1: Characteristics for serpentine sites where N was measured. A fen and upland plot were used (except where noted) at each site. Latitude and longitude are given as decimal degrees. Size refers to fen size only.

21
Figure 1: Devices utilized to quantify N. At left is a resin bag. They are filled with ~10 g each of anion and cation ion exchange resin, and installed directly in the soils of both fens and uplands. To the right of it is a soil core, which was used to sample soil in fens and uplands. At the upland sites, an additional soil core was installed, and capped with a resin bag at the bottom (the ISC/IERB method). At the right is a PVC housing that was installed in the fens as a container for an IER bag (resin based lysimeter).

22
Figure 2: Map of the study area used to assess N in serpentine fen and upland sites. Each symbol represents a fen-upland pair, where hollow symbols represent those sites that were burned in the 2002 Biscuit Fire, and solid symbols represent those that did not burn.

23
RESULTS
Between Habitat N Availability
There was no effect of sample date on NH4+-N or NO3
--N, as detected by any
method (Tables 2 and 3), thus all subsequent results are for values for each site, averaged
across sampling date for each form of N. After averaging across sample date, habitat
type also had no effect on soil N availability (NH4+-N: F1,40=0.004, p=0.952; NO3
--N:
F1,40=0.07, p=0.800; Figure 3). However, the buried IER bags detected significantly
more NO3--N than the soil core method (F1,40=5.75, p=0.023) across both habitats; buried
IER bags detected 62% more NO3--N than soil cores.
Within Habitat N Availability
In order in include methods that were not replicated in each habitat, the following
analyses deal with fen and upland habitats separately. In the fens, there was no
significant difference in NH4+-N between burned and unburned sites (F1,29=0.26,
p=0.613) or between methods of measuring N (F2,29=0.61, p=0.553; Figure 4). The
buried IER bag detected 47% more NO3--N than the soil core, however neither method
differed significantly from the lysimeter method (F2,30=4.41, p=0.025, Fisher’s LSD
significant at 0.05, Figure 4). There was no detectable difference in NO3--N between
burned and unburned sites (F1,30=0.08, p=0.779). One of the covariates, the size of the
fen, had a significant relationship with NO3--N (F1,30=5.53, p=0.029).

24
In the uplands, there was significantly less NH4+-N in the burned sites (F1,30=5.93,
p=0.023, Figure 4), where burned sites had 70% less NH4+-N, but the three methods did
not vary in the amounts of NH4+-N they detected (F2,30=0.04, p=0.965). There was no
significant difference between burned or unburned sites, or between any of the three
methods in terms of NO3--N in the upland areas (Fire F1,30=1.18, p=0.289; Method
F2,30=0.63, p=0.543, Figure 4). A marginally significant interaction between fire and
method was detected for NO3--N (F2,30=2.58, p=0.098). Additionally, one covariate,
distance to the coast, had a strong relationship with NO3--N (F1,30=9.10, p=0.006) in the
upland areas.
Single Method Analysis
The difference in NH4+-N detected between burned and unburned plots by the
buried IER bag method was the main reason that I found a significant difference between
burned and unburned plots in the upland areas, as well as the significant interaction terms
for upland NO3--N. In the upland plots, the buried IER bag method detected significantly
more NH4+-N (F1,10=6.27, p=0.0367, Table 4) and NO3
--N (F1,10=8.6, p=0.019, Table 4)
in the unburned areas. There was 54% less NH4+-N and 81% less NO3
--N in the burned
areas. No other single method detected any difference between burned and unburned
plots (Table 4).

25
Nitrogen Transformations
There was no difference between burned and unburned plots in terms of N
mineralization (F1,10=0.49, p=0.515) or nitrification (F1,10=2.43, p=0.180). The overall
rate of net N mineralization was very low in both habitats\; there was 0.003 mg g-1
month-1 mineralized in the burned areas, and -0.005 mg g-1 month-1 in the unburned areas
(the negative value representing N sequestration). However, both of these values are less
than the standard error (0.007). There was 0.003 mg g-1 month-1 of nitrification in the
burned areas, and 0.001 mg g-1 month-1 in the unburned areas (standard error = 0.001).

26
Source df SS F P
Ammonium (NH4+-N)Time 2 9.18 x 10⁻⁵ 0.282 0.755Elevation 1 1.21 x 10⁻⁴ 0.701 0.410Distance 1 1.78 x 10⁻⁴ 1.036 0.318Habitat 1 1.41 x 10⁻⁶ 0.008 0.929Method 1 1.88 x 10⁻⁷ 0.001 0.974Fire 1 9.08 x 10⁻⁴ 5.269 0.030**Habitat X Method 1 2.42 x 10⁻⁵ 0.140 0.711Habitat X Fire 1 2.77 x 10⁻⁴ 1.610 0.216Method X Fire 1 1.27 x 10⁻⁴ 0.739 0.398Habitat X Method X Fire 1 9.50 x 10⁻⁶ 0.055 0.816Error 26 4.48 x 10⁻³
Nitrate (NO3--N)Time 2 3.59 x 10⁻⁵ 0.178 0.838Elevation 1 3.83 x 10⁻⁵ 0.174 0.680Distance 1 1.06 x 10⁻⁵ 0.048 0.828Habitat 1 2.06 x 10⁻⁴ 0.934 0.343Method 1 1.58 x 10⁻³ 7.165 0.013**Fire 1 5.29 x 10⁻⁵ 0.240 0.628Habitat X Method 1 1.26 x 10⁻⁵ 0.057 0.813Habitat X Fire 1 1.17 x 10⁻⁵ 0.053 0.820Method X Fire 1 4.11 x 10⁻⁵ 0.186 0.669Habitat X Method X Fire 1 2.31 x 10⁻⁵ 0.105 0.749Error 26 5.73 x 10⁻³
Table 2: A three factor repeated measures ANCOVA run on both the soil core and the IER bag method simultaneously (** indicates significance at 0.05).

27
Source df SS F P
Lysimeter Ammonium (NH4+-N)
Time 2 2.90 x 10⁻⁴ 0.454 0.650Elevation 1 2.14 x 10⁻⁴ 0.401 0.561Distance 1 7.22 x 10⁻⁵ 0.135 0.732Size 1 2.97 x 10⁻⁵ 0.056 0.825Fire 1 2.29 x 10⁻⁴ 0.429 0.548Error 4 2.14 x 10⁻³
Lysimeter Nitrate (NO3--N)
Time 2 7.20 x 10⁻⁵ 0.218 0.808Elevation 1 2.83 x 10⁻⁵ 0.215 0.667Distance 1 1.41 x 10⁻⁵ 0.107 0.760Size 1 4.20 x 10⁻⁴ 3.185 0.149Fire 1 2.01 x 10⁻⁵ 0.153 0.716Error 4 5.27 x 10⁻⁴
ISC/IERB Ammonium (NH4+-N)
Time 2 4.85 x 10⁻⁴ 2.179 0.164Elevation 1 1.17 x 10⁻⁵ 0.133 0.730Distance 1 6.59 x 10⁻⁵ 0.749 0.426Fire 1 1.84 x 10⁻⁴ 2.091 0.208Error 5 4.40 x 10⁻⁴
ISC/IERB Nitrate (NO3--N)
Time 2 3.41 x 10⁻⁴ 2.311 0.150Elevation 1 5.59 x 10⁻⁵ 1.093 0.344Distance 1 6.51 x 10⁻⁴ 12.745 0.016**Fire 1 1.51 x 10⁻⁴ 2.957 0.146Error 5 2.56 x 10⁻⁴
Table 3: Results of two factor repeated measures ANCOVA for the lysimeter and ISC/IERB methods (** indicates significance at 0.05).

28
0.000
0.010
0.020
0.030Burned Unburned
0.000
0.005
0.010
0.015
0.000
0.010
0.020
0.030
0.000
0.005
0.010
0.015
0.020
Ammon
ium (N
H 4+-N) m
g-g N
itrate (NO 3 --N
) mg-g
Figure 3: Soil N availability as measured by soil cores and resin bags in fens (Darlingtonia californica symbol) and uplands (Pinus jeffreyi symbol). Upper panels represent soil N quantified by the soil core method, lower panels represent soil N as quantified by IER bag method.

29
Figure 4: Soil N availability in fens and uplands varies by quantification method. Upper panels represent fen habitats, and lower panels represent upland habitats. Letters denote statistical significance at 0.05 for post-hoc multiple comparison tests for 2 factor ANOVA comparing fire and method.
Ammon
ium (N
H 4+-N) m
g-g N
itrate (NO 3 --N
) mg-g
0.000
0.010
0.020
0.030
IER Bag Soil Core Lysimeter
Burned Unburned
IER Bag Soil Core ISC/IERB0.000
0.002
0.004
0.000
0.010
0.020
IER Bag Soil Core ISC/IERB
IER Bag Soil Core Lysimeter0.000
0.002
0.004
a,b b
a

30
Source df SS F P
Fen Ammonium (NH4+-N)
IER Bag 1 5.25 x 10⁻⁵ 0.430 0.532Soil Core 1 8.15 x 10⁻⁶ 1.310 0.286Lysimeter 1 8.15 x 10⁻⁶ 0.070 0.792
Fen Nitrate (NO3--N)
IER Bag 1 1.93 x 10⁻⁵ 0.220 0.649Soil Core 1 1.19 x 10⁻⁶ 0.110 0.745Lysimeter 1 3.88 x 10⁻⁸ 0.000 0.954
Upland Ammonium (NH4+-N)
IER Bag 1 2.44 x 10⁻⁴ 8.600 0.019**Soil Core 1 3.40 x 10⁻⁵ 1.040 0.337ISC/IERB 1 3.38 x 10⁻⁵ 0.920 0.366
Upland Nitrate (NO3--N)
IER Bag 1 1.26 x 10⁻⁴ 6.270 0.037**Soil Core 1 1.37 x 10⁻⁵ 0.550 0.481ISC/IERB 1 3.06 x 10⁻⁶ 0.080 0.778
Table 4: Univariate analyses for each nitrogen quantification method individually analyzing the difference in N between burned and unburned fens.

31
DISCUSSION
The Effect of Fire on Soil N
Did the large Biscuit Fire event of 2002 alter N dynamics in serpentine habitats of
northern California and southern Oregon? Perhaps the most important result of my work
is that the answer to this question depends on the method of measuring N. My analyses
detected an effect of fire in the upland sites and not in the fens. However, this effect was
limited to the buried IER bag method. In fact, after removing this method from my
analyses, there was no detectable effect of fire in either habitat of any form of N I
measured, by any quantification method. One caveat is that two of the different methods,
buried IER bag and soil sampling, measure slightly different pools of available soil N.
The soil core acts as a ‘snapshot’ of what is available at the moment it is collected, where
the buried IER bag gives a slightly longer term picture over the course of the incubation
and may overrepresent labile N pools (Binkley and Hart 1989). Nevertheless, any
difference between burned and unburned sites should have been detected by both
methods, as generally when these two methods are deployed in concert, they report
similar results (e.g. Hart and Firestone 1989, Johnson et al. 2005, Turner et al. 2007).
An alternate explanation for the difference between burned and unburned sites
detected by the IER bags is that they may have been picking up on other, more subtle,
non-fire related N fluctuations. Ion exchange resin bags are thought to be more sensitive
to differences in on-site factors (Binkley and Matson 1983), and may have been
influenced by some other site characteristic, such as a longitudinal gradient, rather than

32
any legacy effect of the Biscuit Fire. IER bags adsorb more ions from solution as soil
moisture increases (Wyland and Jackson 1993). As one moves away from the coast,
elevation and rainfall generally decrease. The majority of the unburned sites are located
east of the burned sites, so the burned sites may have experienced higher leaching during
the spring rains, lowering soil N prior to sampling. Thus, when I sampled during
summer, I may have been detecting labile N still present in unburned sites that would
have been leached out of the more coastal burned sites earlier in the season prior to
sampling.
While it is difficult to make firm conclusions about whether there are still
measurable differences in soil N between burned and unburned sites five years after the
Biscuit Fire, one thing is clear: if I had just sampled soils (as is common in many studies;
see Richter et al. 1982, Matson et al. 1987, Tilman and Wedin 1991, Morghan and
Seastedt 1999, Suding et al. 2004 for examples), I would likely have concluded that there
was no detectable difference between burned and unburned sites. Additionally, I would
have concluded that burned sites had returned to N dynamics similar to the unburned sites
in the five years since the fire. Studies that utilize solely the IER method are much less
common (see Miller et al. 2006), but if I had used only IER bags, I would have come to a
very different conclustion. I would speculate that N dynamics in the fens had either
completely recovered or were only marginally affected by the fire, and that the uplands
had likely not recovered. Hypothesizing that there might be a detectable difference in
soil N availability between burned and unburned sites, this conclusion would have fit
nicely with common sense about the fens. Due to a lack of combustible materials and the

33
presence of cool, running water, the fens may not have experienced any appreciable loss
or release of N due to fire. Because the fire did not alter fen hydrology (Cramer 2005),
the perennially running water may have flushed out any additional nutrients that were not
immediately immobilized by microbial action and rapidly growing ephemeral forb and
graminoid species.
If the Biscuit Fire altered soil N in the upland areas, it was likely driven by the
dramatic loss of aboveground organic materials (i.e. overstory vegetation, duff, and
downed wood; USDA Forest Service and BLM 2004) and the increase in erosion that
would follow (Grier 1975, Debano and Conrad 1978, Vitousek and Howarth 1991). The
radical alteration of soil physical properties that generally occurs following fire (McNabb
and Cromack 1990), coupled with increased erosion with the onset of fall rains (generally
between 121 and 200 cm of rain falls in the non-summer months; Borine 1983, Mills and
Roath 1984), would drastically alter soil biological processes (Raison 1979). The
destruction of the overstory essentially halted any N sequestration by vegetation, meaning
there was little plant uptake of the recently increased soil inorganic N pools that result
due to rapid microbial action following fire (Raison 19979). Additionally, there may
have been a loss of any mycorrhizal associations (Amaranthus and Trappe 1993) and
damage to the seed bank (Turner et al. 1994). These changes in the biological
characteristics of the soil, in addition to the general infertility and toxicity inherent in
serpentine soils, likely prevented rapid post fire recovery by vegetation which would, in
turn, lead to decreased overall soil N availability in comparison to unburned upland
habitats.

34
Had I solely utilized soil core sampling to estimate soil N, I would likely have
concluded that there was no difference in N availability between the burned and
unburned sites. The most likely explanation is that these systems have recovered in the
five years since the fire. The soil profile is generally shallow and well drained, meaning
that water (and any labile N dissolved in it) would move relatively easily through and out
of the system. My study areas experience relatively high rainfall in the winter, thus five
seasons of flushing could have restored the soil N dynamics in the burned areas to
resemble the unburned areas. Additionally, due to the low ambient soil N, any increase
in N from the Biscuit Fire may have been taken up by the vegetation immediately
following the fire and sequestered in plant material (Keeley et al. 1981, Boerner 1982).
If the Biscuit Fire had any effect on soil N, it likely affected the two ecosystems
differently. This idiosyncrasy was noted by Ratchford et al. (2005) in terms of the effect
of the Biscuit Fire on ant assemblages at many of the same fen-upland pairs that I used.
They found that the effect of fire on ant assemblages depended on habitat type, and that
fire affected ant assemblages inversely in fens and uplands. That is, burned sites were
less similar in subsequent years to each other than unburned sites, and fen sites were
generally more similar to each other over time than upland sites. Thus, it is likely that
any interpretation of the role of fire in a serpentine landscape must pay careful attention
to the habitats affected, as not all habitats are affected equally by fire.

35
Differences in Soil N Among Serpentine Habitats
Perhaps one of the most surprising findings of my work is that no difference in
soil N was detected between fen and upland areas in terms of soil NH4+-N or NO3
--N by
either method replicated in both habitats (buried IER bag and soil cores). These two
ecosystems have long been described as distinct vegetation types (Whittaker 1954,
Whittaker 1960, DellaSala et al. 1999), but my study indicates they are similar in terms of
overall soil N availability. The vegetation difference is therefore likely driven primarily
by moisture differences, successional gradients brought on by fires, or the dynamics of
other limiting nutrients, and not soil N levels.
Non-woody vegetation is sparse in the uplands (Whittaker 1960), but omnipresent
in the fen areas, with a permanent litter layer as well as old D. californica pitchers from
previous years (D. Franklin pers. obs.). The reducing conditions of the fen soils (Borine
1983, Mills and Roath 1984), coupled with evidence of microbial action (strong sulfurous
odor, D. Franklin pers. obs.) and the presence of partially decomposed organic matter
(also known as muck), indicates that this litter represents a constant influx of
decomposing material. As it is broken down by microbial action, the liberated inorganic
N would compensate for the nutrient loss from erosion and leaching due to the high water
table. The uplands, however, are almost barren of litter. The lack of available
decomposable organic substrate, as well as low moisture levels, would suggest that the
uplands are experiencing lower levels of N transformations than the fens. This is
confirmed by the low levels of N mineralization and nitrification that I measured, as well
as by the lack of organic soil development in any of the uplands that I visited. While

36
overall N availability did not differ significantly between the two habitats, this is likely
the net result of two different N cycling regimes, and not a ubiquitous characteristic of
the landscape.
The two ecosystems may differ in their sources of N, but the overall ambient
levels remain the same. One would need to pursue a study using stable isotopes (that is,
15N methods) or quantum dot labeling methods (Whiteside et al. 2009) to reveal the true
sources of N in each of these ecosystems, as the superficial analyses I used suggest that
net N levels do not vary across the landscape.
Studies of N dynamics in discrete wetland or terrestrial ecosystems are common,
but comparative studies of N availability or transformations between wet and dry
ecosystems within a single landscape are very rare (for examples, see Zak and Grigal
1991, Axt and Walbridge 1999, Craft and Chiang 2002). In the few studies that have
been done, the general finding is that wetlands harbor higher levels of N, especially NO3--
N. It is worth noting that these studies occurred in drastically different wetland types
from the ones I studied (Zak and Grigal 1991, Craft and Chiang 2002), or quantifying N
was not the primary goal of the study (Axt and Walbridge 1999). Further comparative
studies are necessary in order to understand this wetland-upland dynamic. By sampling
towards the end of the growing season, I likely failed to capture the highest amount of N
fluctuations in these ecosystems. A study carried out during the spring or fall might
report drastically different results.
37
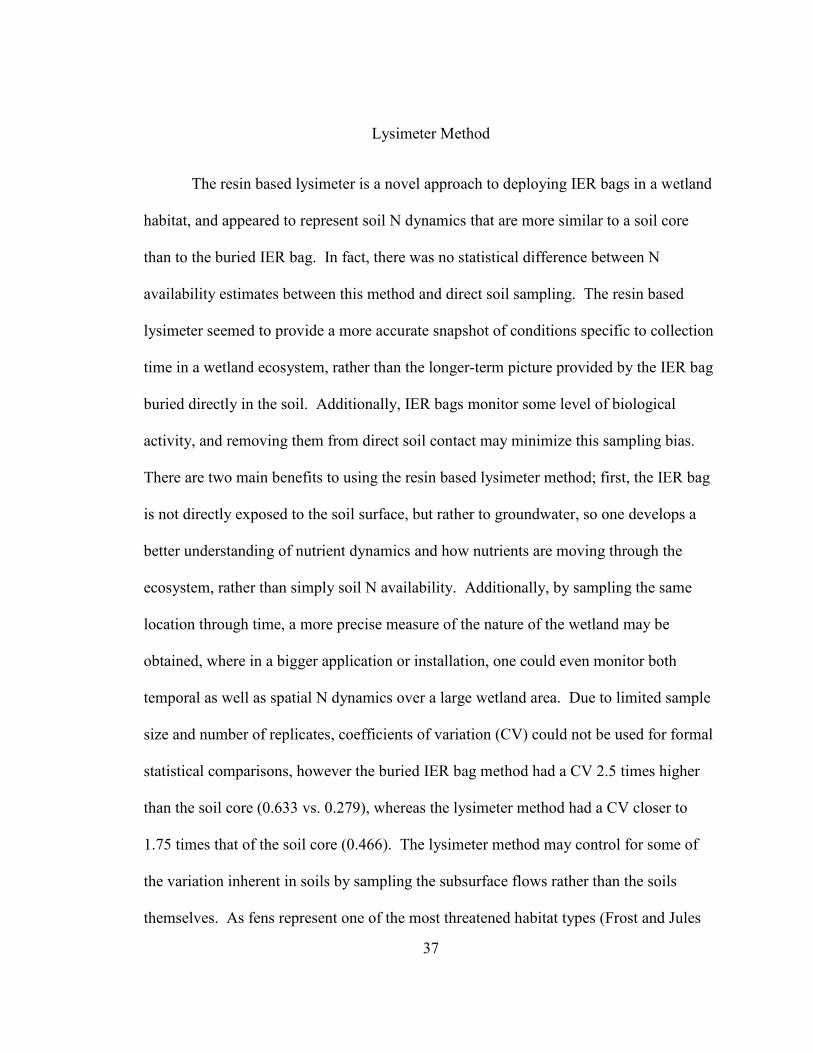
Lysimeter Method
The resin based lysimeter is a novel approach to deploying IER bags in a wetland
habitat, and appeared to represent soil N dynamics that are more similar to a soil core
than to the buried IER bag. In fact, there was no statistical difference between N
availability estimates between this method and direct soil sampling. The resin based
lysimeter seemed to provide a more accurate snapshot of conditions specific to collection
time in a wetland ecosystem, rather than the longer-term picture provided by the IER bag
buried directly in the soil. Additionally, IER bags monitor some level of biological
activity, and removing them from direct soil contact may minimize this sampling bias.
There are two main benefits to using the resin based lysimeter method; first, the IER bag
is not directly exposed to the soil surface, but rather to groundwater, so one develops a
better understanding of nutrient dynamics and how nutrients are moving through the
ecosystem, rather than simply soil N availability. Additionally, by sampling the same
location through time, a more precise measure of the nature of the wetland may be
obtained, where in a bigger application or installation, one could even monitor both
temporal as well as spatial N dynamics over a large wetland area. Due to limited sample
size and number of replicates, coefficients of variation (CV) could not be used for formal
statistical comparisons, however the buried IER bag method had a CV 2.5 times higher
than the soil core (0.633 vs. 0.279), whereas the lysimeter method had a CV closer to
1.75 times that of the soil core (0.466). The lysimeter method may control for some of
the variation inherent in soils by sampling the subsurface flows rather than the soils
themselves. As fens represent one of the most threatened habitat types (Frost and Jules

38
2007) in this landscape, the resin based lysimeter provides a way to monitor soil nutrient
dynamics with a minimal of disturbance, and is therefore ideal for long term studies.
Further exploration and development of this method in other wetland habitats is required.
Comparisons to Previous Research
My research represents the first study to take a detailed look at the effect of fires
on serpentine soil N availability, and the first to look specifically at D. californica fens in
relation to surrounding upland areas. The only other study on fire and N on serpentines
only looked at gross N as part of a bigger investigation into the nature of community
diversity (Safford and Harrison 2004). Safford and Harrison (2004) found that soil N
played a significant role in postfire vegetation recovery, they did not detect a difference
between burned and unburned plots using a soil sampling protocol similar to mine.
However, they were only concerned with total soil N, which incorporates both the
inorganic forms of N that I measured, and organic forms that are not available to plants,
and effectively measures a different metric of soil fertility.
The values I obtained for soil N availability are much lower than other studies that
have been done on serpentine grasslands (Christensen and Muller 1975, Turitzin 1982,
Reynolds et al. 1997), although these have generally occurred south of my sites.
Reynolds et al. (1997) studied serpentine grasslands at the Jasper Ridge Biological
Preserve in Stanford, Ca. and detected almost 170 times as much NO3--N in the soil using
IER bags compared to the serpentine soils of southwestern Oregon and northern
California. However, Huenneke et al. (1990) worked in Santa Clara County, Ca, and

39
reported higher NH4+-N concentrations but similar NO3
--N concentrations in the soil.
Despite these conflicting results, the overall consensus is that these soils are N limited,
although the degree of limitation may vary by substrate mineral composition and climate.
For comparison, a study conducted in Pinus ponderosa stands in Deschutes National
Forest (approximately 285 km northeast of my study sites) reported NO3--N values
approximately 1000 times greater than values I detected. And a typical N saturated
eastern Tsuga canadensis forest generally will generally have between 1000 and 8000
times more N available to plants than serpentine ecosystems (D. Franklin, unpub).
Conclusions and Recommendations
It is worth noting that any findings on the effect of fire on N dynamics from a five
year post-burn perspective would be at least somewhat anecdotal due to the lack of pre-
burn data. However, other findings have reported on detectable effects of fire for longer
time frames (e.g. up to 12 years, Monleon et al. 1997) without pre-burn data.
Additionally, I had a relatively low sample size, which made drawing strong conclusions
difficult.
While this study represents the first foray into understanding soil N in this
landscape, it also illustrates that there are significant questions still to be answered in
terms of N availability in a heterogeneous serpentine landscape, the effect of fire in these
ecosystems, as well as the ability of the various N quantification methods to accurately
portray soil N in a severely N limited habitat. Further studies should increase their
replication, as well as track soil N year round. Due to time and budget constraints, as

40
well as significant safety concerns due to the remoteness of some of these habitats, no
attempt was made to gain an understanding of year-round N dynamics. Soil N may
fluctuate more in other season, but I can only comment on the soil conditions in the peak
of summer.
The interpretation of the role of fire in these ecosystems varies depending on what
method one uses to quantify N. Future studies should compare soils over a more
extensive sample of habitat coupled with laboratory incubations to estimate maximum N
transformation rates. Other aspects of ecosystem function and characteristics should also
be taken into account in future studies. Decomposition was not quantified in the fens;
however plant litter decomposition is thought to play a significant role in understanding
N cycling in wetland environments as it represents the one of the most significant inputs
of N into these systems (Bowden 1987). Additionally, fertilization experiments (either in
situ or in a greenhouse) would give greater insight as to the true limiting nature of these
soils and may elucidate the some of the complexities of limiting nutrients in these soils.
Although N is thought to be an important limiting factor to plant growth in serpentine
habitats, there is also literature suggesting that phosphorus may be equally limiting
(Turitzin 1982, Huenneke et al. 1990). Due to an unidentified precipitate in the tubes of
the autoanalyzer, P was not measured, but future studies should take it into consideration
in both study design as well as laboratory methods. There is much work remaining to do
in unraveling the Gordian knot of what exactly controls plant growth and community
structure in terms of soil characteristics and N dynamics in serpentine ecosystems.
41
LITERATURE CITED
Adams, M.A., P.J. Polglase, P.M. Attiwill, and C.J. Weston. 1989. In situ studies of nitrogen mineralization and uptake in forest soils; some comments on methodology. Soil Biology and Biochemistry 21: 423-429.
Amaranthus, M.P. and J.M. Trappe. 1993. Effects of erosion on ecto- and VA-
mycorrhizal inoculum potential of soil following forest fire in southwest Oregon. Plant and Soil 150: 41-49.
Amer, F., D. Bouldin, C. Black, and F. Duke. 1955. Characterization of soil phosphorus
by anion exchange resin adsorption and P-32 equilibration. Plant and Soil 6: 391-408.
Atzet, T., and R.E. Martin. 1991. Natural disturbance regimes in the Klamath Province.
Proceedings of the Symposium on Biodiversity of Northwestern California. (Santa Rosa). California.
Axt, J.R. and M.R. Walbridge. 1999. Phosphate removal capacity of palustrine forested
wetlands and adjacent uplands in Virginia. Soil Science Society of America Journal 63: 1019-1031.
Binkley, D. and P. Matson. 1983. Ion exchange resin bag method for assessing forest
soil nitrogen availability. Soil Science Society of America Journal 47: 1050-1052. Binkley, D. and S.C. Hart. 1989. The components of nitrogen availability assessments in
forest soils. Advances in Soil Science 10: 57-116. Binkley, D., D. Richter, M.B. David, and B. Caldwell. 1992. Soil chemistry in a
loblolly/longleaf pine forest with interval burning. Ecological Applications 2: 157-164.
Binkley, D., J. Aber, J. Pastor, and K. Nadelhoffer. 1986. Nitrogen availability in some
Wisconsin forests: comparisons of resin bags and on-site incubations. Biology of Fertile Soils 2: 77-82.
Binkley, D., R. Bell, and P. Sollins. 1992. Comparison of methods for estimating soil
nitrogen transformations in adjacent conifer and alder-conifer forests. Canadian Journal of Forest Research 22: 858-863.

42
Boerner, R.E.J. 1982. Fire and nutrient cycling in temperate ecosystems. Bioscience 32: 187-192.
Bond, W.J. and B.W. van Wilgen. 1996. Fire and Plants. Chapman & Hall, New York,
New York, USA. Borine, R. 1983. Soil survey of Josephine County, Oregon. USDA Soil Conservation
Service Report, Washington D.C., USA. Bowden, W.B. 1987. The biogeochemistry of nitrogen in freshwater wetlands.
Biogeochemistry 4: 313-348. Bremner, J.M. 1965. Nitrogen availability indexes. Pages 1324-1345 in C.A. Black,
editor. Methods of soil analysis, part 2. American Society of Agronomy, Madison, Wisconsin, USA.
Brooks, R.R. 1987. Serpentine and its vegetation: a multidisciplinary approach.
Dioscorides Press, Portland, Oregon, USA. Brye, K.R. and N.A. Slaton. 2003. Carbon and nitrogen storage in a typic albaqualf as
affected by assessment method. Communications in soil science and plant analysis 34: 1637-1655.
Brye, K.R., J.M. Norman, and S.T. Gower. 2002a. The fate of nutrients following three-
and six-year burn intervals in a tallgrass prairie restoration in Wisconsin. American Midland Naturalist 148: 28-42.
Brye, K.R., J.M. Norman, E.V. Nordheim, S. T. Gower, and L.G. Bundy. 2002b.
Refinements to an in-situ soil core technique for measuring net nitrogen mineralization in moist, fertilized, agricultural soil. Agronomy Journal 94: 864-869.
Brye, K.R., J.M. Norman, S.T. Gower, and L.G. Bundy. 2003. Effects of management
practices on annual net N-mineralization in a restored prairie and maize agroecosystems. Biogeochemistry 63: 135-160.
Burt, R., M. Fillmore, M.A. Wilson, E.R. Gross, R.W. Langridge, and D.A. Lammers.
2001. Soil properties of selected pedons on ultramafic rocks in Klamath Mountains, Oregon. Communications in Soil Science and Plant Analysis 32: 2145-2175.
Chapin III, F.S., P.M. Vitousek, and K. Van Cleve. 1986. The nature of nutrient
limitation in plant communities. The American Naturalist 127: 48-58.

43
Christensen, N.L. and C.H. Muller. 1975. Effects of fire on factors controlling plant growth in Adenostoma chaparral. Ecological Monographs 45: 29-55.
Craft, C.B. and C. Chiang. 2002. Forms and amounts of soil nitrogen and phosphorus
acros a longleaf pine-depressional wetland landscape. Soil Science Society of America Journal 66: 1713-1721.
Cramer, J.R. 2005. The Biscuit Fire and the flora of serpentine fens: Differences in
species composition between burned and unburned fens. Thesis. University of Vermont, Burlington, VT, USA.
Davidson, E.A., S.C. Hart, C.A. Shanks, and M.K. Firestone. 1991. Measuring gross
nitrogen mineralization, immobilization, and nitrification by 15N isotopic pool dilution in intact soil cores. Journal of Soil Science 42: 335-349.
Debano, L.F. and C.E. Conrad. 1978. The effect of fire on nutrients in a chaparral
ecosystem. Ecology 59: 489-497. del Moral, R. 1982. Control of vegetation on contrasting substrates: herb patterns on
serpentine and sandstone. American Journal of Botany 69: 227-238. DellaSala, D.A., S.B. Reid, T.J. Frest, J.R. Strittholt, and D.M. Olson. 1999. A global
perspective on the biodiversity of the Klamath-Siskiyou ecoregion. Natural Areas Journal 19: 300-319.
DiStefano, J. Fco., and H.L. Gholz. 1986. A proposed use of ion exchange resins to
measure nitrogen mineralization and nitrification in intact soil cores. Communications in soil science and plant analysis 17: 989-998.
Ellison, A.M. and E.J. Farnsworth. 2005. The cost of carnivory for Darlingtonia
californica (Sarraceniaceae): evidence from relationships among leaf traits. American Journal of Botany 92: 1085-1093.
Ellison, A.M., N.J. Gotelli, J.S. Brewer, D.L. Cochran-Stafira, J.M. Kneitel, T.E. Miller,
A.C. Worley, and R. Zamora. 2003. The evolutionary ecology of carnivorous plants. Advances in Ecological Research 33: 1-74.
Eno, C. 1960. Nitrate production in the field by incubating the soil in polyethylene bags.
Soil Science Society of America Proceedings 24: 277-279. Frost, E.J. and E.S. Jules. 2007. Draft conservation strategy for Oregon fireweed
(Epilobium oreganum), Mendocino gentian (Gentiana setigera), large-flowered rush-lily (Hastingsia bracteosa var. bracteosa), purple-flowered rush lily (H. bracteosa var.

44
atropurpurea), western bog violet (Viola lanceolata ssp. occidentalis) in serpentine Darlingtonia wetlands of southwest Oregon and northwest California. Report for the Bureau of Land Management and the United States Forest Service. 67 pgs.
Frost, E.J., R.J. Sweeny, W.L. Bigg. 2004. Distribution and environmental/habitat
relations of five endemic plants associated with serpentine fens in southwestern Oregon and northwestern California. Report to the Six Rivers and Siskiyou National Forests.
Grier, C.C. 1975. Wildfire effects on nutrient distribution and leaching in a coniferous
ecosystem. Canadian Journal of Forest Research 5: 599-607. Grogan, P., T.D. Bruns, and F.S. Chapin III. 2000. Fire effects on ecosystem nitrogen
cycling in a Californian bishop pine forest. Oecologia 122: 537-544. Harrison, S., J.H. Viers, J.F. Quinn. 2000. Climatic and spatial patterns of diversity in
the serpentine plants of California. Diversity and Distributions 6: 153-161. Hart, S.C. and M.K. Firestone. 1989. Evaluation of three in situ soil nitrogen availability
assays. Canadian Journal of Forest Research 19: 185-191. Hauck, R., and J. Bremner. 1976. Use of tracers for soil and fertilizer nitrogen research.
Advances in Agronomy 28: 219-266. Hintz, J. 2004. NCSS and PASS. Number Cruncher Statistical Systems. Kaysville,
Utah, USA. Högberg, P. 1997. Tansley Review No. 95: N natural abundance in soil-plant systems.
New Phytologist 137: 179-203. Huenneke, L.F., S.P. Hamburg, R. Koide, H.A. Mooney, and P.M. Vitousek. 1990.
Effects of soil resources on plant invasion and community structure in Californian serpentine grassland. Ecology 71: 478-491.
Johnson, D.W., P.S.J. Verburg, and J.A. Arnone. 2005. Soil extraction, ion exchange
resin, and ion exchange membrane measures of soil mineral nitrogen during incubation of a tallgrass prairie soil. Soil Science Society of America Journal 69: 260-265.
Johnson, D.W., R.B. Susfalk, R.A. Dahlgren, and J.M. Klopatek. 1998. Fire is more
important than water for nitrogen fluxes in semi-arid forests. Environmental Science and Policy 1: 79-86.
45
Keeley, S.C., J.E. Keeley, A.M. Hutchinson, and A.W. Johnson. 1981. Postfire succession of the herbaceous flora in southern California chaparral. Ecology 62: 1608-1621.
Keeney, D.R. 1980. Prediction of soil nitrogen availability in forest ecosystems: a
literature review. Forest Science 26: 159-171. Knoepp, J.D. and W.T. Swank. 1995. Comparison of available soil nitrogen assays in
control and burned forested sites. Soil Science Society of America Journal 59: 1750-1754.
Knoepp, J.D., Vose, J.M., and W.T. Swank. 2004. Long-term soil responses to site
preparation burning in the southern Appalachians. Forest Science 50: 540-550. Kruckeberg, A.R. 1984. California serpentines: flora, vegetation, geology, soils, and
management problems. University of California press, Berkeley, California, USA. Matson, P.A., P.M. Vitousek, J.J. Ewel, M.J. Mazzarino, and G.P. Robertson. 1987.
Nitrogen transformations following tropical forest felling and burning on a volcanic soil. Ecology 68: 491-502.
McCoy, S., T. Jaffre, F. Rigault, and J.E. Ash. 1999. Fire and succession in the
ultramafic maquis of New Caledonia. Journal of Biogeography 26: 579-594. McNabb, D.H., and K. Cromack, Jr. 1990. Effects of prescribed fire on nutrients and
soil productivity. Pages 125-142 in J.D. Walstad, S.R. Radosevich, and D.V. Sandberg, editors. Natural and prescribed fires in Pacific Northwest forests. Oregon State University Press, Corvalis, Oregon, USA.
Miller, M.E., J. Belnap, S.W. Beatty, and B.L. Webb. 2006. Effects of water additions,
chemical amendments, and plants on in situ measures of nutrient bioavailability in calcareous soils of southeastern Utah, USA. Plant and Soil 288: 19-29.
Mills, S.R. and B.A. Roath. 1984. Soil survey of Six Rivers National Forest Area,
California. USDA Soil Conservation Service Report, Washington D.C., USA. Monleon, V.J., K. Cromack, Jr., and J.D. Landsberg. 1997. Short- and long-term effects
of prescribed underburning on nitrogen availability in ponderosa pine stands in central Oregon. Canadian Journal of Forest Research 27: 369-378.
Morghan, K.J.R. and T.R. Seastedt. 1999. Effects of soil nitrogen reduction on
nonnative plants in restored grasslands. Restoration Ecology 7: 51-55.

46
Proctor, J. and S.R.J. Woodell. 1975. The ecology of serpentine soils. Advances in Ecological Research 9: 255-366.
Qian, P., and J.J. Schoenau. 2002. Practical applications of ion exchange resins in
agriculture and environmental soil research. Canadian Journal of Soil Science 82:9-21.
Raison, R.J. 1979. Modification of the soil environment by vegetation fires, with
particular reference to nitrogen transformations: a review. Plant and Soil 51: 73-108. Raison, R.J., M.J. Connell, and P.K. Khanna. 1987. Method for studying fluxes of soil
mineral-N in situ. Soil Biology and Biochemistry 19: 521-530. Ratchford, J.S., S.E. Wittman, E.S. Jules, A.M. Ellison, N.J. Gotelli, and N.J. Sanders.
2005. The effects of fire, local environment and time on ant assemblages in fens and forests. Diversity and Distributions 11: 487-497.
Reynolds, H.L., B.A. Hungate, F.S. Chapin III, and C. M. D'Antonio. 1997. Soil
heterogeneity and plant competition in an annual grassland. Ecology 78: 2076-2090. Richter, D.D., C.W. Ralston, and W.R. Harms. 1982. Prescribed fire: effects on water
quality and forest nutrient cycling. Science 215: 661-663. Safford, H.D. and S. Harrison. 2004. Fire effects on plant diversity in serpentine vs.
sandstone chaparral. Ecology 85: 539-548. Sakadevan, K., M.J. Hedley, and A.D. Mackay. 1994. An in situ mini lysimeter with a
removable ion exchange resin trap for measuring nutrient losses by leaching from grazed pastures. Australian Journal of Soil Research 32: 1389-1400.
Sanders, N.J., N.J. Gotelli, S.E. Wittman, J.S. Ratchford, A.M. Ellison, and E.S. Jules.
2007. Assembly rules of ground-foraging ant assemblages are contingent on disturbance, habitat and spatial scale. Journal of Biogeography 34: 1632-1641.
Seastedt, T.R. and D.C. Hayes. 1988. Factors influencing nitrogen concentrations in soil
water in a North American tallgrass prairie. Soil Biology and Biochemistry 20: 725-729.
Sherman, L.A., K.R. Brye, D.E. Gill, and K.A. Koenig. 2005. Soil chemistry as affected
by first-time prescribed burning of a grassland restoration on a coastal plain ultisol. Soil Science 170: 913-927.
47
Sibbeson, E. 1977. A simple ion-exchange resin procedure for extracting plant-available elements from the soil. Plant and Soil 46: 665-669.
Skinner, C.N. 2003a. Fire regimes of upper montane and subalpine glacial basins in the
Klamath Mountains of northern California. Tall Timbers Research Station Miscellaneous Publication 13:145–151.
Skinner, C.N. 2003b. A tree-ring based fire history of riparian reserves in the Klamath
Mountains. Pages 116-119 in P.M. Faber, editor. California Riparian Systems: Processes and Floodplains Management, Ecology, and Restoration. Riparian habitat and floodplains conference Proceedings. March 12-15, 2001, Sacramento, CA.
SPSS. 2008. SPSS version 17.0. SPSS, Chicago, Illinois, USA. Suding, K.N., K.D. LeJeune, and T.R. Seastedt. 2004. Competitive impacts and
responses of an invasive weed: dependencies on nitrogen and phosphorus availability. Oecologia 141: 526-535.
Susfalk, R.B., and D.W. Johnson. 2002. Ion exchange resin based soil solution
lysimeters and snowment solution collectors. Communications in Soil Science and Plant Analysis 33: 1261-1275.
Taylor, A.H. and C.N. Skinner. 2003. Spatial patterns and controls on historical fire
regimes and forest structure in the Klamath Mountains. Ecological Applications 13:704-719.
Thompson, J.R., T.A. Spies, and L.M. Ganio. 2007. Reburn severity in managed and
unmanaged vegetation in a large wildfire. Proceedings of the National Academy of Sciences 104: 10743-10748.
Tilman, D. and D. Wedin. 1991. Plant traits and resource reduction for five grasses
growing on a nitrogen gradient. Ecology 72: 685-700. Turitzin, S.N. 1982. Nutrient limitations to plant growth in a California serpentine
grassland. American Midland Naturalist 107: 95-99. Turner, M.G., E.A. H. Smithwick, K.L. Metzger, D.B. Tinker, and W.H. Romme. 2007.
Inorganic nitrogen availability after severe stand-replacing fire in the Greater Yellowstone ecosystem. Proceedings of the National Academy of Sciences 104: 4782-4789.

48
Turner, M.G., W.W. Hargrove, R.H. Gardner, and W.H. Romme. 1994. Effects of fire on landscape heterogeneity in Yellowstone National Park, Wyoming. Journal of Vegetation Science 5: 731-742.
USDA Forest Service and BLM. 2004. Biscuit fire recovery project final environmental
impact statement. USDA Forest Service and BLM, Medford, Oregon. Available from http://www.fs.fed.us/r6/rogue-siskiyou/biscuit-fire/feis.shtml (accessed February 2009).
Vitousek, P.M. and C.B. Field. 1999. Ecosystem constraints to symbiotic nitrogen
fixers: a simple model and its implications. Biogeochemistry 46: 179-202. Vitousek, P.M. and R.W. Howarth. 1991. Nitrogen limitation on land and in the sea: how
can it occur? Biogeochemistry 13: 87-115. Wan, S., D. Hui, and Y. Luo. 2001. Fire effects on nitrogen pools and dynamics in
terrestrial ecosystems: a meta-analysis. Ecological Applications 11: 1349-1365. Whelan, R.J. 1995. The ecology of fire. Cambridge University Press, Cambridge,
United Kingdom. Whiteside, M.D., K.K. Treseder, and P.R. Atsatt. 2009. The brighter side of soils:
Quantum dots track organic nitrogen through fungi and plants. Ecology 90: 100-108. Whittaker, R.H. 1954. The ecology of serpentine soils IV: the vegetational response to
serpentine soils. Ecology 35: 275-288. Whittaker, R.H. 1960. Vegetation of the Siskiyou Mountains, Oregon and California.
Ecological Monographs 30: 279-338. Wilbur, R.B. and N.L. Christensen. 1983. Effects of fire on nutrient availability in a
North Carolina coastal plain pocosin. American Midland Naturalist 110: 54-61. Wolf, A. 2001. Conservation of endemic plants in serpentine landscapes. Biological
Conservation 100: 35-44. Wyland, L.J. and L.E. Jackson. 1993. Evaluating nitrate recovery by ion-exchange resin
bags. Soil Science Society of America Journal 57: 1208-1211. Zak, D.R. and D.F. Grigal. 1991. Nitrogen mineralization, nitrification and
denitrification in upland and wetland ecosystems. Oecologia 88: 189-196.