a comparative study of livelihood strategies in rural and...
TRANSCRIPT

Mahua Bhattacharjee387–415 A Comparative Study of Livelihood Strategies in Rural and Urban Assam
A Comparative Study of LivelihoodStrategies in Rural and Urban Assam
MAHUA BHATTACHARJEE
Livelihood strategies of rural and urban Assam are becoming more interdependent.The rural–urban linkage is influencing livelihood in both positive and negative ways asmarket forces are increasingly determining all livelihood strategies. The study revealsthat the working population unanimously consider that livelihood is not as easy as itwas for the previous generation. Factors like unsuitable weather for cultivation, pricefluctuation, competition from better/cheap/substitute products, and the reluctantattitude of the younger generation towards rural livelihood activities are mainlyresponsible for making livelihoods harder. Products with a variety in different priceranges have brought significant changes primarily in rural livelihood activities.Sustainability of livelihood is now more dependent on practicing diversification as itcompels households to be more vigilant and adopt the change occurring over time.
Dr. Mahua Bhattacharjee is Senior Lecturer, Amity School of Economics, AmityUniversity.
INTRODUCTION
Households survive by drawing on its range of assets and engaging in a vari-
ety of activities. Livelihood strategies of households are multifaceted as men
and women draw on both their tangible and intangible assets for survival.
Livelihood strategies include how people combine their income-generating
activities, the choice of assets they choose to invest in, and how they manage
to preserve existing assets and income (Department for International Devel-
opment [DFID], 2000a, 2000b). Members of the household carry out a range
of activities to attain self-defined goals either by staying at one place or by
migrating temporarily or permanently to another place. With time, higher
pressure on limited livelihood capital is making livelihood strategies more
diverse. For the worsening land human ratios, falling agricultural commod-
ity prices in rural areas, and new economic opportunities and the expanding
IJSW, 71(3), 387–415, July 2010
Tata Instituteof
Social Sciences
THEINDIAN JOURNAL
OFSOCIAL WORK
Volume 71, Issue 3July 2010

manufacturing sector in the urban areas, livelihood strategies presently are
becoming more multi-locational.
On the basis of broad industry division made by the National Industrial
Classification (1998), agriculture is established as the uniquely dominating
principal status in rural Assam. However, in urban Assam, no such principal
dominating status could be determined. Though the highest concentration has
been noted in public administration, other areas like education and commer-
cial services, trade, hotel, restaurant and transport have also been found to be
equally significant. Women are found to be highly concentrated in agriculture
and are also found to be sharing the working status of trade, hotel and restau-
rant in rural areas. In urban areas, the concentration is more in public adminis-
tration, education and commercial services. The most dominant livelihood
strategy in rural Assam is self employment. More than half the number of
households in rural Assam are self employed in agriculture. As compared to
the national average, Assam has a significantly higher percentage of house-
holds who are self employed in agriculture. In the decade from 1993–1994 to
2006–2007, those self employed in agriculture increased by 10% in Assam,
along with a declining trend in agricultural labour, and other labour.
In urban Assam, the male–female working population ratio is almost
similar, but in rural Assam the female working ratio is marginally
higher. Based on the age category, it is seen that girls of 10–14 years
work more in urban Assam. As far as source of income is concerned,
wage/salary employment and non-agriculture enterprises are the two
important sources of income in both rural and urban areas. In urban
Assam, too, the percentage of those self employed is higher than that for
India. Based on the monthly per capita expenditure it is found that the
self employed and those engaged in casual labour are relatively poorer
(NSSO Reports on Household Consumer Expenditure and Employment
situation in India). Studies like Sengupta (2007), and Fan, Fang and
Zhang (2003) also revealed that casual labourers are the least protected
in urban areas, which has a significant effect on food security.
From the macro perspective of livelihood strategy, it is understood that
the percentage of agricultural labour and other labour has declined, with
self employment becoming a more preferred occupation.
METHODOLOGY
The study is designed mainly on the theoretical basis of DFID’s framework
on sustainable livelihood (Figure 1).
IJSW, 71(3), 387–415, July 2010
388 Mahua Bhattacharjee

FIGURE 1
Framework of Sustainable Livelihood
VULNERABILITY
Shocks
Natural: Flood
Man-made: Violence
against Women
LIVELIHOOD
CAPITAL
Physical
Human
Financial
LIVELIHOOD
STRATEGY
Natural,
Resource-based
Market-based
LIVELIHOOD
OUTCOME
Higher Income
Improved health and
nutrition
Gender equity
Reduced vulnerability
Good living
condition
With the limitation of considering all the variables of the model in a sin-
gle study, some adjustments were made according to the objective and pri-
orities of the current study. Vulnerability, livelihood capital and livelihood
strategies are the factors which interact to lead to a livelihood outcome.
The different elements of livelihood capital are:
• Physical: drinking water, dwelling unit, sanitation, and use of energy
for cooking and lighting.
• Human: health, nutrition and adequacy of food.
• Financial: assets and liabilities.
This article is entirely based on empirical data collected during 2006
from rural and urban Assam. A detailed account on the sex-wise range of
activities carried out in rural and urban areas was taken through individual
household survey. In addition, participatory method was also used to un-
derstand the coping and adaptive strategies for livelihood in the context of
vulnerability; dynamic nature of livelihood strategy; the inter linkage be-
tween the factors influencing livelihood; the micro element of society in-
fluencing livelihood; and the changes occurring in the time period. Gender
equity—being an important aspect of livelihood, women participation in
livelihood activities and changes occurring in their life—was specially
taken into account during the survey.
The household survey from selected occupations was done on the basis
of a structured questionnaire by a simple random sampling method. Occu-
pation-wise quantitative data was also collected from the households. Oc-
cupations in rural areas are categorically divided into four groups: (i)
agricultural labour, (ii) cultivator, (iii) self employed, and (iv) artisans. The
unorganised sector occupations in urban areas can be divided into three
groups: (i) self employed, (ii) regular worker, and (iii) casual labour.
IJSW, 71(3), 387–415, July 2010
A Comparative Study of Livelihood Strategies in Rural and Urban Assam 389

Qualitative information was collected though focus group discussions
(FGDs), key informant interviews, case studies, and direct observation.
The FGDs were carried out to elicit collective experience and take the
opinion of women, youth, and working group from the dominant occupa-
tion. Information from seven key informants (from seven villages) is also
included in the analysis. The FGDs and key informant interviews were
carried out in rural areas only.
The livelihood outcome is evaluated by Principal Component Analysis
Method (PCAM). Eighteen variables were chosen to reflect the specific
component affecting the livelihood of rural and urban areas. The theoreti-
cal foundation of the PCAM lies in expressing the components as linear
combinations of variables with the highest possible variation. If x, y and z
are three indicators to be examined as two principal components, then it
would require two linear equations to be estimated.
Component 1=�1x+�2y+�3z
Component 2=�1x+�2y+�3z
Here, coefficients of the equations either represent correlations or load-
ings of the indicator with the components which gives a particular dimen-
sion.
In order to improve the interpretation in terms of maximising the factor
load on to one component and for unique identification of factors of a com-
ponent, various rotations are normally applied both orthogonally and
obliquely. For the given set of data, orthogonal rotation varimax is applied.
In the next stage, factor scores were obtained by using the method sug-
gested by Anderson and Rubin (by SPSS programming) and the factor
score matrix is presented. Using the factor score matrix, the factor scores
for all the four components along with the total factor score for each of the
sampled villages and urban area is estimated. The mean scores were then
tested through independent t-test for rural (all villages) and urban (all
towns) areas at 5% level of significance.
Study Area
Two districts of Kamrup and Nagaon in Assam were selected for primary data
collection as they had the highest urban and rural populations, respectively, for
the state (Assam: Directorate of Economics and Statistics). Villages from
these districts were purposively selected on the basis of the dominant occupa-
tion—cultivator and agricultural labour-based on data of the Census of India
IJSW, 71(3), 387–415, July 2010
390 Mahua Bhattacharjee

(2001). The cultivator-dominated Dhopguri and agriculture labour-dominated
Ganakpara (in Kamrup district) and cultivator-dominated Chakori Gaon and
agriculture labour-dominated Paschim Salpara (in Nagaon district), were se-
lected for the study. Another village, Kuch Gaon (in Nagaon district) was se-
lected on the basis of direct observation for having agricultural-based business
and as well as other businesses. In addition, two artisan-dominated villages in
Nagaon district—Bhakatgaon and Kalapani—were also selected. The main
sources of income for these villages were pottery and making bamboo fences.
These two villages had one major difference—in Bhakatgaon, the artisan
group is almost perishing, while in Kalapani the community is managing to
practice their art. Guwahati city (Kamrup district) was also selected to under-
stand urban living. Data on urban living conditions of Nagaon district were
collected from Haibargaon and Dhakaipatti.
Sample Design and Size
The total sample size was 400 with 240 from rural and 160 from urban
areas. Forty households were taken from each of the three villages domi-
nated by cultivators (Dhopguri and Chakori Gaon), agricultural labour
(Ganakpura and Paschim Salpara), and the self employed or agriculture
based or other businesses (Kuch Gaon). Among the 40 households, 20
households were from the dominant occupation and the remaining were
from other occupations. Twenty households were selected from each of the
artisan villages (Bhakatgaon and Kalapani). Therefore, the sample size of
the five villages in Nagaon district is 160 and the sample size of two vil-
lages in Kamrup district is 180.
The sample design for urban areas is also made on the basis of occupa-
tion. From Guwahati city, a total of 120 households were selected—with
40 households each of the self employed, casual labour and regular
workers. From Nagaon, 40 samples were collected from two towns
(Dhakaipatti and Haibargaon) of which 20 were self employed and the re-
maining were from other two categories.
Analysis
The four specific dimensions mentioned earlier—Vulnerability, Liveli-
hood Capital, Livelihood Strategy and Livelihood Outcome—are taken
into account on the basis of which the livelihoods in rural and urban areas
are compared. Each of these ‘dimensions’ are formed on the basis of some
relevant and related ‘components’. For fulfilling empirical requirements, it
IJSW, 71(3), 387–415, July 2010
A Comparative Study of Livelihood Strategies in Rural and Urban Assam 391

is, therefore, necessary to transform the ‘constituent components’ of the
model into observable attributes either in the form of variables or indica-
tors. The following 18 indicators have been identified for the empirical
testing of the model as indicators of sustainable livelihood:
1. Percentage of households prone to flood
2. Percentage of households prone to flood with alternative options
3. Percentage of casual workers
4. Percentage of household reporting violence against women
5. Average size of homestead land
6. Literacy rate
7. Dropout ratio
8. Average annual health-related expenditure
9. Percentage of indebted households with institutional credit
10. Percentage of workers engaged in other than primary sector
11. Average annual household income
12. Percentage of households reporting no health problem during the
last year
13. Female literacy rate
14. Percentage of households with non-kutcha houses
15. Percentage of electrified houses
16. Percentage of households with access to safe drinking water
17. Percentage of household with sanitation
18. Work participation rate
These indicators are chosen to reflect the specific ‘components’ of the
model and values are obtained through the survey conducted following the
framework detailed in methodology among 400 households in seven vil-
lages and two urban centres of Nagaon and Kamrup districts of Assam
(values are given in Appendix 1). The correlation matrix of the selected
variables (presented along with significances in Appendix 2) suggests
certain important trends.
FINDINGS
It can be seen from Table 1 that casualisation tends to increase in the face of
floods, more within the primary sector, which in turn tends to reduce
IJSW, 71(3), 387–415, July 2010
392 Mahua Bhattacharjee

income. Income is directly related to the amenities of decent living like
housing condition, electrification, sanitation and drinking water. Further,
expenditure on health acts as a significant income shock to households,
particularly among the flood-prone rural households. The size of the home-
stead is related to the creditability and decent living of the households,
while engagements in the non-primary sector lead to a higher income along
with improved standard of living and quality of life.
The results of the PCMA (see Appendix 3) shows that the four extracted
components altogether explain about 86% of the total variations and the
first two components account for more than half of the variations of the
model. The initial and rotated (by orthogonal varimax) component matrix
(see Appendices 5a and b) provides following the scheme of loadings on to
the components.
TABLE 1
Variables under the Different Components
Component 1:
Standard of Living
Component 2:
Livelihood Capital
Component 3:
Vulnerability
Component 4:
Livelihood Option
Drinking Water Homestead land Option during floods Work participation
rate
Electricity No health problem Violence against
women
Female literacy
Sanitation Literacy Dropout -
Health Expenses Credit Casualisation -
Working in a
non-primary sector
- - -
Housing - - -
Income - - -
Floods - - -
Based on this analysis, factor scores were obtained by using the method
suggested by Anderson and Rubin through SPSS programming (the factor
score matrix is presented in Appendix 5). One utility of the factor score is
that since it provides the coefficients of the linear equations of the variables
and component—revealing the relative importance of the variables to-
wards a particular component—it can be used to estimate the total factor
score of a case for a component. Using the factor score matrix, we have
IJSW, 71(3), 387–415, July 2010
A Comparative Study of Livelihood Strategies in Rural and Urban Assam 393

estimated the factor scores for all four components, along with the total
factor score for each of the sampled villages and towns. The mean scores
were then tested through independent sample t-test for rural (all villages
taken together) and urban (all towns taken together). The concise results
are presented in Table 2.
TABLE 2
Mean Scores of Independent Sample t-test
Component Area N Mean Std. Dev SE (Mean)
Standard of Living* Rural 7 -0.37 0.77 0.29
Urban 2 1.31 0.21 0.15
Livelihood Capital* Rural 7 0.32 0.87 0.33
Urban 2 -1.13 0.37 0.26
Vulnerability Rural 7 0.03 1.09 0.41
Urban 2 -0.12 0.89 0.63
Livelihood Strategy Rural 7 -0.03 1.13 0.43
Urban 2 0.11 0.49 0.35
Total Score Rural 7 -0.01 0.57 0.22
Urban 2 0.04 0.20 0.14
Note: *Significant at 5% level
The results indicate that, as far as the sustainability of livelihood as a
whole is concerned, there is no statistically significant difference among
rural and urban households. However, in terms of two specific compo-
nents—standard of living and livelihood capital—urban households have
scored more over rural households. It is due to the visible rural-urban di-
vide in terms of housing conditions and basic amenities and services, as
well as in terms of factors like literacy and access to credit.
Qualitative data analysis indicates that cultivation is not a favourable
livelihood strategy in rural Assam, as it once was, mainly due to high ex-
penditure structure and unsuitable weather conditions in the last five years.
This, in turn, is limiting work options for agricultural labour. Therefore,
they mostly migrate to nearby towns or cities as migration is the easiest op-
tion available before them. The difference between the agricultural la-
bour-dominated villages of Ganakpura (Kamrup) and Paschim Salpara
(Nagaon) is that the labour from the former district mostly out migrate
IJSW, 71(3), 387–415, July 2010
394 Mahua Bhattacharjee
permanently to the city or other states, while the labour from the latter dis-
trict migrate only temporarily to nearby places. This is because the villages
in Kamrup are better linked (by transport and middlemen) to the city and
other states, though the infrastructure condition of the villages themselves
are in a poor state. Families of the migrants stay back in the villages for the
sake of the children’s education as well as high living expenses in urban
areas.
In rural areas, a very insignificant percentage (3%) of households ex-
pressed satisfaction with the change. Rural households in Kamrup
(43.75%) and Nagaon (37%) districts believed that their condition had de-
graded or became worse in the last 10 years. Taking both the districts to-
gether, 41.66% of rural households expressed that changes were for the
worse. The remaining households considered there was no change in their
status. An equal percentage (37.5%) of agricultural labour from both dis-
tricts expressed that their condition had not changed or had became worse
(39%). Due to unfavourable weather conditions, the total area of land
under cultivated was shrinking, leading to restricted earnings and forcing
them to opt for the only other option available—to work as casual labour.
For this, they have to travel to other villages or towns and work as unskilled
labour at marginal wage rate.
In the cultivator-dominated villages of both the districts, unfavourable
climate and increasing cost of production were observed as the major rea-
son for the dissatisfaction. Limited rainfall had created drought-like situa-
tion in the villages in the two years prior to this study, bringing about an
unpredictable vulnerability in the livelihoods of cultivators and agricul-
ture-related households. Inadequate rainfall during the crop growing sea-
son is causing cultivators to only produce for subsistence. Droughts in
recent years have added to the uncertainty in addition to the floods in fields
of Assam. Unlike floods, droughts do not occur all of a sudden. From De-
cember 2002 to November 2003, rainfall was in a deficit by 466.9 mm
(Assam: Directorate of Agriculture, no date).
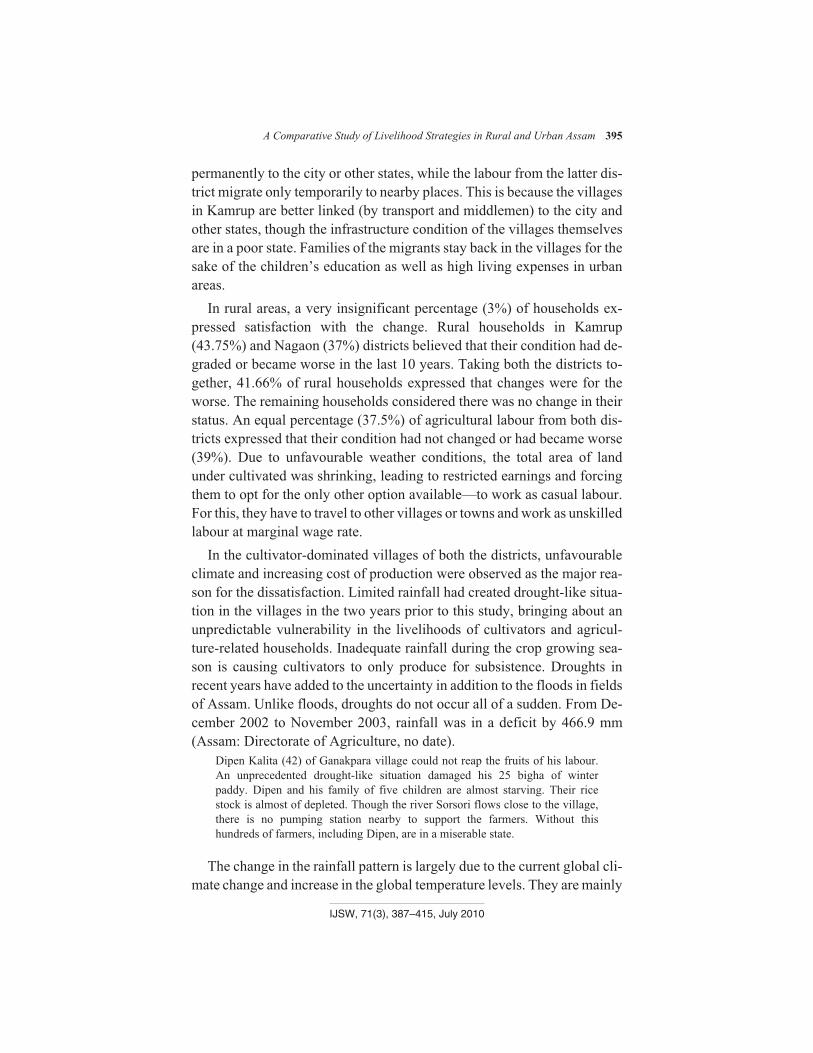
Dipen Kalita (42) of Ganakpara village could not reap the fruits of his labour.
An unprecedented drought-like situation damaged his 25 bigha of winter
paddy. Dipen and his family of five children are almost starving. Their rice
stock is almost of depleted. Though the river Sorsori flows close to the village,
there is no pumping station nearby to support the farmers. Without this
hundreds of farmers, including Dipen, are in a miserable state.
The change in the rainfall pattern is largely due to the current global cli-
mate change and increase in the global temperature levels. They are mainly
IJSW, 71(3), 387–415, July 2010
A Comparative Study of Livelihood Strategies in Rural and Urban Assam 395

the outcome of the imbalance between humans and their environments. In-
creasing human activities, depletion of forest cover, and over exploitation
of natural resources are badly affecting the weather cycle all over the
world. Livelihoods in Assam are also, thus, found to be affected by the im-
balances. Instances of depleting forest base were observed in the study area
itself. In Paschim Salpara, people used forest reserves as a coping strategy
during floods and other natural calamities. Rise in the price of kero-
sene/diesel, wage level and other inputs without a supportive price and
procurement policy is dragging cultivation from commercial to subsis-
tence earning. Lapses in irrigation facilities, credit availability and poor ac-
cess to the market has come out clearly in the agricultural practice of
villages in the study area. The acidic nature and poor nutrient content of the
soil in Assam, and high humidity levels limits crop varieties there. Humid-
ity levels lower the selling price and increases the risk of pests and dis-
eases. In this situation, the outdated techniques used by the farmers cannot
make way for commercial cultivation and for an improved way of living.
Among the urban households, almost 50.63% expressed satisfaction
with ‘change’. It is observed that 70% of the regular workers and 77.5% of
casual labour have expressed high satisfaction with this change. Increase in
the cash flow for higher wage rate, as compared to rural wage rate, is the
major reason for their high satisfaction. On the other hand, casual labour of
the villages believe that their livelihood is in a static state. Due to decline in
cultivation, an increasing number of agricultural labour are found to be
shifting to casual labour, leading to an increase in the percentage of casual
labours in the villages. Limited work opportunities in rural areas and in-
crease in the number of casual labour are forcing many to out migrate.
Those who have permanently out migrated to cities are improving the liv-
ing condition by sending remittances to their family members in the vil-
lages.
Urban labour in the unorganised sectors are mostly migrants. Factors
like repeated crop failures, increasing expenditure structure and absence of
subsidiary earning opportunities in the villages are pushing the labour to
nearby urban centres for liquid money. Cash becomes so important for
them, that living conditions and absence of work security becomes second-
ary. What matters to them is that their remittance is giving food to their
family members and better living standards. On examining the living con-
dition, it is found that 11% of the construction workers are dwelling in the
work place itself without drinking water, sanitation and other facilities. In
IJSW, 71(3), 387–415, July 2010
396 Mahua Bhattacharjee

the long run, this cannot be regarded as a sustainable way of living. About
52.5% of the self employed in urban areas considered they are living a
stagnant life due to increase in competition. About 13% of the self em-
ployed could not change their way of living due to illness as expenditure on
treatment was leading to huge loss of income which, in turn, is keeping
their livelihood in a static state.
Thus, we find that labour with comparably higher wage rates have found
temporary improvement, but without security and basic amenities. Such a
livelihood cannot lead to a sustainable livelihood. In a globalised world, they
are in a highly disadvantageous position as there is constant shift of technol-
ogy from labour to capital intensive and use of unskilled to skilled workers.
Thus, in the future they will need security for work, income and life so that
they can also contribute toward the success of globalisation.
In the commodity market, globalisation has influenced in increasing the
outlet with varieties and quality, which reduced the margin of profit and kept
the living condition of the self employed in the static state. Factors like low
profit margins, low self-esteem, and the need for high physical labour are re-
sponsible for keeping the younger generation away from the paddy fields.
Job expectations in the organised sector instigate the older generation to edu-
cate their children. With the limitation of absorption in the organised sector,
the additional young working group is pushed into the unorganised sector
who have to find work on self employment or remain as casual labour. Dur-
ing our previous discussion on livelihood strategies at the macro level, it has
been observed that a 10% increase in the self employed and a high decline in
the percentage of labour is evident in Assam. Casualisation obviously in-
creases vulnerability and makes livelihood unsustainable. The younger gen-
eration is getting into an unsustainable way of living, mainly because of the
poor development of the non-farm sector in rural areas and for not having
another option for livelihood. Remittances are not used for reinvestment and
a study by Lucas and Stark (1985) in Botswana has shown that it is not fa-
vourable for sustainability. The movement of the younger generation to
other places for jobs, increasing consumerism, and absence of reinvestment
in assets is ultimately making rural livelihoods unsustainable.
Saidul Huq, an 18-year old from Barpeta, has studied up to the Higher
Secondary level. He is a rickshaw-puller in Guwahati and stays with a friend
from his village. His parents earn Rupees 40,000 annually from growing
vegetables, while paddy cultivated on their land is sufficient for household
consumption. He has come to Guwahati to earn enough to buy a mobile phone.
Once he does that he will leave Guwahati, as he does not want to give up
cultivation.
IJSW, 71(3), 387–415, July 2010
A Comparative Study of Livelihood Strategies in Rural and Urban Assam 397

About 62% of the self employed in rural areas are found to be dissatis-
fied with the changes as they are the victims of ever-increasing competi-
tion and changed climatic condition. For example, the area used to do good
business in betel nuts, but now this is not so as the buyers have found that
the quality of betel nut has declined due to climatic changes. Better quality
of betel nuts from other areas have entered the market and are taking over.
Those self-employed on the basis of livestock lack definite skills and
knowledge, which leads them to incur heavy losses.
Akbar Hussain owner of Sikni factory (a factory in which betel nut is dried,
coloured and mixed with tobacco powder and other chemicals) is not making
the high profits he used to earn in the initial period. The profit margin of his
factory and other co-factory owners have declined as the number of factories
have increased and the quality of the betel nut has declined due to insufficient
rainfall. In addition, good quality products are entering from Indonesia,
Thailand and other places.
Umakanta Kalita, a teacher, also shared similar fate in a cultivator-dominated
village. He said that the business of making and selling mithoi (a kind of ball
shaped sweet made from rice flour, pepper and jaggery made from sugarcane)
was a good source of income, but he could not sustain it for long as the colour
of this sweet was dark in colour and unappealing. The same product coming
from Lanka, Khirani, and Barkula was not dark and, thus, had taken over the
market.
In weaving, too, women are facing a similar situation. Getanjali Bora, an
experienced weaver of Ganakpara, stated that at ‘One time we could not meet
the demand of the Mahajan. But now, they do not like us with cloth in hand.
They do not want to buy, but we give them the weave forcibly’. She adds that
‘in the present days, polyester has taken the market and thus people do not
prefer the eri (a kind of silk), which used to be in high demand at one point in
time’.
All the artisans feel that change has pushed them into a worse condition.
They do not have anything in life now, except poverty. Child labour and
sickness is common for them, and strong social taboos in the artisan vil-
lages has led them to poverty, pulling their children into the same trap.
On the basis of analysis on perception of ‘change’, Table 3 sums up the
problems and options of rural livelihood. It is evident from Table 3 that mi-
gration is a common option for the people in rural areas. The rural–urban
linkage, thus, plays an important role in the livelihood in rural areas. The
migrants mostly start as casual labourers and then get into regular work.
Very few of them start something of their own due to the limited capital
available. Selling assets as an option and, as shown in the table is highly
detrimental for livelihood as assets are also not only a source of earning,
IJSW, 71(3), 387–415, July 2010
398 Mahua Bhattacharjee

but are also an agent for ‘adequate and decent living’. Losing assets not
only makes livelihood insecure, but also leads to the loss of social status.
TABLE 3
Problems and Options of Rural Livelihoods
Occupation Problems Options
Cultivator • Increasing cost of
production
• Unfavourable weather
• Selling assets/ Migration
• Diversification
Agricultural labour • Seasonality
• Unfavourable weather
• Migration
Casual labour • Low wage
• Limited scope to work
• Migration
Artisans • Competition/Child labour
• Illness/ Social taboos
• Casual labour
Self employed • Competition
• Less skill
• Migration/selling assets
• Diversification
On comparing the average monthly remittances sent by the different
household types, we find that the self employed sends the highest amount
(Rupees 3,000), followed by the regular worker (Rupees 2,200), and the
casual labourer (Rupees 1,728.57). Among the three categories, the casual
labourer sends the highest percentage (70%) of remittances, followed by
the regular worker (62%) and self employed (15%). Migration and remit-
tances from migrants have become the major means by which the rural
poor gain access to higher economic opportunities. Yet, even though mi-
gration might assist in maintaining and even improving household in-
comes, the rural–urban flow of migrants do not necessarily create the basis
for long-term rural or urban development. Remittances do not find their
way into investments in infrastructure, market or other forms of economic
overheads needed for rural development (UNDP, 2000).
The Sikni factory is run almost completely by migrant workers of both sexes.
The factory has been in the village from the last 10 years and every year
workers come from nearby villages. There are 150 households who had settled
here temporarily on 1.5 bighas of land. They stay in this place from November
to May every year. All the workers are illiterate and the work is divided among
the men and women in the following manner: work which requires more
physical labour is obviously done by male members like putting the betel nuts
in the sun to dry, transporting them from one place to another, packing,
colouring, and so on. The female migrant workers clean and cut the betel nuts.
IJSW, 71(3), 387–415, July 2010
A Comparative Study of Livelihood Strategies in Rural and Urban Assam 399

For cleaning, women earn Rupees 25 per bag and male members earn Ru-
pees 1,500 per month. There is no fixed time for women to do the cleaning
work. The more they can do, the more they earn. As this is a seasonal crop,
many of the women work overnight as earnings are limited for a few months
of the year. The women also have to manage the household work and
childcare responsibilities. Male workers work from 7 a.m. to 7 p.m. Almost all
these workers do not have homestead land and a few of them have half a kata
(1 bigha = 5 katas) or less than that. Female workers also earn from the outer
covering of the betel nut in the off season at Rupees 15 per bag or by stitching
katha (layers of cloth pieces stitched together, mainly used for children).
Chemicals used in the factory are disposed carelessly and stomach dis-
orders and fever are common among the workers. Physically, the wives are
assaulted regularly and they take it very easily as part of life. It is common
for the wife to run away from her ‘Daurain dain’ or husband to escape from
his beatings.
A quick study of the living conditions reveal lack of electricity, one tube
well and one kachaa toilet. The workers consider these facilities to be more
than what is available in their own homes. They feel that, over time, their
condition has improved as they own livestock like goat and poultry, which
helps in sustaining them during periods when they have no work. Since
they do not have a ration card—which could help them access the public
distribution system—the workers have to buy goods at the market price.
They do not buy fuel as they use the betel nut covering, which they get dur-
ing the season period.
Table 4 indicates the problem and option of livelihoods in urban areas.
The casual labourers and regular workers of urban areas are in a more vul-
nerable state as they do not have any option to come out of the problem of
living without basic amenities.
TABLE 4
Problems and Options of Urban Livelihoods
Occupation Problems Options
Self employed Competition, Illness Diversification
Casual labour/Regular worker Absence of basic amenities None
Income is one of the key factors for a sustainable livelihood. To under-
stand the difference in income, a comparative study of average monthly in-
come by occupation is presented in Table 5.
IJSW, 71(3), 387–415, July 2010
400 Mahua Bhattacharjee

IJSW, 71(3), 387–415, July 2010

By comparing Table 5 and Table 6, gender discrimination in wage and
other earnings is clearly evident. Due to the many household constraints
and sickness, women cannot regularly go out to work. They also have to
take a break to nurse their children during work. This reduces their average
monthly earnings.
In rural areas, the women mostly work as weavers, agricultural labour, sell
liquor, and factory workers. Women find less opportunity for diversification
in villages. While men migrate and take up new employment opportunities,
women in rural areas find themselves at a relatively disadvantageous position.
Agricultural labour remains an easy option before them. Due to the large num-
bers of female agricultural labourers in 2004–2005, the percentage of female
agricultural labour in India was 72.8%, while the corresponding figure for
males was much lower at 48.9% (Sengupta, 2007).
In urban areas, more women are stepping out of their homes to add to
their limited household income. This enables them to meet the educational
and other expenditure of children.
Anjali Debi is a 36-year old woman who works in a printing press at Guwahati
and earns Rupees 35 daily (not regularly, but only when there are orders in the
press). She starts every day with the uncertainty of whether there will be work for
her or not. Her husband had a shop, which burnt down in a fire. Since her husband
suffers from high blood pressure, he cannot work in any other place. Somehow,
Anjali Debi helped him to start a shop near the railway gate. Her daughter is in
college and she wants her to study further. She says ‘I know my daughter will get
a job with her education. At least she will be able to live and will come out of any
problem in the near future.’ Every day is a struggle for the family.
Afia is a 20-year old girl from the agricultural labour dominated village of
Paschim Salapar and has nine brothers and sisters. Her father earns a livelihood
from farming, fishery and livestock. The father had a sewing machine and
encouraged Afia to take up tailoring as he wanted her to be self reliant. She has
done a certificate course in tailoring by staying at her uncle’s place in Nagaon
town. During Id or other such other festivals, she earns around Rupees 500, which
helps her to cover her expenditure on cosmetics. She has freedom to spend what
she earns on herself. Her cousin, Aktara is an embroiderer and earns Rupees
100–200 per month. Since not much significance is given to embroidery in the
region, Aktara does not get too many orders. In spite of having a certificate, Afia
has not been able to qualify for a loan, as she and her parents lack contact with
political power and the middlemen who manage the loan. Two girls from Afia’s
village, and who cannot stitch, have got loans for buying a sewing machine. Afia
wants to work more and earn for the future for which she needs to buy a new
machine as the current one is old and needs constant repairing.
To overcome various problems and challenges in livelihoods, diversifica-
tion in strategies are recommended for sustainable living. Diversification re-
duces dependence on one source of livelihood and reduces vulnerability to
IJSW, 71(3), 387–415, July 2010
402 Mahua Bhattacharjee

specific stresses and shocks. Both rural and urban poor households can di-
versify their sources of income and carry out a portfolio of activities—
formal waged employment, informal trading, service activities, and so on,
with different family members engaging in them. But in this context it is to
be noted that engaging in too many activities can mean that households are
not able to invest sufficient time or resources in any one activity to make it
profitable. Thus, with proper balancing and study of market activities, diver-
sifications are to be taken up.
Injam Ali (42) is a father of four children. He owns 10 bighas of land on which
his preferred means of living was from summer paddy. But with increasing
expenditure, he is trying various alternatives. Two years back he made money
by selling jute at a higher price. With minimum capital of Rupees 20,000 he
purchased 90 mon (1 mon = 50 kg) of jute at Rupees 220/mon and after two
months he sold it at Rupees 440/mon. With this money, he reinvested in
poultry, which did not give a satisfactory return due to disease among the
chicken. He then entered into betel nut business and recovered the loss.
Recently, he has discovered that cultivation of bananas would be profitable and
has since then decided to cultivate banana on his land. He states, ‘the moment
business of particular thing is started—jute, betel nut—profit starts to flow. But
this continues only for a very short time, as the number of people doing the
same business increases leading to decline in profit margins. Constant
vigilance in the market and continuous change in alternative product for
business is essential for living in this area’. The living condition of Ali is better
than that of other villagers. He owns a pucca house with good water and
electricity facilities. Thus, Ali has turned an unfavourable situation to his
favour by keeping himself open to change and constantly diversifying his
source of income.
DISCUSSION
It is clear that, presently, cultivation is not a preferred livelihood strategy.
The self employed in the village are found to be in a better state and from the
secondary data we find they are in the highest percentage in rural Assam. It is
also seen that the successful self employed or cultivators are those who have
followed diversification in livelihood strategy. Constant vigilance of the
market and change accordingly is the prerequisite for sustaining any liveli-
hood strategy. Influence of competition is very strongly understood in rural
and urban livelihoods. With improved transport and communication, mobil-
ity has also increased and touched every activity of livelihood. In both rural
and urban areas, except casual labour of urban areas, very few from the rest
of the occupations could add asset holding significantly as done by the ear-
lier generation. Addition is done more in durables through various means
(selling livestock, loan from friends, father’s savings) for social status. The
artisans seem to be most hit among all the occupations by the wave of
IJSW, 71(3), 387–415, July 2010
A Comparative Study of Livelihood Strategies in Rural and Urban Assam 403

changes as poverty along with child labour is common in such villages. The
skill, which could have been an asset for them, is of less use now as easily
available, substitute products have come into the market.
Age is found to be another determining factor influencing livelihood ac-
tivity. Senior workers pull on with the previous system as they can neither
migrate nor can try new things. Thus, they cannot add new assets but remain
as they were. The middle aged group, by trying diversification in cultivation
or business or any other thing, could add to their assets and improve rhwie
living condition. In all the study villages of both districts, the younger gener-
ation is in the most depressing conditions. Most of them do not want to get
into cultivation as it demands hard physical labour and poor cash returns. In-
stead, they hope to get white collar jobs in towns or cities after completing
their education. The data on urban area shows that when youngsters mi-
grated to Guwahati they hoped for such jobs, but ended up working as casual
labourers, where they live in a poor state. It was interesting to know that they
were happy as they were getting cash in addition to a taste of city life. Those
who stay back in the village lead a more frustrating life as there is nothing
except cultivation. Alcoholism is a major problem of this group in cultiva-
tor-dominated villages of Nagaon district.
The status of women is seen to differ in the village on the basis of reli-
gious background. Women in Muslim-dominated villages rarely perform
any other activity other than household work. The girl child is educated to
get a good husband. But now some young girls are trying to earn by various
means. Weaving is common practice in Assamese villages. But here too we
see the influence of competition from substitute products, which limit their
income. Even then women now feel that their status has improved as they
alone handle the cash and have a strong support of organisation. Compared
to the earlier generation, they find themselves to be in a better state. It is to
be noted that as far as violence against women is concerned, wife beating is
common in most of the villages. No gender discrimination was observed in
the field of education.
The data on secondary and primary livelihood activities makes it clear
that in both rural and urban areas, self employment is gradually increasing.
Poverty in rural livelihoods is very prominent and is forcing agricultural la-
bour to take up other occupations, leading to a decline in its percentage.
The PCA has also scored rural households low for poor housing conditions
and on parameters like literacy and access to credit. Influence of
liberalisation can be very clearly understood from the analysis—
IJSW, 71(3), 387–415, July 2010
404 Mahua Bhattacharjee

availability of variety, easy accessibility and wide price ranges of product
has brought significant change in rural livelihood activities.
Figure 2 clearly indicates that diversification and credit support is essen-
tial for sustainable livelihood. The response to subsistence earning has two
diverse paths: (i) continuation of the strategy of the earlier period, which
leads to unsustainable livelihood with less resilience to shocks and
stresses; and (ii) diversification with credit support. Constant vigilance on
the market structure and adopting change in a positive manner leads to
higher security and sustainability of livelihood. To sustain livelihood, it
compelled the household by type and gender to be vigilant and diversify
their activities. The working population of all the types accepted that liveli-
hood is not as easy as it was during their previous generation.
The major reasons are unsuitable weather for cultivation, fluctuation of
prices, competition from better/substitute/cheap products and, lastly, the
reluctant attitude of the young generation towards undertaking livelihood
activities of rural areas. The interdependence of livelihood in rural and
urban areas is gaining importance and linkage is influencing the livelihood
of rural and urban areas both in positive and negative ways.
CONCLUSION
The above discussion draws out the following points of livelihood strate-
gies in Assam:
• Unfavourable weather, increasing expenditure structure, and reduced
size of cultivable land is making the livelihood of cultivators stressful.
Lack of mechanisation is mainly responsible for such a backdrop.
• Unemployment problem is frustrating the younger generation which,
to some extent, is responsible in increasing the problem of alcoholism.
• The younger generation want to try something other than cultivation.
• Agricultural and casual labourers are in the most stressful situation
with minimum asset holding and reduced work options. They get
compelled to out migrate in this situation.
• Enough scope is noted in the development of self-help groups of women
as they have a strong urge to do something in an organised manner.
• Artisans are in the worst state with poor sanitation, child labour, and
indebtedness common among their households.
• Organisational weakness and weak market structure has led to the
active participation of middlemen, which works as a depressing
factor in reinvestment and diversification.
IJSW, 71(3), 387–415, July 2010
A Comparative Study of Livelihood Strategies in Rural and Urban Assam 405

IJSW, 71(3), 387–415, July 2010
406 Mahua Bhattacharjee
In such a background, an integrated participatory process, with central,
state, and local government agencies sharing the responsibilities with local
residents and their representatives are required for long-term, need-based
development programme.
REFERENCES
Assam: Directorate of :
Economics and Statistics
2001
Statistical Handbook of Assam, Guwahati.
Assam: Directorate of :
Agriculture
no date
Available online at www.assamagribusiness.nic.in/statistical/
20Handbook/climate.pdf. Accessed on June 4, 2009.
Department for :
International
Development
2000a
Sustainable Livelihoods Guidance Sheet. Available online at
www.livelihood.org/info/info_guidancesheets.htm (Retrieved
October 12, 2004).
2000b : Sustainable Livelihoods and Poverty Elimination, Sustainable
Livelihood Guidance Sheet. Available online at www.liveli
hood.org/info/info_guidancesheets.htm. Accessed on October
12, 2004.
Fan, S., Fang, C. and :
Zhang, X.
2007
Master Plan for Guwahati Metropolitan 2025 (Revised Draft,)
New Delhi: Consulting Engineering Services (I) Private Limited.
India: Department of :
Statistics
1993–1994
Sources of Household Income in India 1993–1994, 50th Round,
Report No. 413, Fifth Quinquennial Survey, New Delhi.
1994–1995 : Household Consumer Expenditure and Employment Situation in
India 1994–1995, 51st Round, Revised Report No. 436(51/1.0/1)
, New Delhi.
1995–1996 : Household Consumer Expenditure and Employment Situation
in India 1995–1996, 52nd Round, Report No. 440(52/1.0/1),
New Delhi.
1997 : Household Consumer Expenditure and Employment Situation in
India 1997, 53rd Round, Report No. 442(53/1.0/1), New Delhi.
1999–2000a : Sources of Household Income in India 1999–2000, 55th Round,
Report No. 463 (55/1.0/5), New Delhi.
1999–2000b : Employment and Unemployment in India 1999–2000, Key
Results, 55th Round, Report No. 455(55/10/1), New Delhi.
2000–2001 : Household Consumer Expenditure and Employment Situation
in India 2000–2001, 56th Round Revised Report No. 476
(56/1.0/1) New Delhi.
IJSW, 71(3), 387–415, July 2010
A Comparative Study of Livelihood Strategies in Rural and Urban Assam 407

2001–2002 : Household Consumer Expenditure and Employment-
Unemployment Situation 2001–2002, 57th Round, Report No.
481 (57/1.0/1), New Delhi.
2004–2005a : Employment and Unemployment Situation in India 2004–2005
(Part I), 61st Round, Report No. 515(61/10/1) New Delhi.
2004–2005b : Employment and Unemployment Situation in India 2004-2005
(Part II), 61st Round, Report No. 515 (61/10/1), New Delhi.
Lucas, R. and Stark, O. :
1996
Involving Women in Sustainable Development: Livelihoods
and Conservation. In D.C. Pirages (Ed.), Building Sustainable
Societies: A Blue Print for a Post Industrial World, New York:
M.E. Sharpe Publications, 207–218.
Quisumbing, A.R., :
Brown, L.R.,
Feldstein, H.S.,
Haddad, L. and Pena, C.
1995
Women: The Key to Food Security, Food Policy. Available
online at www.siteresources.worldbank.org [Retrieved March
18, 2009].
Sengupta, A.K. :
1986
Women's Work, Class and the Urban Household: A Study of
Shimla, North India, London: Tavistock Publications.
2007 : Report on Condition of Work and Promotion of Livelihoods in
Unorganised Sector. Available on www.nceuis.nic.in/condition_
of_workers_Sep_2007.pdf. [Retrieved April 12, 2009]
United Nations :
Development
Programme
2000
Rural–Urban Linkages: An Emerging Policy Priority. Available
online at www.undp.org. Accesses on September 2, 2005.
IJSW, 71(3), 387–415, July 2010
408 Mahua Bhattacharjee

APPENDIX 1Values of indicators for Principal Component Analysis
Pa
chim
Sa
lpa
ra
Ch
ako
riG
ao
n
Ku
chG
ao
n
Bh
aka
tga
on
Ka
lap
an
i
Ga
na
kpa
ra
Dh
op
gu
ri
Na
ga
on
To
wn
Gu
wa
ha
tiT
ow
n
Flood 100.00 20.00 35.00 23.00 100.00 100.00 13.00 5.00 0.00
Option 67.00 2.00 9.50 0.00 6.00 14.50 78.00 0.00 0.00
Casual 57.50 7.60 27.50 30.00 65.00 60.00 45.00 20.00 33.00
Violence 75.00 43.00 12.00 2.00 15.00 68.00 79.50 12.50 77.50
Homestead 1.65 2.64 1.75 1.40 1.53 1.31 1.85 0.75 0.34
Literacy 72.34 95.19 77.00 75.96 44.94 79.89 79.60 54.78 70.50
Dropout 57.50 32.50 29.68 40.63 16.22 72.50 53.85 12.22 14.00
Health Exp. 817.50 612.50 445.00 720.00 0.00 412.50 362.50 2200.50 3100.00
Credit 7.14 53.85 9.52 0.00 0.00 15.38 27.78 7.22 6.82
Non-Primary 25.00 53.08 26.38 44.00 5.66 20.22 18.98 75.00 31.80
WPR 53.07 57.44 58.53 42.60 62.35 77.53 55.95 53.01 56.98
Income 37838.75 57702.50 27672.75 59881.00 24373.00 23529.50 58161.00 52228.50 43553.83
No Health 32.50 55.00 32.50 10.00 15.00 10.00 25.00 2.50 0.00
Female Lit. 72.56 94.79 80.66 33.33 52.08 77.42 75.23 63.21 77.93
Non-Kutcha 27.50 77.50 15.00 40.00 10.00 47.50 55.00 47.50 35.83
Electricity 37.50 70.00 35.00 35.00 0.00 7.50 0.00 77.50 83.33
DW 15.00 45.00 0.00 5.00 0.00 32.50 25.00 57.50 40.00
Sanitation 0.00 50.00 10.00 15.00 0.00 5.00 10.00 65.00 18.33
IJSW, 71(3), 387–415, July 2010
A Comparative Study of Livelihood Strategies in Rural and Urban Assam 409

IJSW, 71(3), 387–415, July 2010
410 Mahua Bhattacharjee
AP
PE
ND
IX2
Co
rrel
ati
on
Ma
trix
of
the
Sel
ecte
dV
ari
ab
les
Co
rrel
ati
on
Flo
od
Op
tio
nC
asu
al
Vio
-le
nce
Ho
me-
stea
dL
ite-
racy
Dro
p-
ou
tH
ealt
hE
xp.
Cre
dit
No
n-
Pri
ma
ryW
PR
Inco
me
No
Hea
lth
Fem
ale
Lit
.N
on
-K
utc
ha
Ele
c-tr
icit
yD
WS
an
i-ta
tio
n
Flo
od
1.0
00
.22
3.8
15
.11
6.1
82
-.2
44
.47
9-.
56
9-.
26
4-.
62
2.5
29
-.7
41
.08
6-.
09
8-.
44
8-.
61
3-.
45
8-.
63
1
Op
tio
n.2
23
1.0
00
.43
9.6
21
.28
1.1
72
.59
3-.
30
9.1
33
-.4
04
-.0
39
.10
0.2
77
.17
9.0
36
-.4
67
-.1
59
-.4
24
Cas
ual
.81
5.4
39
1.0
00
.33
2-.
14
6-.
42
0.4
44
-.3
77
8-.
47
7-.
80
7.4
58
-.6
42
-.2
80
-.2
55
-.5
44
-.7
49
-.4
72
-.8
07
Vio
len
ce.1
16
.62
1.3
32
1.0
00
-.0
51
.36
5.5
00
.18
4.3
10
-.3
46
.35
6-.
01
5.0
74
.55
6.2
91
-.0
62
.31
0-.
29
1
Ho
mes
tead
.18
2.2
61
-.1
46
-.0
51
1.0
00
.55
1.3
55
-.7
66
.69
4-.
13
0.0
17
.14
3.9
25
.32
5.3
37
-.3
20
-.2
46
-.0
34
Lit
erac
y-.
24
4.1
72
-.4
20
.36
5.5
51
1.0
00
.52
5-.
16
1.7
29
.11
5.0
33
.36
0.8
09
.55
4.6
57
.12
1.1
67
.07
3
Dro
po
ut
.47
9.5
93
.44
4.5
00
.35
5.5
25
1.0
00
-.5
11
.19
5-.
36
5.3
51
-.1
13
.23
2.1
43
.22
9-.
55
9-.
15
5-.
47
7
Hea
lth
Ex
p.
-.5
69
-.3
09
-.3
78
.18
4-.
76
6-.
16
1-.
51
11
.00
0-.
19
2.5
09
-.2
36
.26
0-.
52
7.0
89
.10
6.8
10
.62
0.4
58
Cre
dit
-.2
64
.13
3-.
47
7.3
10
.69
4.7
29
.19
5-.
19
21
.00
0.2
19
.16
1.4
04
.73
8.7
15
.81
4.1
59
.45
2.4
09
Non-P
rim
ary
-.6
22
-.4
04
-.8
07
-.3
46
-.1
30
.11
5-.
36
5.5
09
.21
91
.00
0-.
44
5.6
19
-.0
36
.01
0.5
34
.77
0.6
76
.92
8
WP
R.5
29
-.0
39
.45
8.3
56
.01
7.0
33
.35
1-.
23
6.1
61
-.4
45
1.0
00
-.7
09
-.0
30
.46
7-.
01
5-.
37
0.1
23
-.2
55
Inco
me
-.7
41
.10
0-.
64
2-.
01
5.1
43
.36
0-.
11
3.2
60
.40
4.6
19
-.7
09
1.0
00
.13
3-.
10
2.6
85
.40
5.4
06
.56
1
No
Hea
lth
.08
6.2
77
-.2
80
.07
4.9
25
.60
9.2
32
-.5
27
.73
8-.
03
6-.
03
0.1
33
1.0
00
.55
2.3
23
-.0
41
-.1
20
.05
4
Fem
ale
Lit
.-.
09
8.1
79
-.2
55
.55
6.3
25
.55
4.1
43
.08
9.7
15
.01
0.4
67
-.1
02
.55
21
.00
0.4
08
.26
0.4
45
.19
6
No
n-K
utc
ha
-.4
48
.03
6-.
54
4.2
91
.33
7.6
57
.22
9.1
06
.81
4.5
34
-.0
15
.68
5.3
23
.40
81
.00
0.3
21
.71
8.6
08
Ele
ctri
city
-.6
13
-.4
67
-.7
49
-.0
62
-.3
20
.12
1-.
55
9.8
10
.15
9.7
70
-.3
70
.40
5-.
04
1.2
60
.32
11
.00
0.6
38
.72
6
DW
-.4
58
-.1
59
-.4
72
.31
0-.
24
6.1
67
-.1
55
.62
0.4
52
.67
6.1
23
.40
6-.
12
0.4
45
.71
8.6
38
1.0
00
.77
9
San
itat
ion
-.6
31
-.4
24
-.8
07
-.2
91
-.0
34
.07
3-.
47
7.4
58
.40
9.9
28
-.2
55
.56
1.0
54
.19
6.6
08
.72
6.7
79
1.0
00

IJSW, 71(3), 387–415, July 2010
A Comparative Study of Livelihood Strategies in Rural and Urban Assam 411
Sig
.(I
tail
ed)
Flo
od
Op
tio
nC
asu
al
Vio
-le
nce
Ho
me-
stea
dL
ite-
racy
Dro
p-
ou
tH
ealt
hE
xp.
Cre
dit
No
n-
Pri
ma
ryW
PR
Inco
me
No
Hea
lth
Fem
ale
Lit
.N
on
-K
utc
ha
Ele
c-tr
icit
yD
WS
an
i-ta
tio
n
Flo
od
.28
2.0
04
.38
4.3
20
.26
4.0
96
.05
5.2
46
.03
7.0
72
.01
1.4
13
.40
1.1
13
.03
9.1
08
.03
4
Op
tio
n.2
82
.11
9.0
37
.23
2.3
29
.04
6.2
09
.36
6.1
40
.46
1.3
99
.23
5.3
23
.46
4.1
02
.34
1.1
28
Cas
ual
.00
4.1
19
.19
1.3
54
.13
0.1
16
.15
8.0
97
.00
4.1
08
.03
1.2
33
.25
4.0
65
.01
0.1
00
.00
4
Vio
len
ce.3
84
.03
7.1
91
.44
8.1
67
.08
5.3
17
.20
9.1
81
.17
3.4
85
.42
5.0
60
.22
4.4
37
.20
9.2
24
Ho
mes
tead
.32
0.2
32
.35
4.4
48
.06
2.1
75
.00
8.0
19
.38
9.4
83
.35
7.0
00
.19
7.1
88
.20
0.2
62
.46
5
Lit
erac
y.2
64
.32
9.1
30
.16
7.0
62
.07
4.3
40
.01
3.3
84
.46
6.1
71
.04
1.0
61
.02
7.3
78
.33
3.4
26
Dro
po
ut
.09
6.0
46
.11
6.0
85
.17
5.0
74
.08
0.3
07
.16
7.1
77
.38
6.2
74
.35
7.2
77
.05
9.3
45
.09
7
Hea
lth
Ex
p.
.05
5.2
09
.15
8.3
17
.00
8.3
40
.08
0.3
10
.08
1.2
71
.24
9.0
72
.41
0.3
93
.00
4.3
8..1
08
Cre
dit
.24
6.3
66
.09
7.2
09
.01
9.0
13
.30
7.3
10
.28
6.3
39
.14
0.0
12
.01
5.0
04
.34
2.1
11
.13
7
Non-P
rim
ary
.03
7.1
40
.00
4.1
81
.36
9.3
84
.16
7.0
81
.28
6.1
15
.03
8.4
63
.48
9.6
9.0
08
.23
.00
0
WP
R.0
72
.46
1.1
08
.17
3.4
83
.46
6.1
77
.27
1.3
39
.11
5.0
16
.47
0.1
03
.48
5.1
63
.37
6.2
54
Inco
me
.01
1.3
99
.03
1.4
85
.35
7.1
71
.38
6.2
48
.14
0.0
38
.01
6.3
67
.39
7.2
1.1
40
.13
9..0
58
No
Hea
lth
.41
3.2
35
.23
3.4
25
.00
0.0
41
.27
4.0
72
.01
2.4
63
.47
0.3
67
.06
2.1
98
.45
8.3
79
.44
6
Fem
ale
Lit
..4
01
.32
3.2
54
.06
0.1
97
.06
1.3
57
.41
0.0
15
.48
9.1
03
.39
7.0
62
.13
8.2
50
.11
5.3
07
No
n-K
utc
ha
.11
3.4
64
.06
5.2
24
.18
8.0
27
.27
7.3
93
.00
4.0
69
.48
5.0
21
.19
8.1
38
.20
0.0
15
.04
1
Ele
ctri
city
.03
9.1
02
.01
0.4
37
.20
0.3
78
.59
.00
4.3
42
.00
8.1
63
.14
0.4
58
.25
0.2
00
.03
2.0
13
DW
.10
8.3
41
.10
0.2
09
.26
2.3
33
.34
5.0
38
.11
1.0
23
.37
6.1
39
.37
9.1
15
.01
5.0
32
.00
7
San
itat
ion
.34
3.1
28
.00
4.2
24
.46
5.4
26
.09
7.1
08
.13
7.0
00
.25
4.0
58
.44
6.3
07
.04
1.0
13
.00
7

APPENDIX 3Values of the Indicators for Principal Component Analysis
Pa
chim
Sa
lpa
ra
Ch
ako
riG
ao
n
Ku
chG
ao
n
Bh
aka
tga
on
Ka
lap
an
i
Ga
na
kpa
ra
Dh
op
gu
ri
Na
ga
on
To
wn
Gu
wa
ha
tiT
ow
n
Flood 100.00 20.00 35.00 23.00 100.00 100.00 13.00 5.00 0.00
Option 67.00 2.00 9.50 0.00 6.00 14.50 78.00 0.00 0.00
Casual 57.50 7.60 27.50 30.00 65.00 60.00 45.00 20.00 33.00
Violence 75.00 43.00 12.00 2.00 15.00 68.00 79.50 12.50 77.50
Homestead 1.65 2.64 1.75 1.40 1.53 1.31 1.85 0.75 0.34
Literacy 72.34 95.19 77.00 75.96 44.94 79.89 79.60 54.78 70.50
Dropout 57.50 32.50 29.68 40.63 16.22 72.50 53.85 12.22 14.00
Health Exp. 817.50 612.50 445.00 720.00 0.00 412.50 362.50 2200.50 3100.00
Credit 7.14 53.85 9.52 0.00 0.00 15.38 27.78 7.22 6.82
Non Primary 25.00 53.08 26.38 44.00 5.66 20.22 18.98 75.00 31.80
WPR 53.07 57.44 58.53 42.60 62.35 77.53 55.95 53.01 56.98
Income 37838.75 57702.50 27672.75 59881.00 24373.00 23529.50 58161.00 52228.50 43553.83
No health 32.50 55.00 32.50 10.00 15.00 10.00 25.00 2.50 0.00
Female Lit. 72.56 94.79 80.66 33.33 52.08 77.42 75.23 63.21 77.93
Non-kutcha 27.50 77.50 15.00 40.00 10.00 47.50 55.00 47.50 35.83
Electricity 37.50 70.00 35.00 35.00 0.00 7.50 0.00 77.50 83.33
DW 15.00 45.00 0.00 5.00 0.00 32.50 25.00 57.50 40.00
Sanitation 0.00 50.00 10.00 15.00 0.00 5.00 10.00 65.00 18.33
IJSW, 71(3), 387–415, July 2010
412 Mahua Bhattacharjee

IJSW, 71(3), 387–415, July 2010
A Comparative Study of Livelihood Strategies in Rural and Urban Assam 413
AP
PE
ND
IX4
Res
ult
sof
the
Pri
nci
pal
Com
pon
ent
An
aly
sis:
Tota
lV
ari
an
ceE
xp
lain
ed
Co
mp
on
ent
Init
ial
Eig
enV
alu
esE
xtra
ctio
nS
um
so
fS
qu
are
dL
oa
din
gs
Ro
tati
on
Su
ms
of
Sq
ua
red
Lo
ad
ing
s
To
tal
Per
cen
tag
eo
fV
ari
an
ceC
um
ula
tive
Per
cen
tag
e%T
ota
lP
erce
nta
ge
of
Va
ria
nce
Cu
mu
lati
veP
erce
nta
ge
To
tal
Per
cen
tag
eo
fV
ari
an
ceC
um
ula
tive
Per
cen
tag
e
Flo
od
6.6
62
37
.01
13
7.0
11
6.6
62
37
.01
13
7.0
11
6.1
77
34
.31
63
4.3
16
Op
tio
n4
.77
22
6.5
13
63
.52
44
.77
22
6.5
13
63
.52
44
.27
32
3.7
39
58
.05
4
Cau
sal
2.4
33
13
.51
47
7.0
38
2.4
33
13
.51
47
7.0
38
2.7
24
15
.13
37
3.1
87
Vio
len
ce1
.69
29
.40
38
6.4
40
1.6
92
9.4
03
86
.44
02
.38
61
3.2
53
86
.44
0
Ho
mes
tead
1.0
02
5.5
65
92
.00
6-
--
--
-
Lit
erac
y.6
76
3.7
55
95
.76
1-
--
--
-
Dro
po
ut
.49
92
.77
29
8.5
33
--
--
--
Hea
lth
Ex
p.
.26
41
.46
71
00
.00
0-
--
--
-
Cre
dit
9.3
8E
-01
65
.21
E-0
15
10
0.0
00
--
--
--
No
n-P
rim
ary
4.0
3E
-01
62
.24
E-0
15
10
0.0
00
--
--
--
WP
R2
.17
E-0
16
1.2
0E
-01
51
00
.00
0-
--
--
-
Inco
me
1.2
3E
-01
66
.81
E-0
16
10
0.0
00
--
--
--
No
Hea
lth
7.0
5E
-01
73
.92
E-0
16
10
0.0
00
--
--
--
Fem
ale
Lit
.-1
.38
E-0
16
-7.6
6E
-01
61
00
.00
0-
--
--
-
No
n-k
utc
ha
-1.5
6E
-01
6-8
.68
E-0
16
10
0.0
00
--
--
--
Ele
ctri
city
-2.6
0E
-01
6-1
.44
E-0
15
10
0.0
00
--
--
--
DW
-4.0
8E
-01
6-2
.27
E-0
15
10
0.0
00
--
--
--
San
itat
ion
-6.9
2E
-01
6-3
.84
E-0
15
10
0.0
00
--
--
--
No
te:
Ex
trac
tio
nM
eth
od
:P
rin
cip
alC
om
po
nen
tA
nal
ysi
s.

APPENDIX 5Initial Component Matrix
Component Matrix (a)
Component
1 2 3 4
Flood -.825 .120 .078 -.253
Option -.370 .494 .127 .625
Casual -.916 -.071 .278 .135
Violence -.123 .488 .744 .364
Homestead -.065 .806 -.545 -.172
Literacy .304 .796 -.018 .097
Dropout -.447 .634 .163 .314
Health Exp. .601 -.507 .537 .147
Credit .459 .841 .000 -.173
Non-Primary .892 -.164 -.105 -.021
WPR -.417 .280 .580 -.561
Income .725 .155 -.280 .574
No health .084 .804 -.399 -.221
Female Literacy .254 .657 .464 -.358
Non-kutcha .672 .586 .127 .131
Electricity .846 -.239 .182 -.116
DW .747 .095 .563 -.054
Sanitation .910 -.063 -.030 -.208
Note: Extraction Method: Principal Component Analysis; 4 components extracted.
IJSW, 71(3), 387–415, July 2010
414 Mahua Bhattacharjee

Rotated Component Matrix (b)
Compnent
1 2 3 4
Flood -.744 -.015 .054 .457
Option -.356 .165 .773 -.192
Casual -.772 -.368 .346 .299
Violence .095 .012 .909 .323
Homestead -.271 .949 -.030 -.076
Literacy .240 .727 .386 -.028
Dropout -.409 .331 .665 .094
Health Exp. .761 -.587 .073 .003
Credit .402 .847 .217 .144
Non-Primary .812 .062 -.281 -.303
WPR -.185 .061 .150 .918
Income .556 .244 .188 -.744
No health -.080 .925 -.003 .013
Female Literacy .380 .505 .299 .591
Non-kutcha .642 .543 .338 -.087
Electricity .872 -.106 -.211 -.053
DW .888 -.006 .218 .223
Sanitation .858 .166 -.317 -.110
Note: Extraction Method: Principal Component Analysis. Rotation Method: Varimax with Kaiser
Normalization.Rotation converged in 8 iterations.
IJSW, 71(3), 387–415, July 2010
A Comparative Study of Livelihood Strategies in Rural and Urban Assam 415