a comparative study of mass and energy exchange over a closed c3
TRANSCRIPT

Agricultural and Forest Meteorology, 67 (1994) 191-220 191 Elsevier Science Publishers B.V., Amsterdam
A comparative study of mass and energy exchange over a closed C3 (wheat) and an open C4 (corn)
canopy: I. The partitioning of available energy into latent and sensible heat exchange
Dennis Baldocchi
Atmospheric Turbulence and Diffusion Division, NOAA, P.O. Box 2456, Oak Ridge, TN 37831, USA
(Received 23 October 1992; revision accepted 15 July 1993)
Abstract
Eddy correlation measurements of mass and energy were made simultaneously over a closed wheat and an open corn crop. This combination of crops, differing in canopy coverage and stomatal physiology, facilitated an investigation on how surface and environmental variables control the partitioning of net radiation into sensible, latent and soil heat exchange.
Contrasts in canopy closure had a minor affect on the flux densities of net radiation (Rn) measured over open corn and closed wheat canopies. On the other hand, differences in canopy closure perturbed the partitioning of net radiation into sensible, latent and soil heat exchange. On average, measurements of latent heat flux densities (LE) over the sparse corn canopy were 59% less than LE measured over the closed wheat crop. Compensation for this bias caused greater flux densities of sensible (H) and soil (G) heat to be generated from the sparse corn canopy. Sensible heat flux densities were, on average, 22% greater over the open corn canopy. During the day, soil heat flux densities were, on average, 64% greater under the corn canopy than under the wheat.
Available energy (A) governed daytime latent heat flux densities over the closed wheat canopy. Conse- quently, LE was proportional to equilibrium evaporation rates (LE~q). When the corn canopy was dry, latent heat flux densities were less coupled to available energy (A). This response occurred because exposed soil and the corn's C4 physiology increased the corn's canopy resistance to water vapor transfer. When the sparse corn canopy was wet, LE approached values experienced by the closed wheat canopy. A rule of thumb, explaining the surface control of latent heat exchange, was extracted from these data. The ratio between LE and LE~q diminished linearly with logarithmic increases of surface resistance.
Different processes controlled canopy evaporation at night. Nocturnal evaporation flux densities mea- sured over the closed wheat crop were independent of available energy, and instead were a function of the atmosphere's vapor pressure deficit. Evaporation flux densities measured over the sparse crop were weakly dependent on available energy.
1. Introduction
Knowing how to calculate latent and sensible heat exchange rates over homogeneous canopies and under ideal conditions is insufficient today.
SSDI 0168-1923(93)02106-G
192 D. Baldocchi / Agricultural and Forest Meteorology 67 (1994) 191 220
Many contemporary environmental problems require information on latent and sensible heat flux densities from a variety of landscapes and under a range of abiotic and biotic conditions. The most well known issue involves using global and mesoscale circulation models to analyze the atmosphere's climate, chemistry, and weather and the biosphere's hydrology and ecology (Avissar and Pielke, 1990; Dickinson et al., 1991). To obtain credible predictions of climate, chemistry and meteorology, these models need to consider the effects of canopy coverage and architecture, plant physiology and the physical envir- onment on the exchange rates of energy at the earth's surface.
A wide range of models for calculating canopy evaporation exists (Shuttle- worth, 1991). Yet, most evaporation models have deficiencies of one sort or another. The Penman-Monteith equation (Monteith, 1965) is probably the most versatile model for calculating evaporation rates over vegetation. This relationship abstracts the canopy as a 'big-leaf and calculates evaporation rates by combining the surface energy balance equation with a resistance based, mass flux equation. Predictive use of the Penman-Monteith equa- tion, however, is hampered by several factors. First, it is dependent on an ill-defined, bulk surface resistance, Rc (Finnigan and Raupach, 1987; Baldoc- chi et al., 1991). Second, the Penman-Monteith equation depends on pre- scribed meteorological variables; it neglects feedbacks between the surface layer evaporation and planetary boundary layer mixing and entrainment on the status of its driving variables (Jacobs and De Bruin, 1992). Third, the Penman-Monteith relationship was derived for horizontally homogeneous vegetation, so it fails to predict evaporation rates well over sparse canopies (Shuttleworth and Wallace, 1985; Shuttleworth, 1991).
Two-layer resistance models have been proposed as an alternative to the Penman-Monteith equation for calculating evaporation from sparse canopies (Shuttleworth and Wallace, 1985; Ham and Heilman, 1991). The strength of the two-layer approach is its separate treatment of soil and vegetation eva- poration. However, implementing a two-layer evaporation relationship in a global or regional scale model may be impractical because its use requires specifying aerodynamic and surface resistances for vegetation and the soil at each grid point in the model domain. The enormity of this task is further complicated by a need to incorporate effects of spatial patterns of vegetation type, soil moisture and the extent of vegetation coverage in each grid.
Simple models can be used for calculating evaporation flux densities under restricted conditions (see Jarvis and McNaughton, 1986; McNaughton and Jarvis, 1986). Over well-watered and aerodynamically smooth vegetation, evaporation flux densities are proportional to equilibrium evaporation flux densities (LEeq is a function of available energy and air temperature) and are relatively independent of surface control (Jarvis and McNaughton, 1986). An assortment of studies report that the proportionality constant between actual and equilibrium evaporation flux densities ranges between 1.2 and 1.3

D. Baldocchi / Agricultural and Forest Meteorology 67 (1994) 191-220 193
(Priestley and Taylor, 1972; Davies and Allen, 1973; Bailey and Davies, 1981; De Bruin, 1983; Flint and Childs, 1991). An appeal of using an equilibrium based evaporation model is its dependence on variables that are readily computed by global and mesoscale meteorological models.
The ratio LE/LEeq deviates from the cited narrow range under non-ideal conditions and over heterogeneous canopies. Shuttleworth and Calder (1979) report that evaporation rates from wet forests exceed 1.3 times LEeq and evaporation rates from dry forests are much less than 1.2 times LEeq. Other experimental and theoretical studies (over crops and forests) show that the ratio LE/LEeq decreases drastically from 1.2 as soil moisture deficits (Priestley and Taylor, 1972; Davies and Allen, 1973; Bailey and Davies, 1981; Flint and Childs, 1991) and surface conductance (De Bruin, 1983; McNaughton and Spriggs, 1986, 1989) cross some threshold. Furthermore, an energy dependent evaporation model will break down at night if significant evaporation occurs when available energy is being lost to the environment.
Decisions must be made about which class of evaporation model is most appropriate for routine applications. To do so, we must improve our under- standing of surface and environmental controls on evaporation under the wide range of conditions these models are expected to operate. At present our understanding of energy exchange processes over partial canopies and during night-time periods is weak (see Fitzjarrald and Moore, 1990; Ham and Heilman, 1991).
Comparative flux studies are a useful but rarely used method for examining treatment effects on canopy scale energy and gas exchange rates (Denmead, 1969; Baldocchi et al., 1983; McGuinn and King, 1990). A particular strength of a comparative experiment is its ability to generate a wide range of surface forcing conditions under similar environmental conditions. Here, flux densi- ties of mass and energy are measured over a closed wheat crop and an immature and sparse corn canopy. Maximal canopy conductance was achieved by the closed wheat canopy, while the sparse corn canopy experi- enced a range of surface conductances because of progressive changes in crop cover, by differences in stomatal physiology 1 and via periodic wetting of the canopy and soil by irrigation.
The goals of this paper are to study the partitioning of radiant energy into latent, sensible and soil heat exchange over a complete and partial crop canopy and to examine the biotic and abiotic processes that control evapora- tion during daytime and night-time periods over these distinct canopies. Three key questions are addressed in this paper. Is canopy evaporation of a sparse and closed crop related to equilibrium rates? How does canopy resistance (as affected by degree of canopy coverage, crop type, canopy wetness and soil
1 C4 species (corn) exert greater stomatal control on gas exchange through leaves than do C3 species (wheat) (Pearcy and Ehleringer, 1984).

194 D. Baldocchi / Agricultural and Forest Meteorology 67 (1994) 191-220
moisture) control LE/LEeq? What are the roles of available energy, turbulent mixing, and humidity deficits on nocturnal evaporation rates?
This study was a component of the Boardman ARM Regional Flux Experi- ment, supported by the US Department of Energy's Atmospheric Radiation Measurement (ARM) Program. The larger scale experiment focused on study- ing evaporation over a region consisting of a large irrigated farm and an adjacent dry desert landscape (Doran et al., 1992). CO2 fluxes were measured during this experiment and are discussed, with water use efficiency, in a companion paper (Baldocchi, 1994). A comparison between tower based and airplane measurements of surface fluxes is presented in a third paper (Crawford et al., 1993).
2. Materials and methods
2.1. Site and crop characteristics
Measurements of mass and energy flux densities and environmental condi- tions were made simultaneously over a wheat (Triticum durum) and corn (Zea mays) crop. The experiment was conducted between 2 (D153) and 20 (D171) June 1991. The crops were growing on a 4500 ha farm near Boardman, OR (lat. 45 ° 40'N; long. 119 ° 40'E). Each crop was growing on a circular (800 m diameter), irrigated plot, containing about 64 ha. Wheat was planted on 15 February and was sown in 0.15 m wide rows. Corn was planted on 13 April and was planted in 0.75 m wide rows. The two crops under investigation were separated by about 7 km.
The soil on the farm was sandy (mixed, mesic, xeric, Torripsamments, Quincy series). The soil under the wheat stand had a bulk density of 1.42_3g cm -3 and the soil under the corn stand had a bulk density of 1.29 g cm Negligible organic matter was found in the soil. Neither crop encountered drought stress because soil moisture was supplied regularly by irrigation. Volumetric water content (0v) of the soil was measured with the gravimetric method. Soil moisture data obtained during the experiment are presented in Table 1.
Table 1 Volumetric soil water content of the top 0.15 cm soil layer. These data were determined as the product between bulk density and the relative water content. Gravimetric methods were used
Day Corn (cm 3 cm -3) Wheat (cm 3 cm -3)
D158 0.121 0.148 D160 0.178 0.102 D162 0.141 0.172 D169 0.156 0.217

D. Baldocchi / Agricultural and Forest Meteorology 67 (1994) 191-220 195
The wheat crop formed a closed canopy, it was green throughout the experiment and it progressed through the vegetative, heading and anthesis stages. The corn crop formed an open canopy and was vegetative throughout the experimental period. Only near the end of the field campaign did leaves between rows touch.
Crop height was measured almost daily at 20-30 random locations. The corn's leaf area index (LAI) was measured three times and the leaf area of the wheat was measured twice. Three random samples were obtained from the corn (75 x 50 cm sections of row) and wheat (15 x 30 cm plots). Areas of leaf samples were determined with an area meter (LICOR model L1-3100, Lincoln, NE). Daily estimates of LAI were derived via interpolation of LAI to height ratios. Figure 1 shows the temporal variation in leaf area and crop height during the experiment.
2.2. Eddy flux measurements, instrumentation and data acquisition
The eddy correlation method was used to measure sensible and latent heat flux densities over the crop canopies (see Baldocchi et al., 1988). Positive flux densities represent mass and energy transfer away from the surface and nega- tive values denote the opposite. Vertical flux densities of water vapor or latent heat (LE) and sensible heat (H) between the crop and the atmosphere are proportional to the mean covariance between vertical velocity (w') and scalar (c') fluctuations. Turbulent fluctuations were computed as the difference between instantaneous and mean scalar quantities. Mean scalar values were determined in real time, using a digital recursive filter (Hamming, 1983). In this study, a 400 s time constant was used. McMillen (1988) has showed empirically that flux covariance calculations are insensitive to digital filter time constants ranging between 160 and 640 s.
The flux measurement sensors were mounted on a telescoping mast located at the north end of each field. The mast was raised 4.0 m above the surface. Adequate fetch (up to 800 m) was achieved when the wind direction ranged between 120 and 240 degrees.
Three-dimensional orthogonal wind velocities (u, v and w) and virtual temperature (Tv) were measured with a sonic anemometer (Applied Technol- ogy, model SWS-211/3K, Boulder, CO). The pathlength between transducers was 0.15 m. The sensor software corrected for transducer shadowing effects (see Kaimal et al., 1990). Virtual temperature heat flux was converted to sensible heat flux using algorithms described by Kaimal and Gaynor (1991).
Water vapor and CO2 concentrations were measured with an open path infra-red absorption spectrometer. Details and performance characteristics of the spectrometer are discussed by Auble and Meyers (1992). In brief, the infra- red beam was reflected three times between mirrors separated by 0.20 m, making an 0.80 m absorption path. The response time of the sensor was

196 D. Baldocchi / Agricultural and Forest Meteorology 67 (1994) 191-220
w "
0 r~ L)
1.00
0.75
050
0.25
0.00 150
wheat
(a)
. . . . . . . I . . . . . . . i . . . . . . . . i . . . . . . . . i . . . . . . .
155 160 165 170 175
4.0
3.5
5.0
2.5
2.0
1.5
1.0
0.5
0.0 150
wheat v~w-~ - ~ v - ~
(b)
155 160 165 170
day number
75
Fig. 1. (a) Temporal variation of crop height for corn and wheat. (b) Temporal variation of leaf area index (LAI) of the corn and wheat crops.
less than 0.1 s, sensor noise was less than 300 #g m -3 and its calibration was steady (it varied by + 3% during the course of the experiment). The sensor was calibrated periodically with three standard CO2 gases mixed in air, the accuracy of which was -t-1%.
Voltages from the fast response anemometer and infra-red spectrometer were sampled and digitized at 10 Hz by an analog to digital converter. Digital signals were then transmitted from the field to a 386 based computer. Com- puter software transformed the data, computed flux covariances, stored raw data and displayed raw sensor signals on the video display for real-time quality control and assurance.

D. Baldocchi / Agricultural and Forest Meteorology 67 (1994) 191-220 197
The eddy correlation measurement system captured most flux-containing eddies by sampling rapidly (10 Hz) and by averaging scalar velocity fluctua- tion products for 30 min; averaging times of 30 min were sufficient to reduce sampling errors of mass and energy flux covariance to +15% (Sreenivasan et al., 1978). Spurious mean mass flow errors were minimized by aligning the vertical velocity vector normal to the mean wind streamline. This procedure was accomplished by rotating the coordinate system of the three orthogonal wind vectors to obtain a mean vertical velocity of zero and to orient the longitudinal component (u) along the mean wind. Turbulent fluxes were computed in reference to the new coordinate system (see Baldocchi et al., 1988).
Micrometeorological fluxes measured at any height in the surface layer are assumed to equal the flux density of the underlying surface. This assumption is valid as long as certain constraints relating to the conservation budget of a passive scalar are met (see Baldocchi et al., 1988). These restrictions include a level and horizontally homogeneous surface, steady state conditions, and no intermediate sources and sinks. These cited prerequisites were met through proper site selection, experimental design and data processing; data were rejected when winds were not coming from the field, when it was raining or during the passage of the circular irrigation system through the upwind fetch.
2.3. Ancillary meteorological and plant measurements
Soil heat flux densities were measured at each site. Three soil heat flux plates (REBS model HFT-3, Seattle, WA) were buried 0.08 m below the surface. Soil heat plates were placed in a row and midway between rows to sample the soil thermal environment, representatively. Soil heat flux measurements were corrected for soil heat storage in the upper layer (see Fuchs and Tanner, 1967; Fritschen and Gay, 1979). Soil heat storage was calculated by measur- ing the time rate of change of the mean soil temperature (Ts) profile and the heat capacity of the soil (C(z))
G(0) = G(8cm) + C(z) dz (1)
Soil temperature was measured with a thermocouple probe. Sensors were spaced logarithmically at 0.02, 0.04, 0.08, 0.16 and 0.32 m below the surface.
Shortwave radiation (Rg), photosynthetically active radiation (Qp) and the net radiation balance (Rn) were measured above each crop with an pyran- ometer (Eppley, model 0-48, Newport, RI), a quantum sensor (LICOR, model LI-190S, Lincoln, NE) and a net radiometer (Swissteco, model S-l, Mel- bourne, Australia), respectively. Periodic measurements of Qp penetration were made under the wheat and corn canopies using a 1.0 m long quantum

198 D. Baldocchi / Agricultural and Forest Meteorology 67 (1994) 191-220
sensor (Ceptometer, Decagon Inc., Pullman, WA). An infra-red radiometer sensed the radiative temperature of each canopy (Everest Interscience, model 4000, Fullerton, CA). The radiometer pointed downward at a 45 degree angle above nadir and was directed towards the south. Air temperature and relative humidity were measured with appropriate sensors (Campbell Scientific, model 207, Logan, UT). Wind speed and direction were measured with a wind monitor (RM Young model 05701, Traverse City, MI). Ancillary meteorolo- gical variables were sampled at 1 Hz and were recorded with a Campbell Scientific (model CR-21x) data logger.
Stomatal resistances (rs) of the wheat and corn leaves were measured with a steady state porometer (Licor, model Ll-1600, Lincoln, NE). The measure- ments of r s were made on sunlit leaves near the top of the canopy. Wheat and corn leaves are amphistomatous, so stomatal measurements were made on the upper and lower sides of leaves. Leaf resistances were computed by combining the upper and lower measurements in parallel. Typically, six to eight leaves were interrogated during the sampling period. This limited sampling strategy was used because insufficient manpower was available to measure r s in pro- portion to the contribution of sunlit and shaded leaves at various levels in the canopy (see Rochette et al., 1991). Hence, these data cannot be used to derive an integrated canopy stomatal resistance. Instead, they can be used as an index of the potential for physiological control by the plants and to derive leaf model parameters.
Canopy surface resistance (Rc) was estimated by applying measurements of LE, atmospheric vapor pressure deficit (D) and the aerodynamic resistance to vapor transfer (Ray) to the inverted form of the Penman-Monte i th equation. Ray is comprised the sum of the aerodynamic resistance for momentum transfer (Ra = u/u, 2) and the quasi-laminar resistance for vapor transfer (R b ---- g-~,ln(~)) (see Verma, 1989); u is horizontal wind speed, u, is friction
velocity, k is Von Karman's constant, and z o and Zv are the roughness lengths for momentum and vapor transfer. The ratio ln(zo/Zv) equals 2 for closed smooth vegetation (Verma, 1989). For sparse canopies, ln(zo/Zv) exceeds this cardinal value and was assumed to equal 5 over the corn crop (see Verma, 1989).
2.4. Testing surface energy balance closure
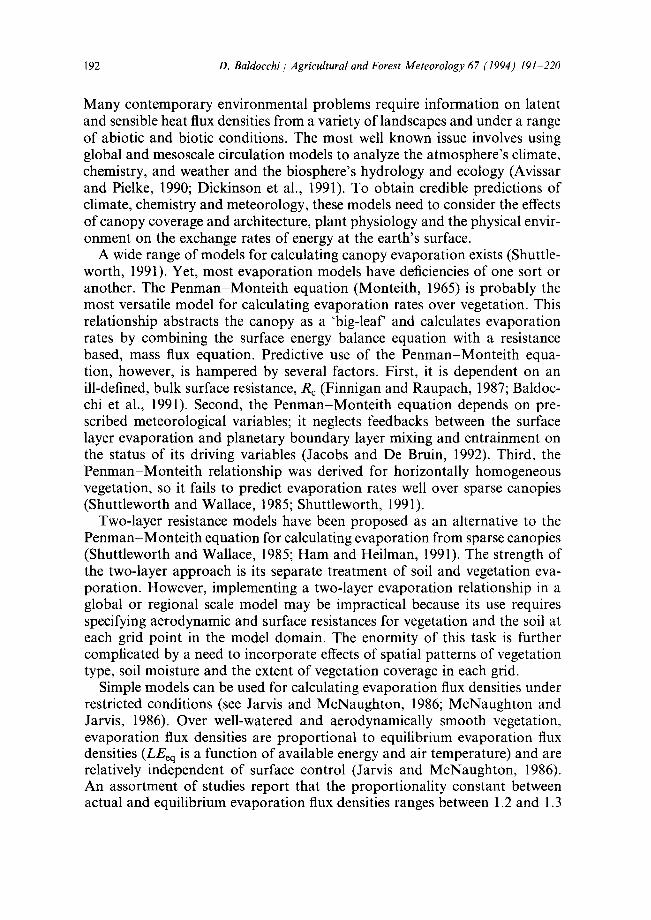
The thermodynamic constraint of attaining surface energy balance closure is the ultimate test of eddy flux measurements. Energy balance closure is met, generally, if available energy (net radiative energy exchange (Rn) minus con- ductive soil heat transfer (G)) is balanced by its partitioning into latent (LE) and sensible heat (H) exchange. Figure 2 show comparisons between H + LE (measured with the eddy correlation method) and available energy (Rn - G)
D. Baldocchi / Agricultural and Forest Meteorology 67 (1994) 191-220 199
E
.-2 q- :S::
I
E
[;a
+
600
500
4-00
500
200
100
0
- 1 0
800
600
400
2OO
0
-200
wheat ~ /
r2-0 98 , o --"~'* ~/
• • ~ . - .
• •
k I I I I r
O0 0 100 200 300 400 500 600
Rn-G (W m -2)
L'o 04, " / / / s lope= 1.05 • . • : ~ l / ~
1,~ ¢ ~ } ' ¢ . •
~'oi , (b) !00 0 200 ~)00 600 800
Rn-G (W m-
Fig. 2. Comparison between available energy (net radiation (Rn) minus soil heat (G) flux densities and its partitioning into latent (LE) and sensible (H) heat transfer LE and H were measured with the eddy correlation method. (a) Wheat. Regression slope was 1.05 and its coefficient of determination (r 2) was 0.98. The mean energy balance residual was 20 W m 2. The standard deviation and standard error of this residual were 32.1 and 1.36 W m -z, respectively. The number of samples (n) equals 558. (b) Corn. Regression slope was 1.05 and its coefficient of determination (r 2) was 0.94. The mean energy balance residual was -2.35 W m -2. The standard deviation and standard error of this residual were 43.9 and 1.97 W m -2, respectively. The number of samples (n) equals 492.

200 D. Baldocchi / Agricultura! and Forest Meteorology 67 (1994) 191 220
800
600
400
I
E
200
-200 0
250
200
150
i 100 E
u: 5O
-50
(a) • wheat
v corn • ~
I I I t
500 1000 1500 2000
(c)
l
Day 15B I 600
500
400
500 I
E
200
100
- 1 0 0
200
150
t
E 100
g 50
--50
i
(b)
, , I I I I
500 1000 1500 2000
l I i I
(d)
- 1 0 0 i I I I - 1 0 0 I t I I 0 500 1000 1500 2000 0 500 1000 1500 2000
time (hours) time (hours)
Fig. 3. Diurnal variation of net radiation (Rn, (a)), latent heat flux (LE, b)), sensible heat flux (H, (c)) and soil heat flux (G, (d)) densities measured over the wheat and corn crops on Day 158.

D. Baldocchi / Agricultural and Forest Meteorology 67 (1994) 191 220 201
measured over the closed and sparse canopies. Over both canopies, measure- ments of L E + H accounted for over 94% of the variance in Rn - G. Regres- sion slopes between H + L E and Rn - G were 1.05 (Figs. 2(a) and (b)). Mean paired differences between Rn - G and H + LEwere -2.35 -4- 1.97 W m -2 and -20.7 2:1.36 W m -2 for the corn and wheat crops, respectively. Student's paired t tests were calculated and revealed that the residual energy balance was not significantly different from zero, on the 0.05 probability level, over the corn. The energy balance residual measured over the wheat, while less than 5% of mean available energy was significantly different from zero.
From these statistics it can be concluded that the degree of energy balance closure is adequate to proceed with data analysis and interpretation. Further- more, this degree of energy balance closure equals or exceeds the energy balance closure that has been demonstrated over crop canopies using eddy correlation measurements (e.g. Anderson et al., 1984).
3. Results
3.1. Energy exchange rates and the partitioning o f available energy over open and closed canopies
Daily courses of energy flux densities measured over the closed (wheat) and open (corn) canopies are compared in Fig. 3 for D158. These data are supple- mented by plots of energy partitioning and ancillary meteorological condi- tions (wheat: Fig. 4; corn: Fig. 5). The daily course of net radiation flux density measured over the wheat and corn canopies overlie one another until midda~ (Fig. 3(a)). At midday, radiation balance over the corn was up to 80 W m- less than that over the wheat canopy.
The measurement of lower R n values over the sparse corn canopy on D 158 can be explained by greater shortwave and longwave energy losses over corn canopy during the midday period. These losses are illustrated in the following explanation. First, the albedo of sand is much greater than that of green vegetation (Monteith and Unsworth, 1990). Any canopy having more exposed soil will experience greater reflective losses of incoming shortwave radiation. Second, the sparse corn canopy allowed more incident radiation to reach the soil; Table 2 shows that 28-50% of incoming photosynthetically active radiation (Qp) reached the soil under the corn, while less than 7% reached the soil under the wheat. This higher radiation load caused soil (Figs. 4 and 5) and infra-red temperatures (Fig. 6) of the sparse corn canopy to be as much as 15°C warmer than that under the wheat canopy. Conse- quently, more infra-red energy was radiated from the warmer corn canopy.
Combining data from the whole experimental period, we find negligible differences between the net radiation flux densities measured over the two

202 D. Baldocchi / Agricultural and Forest Meteorology 67 (1994) 191-220
f
E
>-
5O z
x
~e
z
700
600
500
400
500
200
100
0
- -100 0
25
20
c ~
15 <
10
5 0
15
10
D158 wheat
I I I I I
• Rn (h) LE
"o :,:5 k
I I I I I
400 800 1200 1600 2000 2400
I I I ~ I
o J
I I I I I
400 800 1200 1600 2000 2400
l I I I I
• vpd (mb) fl 'vv_ w
7 ~% 7 ~ Z ~ /
400 800 1200 1600 2000 2400
TIME (HRS)
Fig. 4. Diurnal variation of energy flux densities and ancillary environmental variables over wheat on Day 158. (a) Net radiation (Rn), latent (LE), sensible (H) and soil (G) heat flux densities. (b) Air, soil and infra-red temperatures. Soil temperature was measured at 4 cm. (c) Wind speed and vapor pressure deficit.

D. Baldocchi / Agricultural and Forest Meteorology 67 (1994) 191-220 203
D158 CORN 6OO
n (A) v LE
400
300
100
-100 I i i i l 0 400 800 1200 1600 2000 2400
30
25 PT~ n~ [-. 20 .<
Pa
15
[.-,
10 0
20
i I I i ~-~. 03)
J air ~ 0
400 800 1200 1600 2000 2400
I I I I I
• U (m s -I) v-w-v (C) • vpd (mb) ¢/# ¥-W
I I I I I
400 800 1200 1600 2000 2400
TIME (HR$)
15
10
5
0
Fig. 5. Diurnal variation of energy flux densities and ancillary environmental variables over corn on Day 158. (a) Net radiation (Rn), latent (LE), sensible (H) and soil (G) heat flux densities. (b) Air, soil and infra-red temperatures. Soil temperature was measured at 4 cm. (c) Wind speed and vapor pressure deficit.

204 D. Baldocchi / Agricultural and Forest Meteorology 67 (1994) 191 220
Table 2 Measured values of the penetration of photosynthetically active radiation through a plant canopy, deter- mined by measuring Qp at above the canopy (Qp(h)) and at the soil surface (Qp(0))
(a) Wheat canopy: these data represent the average of over 20 random measurements Daytime Qp (0) / Qp (h) Daytime Qp (0) / Qp (h)
D1580945 0.0262 D1650815 0.0092 D1581015 0.0347 D1650900 0.0102 D1581045 0.0397 D1650946 0.0276 D1581345 0.068 D1651045 0.0276 D1581445 0.0589 D1651515 0.0216
D1651545 0.0165 D1651615 0.0137
(b) Corn canopy: each datum represents the average of seven horizontal transects, separated by 0.10 m Daytime Qp (0) / Qp (h)
D1681025 0.469 D1681100 0.503 D1681123 0.483 D1681145 0.471 D1681446 0.297 D1681504 0.280
disparate canopies (Fig. 7(a)). Differences in canopy closure, on the other hand, had a marked influence on the partitioning of net radiation into LE, H and G. Daytime flux densities of LE measured over the sparse corn crop were much smaller than values measured over the closed wheat crop. On average, LE over the sparse corn canopy was 59% of L E measured over the closed wheat canopy (r ~ = 0.827; Fig. 7(b)). In absolute terms, maximum L E
2 values approached 500 W m - over the closed wheat canopy, while maximum 2 values measured over the ol~en corn crop rarely exceeded 300 W m- . Cases of
LE exceeding 300 W m - over the corn canopy were isolated and only occurred after the passage o f the sprinkler irrigation system and its wetting of the surface.
Nocturnal latent heat flux densities were significant. During the night of Day 158, L E ranged between 10 and 50 W m -2. Furthermore, LE values were similar over the two disparate canopies (Fig. 3(b)). Nocturnal evaporation resulted from vapor losses from the soil, through the leaf cuticle and through partially closed stomata (Rawson and Clarke, 1988).
Lower LE values observed over the sparse corn were compensated by the occurrence o f greater sensible heat (H flux densities (Fig. 3(c)). On average, sensible heat flux densities were 22% greater over the corn canopy, during the
2 day (Fig. 7(c)). Maximum H values rarelcv exceeded 100 W m - over the wheat, while they approached 250 W m-Cover the corn. At night, H was

D. Baldocchi / Agricultural and Forest Meteorology 67 (1994) 191-220 205
40 ~ ~ i
2 • • 35 r = 0 . 0 8 6 4 ee
~ 25
10
5 5 10 15 20
IRT wheat (C) 25
Fig. 6. In t e r compar i son between infra-red t empera tu res measu red over the corn and wheat crops.
The sensor poin ted downward at 45 degrees f rom nadir.
greater over the corn canopy until midnight. Between midnight and daybreak, H values over the two canopies converged.
The daily amplitude of soil heat flux density (G) was greater under the corn stand (Fig. 3(d)). The open architecture of the corn canopy allowed more solar energy to be captured by the soil during the day (Table 2). This factor caused greater daytime values of G to be observed than under the closed wheat stand. Thermal inertia kept the soil under the corn warmer into the night (Figs. 4 and 5). As night-time air cooled over the canopies, a stronger soil temperature gradient was established under the corn. Subsequently, greater flux densities of heat were driven from the soil.
The partitioning of energy over the two crops is summarized in Figs. 4 and 5. With respect to the wheat crop ~Fig. 4), most net radiation was consumed by LE; R, peaked near 600 W m -c, while LE peaked near 500 W m -2. Flux densities of sensible and soil heat were similar and much smaller, peaking between 50 and 100 W m -2. At night R n, H and G were negative, while LE remained positive (indicative of nocturnal evaporation). In contrast, the net radiation available to the corn canopy was equally distributed among LE, H and G {Fig. 5), during the day; all three quantities peaked between 150 and 200 W m -2. Like the wheat crop, R,, H and G were negative over the corn, while LE remained positive.

206 D. Baldocchi / Agricultural and Forest Meteorology 67 (1994) 191-220
6OO
5OO
400
E 3oo
c
~= 200
100
0
- 1 0 0 I
500
250
2OO
E 150
IOO
~ 5o i
0
- 50
I 2 . . . . I - -~ 'A r =0.98 . l g ' t
o / r e • I
i i 5 i t i i O0 0 100 200 500 400 500 600
R n wheat (W m -2)
r =0.7.54 / s l o p e = l , 2 2 • / "
.. :•~•
. . . . .
• ". :. '
• o •
f ' " (c) - 1 0 0 ~
- 1 0 0 - 5 0 0 50 100 150 200
H wheat (W m -2)
SO0
~00
E 300 &
C
20C
10C
150
100
~ o
-50
-100
-150
r2~0.8271 i E /
slope=0.59 o / ~ "
/ 5° . / ' . ,_,. ,a., . .
/ . e.-; ~;
• ~a O ~ • "Ooo ¢./L#2 ~o I . -
1 O0 200 300 400 500 LE wheat (W m -2)
I I I I 0 I
r2=0,814 O O.~I~ o o O / s lope= l :64 • ~ , ~ 7 0 / o_
(4) I I I I I
50--100- -50 0 50 100 150
G w h e a t (W m -2)
Fig. 7. I n t e r c o m p a r i s o n o f net r a d i a t i o n (Rn, (a)), la tent hea t f lux (LE, (b)), sens ib le heat f lux (H, (c)) a n d soi l hea t flux (G, (d)) densi t ies o v e r the w h e a t a n d c o r n crops .
3.2. Processes controlling dayt ime energy f lux densities
The Penman-Monteith equation is a useful tool for diagnosing which physical and biological factors control evaporation. Jarvis and McNaughton (1986) rearranged the Penman-Monteith equation algebraically to examine the relative control of available energy, atmospheric humidity deficits, and physiological resistances on evaporation. The resulting form of the Penman-

D. Baldocchi / Agricultural and Forest Meteorology 67 (1994) 191-220 207
Monteith equation is
s AD LE = ~ ')' (Rn - G) -~- (1 - ~) (2)
s + R a + R b + R c
where s is the slope of the temperature-saturation vapor pressure relation, 3' is the psychometric constant, A is the latent heat of evaporation, D is the atmo- spheric vapor pressure deficit and Ra, Rb and Rc are the aerodynamic, quasi- laminar and canopy resistances, respectively. Three important concepts are contained in this algebraic arrangement of the Penman-Monteith equation, equilibrium and imposed evaporation and the coupling coefficient (f~), which merit discussion before this analysis proceeds.
Equilibrium evaporation was defined originally as the rate attained by a wet surface after it saturates the atmosphere (McNaughton, 1989). Mathemati- cally, equilibrium evaporation is derived by considering latent and sensible heat transfer into a capped and static boundary layer. Appraising the warming and humidification of this volume by sensible and latent heat exchange yields a time dependent equation for LE (McNaughton and Spriggs, 1986; Baldoc- chi and Meyers, 1991)
s , . o,] ,3, LE(t)-s+TS ( R n - G ) + e x p - LE(O) s~-7
Equilibrium evaporation occurs when time, t, is much greater than the equilibrium time constant, T. At this time limit, equilibrium evaporation equals ~ (Rn - G) and is a function of available energy.
Imposed evaporation is governed by the atmospheric driving potential and the resistances to water vapor diffusion across that potential. Imposed evaporation is proportional to ;w Ra+Rb+R e"
The 9t coupling coefficient is defined as
s + 7 &
s + 3' + 7 Ra+Rb
f~ is derived from analyzing the relative change in canopy conductance with respect to the relative change in LE (Jarvis and McNaughton, 1986). f~ approaches 1 over well-watered and aerodynamically smooth canopies, yield- ing evaporation rates proportional to LEeq. ~ approaches 0 over aerodyna- mically rough canopies, yielding evaporation rates that are closely coupled to the atmospheric vapor deficit (Jarvis and McNaughton, 1986).
Figures 8(a) and (b) show that LE measured over the closed and open canopies were strongly correlated with LEeq(r 2 was 0.848 and 0.726, respec- tively). However, there was a distinct difference in the linear regression slopes describing the relationship between LE and LEeq. The slope of the linear

208 D. Baldocchi / Agricultural and Forest Meteorology 67 (1994) 191 220
i
.J
E
..J
700
600
500
400
300
200
100
0 0
I I I ] I ~ I |
w h e a t
2 • r =0.848 •
s l o p e = 1.262 • i o e ~ "
• • .'.'~ I • •
• •Zx~ •" • I
• ¢ r < - • - - . . !
:;0 (a) I
I I I F i i I
50 I00 150 200 250 300 350 400
LEequilibriu m (W m -2 )
500 I I II I
c~rn
400 r : 0 . 7 2 6 • • o / s l o p e = 0 . 9 6 1 • • • •/e" • "!.J o,11
o O o •
• • . o / ' q b - 200 • I~ , ~,If%
, • !! • ~.', o4. °
I o• 0_~I@ S • l" (b) ,~'~ °• °
0 ~ i i i 0 100 200 300 400
LE q~ilib~i~ = (Wm -2)
500
Fig. 8. In te rcompar i son between measured la tent heat flux densities (LE) and equi l ibr ium latent heat flux densities (LEeq) measured over the wheat (a) and corn (b) canopies.

D. Baldocchi / Agricultural and Forest Meteorology 67 (1994) 191 220 209
1200
1000
I
8oo
°o 600
r,., ~ 400
I I I I
• q lO .
. •
0[/; • , ; , i i
/
/
0 200 400 600 800
Rst c w h e a t (s m -1)
I
1000 I O0
Fig. 9. In te rcompar i son between canopy s tomata l resistances over the corn and wheat crops. These resistances were calculated by invert ing the P e n m a n - M o n t e i t h equat ion.
regression for the closed wheat stand was 1.26, while the regression slope was 0.96 for the sparse corn canopy.
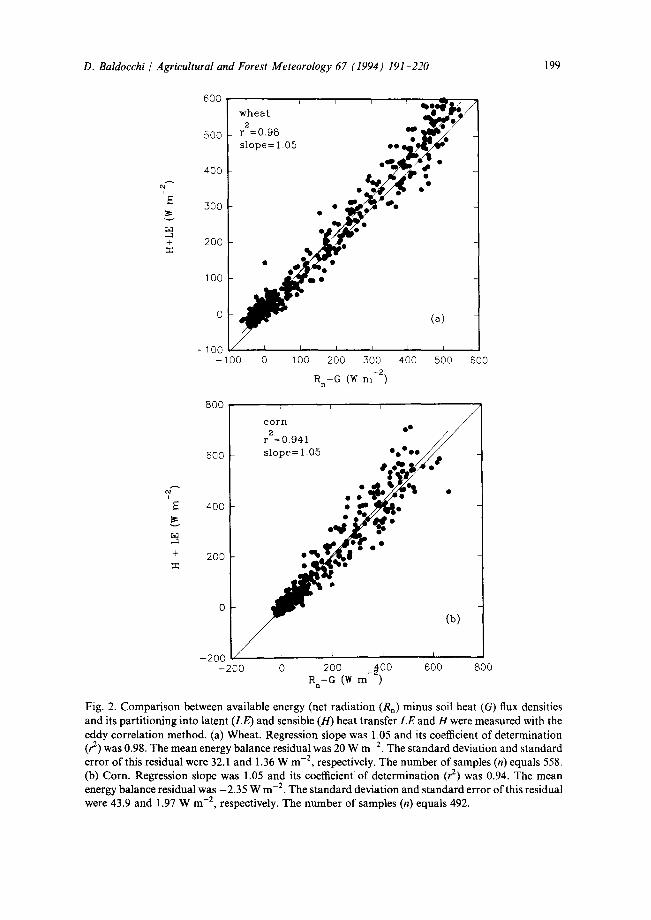
Why were latent heat flux densities measured over the two canopies so different, because they were both irrigated and not deficient in soil moist- ure? One explanation can be linked to differences in the canopy resistance to evaporation (Re). Calculations reveal that R c of the sparse corn canopy was typically two to five times greater than values from the closed wheat canopy (Fig. 9). Because an increase in R e will decrease f~, lower f~ values were experienced by the sparse corn canopy (Fig. 10). In turn, these lower f~ values weakened the coupling between LE and LEeq.
Several factors can explain why the corn canopy exerted a greater canopy resistance to evaporation. First, the corn canopy had a significant amount of soil exposed to the atmosphere. Second, the dry soil exerted a greater resis- tances to water transfer than did the leaves; soil resistances typically range between 2000 and 3000 s m -1 (Fuchs and Tanner, 1967; Mahfouf and Noilhan, 1991) while stomatal resistances of corn leaves ranged between 100 and 200 s m-I (Table 3). Third, if we assume that the canopy resistance is proportional to the ratio between mean stomatal resistance and leaf area index, smaller canopy resistances were expected over the wheat because its leaves had lower stomatal resistances and its canopy had a greater leaf area index (Table 3; Fig. 1); stomatal resistances of wheat leaves were typically less than 100 s m -z .
210 D. Baldocchi / Agricultural and Forest Meteorology 67 (1994) 191-220
1 .00
D158
E 0
0.75
0.50
0 . 2 5
• wheat v corn
0 . 0 0 I i I L i 0 4 0 0 8 0 0 1 2 0 0 1600 2 0 0 0 2 4 0 0
Time (hours)
Fig. 10. Diurnal course of the 9t coupling coefficient for the wheat and corn crops. Data are for Day 158.
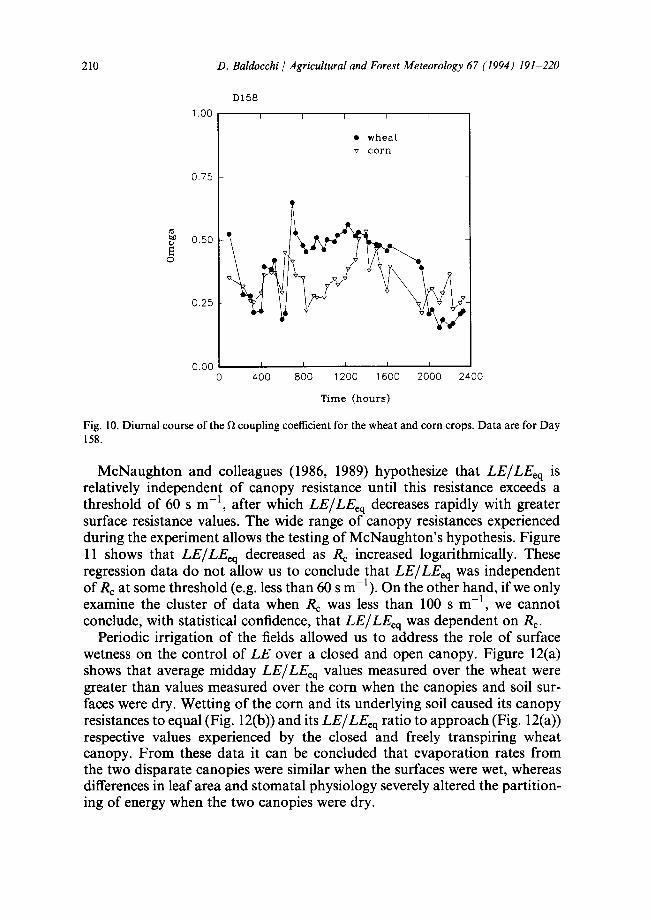
McNaughton and colleagues (1986, 1989) hypothesize that LE/LEeq is relatively independent of canopy resistance until this resistance exceeds a threshold of 60 s m -1, after which LE/LEeq decreases rapidly with greater surface resistance values. The wide range of canopy resistances experienced during the experiment allows the testing of McNaughton 's hypothesis. Figure 11 shows that LE/LEeq decreased as Re increased logarithmically. These regression data do not allow us to conclude that LE/LEeq was independent of Rc at some threshold (e.g. less than 60 s m-l) . On the other hand, if we only examine the cluster of data when Re was less than 100 s m -1, we cannot conclude, with statistical confidence, that LE/LEeq was dependent on Re.
Periodic irrigation of the fields allowed us to address the role of surface wetness on the control of LE over a closed and open canopy. Figure 12(a) shows that average midday LE/LEeq values measured over the wheat were greater than values measured over the corn when the canopies and soil sur- faces were dry. Wetting of the corn and its underlying soil caused its canopy resistances to equal (Fig. 12(b)) and its LE/LEeq ratio to approach (Fig. 12(a)) respective values experienced by the closed and freely transpiring wheat canopy. From these data it can be concluded that evaporation rates from the two disparate canopies were similar when the surfaces were wet, whereas differences in leaf area and stomatal physiology severely altered the partition- ing of energy when the two canopies were dry.

D. Baldocchi / Agricultural and Forest Meteorology 67 (1994) 191-220 211
2.0 I I I 2
• • r =0.74
[ ' ~ ' . ~ • • wheat
f ........... " ~ ' • ~ " • : n corn
~PV V D • • • oo [3 o
n i i i i L o t l i i o . . . . . t
1 O0 1000
R e (s m - t )
1,5
1.0
0.5
0.0 10
Fig. 11. The influence of canopy surface resistance on the ratio LE/LE~q. A third order polynomial regression is fit through the data. The coefficient of determination (r 2) is 0.74.
There is a possible explanation for why LE from the wet corn canopy did not equal LE from the closed wheat stand. Aerodynamic resistances measured over the shorter and sparser corn canopy were almost double values measured over the closed wheat stand (Fig. 12(b)). As a result, less efficient turbulent transfer over the wet corn canopy translated into lower LE values than over the taller and aerodynamically rougher wheat stand.
3.3. Nocturnal evaporation
Nocturnal evaporation is a topic that has received relatively little attention (Green et al., 1989; Fitzjarrald and Moore, 1990; Malek, 1992). Yet it is a topic that merits further examination because nocturnal evaporation can be a significant component of the daily water balance (Rosenberg, 1969; Green et al., 1989; Malek, 1992) and because nocturnal energy exchanges affect the stability of the atmospheric surface layer, and thereby affect the generation and suppression of turbulence (Fitzjarrald and Moore, 1990).
From first principles, one can argue that different processes control night- time and daytime evaporation, an idea that can be substantiated using Jarvis- McNaughton (1986) f~ theory (Eq. 2). Darkness causes stomata to close and atmospheric turbulence to be suppressed, while during the day stomata are open and turbulence is more vigorous. Consequently, night-time f~ values

212 D. Baldocchi Agricultural and Forest Meteorology 67 (1994) 191-220
~a
..]
1.8
1.6
1.4
1.2
1.0
0.8
0.6
0 . 4 i
155
I
• wheat
v corD_
soil / ~ . 7 ~
(A)
i k , I i L i , L i , i I ,
160 165 170
I
E r ~
v
t..) r ,
r,,,,
500
400
300
200
100
wet soil
i i i i i i i i ] i i i i i i J
(s)
155 160 165 170
DAY NUMBER
• Ray Wh
v Ray Cn
• R e Wh
o R e Cn
Fig. 12. Daily variation in the mean midday (10:00 to 14:00 h) values of LE/LE (a) and canopy surface (Re) and aerodynamic (Ray) resistances (b). These data are from the open corn (CN) and closed wheat (WH) crops. The figure indicates when the soil under the corn was wetted by irrigation.

D. Baldocchi / Agricultural and Forest Meteorology 67 (1994) 191-220 213
were generally lower than daytime values (Fig. 10). From these f~ calculations it can be hypothesized that nocturnal evaporation rates should be less coupled to available energy and, instead, should be more closely linked to the atmo- spheric humidity deficit; during the day, the converse would be true.
The argument that nocturnal LE is more coupled to D than to available energy A is supported by data presented in Fig. 13. Over the wheat, LE was a linear function of the saturation vapor pressure deficit of the overlying air (Fig. 13(a)); r 2 equal 0.58. The relationship between LE and A, on the other hand, was nearly random (Fig. 13(b)). These results agree with sap flow measurements on kiwi and apple trees by Green et al. (1989), who conclude that nocturnal tree transpiration is dependent on D.
The control of nocturnal LE over the sparse corn canopy differed from the results presented for the closed wheat canopy. Instead, LE was moderately controlled by A and by D (Fig. 14). This relationship is consistent with data presented in Fig. 10, which show that night-time f~ values were larger over the corn.
4. Discussion
In spite of the rich literature on canopy evaporation and energy balance, there is a relative dearth of comprehensive energy balance studies over wheat or corn (wheat- -Denmead, 1969; Denmead and McIlroy, 1970; Brun et al., 1985; Dunin et al., 1989: corn--Uchi j ima, 1976; McGinn and King, 1990) and even fewer scientists have used the eddy correlation method (whea t - -Kim et al., 1989) to study mass and energy exchange rates of these crops. Comparing data reported here and data reported in the literature sometimes yields dif- ferent results because of different growing and soil conditions. Denmead (1969), for example, observed significantly different relationships in the parti- tioning of energy over dryland wheat; 40% of energy exchange occurred at soil and on a daily average LE was only 62% of R n and 66% of A. However, his crop had a low LAI (1.8) because it was growing on natural rainfall in an arid region.
The partitioning of energy over a well-watered wheat crop also depends on phenology (Dunin et al., 1989; Kim et al., 1989). However, if we compare data from the study reported here with other data during similar growth stages we find some interesting differences. LE from wheat growing in the midwest United States approaches and often exceeds A. This phenomenon occurs when H is directed downward; enhanced LE is promoted by this additional supply of energy to the surface (Brunet al., 1985; Kim et al., 1989).
A plausible explanation for lower evaporation ratios (LE/A) reported here stems from differences in stomatal physiology and canopy leaf area and their combined effect on canopy resistance. The sandy soil at Boardman, OR had a

214 D. Baldocchi / Agricultural and Forest Meteorology 67 (1994) 191-220
100
8O
#'-" so E
40
20
0 0 10
100
i I i i
WHEAT r=076
NIGHT
°ll
• p "
, oS.~o ,,/" " ",TJ "..
ii.9/ ••• ,
/Z .I " . ~ o . (.)
I I I I
2 4 6 8 es(t)-e ° (mb)
i i i i i
8O
7"~ 6o E
~, 4O
2O
g,,
. . - : •" : •
• _ • • • •
O • • • 0 • 0
. - . ¢ .
•, It ,- '*• • 0 0 • 0
• • • • • (b) g o •
O •
0 I I I I I
- 5 0 - 4 0 -.30 - 2 0 - 1 0 0
R n - G ( W m -2)
Fig. 13. (a) Response of nocturnal latent heat flux densities measured over the closed wheat crop to vapor pressure deficits (D). (b) Response of nocturnal latent heat flux densities (LE) measured over the closed wheat crop to available energy (A). These data are from windy periods when the aero- dynamic resistance was less than 100 s m -1 .

D. Baldocchi / Agricultural and Forest Meteorology 67 (1994) 191-220 215
i E
8
1 4 0
120
100
80
60
[ i J i
CORN r = 0 . 3 3
NIGHT
40 • / • • ~ •
o ° o -o • 2O
0 I I I r L I I
0 2 4 6 8 10 12 14
es(T)-e a (rnb)
140
(~)
16 18 20
i E
8
120
100
80
60
r = 0.70
40
20
tJ • O
• •
• - ql/o Q
O h t l L - 4 0 - 2 0 0 20 40 60
R - G (W rn 2) n
Fig. 14. (a) The response o f noc tu rna l la tent hea t flux densit ies measu red over sparse corn canopy to vapor pressure deficits (D). (b) The response o f noc tu rna l la tent hea t flux densit ies measu red over the sparse corn canopy to avai lable energy (A). These da ta are f rom windy per iods when the aerody- namic resistance was less t han 100 s m -I .
low water holding capacity than midwest clays and loams. During the experi- ment, 0v ranged between 0. l and 0.2 cm 3 cm ;-3, which was near critical levels at which stomata start to close and canopy resistances increase (Bailey and Davies, 1981; Gollan et al., 1986; Flint and Childs, 1991). As noted in Table 3,

216 D. Baldocchi / Agricultural and Forest Meteorology 67 (1994) 191 220
Table 3 Mean stomatal resistances of leaves. These values were calculated as the parallel resistance from measure- ments made on the top and bottom sides of six to eight sunlit leaves in the upper canopy
Day Hour rs(s m -I )
Corn 163 1030 205.5 163 1100 179.1 163 1300 154.9 163 1400 126.3 163 1500 149.0 163 1600 190.0 166 900 220.9 166 1030 131.6 166 1130 121.7 168 900 199.1
Wheat 157 1547 62.2 158 930 41.0 158 1030 48.6 158 1332 49,8 158 1630 78,0 159 830 52,9 160 1538 51,9 162 1030 81,4 162 1100 101,7 162 1330 73.7 162 1430 82.4 162 1530 95.5 162 1630 123.0 162 1900 197.0 162 1930 258.0 164 1430 101.0 164 1530 96.2 165 830 92.2 165 930 107.0 165 1100 81.6 165 1130 73.8 165 1500 66.0 165 1600 79.4 166 1000 62.4 167 1630 97.1
daytime r s of upper sunlit leaves ranged between 40 and 100 s m -1, yielding an estimate of canopy resistance (rs/LAI) between 15 and 33 s m -1. In contrast, Kim et al. studied evaporation of wheat on soil which had sufficient moisture
3 3 (0v equaled 0.34 cm cm- ) to allow optimal stomatal opening. Ironically, Kim et al. (1989) reported larger midday stomatal resistances (rs was near
1 110 s m- ), but their canopy had an LAI equal to 6.5, yielding a lower index of 1 canopy resistance (17 s m- ). If these canopy resistances are inserted into the

D. Baldocchi / Agricultural and Forest Meteorology 67 (1994) 191 220 217
relationship shown in Fig. 11, one can conclude that differences between Rc account, in part, for the cited differences in energy partitioning in this and Kim et al.'s study.
The latent heat flux densities reported for corn were much lower than those reported in the literature for closed corn canopies (Davies and Allen, 1973; Uchijima, 1976; Held et al., 1990; McGinn and King, 1990); typical rates approach 1.26 x LEeq Instead, evaporation rates from the partial corn canopy were similar to values from a drying savannah grassland (Gash et al., 1991) and a sparse sedgeland (Lafleur and Rouse, 1990), which had a low leaf area index (0.7) and substantial stomatal resistances (180 s m-l) , as did the corn.
5. Summary and conclusion
Flux densities of energy were measured over a closed wheat and sparse corn canopy and were compared. The Priestley-Taylor equilibrium equation is an adequate means of estimating latent heat flux densities (LE) over a closed and freely transpiring crop, but it fails to predict LE over a dry partial canopy. Hence, it is not recommended to use this approach over growing croplands, water stressed crops and semiarid savannah regions unless some correction is applied. One possible correction scheme involves scaling the ratio LE/LEeq with canopy resistance. The disadvantage of this approach stems from a need for additional (and difficult to obtain) information on the surface's resistance.
Another avenue for estimating evaporation rates from a sparse canopy involves using the two-layer Shuttleworth-Wallace. Wallace et al. (1990), Lafleur and Rouse (1990) and Ham and Heilman (1990) suggest that the Shuttleworth-Wallace model is a superior means for calculating LE over dry sparse canopies because it considers the evaporative contributions from foliage and soil, separately.
Nocturnal evaporation rates over the closed wheat canopy were indepen- dent of available energy, and were driven primarily by the atmosphere's vapor pressure deficit. Because LE was positive when A was negative, it is not recommended to use the Priestley-Taylor equation to estimate nocturnal evaporation over a closed canopy.
Acknowledgments
Funding was provided through US Department of Energy contract DE- AC06-76RLO 1830, in collaboration with Battelle's Pacific Northwest Laboratory.
The author thanks Dr Tilden Meyers, for help in preparing for the experi- ment and for reviewing the manuscript. Field assistance was provided by Dr

218 D. Baldocchi / Agricultural and Forest Meteorology 67 (1994) 191-220
Tom Arnold, Helen Baldocchi, Evo Baldocchi and David Auble. Moral support and companionship during the field experiment was provided by my colleagues Drs Tim Crawford and Ron Dobosy. Frank Lamb of the Eastern Oregon Farming Co. gave us access to his farm and Dr J.C. Doran organized the experiment and provided logistical support through the DOE contract. Dr Ashok Luhar provided an internal review of this manuscript.
References
Anderson, D.E., Verma, S.B. and Rosenberg, N.J., 1984. Eddy correlation measurements of CO2, latent heat, and sensible heat fluxes over a crop surface. Boundary-Layer Meteorol., 29: 263-272.
Auble, D.L. and Meyers. T.P., 1992. An open path, fast response infrared absorption gas analyzer for H20 and CO2. Boundary-Layer Meteorol., 59:243 256.
Avissar, R. and Pielke, R.A., 1991. The impact of plant stomatal control on mesoscale atmospheric circulations. Agric. For. Meteorol., 54: 353-372.
Bailey, W.G. and Davies, J.A., 1981. Evaporation from soybeans. Boundary-Layer Meteorol., 20: 417-428.
Baldocchi, D.D., 1994. A comparative study of mass and energy exchange over a closed C 3 (wheat) and an open Ca (corn) canopy. II: canopy CO2 exchange and water use efficiency. Agric. For. Meteorol., 67: 291-321.
Baldocchi, D.D. and Meyers, T.P., 1991. Trace gas exchange at the floor of a deciduous forest: I. evaporation and CO2 efltux. J. Geophys. Res. Atmos., 96:7271 7285.
Baldocchi, D.D., Verma, S.B., Rosenberg, N.J., Blad, B.L., Garay A. and Specht, J.E., 1983. Influence of leaf pubescence on the mass and energy exchange between soybean canopies and the atmosphere. Agron. J., 75: 537-542.
Baldocchi, D.D., Hicks, B.B. and Meyers, T.P., 1988. Measuring biosphere-atmosphere exchanges of biologically related gases with micrometeorological methods. Ecology, 69: 1331-1340.
Baldocchi, D.D., Luxmoore, R.J. and Hatfield, J.L., 1991. Discerning the forest from the trees: an essay on scaling canopy stomatal conductance. Agric. For. Meteorol., 54:197 226.
Brun, LJ., Enz, J.W. and Larsen, J.K., 1985. Evaluation of energy balance and water use by spring wheat during a normal and a dry season. Agric. For. Meteorol., 35:103 111.
Crawford, T.L., Dobosy, R.J., Baldocchi, D.D. and McMillen, R.T., 1993. Heat, momentum and moisture flux from an airplane: comparison to tower measurements. Preprint Abstract, Proceed- ings of 1993 Annual Meeting of the American Meteorological Society.
Davies, J.A. and Allen, C.D., 1973. Equilibrium, potential and actual evaporation from cropped surfaces in southern Ontario. J. Appl. Meteorol., 12:649 657.
De Bruin, H.A.R., 1983. A model for the Priestley Taylor parameter. J. Clim. Appl. Meteorol., 22: 572-578.
Denmead, O.T., 1969. Comparative micrometeorology of a wheat field and a forest of Pinus radiata. Agric. Meteorol., 6: 357-371.
Denmead, O.T. and Mcllroy, I.C., 1970. Measurements of non-potential evaporation from wheat. Agric. Meteorol., 7: 297-303.
Dickinson, R.E., Henderson-Sellers, A., Rosenzweig, C. and Sellers, P.J., 1991. Evapotranspiration models with canopy resistance for use in climate models, a review. Agric. For. Meteorol., 54: 373- 388.
Doran, J.C., Barnes, F.J., Coulter, R.L. et al., 1992. The Boardman Regional Flux Experiments. Bull. Am. Meteorol. Soc., 73: 1785-1795.

D. Baldocchi / Agricultural and Forest Meteorology 67 (1994) 191 220 219
Dunin, F.X., Meyer, W.S., Wong, S.C. and Reyenga, W., 1989. Seasonal change in water use and carbon assimilation of irrigated wheat. Agric. For. Meteorol., 45:231 250.
Finnigan, J.J. and Raupauch, M.R., 1987. Modern theory of transfer in plant canopies in relation to stomatal characteristics. In: E. Zeiger, G. Farquhar and 1. Cowan (Editors), Stomatal Function. Stanford University Press, Stanford, CA, pp. 385-429.
Fitzjarrald, D.R. and Moore, K.E., 1990. Mechanisms of nocturnal exchange between the rain forest and the atmosphere. J. Geophys. Res. 95(D10): 16,839-16,850.
Flint, A.L. and Childs, S.W., 1991. Use of the Priestley-Taylor evaporation equation for soil water limited conditions in a small forest clearcut. Agric. For. Meteorol., 56:247 260.
Fritschen, L.J. and Gay, L.W., 1979. Environmental Instrumentation. Springer, New York, 216 pp.
Fuchs, M. and Tanner, C.B., 1967. Evaporation from a drying soil. J. Appl. Meteorol. 6: 852--857. Gash, J.H.C, Wallace, J.S., Lloyd, C.R., Dolman, A.J., Sivakumar, M.V.K. and Renard, C., 1991.
Measurements of evaporation from fallow Sahelian savannah at the start of the dry season. Q. J. R. Meteorol. Soc., 117: 749-760.
Gollan, T., Passioura, J.B. and Munns, R., 1986. Soil water status affects the stomatal conductance of fully turgid wheat and sunflower leaves. Aust. J. Plant Physiol., 13: 459-464.
Green, S.R., McNaughton, K.G. and Clothier, B.E., 1989. Observations of night-time water use in kiwifruit vines and apple trees. Agric. For. Meteorol., 48:251 261.
Ham, J.M. and Heilman, J.L., 1991. Aerodynamic and surface resistances affecting energy transport in a sparse crop. Agric. For. Meteorol., 53: 267-284.
Hamming, R.M, 1983. Digital Filters, 2nd edition. Prentice-Hall, Englewood Cliffs, N.J., 254 pp. Held, A.A., Steduto, P., Orgaz, F., Matista, A. and Hsiao, T.C., 1990. Bowen ratio/energy balance
technique for estimating crop net CO2 assimilation, and comparison with a canopy chamber. Theor. Appl. Climatol., 42" 203-213.
Jacobs, C.M.J. and De Bruin, H.A.R., 1992. The sensitivity of regional transpiration to land-surface characteristics: significance of feedback. J. Clim. 5: 683-698.
Jarvis, P.G. and McNaughton, K.G., 1986. Stomatal control of transpiration: scaling up from leaf to region. Adv. Ecol. Res., 15: 1-48.
Kaimal, J.C. and Gaynor, J.E., 1991. Another look at sonic thermometry. Boundary-Layer Me- teorol., 56: 401-410.
Kaimal, J.C., Gaynor, J.E., Zimmerman H.A. and Zimmerman, G.A., 1990. Minimizing flow distortion errors in a sonic anemometer. Boundary-Layer Meteorol., 53:103 115.
Kim, J., Verma S.B. and Rosenberg, N.J., 1989. Energy balance and water use of cereal crops. Agric. For. Meteorol., 48: 135-147,
Lafleur, P.M. and Rouse, W.R, 1990. Application of an energy combination model for evaporation from sparse canopies. Agric. For. Meteorol., 49:135 153
Mahfouf, J.F. and Noilhan, J., 1991. Comparative study of various formulations of evaporation from bare soil using in situ data. J. Appl. Meteorol., 30: 1354-1365.
Malek, E., 1992. Night-time evaporation vs. daytime and 24 h evaporation. J. Hydrol., 138: 119- 129.
McGinn, S.M. and King, K.M., 1990. Simultaneous measurements of heat, water vapour and CO2 fluxes above alfalfa and maize. Agric. For. Meteorol., 49:331 349.
McMillen, R.T, 1988. An eddy correlation technique with extended applicability to non-simple terrain. Boundary-Layer Meteorol., 43: 231-245.
McNaughton, K.G., 1989. Regional interactions between canopies and the atmosphere. In: G. Russell, B. Marshall and P.G. Jarvis (Editors), Plant Canopies: Their Growth, Form and Func- tion. Cambridge University Press, Cambridge, pp. 63-81.
McNaughton, K.G. and Jarvis, P.G., 1986. Predicting effects of vegetation changes on transpiration and evaporation. In: T.T. Kozlowski (Editor), Water Deficits and Plant Growth, vol. VII. Aca- demic Press, New York, pp. 1-47.

220 D. Baldocehi / Agricultural and Forest Meteorology 67 (1994) 191 220
McNaughton, K.G. and Spriggs, T.W., 1986. A mixed-layer model for regional evaporation. Bound- ary-Layer Meteorol., 34:243 262.
McNaughton, K.G. and Spriggs, T.W., 1989. An evaluation of the Priestley and Taylor equation and the complementary relationship using results from a mixed-layer model of the convective bound- ary layer. In: T.A. Black, D.L. Spittlehouse, M.D. Novak and D.T. Price (Editors), Estimation of Areal Evapotranspiration, IAHS Publications, Wallingford, pp. 89-103.
Monteith, J.L, 1965. Evaporation and environment. Symp. Soc. Exp. Biol., 19: 206-234. Monteith, J.L. and Unsworth, M., 1990. Principles of Environmental Physics, 2rid edition, 291 pp. Pearcy, R.W. and Ehleringer, J., 1984. Comparative ecophysiology of C3 and C4 plants. Plant Cell
Environ., 7: 1-13. Priestley, C.H.B. and Taylor, R.J., 1972. On the assessment of surface heat flux and evaporation
using large-scale parameters. Mon. Weather Rev., 100(2): 81 92. Rawson, H.M. and Clarke, J.M., 1988. Nocturnal transpiration in wheat. Aust. J. Plant Physiol., 15:
397-406. Rochette, P., Pattey, E., Desjardins, R.L., Dwyer, L.M., Stewart D.W. and Dube, P.A., 1991.
Estimation of maize (Zea mays L.) canopy conductance by scaling up leaf stomatal conduc- tance. Agric. For. Meteorol., 54: 241-261.
Rosenberg, N.J, 1969. Seasonal patterns in evapotranspiration by irrigated alfalfa in the central great plains. Agron. J., 61: 879-886.
Shuttleworth, W.J, 1991. Evaporation models in hydrology. In: T.J. Schmugge and J.-C. Andr+ (Editors), Land Surface Evaporation., Springer, New York, pp. 93-120.
Shuttleworth, W.J. and Calder, I.R., 1979. Has the Priestley Taylor equation any relevance to forest evaporation? J. Appl. Meteorol., 18: 639-646.
Shuttleworth, W.J. and Wallace, J.S., 1985. Evaporation from sparse crops--an energy combination theory. Q. J. R. Meteorol. Soc., 111: 839--855.
Sreenivasan, K.R., Chambers A.J. and Antonia, R.A., 1978. Accuracy of moments of velocity and scalar fluctuations in the atmospheric surface layer. Boundary-Layer Meteorol., 14: 341-359.
Uchijima, Z., 1976. Maize and rice. In: J.L. Monteith (Editor), Vegetation and the Atmosphere, vol. 2. Academic Press, New York, pp. 33 64.
Verma, S.B, 1989. Aerodynamic resistances to transfers of heat, mass and momentum. In: T.A. Black D.L. Spittlehouse, M.D. Novak and D.T. Price (Editors) Estimation of Areal Evapotranspira- tion. IAHS Publications, Wallingford, UK, pp 13 20.
Wallace, J.S., Roberts J.M. and Sivakumar, M.V.K., 1990. The estimation of transpiration from sparse dryland millet using stomatal conductance and vegetation area indices. Agric. For. Meteorol. 51: 35-49.