a comparative study on implementation of genetic algorithm (ga) and atc to generator siting in...
TRANSCRIPT

8/10/2019 A Comparative Study on Implementation of Genetic Algorithm (GA) and ATC to Generator Siting in Nigerian 330KV …
http://slidepdf.com/reader/full/a-comparative-study-on-implementation-of-genetic-algorithm-ga-and-atc-to 1/11
International Journal of Engineering Sciences, 2(8) August 2013, Pages: 350-360
TI Journals
International Journal of Engineering Scienceswww.tijournals.com
ISSN2306-6474
* Corresponding author.
Email address: [email protected]
A Comparative Study on Implementation ofGenetic Algorithm (GA) and ATC toGenerator Siting in Nigerian 330KV Power Network
A. A. Sadiq *1, M. N. Nwohu
2, J. G. Ambafi
3
1,2,3 Department of Electrical and Electronics Engineering, Federal University of Technology, Minna. Nigeria.
A R T I C L E I N F O A B S T R A C T
Keywords:
Generator Siting
Genetic Algorithm (GA)
Available Transfer Capability (ATC)
Power NetworkPower loss
As the Nigerian electricity market tends towards deregulation thereby encouraging Independent
Power Producers (IPP), one key issue is the optimal location of t heir generating units for a given
network. In this paper, the application of Available Transfer Capability (ATC) expected values
among selected candidate buses is used as criterion to siting of new generator. However, Genetic
algorithm (GA) approach is employed to locate the optimal bus for siting a new generationresource and a comparison between the use of ATC level index and GA is made. The results shows
that the use of genetic algorithm for real power loss minimization is a better technique for optimalgenerator siting when compared with ATC level index.
© 2013 Int. j. eng. sci. All rights reserved for TI Journals.
1. Introduction
As the Nigerian electric power industry is tending to a competitive and deregulated electricity market in order to meet the ever-increasing
electricity demand in the country, there is the need for an index for decision making on trading strategies and reliable operations, betterlocation of new generation resources and generation investment plans thereby enhancing the economic incentive to Independent PowerProducers (IPP). Moreover, location of new traditional large thermal plants and the need for transmission grid expansion are becoming
difficult in a regulated power structure due to environmental and economic issues, hence, deregulation tends to favour private plants
managed and operated by independent power producers (IPP). One key issue for these private plants is the optimal location of theirgeneration units for a given network [1]. Often the economic benefit accrue to a given location is an important factor in the siting of newgeneration resources by private power operators. Various indices are used in the location of new generators, namely, ATC level [1],Locational Marginal Pricing [2], as well as the optimal siting and sizing of distributed generation which are either based on loss sensitivity
on bus voltage [3, 4] or heuristic approaches which are based on optimization [5-12]. In this paper, two approaches; ATC level and use ofGenetic algorithm (GA) based on real power loss minimization are used for siting new generation resources in the Nigerian 330KV powernetwork, performance comparison is made between ATC level as index and the use of GA as criterion to locate new generation resources.The basic idea is to optimally locate a new generation resource capable of supplying the increase in a given area load. In the case study
considered here (Nigerian Grid) four (4) new suitable buses (one in each area) will be identified as the optimal buses amongst a given Areacandidate buses, and the optimal bus in the entire network also established.
2. Available transfer capability implementation
2.1 Available Transfer Capability level IndexFor some given area candidate buses, estimate of the probability distribution of ATC from these candidates’ buses to other locations within
the area could be used as guide in appropriate location of new generation resources [1]. The ATC level index favours the location (bus)with higher ATC values thereby resulting in additional amount of power transferable from a given location. At a given market price, higher
Transfer Capability level implies the likelihood of engaging in bilateral and multilateral transaction which could accrue more economic benefit for the IPP.
2.2 The Nigerian 330kV Network Nigerian 330KV voltage level heretofore referred to as the Nigerian grid. In PSAT environment, the Nigerian grid is a power network ofthirty two (32) buses, twenty seven (27) transmission lines and seven (7) generating stations. The installed generating capacity of the
Nigerian grid is 7, 461MW including hydro resources and gas fired (thermal). The Nigerian grid is made up of 5, 523.8km of 330 kVtransmission lines and thirty two (32) 330/132kV substations with total installed transformation capacity of 7, 688 MVA (equivalent to 6,534.8 MW). The Average Available Capacity on 330/132kV is 7, 364MVA which is about 95.8% of Installed capacity [13,14]. The
Nigerian grid system, in this research work, is zoned into four geographical areas in conformity with the control structure of the electric

8/10/2019 A Comparative Study on Implementation of Genetic Algorithm (GA) and ATC to Generator Siting in Nigerian 330KV …
http://slidepdf.com/reader/full/a-comparative-study-on-implementation-of-genetic-algorithm-ga-and-atc-to 2/11
A Comparative Study on Implementation of Genetic Algorithm (GA) and ATC to Generator Siting in Nigerian 330KV Power Network
International Journal of Engineering Sciences, 2(8) August 2013
351
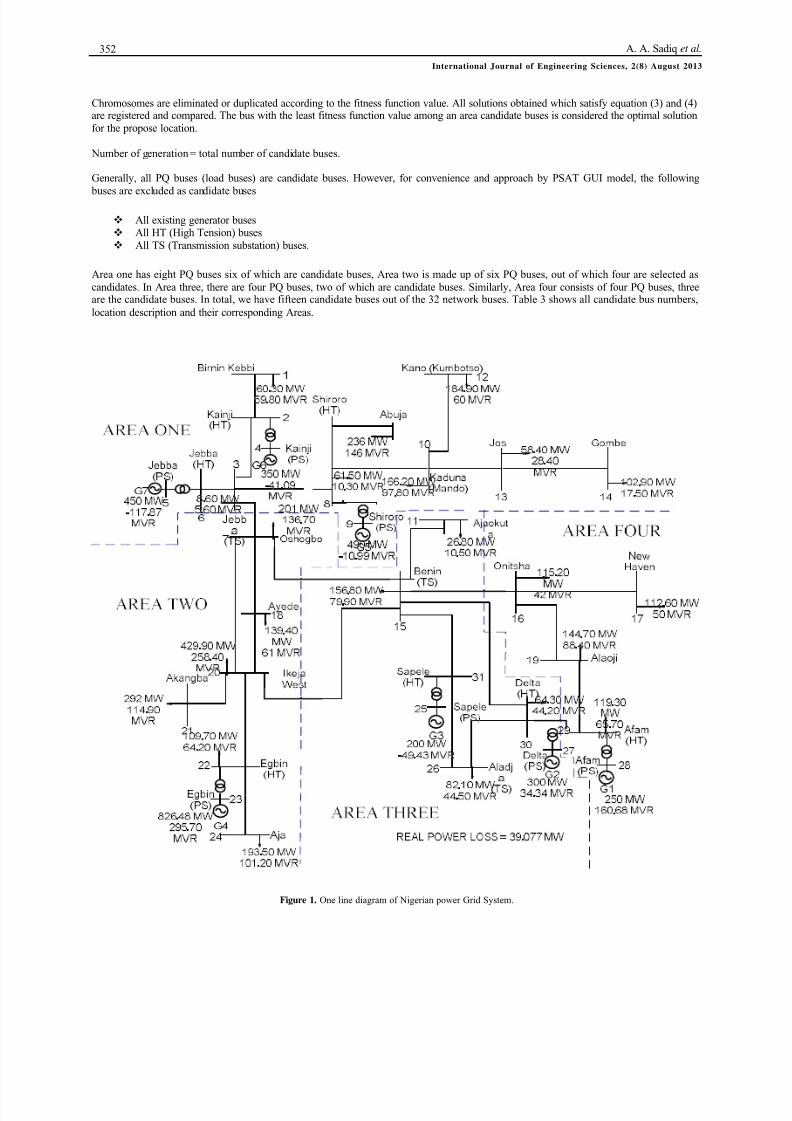
utility, Power Holding Company of Nigeria (PHCN). Table 1 gives the location of the seven power generating station and their respectiveinstalled capacity. Table 2 shows the Transmission line parameters and the line thermal limit of the Nigerian grid while Figure 1 shows theone line diagram of the Nigerian grid identifying the Areas.
Table 1. Electricity Power Stations of the Nigerian Power Grid.
Power Station Egbin Sapele Afam Delta Kainji Shiroro Jebba
Type/Fuel Used Gas Thermal Thermal Thermal Hydro Hydro Hydro
Installed Capacity(MW) 1320 1020 969.6 912 760 600 578.4
Source: PHCN (2004)
2.3 Location Using ATC level indexHybridized continuous-repeated power flow structure is used to evaluate the ATC. A reformulation of the power flow equation is requiredto apply continuation method to power flow problem. A loading parameter (λ) is inserted into the power flow equations to parameterize theload-flow equation [15]. A constant power load model is documented in [16] and at the maximum loading parameter (λ max), the ATC iscalculated using equation (1)
k i k i
i
L
i
LPP ATC
sin sin
max0)( (1)
3. Genetic algorithm (GA) implementation
3.1 Genetic Algorithm (GA)Genetic algorithm is a search technique based on natural genetics and inspired by evolution [17]. Individuals are selected based on definedfitness level. For a given population (candidate buses), total network real power loss will be minimized and the voltage deviation away
from 1.0p.u measured. The bus which results in least real power loss less than the base case (before siting a new generator) is consideredideal for better location of a new generator. A ratio of grid loss after and before siting of generator at all candidate buses is an importantoutput of GA thereby identifying the optimal candidate bus within an area.
3.2 Optimal Location Using Genetic AlgorithmThe fitness function considered is made up of two terms, the real power loss ratio and the voltage deviation term. The total network real
power loss by Newton Raphson Power flow method (N-R) in electric network is defined as in equation (2).
( )
ngrid
loss G L lossi
P P P P (2)
whereG
P and L
P is the total real power injected and total real power demand of the grid.
The ratio of grid
lossP after and before the location of new generation at all candidate buses are considered for minimization. Ideally, it is
desired that all network bus voltages be maintained at 1.0p.u, the voltage deviation term measures the deviation in voltage of the candidate bus from this desired value and the bus with higher or lower voltage value which is penalized by adding the deviation value to the f itnessfunction value.
3.3 Genetic Algorithm (GA) objective functionWe therefore defined the fitness function as:
Min.
igrid
loss
igrid
loss
i
igrid
lossV
P
PV P f 1),(
0 _
_ _
(3)
Subject to:
_ _0grid i grid
loss lossP P
(4)0.9 ≤ Vi ≤ 1.1p.u (5)
So that _ 0grid
lossP is the total grid loss before location, which is expected to be same for all candidate buses and _ grid i
lossP is the total grid loss
after locating a new generator at the ith
bus. Vi is the ith bus voltage before the location of a generator since it is desired to keep that bus at
1.0p.u by making it the slack bus, thereby supplying the network real power loss. The total grid loss before placement is _ 0 39.077
grid
lossP MW
8/10/2019 A Comparative Study on Implementation of Genetic Algorithm (GA) and ATC to Generator Siting in Nigerian 330KV …
http://slidepdf.com/reader/full/a-comparative-study-on-implementation-of-genetic-algorithm-ga-and-atc-to 3/11
A. A. Sadiq et al.
International Journal of Engineering Sciences, 2(8) August 2013
352
Chromosomes are eliminated or duplicated according to the fitness function value. All solutions obtained which satisfy equation (3) and (4)are registered and compared. The bus with the least fitness function value among an area candidate buses is considered the optimal solution
for the propose location.
Number of generation = total number of candidate buses.
Generally, all PQ buses (load buses) are candidate buses. However, for convenience and approach by PSAT GUI model, the following
buses are excluded as candidate buses
All existing generator buses
All HT (High Tension) buses
All TS (Transmission substation) buses.
Area one has eight PQ buses six of which are candidate buses, Area two is made up of six PQ buses, out of which four are selected as
candidates. In Area three, there are four PQ buses, two of which are candidate buses. Similarly, Area four consists of four PQ buses, threeare the candidate buses. In total, we have fifteen candidate buses out of the 32 network buses. Table 3 shows all candidate bus numbers,
location description and their corresponding Areas.
Figure 1. One line diagram of Nigerian power Grid System.

8/10/2019 A Comparative Study on Implementation of Genetic Algorithm (GA) and ATC to Generator Siting in Nigerian 330KV …
http://slidepdf.com/reader/full/a-comparative-study-on-implementation-of-genetic-algorithm-ga-and-atc-to 4/11
A Comparative Study on Implementation of Genetic Algorithm (GA) and ATC to Generator Siting in Nigerian 330KV Power Network
International Journal of Engineering Sciences, 2(8) August 2013
353
Table 2. Transmission Line data of Nigerian Grid.
*100MVA base for p.u. values.
LINE LOCATION
DESCRIPTION
LOCATION
DESCRIPTION
Thermal
Rating
Thermal
Rating
NO. I J
LINE PARAMETERS (P.U.)*
(AMPS) (MVA)
R X B
1 kainji (HT) Birnin kebbi 0.01218 0.09163 1.0269 1360 777.4
2 kainji (HT) Jebba (TS) 0.00159 0.01197 0.5366 1360 777.43 Kainji (PS) Kainji (HT) 0 0.01351 0 860
4 Jebba (HT) Jebba (TS) 0.00016 0.00118 0.053 1360 777.4
5 Jebba (TS) Oshogbo 0.00206 0.01547 1.56 1360 777.4
6 Shiroro (HT) Jebba (TS) 0.0048 0.03606 1.6165 1360 777.4
7 Jebba (PS) Jebba (HT) 0 0.01932 0 714
8 Oshogbo Benin(TS) 0.00987 0.07419 0.8315 1360 777.4
9 Oshogbo Ayede 0.00412 0.03098 0.3472 1360 777.4
10 Oshogbo Ikeja West 0.01163 0.0875 0.9805 1360 777.4
11 Shiroro (PS) Shiroro (HT) 0 0.01638 0 800
12 Shiroro (HT) Kaduna(Mando) 0.00189 0.01419 0.636 1360 777.4
13 Kaduna(Mando) Kano(Kumbotso) 0.00904 0.06799 0.7619 1360 777.4
14 Kaduna(Mando) Jos 0.00774 0.05832 0.6526 1360 777.4
15 Benin(TS) Ajaokuta 0.00766 0.05764 0.646 1360 777.4
16 Jos Gombe 0.01042 0.07833 0.8778 1360 777.4
17 Ayede Ikeja West 0.00538 0.0405 0.4538 1360 777.4
18 Ikeja West Benin(TS) 0.0055 0.04139 1.885 1360 777.4
19 Delta (HT) Benin(TS) 0.00287 0.02158 0.2418 1360 777.420 Sapele (HT) Benin(TS) 0.00098 0.00739 0.3313 1360 777.4
21 Onitsha New haven 0.00377 0.02838 0.318 1360 777.4
22 Alaoji Onitsha 0.00605 0.04552 0.5101 1360 777.4
23 Benin(TS) Onitsha 0.00538 0.0405 0.454 1360 777.4
24 Afam (HT) Alaoji 0.00049 0.00369 0.1656 1360 777.4
25 Ikeja West Akangba 0.00036 0.00266 0.119 1360 777.4
26 Egbin (HT) Ikeja West 0.00122 0.00916 0.4108 1360 777.4
27 Egbin (PS) Egbin (HT) 0 0.00648 0 1620
28 Egbin (HT) Aja 0.00028 0.00207 0.0928 1360 777.4
29 Sapele (PS) Sapele (HT) 0 0.01204 0 1177
30 Delta (HT) Alaodja 0.00102 0.00769 0.08613 1360 777.4
31 Sapele (HT) Alaodja 0.00248 0.01862 0.2087 1360 777.4
32 Delta (PS) Delta (HT) 0 0.01333 0 720
33 Afam (PS) Afam (HT) 0 0.01422 0 504
34 Shiroro (HT) Katampe (Abuja) 0.0025 0.0195 0.413 1360 777.4
Source: PHCN (2004).
Table 3. Candidate buses for siting new generation Resources
Bus Num. Bus Location Bus Type Area Num.
Bus1 Birnin Kebbi PQ 1
Bus4 Kano PQ 1
Bus10 Kaduna PQ 1
Bus13 Jos PQ 1
Bus14 Gombe PQ 1
Bus32 Abuja PQ 1
Bus8 Akangba PQ 2
Bus9 Ayede PQ 2
Bus23 Aja PQ 2
Bus29 Ikeja West PQ 2
Bus5 Aladja PQ 3
Bus11 Ajaokuta PQ 3
Bus6 Onitsha PQ 4
Bus 17 New haven PQ 4
Bus19 Alaoji PQ 4
Figure 2 shows the flow chart of the Genetic algorithm method for real power loss minimization.
Figure 3 represent Area one simulink model of the Nigeria 330KV Power Grid.
Figure 4 represents Area two, three and four simulink model of Nigeria 330KV power Grid.

8/10/2019 A Comparative Study on Implementation of Genetic Algorithm (GA) and ATC to Generator Siting in Nigerian 330KV …
http://slidepdf.com/reader/full/a-comparative-study-on-implementation-of-genetic-algorithm-ga-and-atc-to 5/11
A. A. Sadiq et al.
International Journal of Engineering Sciences, 2(8) August 2013
354
Figure 2. Flowchart of GA Algorithm for optimal location of new generation resource.
Figure 3. Area One PSAT Model of Nigeria Power Grid.

8/10/2019 A Comparative Study on Implementation of Genetic Algorithm (GA) and ATC to Generator Siting in Nigerian 330KV …
http://slidepdf.com/reader/full/a-comparative-study-on-implementation-of-genetic-algorithm-ga-and-atc-to 6/11
A Comparative Study on Implementation of Genetic Algorithm (GA) and ATC to Generator Siting in Nigerian 330KV Power Network
International Journal of Engineering Sciences, 2(8) August 2013
355
Figure 4. Area Two, Three and Four PSAT Model of Nigeria Power Grid
4. Results
4.1 ATC Computed Values The use of ATC level as indicator for optimal siting of generation resources was studied and probability distribution of inter-area ATCvalues between candidate PQ buses are presented in Tables 4 to 7. Tables 4, 5, 6, and 7 give the ATC expected values among different PQ
buses in Area 1, Area 2, Area 3 and Area 4 respectively. The ATC values of Tables 4 through 7 were used to plot Figures 5 through 8 andwere discussed in the following sub-headings.
Table 4. ATC expected values among candidate PQ buses in Area 1 of Nigeria Grid
ATC Expected values from bus 1 to other buses (MW)
S/No. From Bus 1 1 1 1 1 1 1
To Bus 3 4 10 13 14 30 321
ATC (MW) CPFLOW/RPF 219.44 67.91 170.77 117.64 64.4 212.53 203.85
ATC Expected values from bus 4 to other buses (MW)
From Bus 4 4 4 4 4 4 4
To Bus 1 3 10 13 14 30 322
ATC (MW) CPFLOW/RPF 78.95 632.35 535.77 173.9 123.72 648.96 307.25
ATC Expected values from bus 10 to other buses (MW)
From Bus 10 10 10 10 10 10 10
To Bus 1 3 4 13 14 30 323
ATC (MW) CPFLOW/RPF 77.66 823.47 106.42 209.16 128.62 1033.9 329.13
ATC Expected values from bus 13 to other buses (MW)
From Bus 13 13 13 13 13 13 13
To Bus 1 3 4 10 14 30 324
ATC (MW) CPFLOW/RPF 78.13 587.2 81.57 300.39 232.01 622.74 275.17
ATC Expected values from bus 14 to other buses (MW)
From Bus 14 14 14 14 14 14 14
To Bus 1 3 4 10 13 30 325
ATC (MW) CPFLOW/RPF 78.21 366.12 80.91 217.56 277.28 359.32 249.82
ATC Expected values from bus 32 to other buses (MW)
From Bus 32 32 32 32 32 32 32
To Bus 1 3 4 10 13 14 306
ATC (MW) CPFLOW/RPF 78.65 717.87 92.89 208.02 149.44 110.24 740.63

8/10/2019 A Comparative Study on Implementation of Genetic Algorithm (GA) and ATC to Generator Siting in Nigerian 330KV …
http://slidepdf.com/reader/full/a-comparative-study-on-implementation-of-genetic-algorithm-ga-and-atc-to 7/11
A. A. Sadiq et al.
International Journal of Engineering Sciences, 2(8) August 2013
356
Table 5. ATC expected values among candidate PQ buses in Area 2 of Nigeria Grid
ATC Expected values from bus 8 to other buses (MW)
S/NO From Bus 8 8 8 8 8
To Bus 7 9 15 23 291
ATC (MW) CPFLOW/RPF 772.44 597.31 397.25 385.01 750.96
ATC Expected values from bus 9 to other buses (MW)
From Bus 9 9 9 9 9
To Bus 7 8 15 23 292
ATC (MW) CPFLOW/RPF 978.52 276.30 180.09 193.55 217.88
ATC Expected values from bus 23 to other buses (MW)
From Bus 23 23 23 23 23
To Bus 7 8 9 15 293
ATC (MW) CPFLOW/RPF An infeasible base case (thermal limits)
ATC Expected values from bus 29 to other buses (MW)
From Bus 29 29 29 29 29
To Bus 7 8 9 15 234
ATC (MW) CPFLOW/RPF 869.05 396.79 619.72 411.37 436.01
Table 6. ATC expected values among candidate PQ buses in Area 3 of Nigeria Grid
ATC Expected values from bus 5 to other buses (MW)
S/NO From Bus 5 5 5
To Bus 2 11 24
1 ATC (MW) CPFLOW/RPF 747.18 243.90 801.71
ATC Expected values from bus 11 to other buses (MW)
From Bus 11 11 11
To Bus 2 5 242
ATC (MW) CPFLOW/RPF 497.63 498.52 500.34
Table 7. ATC expected values among candidate PQ buses in Area 4 of Nigeria Grid
ATC Expected values from bus 6 to other buses (MW)
S/NO From Bus 6 6 6
To Bus 17 19 221
ATC (MW) CPFLOW/RPF 400.3 435.3 440.5
ATC Expected values from bus 17 to other buses (MW)
From Bus 17 17 17
To Bus 6 19 222
ATC (MW) CPFLOW/RPF 604 388.6 399.2
ATC Expected values from bus 19 to other buses (MW)
From Bus 19 19 19
To Bus 6 17 223
ATC (MW) CPFLOW/RPF 372.8 166.8 847.1
4.1.1 Area One Location
Figure 5 shows the ATC expected values among candidate buses in Area one of Nigerian grid. As depicted in Figure 5, bus 4, bus 10 and bus 32 reach higher ATC expected values hence these buses are suitable for siting new generator as they t end to provide more economic benefit.

8/10/2019 A Comparative Study on Implementation of Genetic Algorithm (GA) and ATC to Generator Siting in Nigerian 330KV …
http://slidepdf.com/reader/full/a-comparative-study-on-implementation-of-genetic-algorithm-ga-and-atc-to 8/11
A Comparative Study on Implementation of Genetic Algorithm (GA) and ATC to Generator Siting in Nigerian 330KV Power Network
International Journal of Engineering Sciences, 2(8) August 2013
357
Figure 5. Comparison of ATC expected values among candidate buses in Area one of Nigerian grid.
4.1.2 Area Two Location
Among the candidate buses in Area two, bus 8 and bus 29 reach higher ATC expected values. These buses are therefore considered suitable
for siting new generators as depicted in Figure 6.
Figure 6. Comparison of ATC expected values among candidate buses in Area Two of Nigerian grid.
4.1.3 Area Three Location
Two candidate buses in Area three of Nigerian grid are considered, bus 5 and bus 11. Figure 7 shows the ATC distribution from buses 5and 11 to other PQ buses in Area three. From the figure bus 5 is considered best for siting new generation resource since bus 5 reach higherATC values to buses 2 and 24 when compared with bus 11.
Figure 7. Comparison of ATC expected values among candidate buses in Area Three of Nigerian grid.

8/10/2019 A Comparative Study on Implementation of Genetic Algorithm (GA) and ATC to Generator Siting in Nigerian 330KV …
http://slidepdf.com/reader/full/a-comparative-study-on-implementation-of-genetic-algorithm-ga-and-atc-to 9/11
A. A. Sadiq et al.
International Journal of Engineering Sciences, 2(8) August 2013
358
4.1.4 Area Four Location
In Area four, three candidate buses are viable: buses 6, 17 and 19. Figure 8 shows the ATC expected values from candidate buses to otherPQ buses in Area Four of Nigerian grid. In the case of Area four, it is observed that ATC level as index for optimal siting of generators isnot effective. As depicted in Figure 8, it is difficult to clearly identify a suitable candidate bus for optimal location. However, from thefigure, buses 6 and 17 seem suitable.
Figure 8. Comparison of ATC expected values among candidate buses in Area Four of Nigerian grid.
4.2 Genetic Algorithm (GA) for Real Power Loss Minimization.
GA program written in MATLAB environment is used to optimally find the bus with least real power loss. Within a given area of the Nigerian grid, candidate bus with the least real power loss and satisfying equation (4) and (5) is considered the most suitable bus. Figure 9shows the fitness function value of candidate buses while Figure 10 gives the bus loss ratio for all candidate buses of the Nigerian grid.From these figures, the most suitable buses for each area was identified and tabulated in Table 8.While ATC level index has some difficulty in identifying the most suitable bus, GA method gives clear information as to the optimal busmost suitable for siting the generator.
Figure 9. Fitness function value of candidate buses of Nigerian grid
Table 8. Comparison between ATC level Index and GA method for Optimal Siting of new Generator.
Suitable Buses
Area(s) Candidate Buses ATC Level Index GA Loss Ratio Method
Area 1 1,4,10,13,14 and 32 4,10 and 32 4
Area 2 8,9 and 29 8 and 29 8
Area 3 5 and 11 5 5
Area 4 6,17 and 19 6 and 17 6

8/10/2019 A Comparative Study on Implementation of Genetic Algorithm (GA) and ATC to Generator Siting in Nigerian 330KV …
http://slidepdf.com/reader/full/a-comparative-study-on-implementation-of-genetic-algorithm-ga-and-atc-to 10/11
A Comparative Study on Implementation of Genetic Algorithm (GA) and ATC to Generator Siting in Nigerian 330KV Power Network
International Journal of Engineering Sciences, 2(8) August 2013
359
Figure 10. Losses ratio of candidate buses of Nigerian grid
From Figure 9 and Figure 10, bus 4 is the most suitable candidate of all candidate buses considered in the Nigerian grid. Figure 11 shows a
comparison of the grid voltage profile before and after the location of new generator at bus 4.
Figure 11. Voltage profile before and after location of generator at bus four
Figure 11 shows a slight improvement in the voltage profile of the Nigerian power grid when a new generator is located at bus 4. This
demonstrate that the use of genetic algorithm for real power loss minimization is a better technique for optimal generator siting whencompared with ATC level index. It is also observed that all bus voltages lie within specified range (0.9p.u. to 1.1p.u.).
5. Conclusion
This paper has discussed the index with which to estimate the position of the generation source, but with limitation of determining the
optimal point for generator siting. By heuristic optimization considered, optimal generator siting was achieved through real power loss
minimization, thus enhancing the voltage profile and equitable distribution of power on the entire Nigerian power grid. The comparative
performance of the GA written and implemented in MATLAB environment gives this technique prominent use in determining the optimal
location of the generation sources.

8/10/2019 A Comparative Study on Implementation of Genetic Algorithm (GA) and ATC to Generator Siting in Nigerian 330KV …
http://slidepdf.com/reader/full/a-comparative-study-on-implementation-of-genetic-algorithm-ga-and-atc-to 11/11
A. A. Sadiq et al.
International Journal of Engineering Sciences, 2(8) August 2013
360
References
[1] Yuan-Kang, W. (2007). A novel algorithm for ATC calculations and applications in der egulated electricity markets. Electrical Power and Energy
Systems , 810-821.
[2]
Hamound, G., & Bradley, I. (2004). Assessment of Transmission Congestion Cost and Locational Marginal Pricing in a Competive Electricity
Market. IEEE Transaction on Power System, Vol. 19, No. 2 , 769-775.
[3] Satish, K., B.B.R, S., Barjeev, T., & Vishal, K. (2011). Optimal Placement of Distributed Generation in Distribution Networks. International Journal
of Engineering, Science and Technology. Vol. 3, No. 3 , 47-55.
[4]
Amanifar, O., & M.E. Hamedani, G. (2011). Optimal Distributed Generation Placement and Sizing for Loss and THD Reduction and VoltageProfile Improvement in Distribution Systems Using Particle Swarm Optimization and Sensitivity Analysis. "Intenational Journal on Technical and
Physical Problems of Engineering" (IJTPE) , 47-53.
[5] Mohammad, F. S., & Morteza, S. (2012). Applying BCO Algorithm to Solve Optimal DG Placement and Sizing Problem. Electrical and Electrical
Engineering 2(2), DOI: 10.5923/j eee.20120202.06 , 31-37.
[6]
Kotb, M., Shebl, K., El Khazendar, M., & El Husseiny, A. (2010). Genetic Algorithm for Optimal Siting and Sizing of Distributed Generation. 14th
International Middle East Power Systems Conference (MEPCON), (pp. 433-440). Cairo University, Egypt.[7] S. Chandrashekhar, R., Prasad, P., & A. Jaya, L. (2012). Optimal Number and Location of DGs to Improve Power Quality of Distributed Systems
Using Particle Swarm Optimization. International Journal of Engineering Research and Applications (IJERA). Vol. 2, Isssue 3 , 3077-3082.
[8] Abbagana, M., Bakare, G., & Mustapha, I. (2011). Optimal Placement and Sizing of A Distributed Generation in A Power Distribution SystemUsing Differential Evolution. 1st International Technolog. Education and Environment Conference (c) Afreical Society for Scientific Research
(ASSR), (pp. 536-549).
[9] Arash, A., Farzad, M., Seyed, J., Shenava, S., & Aref, J. (2005). Optimal Sizing and Siting in Radial Standard System Using PSO. American Journalof Scientific Research , 50-58.
[10]
Razazadehl, A., Sedighizadehl, M., & Alavian, A. (2009). Optimal sizing and Siting of Distributed Generation for Power System Transient Stability
Ehancement Using Genetic Algorithm. IACSIT International Journal of Computer Theory and Engineering, Vol. 1, No. 5 , 387-390.
[11] Mohammad, S. M., & Soodabeh, S. (2011). Optimum Allocation of Distributed Generations Based on Evolutionary Programming for LossReduction and Voltage Profilr Correction. International Journal of Computer Science & Technology , 7-11.
[12]
Noradin, G., Aref, J., & Rasoul, G. (2012). Optimum Allocation of Distributed Generation Based on Multi Objective Function with GeneticAlgorithm. Journal of Basic and Applied Scientic Research , 185-191.
[13]
Eseosa, O., & Odiase, F. O. (2012). Efficiency Improvement of Nigeria 330kV Network Using Flexible Alternating Current Transmission Systems
(FACTS) Devices. International Journal of Advances in Engineering & Technology, Vol. 4, Issue 1 , 26-41.
[14] Labo, H. S. (2010). Investors Forum For The Privatisation Of PHCN Successor Companies. Abuja: Transmission Company of Nigeria.[15]
Venkataramana, A., & Colin, C. (1992). The Continuation Power Flow: A Tool for Steady State Voltgae Stability Analysis. IEEE Transactions
Power System , 416-423.
[16] Sadiq, A. A. & Nwohu, M. N. (2013). Evaluation of Inter-Area Available Transfer Capability of Nigeria 330KV Network. International Journal of
Engineering and Technology Vol. 3 No. 2.
[17] Ambafi, J. G. (2012). "Performance Evaluation of PSS and STATCOM on Oscillation damping: A case Study of the North-Central Nigeria 330KV
Network Grid System, Lambert Academic Publishing, Germany. pp. 31 -32