a comparison of accommodation and ocular discomfort …
TRANSCRIPT
RESEARCH ARTICLE Open Access
A comparison of accommodation andocular discomfort change according todisplay size of smart devicesJeong Woo Kang1, Yeoun Sook Chun2 and Nam Ju Moon2*
Abstract
Background: To evaluate the change of accommodation and ocular discomfort according to the display size, usingquantitative measurements of accommodation and ocular discomfort through subjective and objective metrics.
Methods: Forty six subjects without any ophthalmic disease history were asked to watch the documentary movie,using two different sizes of smart devices; smartphones and tablets. Before and after using devices, the near pointaccommodation (NPA) and the near point convergence (NPC) were measured, and objective accommodation wasmeasured using an auto refractometer/keratometer. The subjective ocular discomfort was assessed through a survey.
Results: Both devices showed a decrease in post-use NPA and NPC, and the change after use of the smartphone wassignificantly severe, 1.8 and 2.5 folds respectively, compared to tablet (p = 0.044, p = 0.033, respectively). Neithersmartphone nor tablet showed significant changes in the accommodative response induced by dynamicaccommodative stimulus of auto refractometer/keratometer (p = 0.240 and p = 0.199, respectively). Subjects showed amore severe increase in ocular discomfort after using smartphones (p = 0.035) and reported feeling tired even withshorter use times (p = 0.012).
Conclusions: Both devices showed significant decreases in NPA and NPC, and the larger changes were seen whenusing the small display smartphone. Even within 20minutes of using, subjects start to feel ocular discomfort, and it wasmore severe and faster after smartphones than tablets. Therefore, the smaller the display size, the greater the adverseimpact on eyes, and thus, appropriate display size will need to be selected depending on the time and purpose of use.
Keywords: Accommodation, Display size, Ocular discomfort, Smart device
BackgroundWith the drastic changes in the information age, the useof smart devices has risen. Such devices are convenientand easy to operate, and they allow end-users to performdiverse tasks, ranging from searching the internet towatching videos and for instantaneous messaging.According to data released by Statistics Korea in 2018,89.6% of people over 3 years old are smartphone users.
Since 2013, the use of smart devices has exceeded that ofdesktop devices. Among Korean smartphone users, 95.7%of them use their smartphones more than once a day, foran average of 10 hours and 47 minutes per week [1]. Fur-thermore, the proportion of smartphone use is increasingto the extent that 19.1% of smartphone users are classifiedas smartphone ‘addicts’, and mobile internet usage in thepopulation aged over 60 years is also increasing [2].As these smart devices become more crucial and inte-
grated into our daily lives, we should consider how we arephysically affected by them. The long-term use of smartdevices is associated with visual and ocular symptoms,
© The Author(s). 2021 Open Access This article is licensed under a Creative Commons Attribution 4.0 International License,which permits use, sharing, adaptation, distribution and reproduction in any medium or format, as long as you giveappropriate credit to the original author(s) and the source, provide a link to the Creative Commons licence, and indicate ifchanges were made. The images or other third party material in this article are included in the article's Creative Commonslicence, unless indicated otherwise in a credit line to the material. If material is not included in the article's Creative Commonslicence and your intended use is not permitted by statutory regulation or exceeds the permitted use, you will need to obtainpermission directly from the copyright holder. To view a copy of this licence, visit http://creativecommons.org/licenses/by/4.0/.The Creative Commons Public Domain Dedication waiver (http://creativecommons.org/publicdomain/zero/1.0/) applies to thedata made available in this article, unless otherwise stated in a credit line to the data.
* Correspondence: [email protected] of Ophthalmology, College of Medicine, Chung-Ang UniversityHospital, 102 Heukseok-ro, Dongjak-gu, 06974 Seoul, South KoreaFull list of author information is available at the end of the article
Kang et al. BMC Ophthalmology (2021) 21:44 https://doi.org/10.1186/s12886-020-01789-z

such as eye strain, blurring and dry and/or sore eyes. Anincrease in near field working hours with the use of smart-phones can result in excessive accommodation, increasingocular fatigue. In addition, continued use of smartphonesreduces blinking, causing eye dryness [3]. For this reason,a growing number of patients are seeking clinical help dueto their ophthalmic problems associated with increaseduse of smart devices.Handheld smart devices are different from desktop or
laptop computers in many aspects, such as the viewingposition and distance, luminance, screen size, and usagepatterns. In particular, the viewing distance for smartdevices is relatively close compared to that of computers,which can result in eye strain due to accommodationand convergence [4]. Near-field work can cause constric-tion and accommodative spasms in the iris and ciliarymuscle, which can lead to degraded accommodativefunctions [5]. This degradation of accommodativefunctions can have an adverse effect on ocular fatigue[5–8]. Research on the change in accommodation afterthe use of smartphones reported that accommodationwas altered with smartphone and tablet use, with de-creased amplitude and increased lag [9]. In terms of eyediscomfort, blinking, tear function, and dry eye symp-toms were compared before and after smartphone ortablet use. Smart devices that differ in size may have dif-ferential effects on the eyes, however, none of the studiescompared changes with different display sizes.Therefore, in our study, we investigated how the size
of a smart device screen affects the user’s eye strain andocular functions. To do so, we used objective metrics toperform quantitative measurements on changes inaccommodation and eye discomfort after using smartdevices of different display sizes.
MethodsThis prospective, comparative case series was approvedby the institutional review board committee of theChung-Ang University Hospital, Seoul, South Korea, andadheres to the tenets of the Declaration of Helsinki.
Participant selection and study designParticipants were recruited on a volunteer basis using pub-lic notices. Among the participants, only those who had nohistory of ocular disease except correctable refractive errorand were able to use smart devices were included in thisstudy. We only included participants under 40 years old toexclude presbyopia. Participants with ophthalmic diseases(e.g., dry eyes, uncorrected refractive abnormality, ocularalignment disorder except heterophoria) or any diseases ofthe cornea, retina, or optic nerve were excluded of one’swill. Participants who had undergone operations other thanrefractive surgery were also excluded, and there were no re-strictions related to astigmatism. After the purpose and
design of this study were explained, each subject signed theinformed consent form.Subjects performed the tests using contact lenses or
glasses to completely correct the refractive errors.Devices of two different sizes were used: the smallerdevice was the iPhone XR (Apple Inc., Cupertino, CA,USA) and the larger one was the iPad 9.7″ (Apple Inc.).The display sizes were 6.1 inches and 9.7 inches, respect-ively. Subjects were asked to watch a documentary videoon the same platform (YouTube) for 1 hour. The sametask was performed on each device in random order buton a different day more than a week later to avoid anycarryover effects as a result of prior testing. When usinga different kind of device, we used a different documen-tary video in random order to eliminate the possibility ofa loss of concentration secondary to familiarity with thestimulus. To equalize conditions for near field workingunder the same conditions, the viewing distance at 30cm and the maximum screen brightness were set at thenormal indoor illumination level of 280 lux for the test.
Fig. 1 Measurement of objective accommodation using anautorefractometer/keratometer (WAM-5500, Grand Seiko, Tokyo,Japan). In the fully distance corrected state, one eye was covered.Next, a target was moved repeatedly at a constant speed at 33–100cm from the uncovered eye to stimulate accommodation, and theautorefractometer continuously measured refraction based on thespherical equivalent
Kang et al. BMC Ophthalmology (2021) 21:44 Page 2 of 9

Visual function and self‐awareness symptomsAfter the basic examination of visual acuity, intraocularpressure (IOP), and refractive error, vision correctionwas carried out using manifestation refraction. For theevaluation of accommodative functions, the near pointof accommodation (NPA), near point of convergence(NPC), and accommodative responses to each stimulusat different distances were measured before and afterusing each smart device. For the subjective evaluation ofNPA, the push-up method was used. The NPC wasmeasured by approaching the eye strain with a 2 mmdiameter circle to investigate the point at which one orboth eyes diverged from fixation.In addition to the above traditional static method, object-
ive dynamic measurement of accommodation was con-ducted by the autorefractometer/keratometer (WAM-5500Grand Seiko, Hiroshima, Japan; Fig. 1) under dynamicmeasurement mode. The measured spherical equivalent ofthe refractive error at one meter, 67 cm, and 33 cm wasconverted to an accommodation response. In this study, wecompared accommodative lag, indicating insufficientresponse than accommodative stimulation, and
accommodative facility, which is the flexibility to focus at avariety of viewing distances [10].The pupil diameter was also measured using the same
refractometer. Evaluation of stereopsis was conducted byTitmus Stereotest (Stereo Optical Co., Inc. Chicago, IL).Strabismus and heterophoria were measured using thealternate prism cover test, and tear film break-up time(tBUT) and the National Eye Institute (NEI) scale forgrading corneal fluorescein staining were checked. ThetBUT was measured using a fluorescein strip (Haag-StreitInternational, Koniz-Bern, Switzerland) to estimate thetime at which a defect first occurred in the tear film. TheNEI score, ranging from zero to 15, evaluates the cornealsurface state by measuring fluorescein uptake [11].Ocular discomfort was assessed using a validated
Korean version of the Ocular Discomfort Analog Scale(ODAS) [12]. It is a self-report questionnaire modifiedfrom a questionnaire for assessing virtual reality viewingwith a head-mounted display, and it is used as a measureof the level of ocular discomfort [13]. Subjects filled outthe ODAS questionnaire using an analog scale afterusing each device. Moreover, we asked about the
Fig. 2 Ocular discomfort analog scale (ODAS). It consists of seven questions about the following symptoms: photophobia, tightness or pressurearound the eye, eye dryness, foreign body sensation, burning or stinging, blurred vision, and ocular fatigue. Symptom severity was assessed on ascale from zero to 70, with scores of 0–10 for each category
Kang et al. BMC Ophthalmology (2021) 21:44 Page 3 of 9

amount of time between the start of the video and thefeeling of ocular discomfort. The computation of thescore follows that which is outlined in Fig. 2.All subjects underwent the same ophthalmic examina-
tions twice, before and after using smart devices, and alltests were performed by the same ophthalmologist (J.W.Kang). Only data for the right eye were included in theanalysis for all measurements except stereopsis, NPC,heterophoria, and ocular symptoms.
Statistical analysisStatistical analyses using SPSS version 20.0 (SPSS,Chicago, IL, USA). Differences in ocular discomfort,accommodation, and survey results between smartphoneand tablet use were analyzed using the paired t-test. Theresults are expressed as mean ± standard deviation, andp values < 0.05 were considered statistically significant.
ResultsOverall, 46 subjects (22 men, 24 women) aged over 19years old (ages ranged from 19 to 39 years, mean age27.48 ± 5.95 years) were enrolled. The distance- andnear-corrected visual acuity for all subjects was 20/20,
Table 1 Demographic characteristics of participants at baseline
Characteristics N (%) or mean (± SD)
No. of subjects 46
Age (yr) 27.48 ± 5.95
Sex (M : F no. (%)) 22(47.83%):24 (52.17%)
Dominant eye (Right : Left (%)) 38(82.61%):8(17.39%)
BCVA
Far 20/20
Near 20/20
IOP (mmHg) 15.28 ± 2.74
Spherical equivalent (diopter) -2.95 ± 2.31
Hypermetropia (+ 0.5D < SE, eyes) 2
Emmetropia (-0.5D < SE ≤ + 0.5D, eyes) 7
Myopia (SE ≤ -0.5D, eyes) 37
-3D < SE ≤ -0.5D 12
S.E ≤ -3D 25
BCVA Best corrected visual acuity, IOP Intraocular pressure, SE Sphericalequivalent, D Diopter
Table 2 Change of subjective static measurement of accommodation and other ocular parameters before and after use of smartdevices
Pre PostSmartphone
P valuea Difference(Pre-Post)
P valueb
Tablet
NPA (cm) 5.24 ± 0.77 5.43 ± 1.19 0.018 -0.20 ± 0.54 0.044
5.35 ± 1.01 0.024 -0.11 ± 0.31
NPC (cm) 10.22 ± 0.84 10.46 ± 1.33 0.010 -0.24 ± 0.60 0.033
10.30 ± 1.09 0.044 -0.09 ± 0.28
Exophoria (PD)
Far 0.48 ± 1.39 0.48 ± 1.39 - 0 -
0.48 ± 1.39 - 0
Near 2.52 ± 3.90 2.26 ± 3.79 0.002 0.26 ± 0.53 0.160
2.30 ± 3.79 0.006 0.22 ± 0.51
tBUT (sec) 8.17 ± 3.63 7.83 ± 3.43 0.010 0.35 ± 0.87 0.299
8.00 ± 3.58 0.198 0.17 ± 0.90
Stereopsis 41.30 ± 3.41 41.96 ± 4.01 0.083 -0.65 ± 2.50 -
41.74 ± 3.83 0.160 -0.43 ± 2.06
NEI score 0.24 ± 0.64 0.30 ± 0.63 0.183 -0.07 ± 0.33 0.160
0.22 ± 0.47 0.660 0.02 ± 0.33
IOP 15.28 ± 2.73 15.50 ± 2.70 0.040 -0.22 ± 0.70 0.002
14.89 ± 2.76 0.032 0.39 ± 1.20
Pupil diameter 3.85 ± 0.89 3.88 ± 0.90 0.732 -0.03 ± 0.66 0.790
3.91 ± 0.78 0.569 -0.06 ± 0.66
NPA Near point accommodation, NPC Near point convergence, PD Prism diopter, tBUT Tear film break-up time, NEI National Eye Institute, IOP Intraocular pressureap value by paired t-test of comparison between pre-and post-test using smart devicesbp value by paired t-test of comparison between smart phone and tablet
Kang et al. BMC Ophthalmology (2021) 21:44 Page 4 of 9
and the average IOP was 15.28 ± 2.74 mmHg. The over-all spherical equivalent of the converted refractive errorwas − 2.95 ± 2.31 diopters (D) (Table 1).The baseline subjective accommodative power of NPA
as estimated using the push-up method was 5.24 ± 0.77cm. After using the smartphone and tablet, the post-NPA (increase in distance in cm) decreased to 5.43 ±1.19 cm and 5.35 ± 1.01 cm, respectively. The NPA aftersmartphone use tended to decrease more than that aftertablet use (p = 0.044). Baseline NPC was 10.22 ± 0.84 cm,
and when using smart devices, it decreased to 10.46 ±1.33 cm (smartphone) and 10.30 ± 1.09 (tablet). Thesechanges were also statistically significant (p = 0.033;Table 2).The refractive responses to each stimulus in the
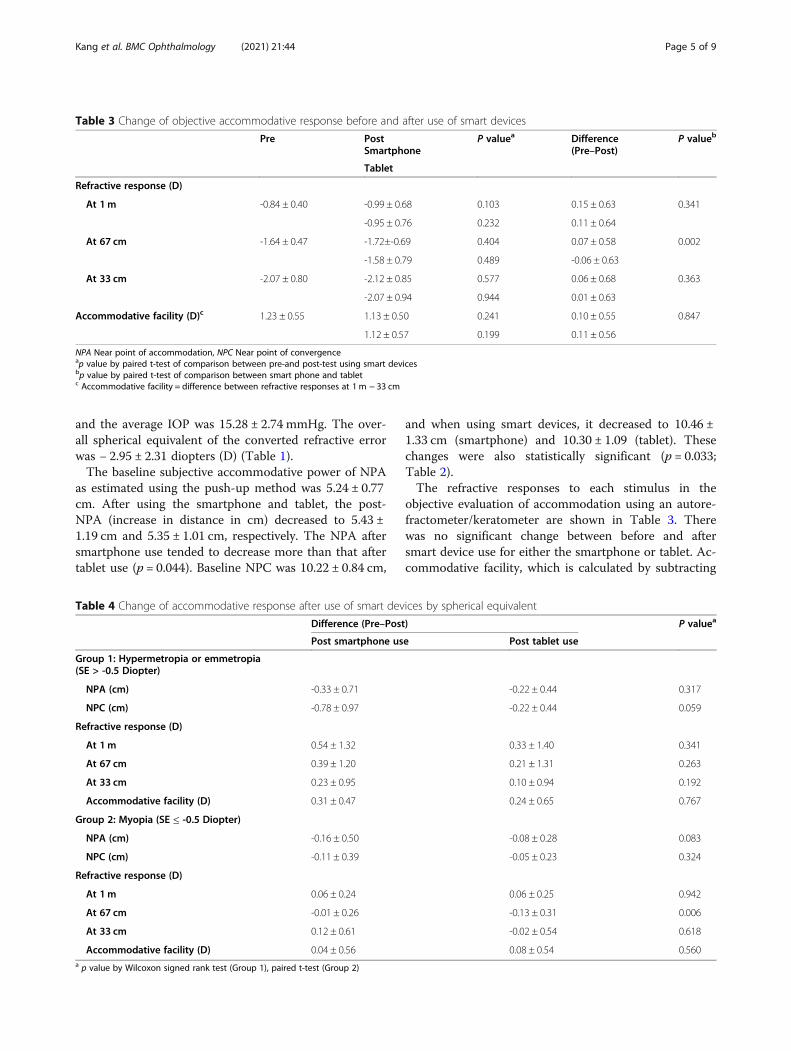
objective evaluation of accommodation using an autore-fractometer/keratometer are shown in Table 3. Therewas no significant change between before and aftersmart device use for either the smartphone or tablet. Ac-commodative facility, which is calculated by subtracting
Table 3 Change of objective accommodative response before and after use of smart devices
Pre PostSmartphone
P valuea Difference(Pre–Post)
P valueb
Tablet
Refractive response (D)
At 1m -0.84 ± 0.40 -0.99 ± 0.68 0.103 0.15 ± 0.63 0.341
-0.95 ± 0.76 0.232 0.11 ± 0.64
At 67 cm -1.64 ± 0.47 -1.72±-0.69 0.404 0.07 ± 0.58 0.002
-1.58 ± 0.79 0.489 -0.06 ± 0.63
At 33 cm -2.07 ± 0.80 -2.12 ± 0.85 0.577 0.06 ± 0.68 0.363
-2.07 ± 0.94 0.944 0.01 ± 0.63
Accommodative facility (D)c 1.23 ± 0.55 1.13 ± 0.50 0.241 0.10 ± 0.55 0.847
1.12 ± 0.57 0.199 0.11 ± 0.56
NPA Near point of accommodation, NPC Near point of convergenceap value by paired t-test of comparison between pre-and post-test using smart devicesbp value by paired t-test of comparison between smart phone and tabletc Accommodative facility = difference between refractive responses at 1 m − 33 cm
Table 4 Change of accommodative response after use of smart devices by spherical equivalent
Difference (Pre–Post) P valuea
Post smartphone use Post tablet use
Group 1: Hypermetropia or emmetropia(SE > -0.5 Diopter)
NPA (cm) -0.33 ± 0.71 -0.22 ± 0.44 0.317
NPC (cm) -0.78 ± 0.97 -0.22 ± 0.44 0.059
Refractive response (D)
At 1m 0.54 ± 1.32 0.33 ± 1.40 0.341
At 67 cm 0.39 ± 1.20 0.21 ± 1.31 0.263
At 33 cm 0.23 ± 0.95 0.10 ± 0.94 0.192
Accommodative facility (D) 0.31 ± 0.47 0.24 ± 0.65 0.767
Group 2: Myopia (SE ≤ -0.5 Diopter)
NPA (cm) -0.16 ± 0.50 -0.08 ± 0.28 0.083
NPC (cm) -0.11 ± 0.39 -0.05 ± 0.23 0.324
Refractive response (D)
At 1m 0.06 ± 0.24 0.06 ± 0.25 0.942
At 67 cm -0.01 ± 0.26 -0.13 ± 0.31 0.006
At 33 cm 0.12 ± 0.61 -0.02 ± 0.54 0.618
Accommodative facility (D) 0.04 ± 0.56 0.08 ± 0.54 0.560a p value by Wilcoxon signed rank test (Group 1), paired t-test (Group 2)
Kang et al. BMC Ophthalmology (2021) 21:44 Page 5 of 9
the values of the refractive response at 1 m and 33 cm toevaluate whether accommodation is properly regulated,was decreased more when a large display size was used,but it was not statistically significant (p = 0.847).When the subgroup analysis of hypermetropic or my-
opic subjects was considered, there was no significantdifference in the accommodation response depending onthe size of the smart device display, except for thechange in refractive response at 67 cm in the myopicgroup (Table 4).Changes in other ocular parameters are shown in
Table 2. Distance exophoria did not change, but nearexophoria shifted toward the ortho position after usingboth devices. The tBUT significantly decreased afterusing a smartphone (p = 0.010) but did not change afterusing the tablet (p = 0.198). Stereopsis decreased afteruse of both devices, but not significantly, and there wasno significant change in NEI score. Intraocular pressuresignificantly increased after using a smartphone (p =0.040), but was decreased after using a tablet (p = 0.032).Pupil diameter increased with use of both smart devices,but the change was not statistically significant.For the survey of subjective symptoms of ocular dis-
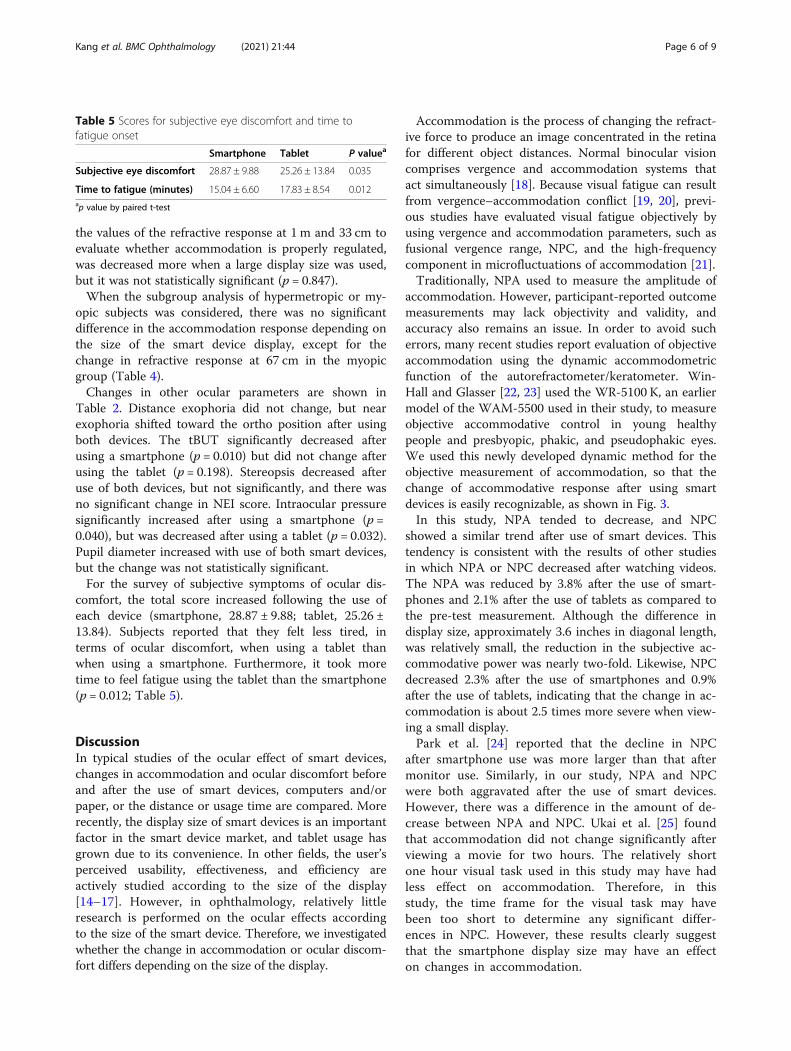
comfort, the total score increased following the use ofeach device (smartphone, 28.87 ± 9.88; tablet, 25.26 ±13.84). Subjects reported that they felt less tired, interms of ocular discomfort, when using a tablet thanwhen using a smartphone. Furthermore, it took moretime to feel fatigue using the tablet than the smartphone(p = 0.012; Table 5).
DiscussionIn typical studies of the ocular effect of smart devices,changes in accommodation and ocular discomfort beforeand after the use of smart devices, computers and/orpaper, or the distance or usage time are compared. Morerecently, the display size of smart devices is an importantfactor in the smart device market, and tablet usage hasgrown due to its convenience. In other fields, the user’sperceived usability, effectiveness, and efficiency areactively studied according to the size of the display[14–17]. However, in ophthalmology, relatively littleresearch is performed on the ocular effects accordingto the size of the smart device. Therefore, we investigatedwhether the change in accommodation or ocular discom-fort differs depending on the size of the display.
Accommodation is the process of changing the refract-ive force to produce an image concentrated in the retinafor different object distances. Normal binocular visioncomprises vergence and accommodation systems thatact simultaneously [18]. Because visual fatigue can resultfrom vergence–accommodation conflict [19, 20], previ-ous studies have evaluated visual fatigue objectively byusing vergence and accommodation parameters, such asfusional vergence range, NPC, and the high-frequencycomponent in microfluctuations of accommodation [21].Traditionally, NPA used to measure the amplitude of
accommodation. However, participant-reported outcomemeasurements may lack objectivity and validity, andaccuracy also remains an issue. In order to avoid sucherrors, many recent studies report evaluation of objectiveaccommodation using the dynamic accommodometricfunction of the autorefractometer/keratometer. Win-Hall and Glasser [22, 23] used the WR-5100 K, an earliermodel of the WAM-5500 used in their study, to measureobjective accommodative control in young healthypeople and presbyopic, phakic, and pseudophakic eyes.We used this newly developed dynamic method for theobjective measurement of accommodation, so that thechange of accommodative response after using smartdevices is easily recognizable, as shown in Fig. 3.In this study, NPA tended to decrease, and NPC
showed a similar trend after use of smart devices. Thistendency is consistent with the results of other studiesin which NPA or NPC decreased after watching videos.The NPA was reduced by 3.8% after the use of smart-phones and 2.1% after the use of tablets as compared tothe pre-test measurement. Although the difference indisplay size, approximately 3.6 inches in diagonal length,was relatively small, the reduction in the subjective ac-commodative power was nearly two-fold. Likewise, NPCdecreased 2.3% after the use of smartphones and 0.9%after the use of tablets, indicating that the change in ac-commodation is about 2.5 times more severe when view-ing a small display.Park et al. [24] reported that the decline in NPC
after smartphone use was more larger than that aftermonitor use. Similarly, in our study, NPA and NPCwere both aggravated after the use of smart devices.However, there was a difference in the amount of de-crease between NPA and NPC. Ukai et al. [25] foundthat accommodation did not change significantly afterviewing a movie for two hours. The relatively shortone hour visual task used in this study may have hadless effect on accommodation. Therefore, in thisstudy, the time frame for the visual task may havebeen too short to determine any significant differ-ences in NPC. However, these results clearly suggestthat the smartphone display size may have an effecton changes in accommodation.
Table 5 Scores for subjective eye discomfort and time tofatigue onset
Smartphone Tablet P valuea
Subjective eye discomfort 28.87 ± 9.88 25.26 ± 13.84 0.035
Time to fatigue (minutes) 15.04 ± 6.60 17.83 ± 8.54 0.012ap value by paired t-test
Kang et al. BMC Ophthalmology (2021) 21:44 Page 6 of 9

Fig. 3 Example of accommodative responses to continuous stimulus measured by autorefractometer/keratometer. Accommodative responses areexpressed as red dots to each stimulus (blue dots). Pre-test (a), Post-smartphone use (b), Post-tablet use (c)
Kang et al. BMC Ophthalmology (2021) 21:44 Page 7 of 9
On the contrary, in the objective dynamic accommo-dation test, most accommodative responses after watch-ing a video on either a smartphone or tablet weresimilar, and they even showed a tendency to increasecompared to that before watching, even though therewas no statistically significant difference. However, con-sidering that the closest accommodative stimulationpoint of the autorefractometer/keratometer was limitedto 33 cm, the maximum accommodation could havebeen underestimated. Moreover, there was not enoughtime for adequate accommodation at each distance, asthe target of the autorefractometer/keratometer movedso rapidly in our setting, the measured responses mayhave been underestimated at every point. In addition,the examination was conducted immediately after view-ing the screen at the near field for an hour, and a tem-porary myopic shift might have occurred due to residualaccommodative spasms. Therefore, caution should beused when using only objective measurements, and thetraditional subjective methods should be considered to-gether to evaluate the accommodation more accurately.In this study, phoria at far distances did not vary be-
fore and after the use of smart devices, but phoria atnear distances tended to shift toward the ortho position.Furthermore, stereopsis decreased after using a tablet.This result is thought to be caused by vergence and ac-commodative adaptation. The examination to measureeye strain showed significant changes in IOP and tBUTafter using smartphones. In particular, the increase inIOP when using a smartphone was significantly differentfrom that when using a tablet. Ha et al. [26] demon-strated that working on a smartphone significantly in-creases IOP, and they postulate that it might be due tosustained active accommodation and convergence fornear field work. Similarly, it is possible that the use of asmall display smartphone caused thickening of the lenswith excessive accommodation and an increase in IOP.Although the decrease in tBUT was not significant be-tween the two devices, it was markedly reduced afterusing a smartphone, and may also be associated with theprovocation of ocular discomfort.After using a smart device, ODAS scores on the ques-
tionnaire showed an increase for all subjects, and usersreported that they easily felt tired from the use of smartdevices. Our results support previous evidence that ocu-lar discomfort could be induced by visual tasks [27]. Thedifference between display sizes was also significant.When using a smartphone, participants felt more tired,and it took less time for them to feel ocular discomfort.On the other hand, it took longer to feel fatigued afterusing a tablet. In other words, people feel more intensediscomfort within a shorter time with a relatively smallerdisplay than with a larger display. These results may bebecause excessive accommodative convergence is
necessary to form a clear image and the small size of thescreen and displayed font induce visual fatigue.There are several limitations of this study. First, the
number of subjects was small and there was no limit onthe degree of refractive error. Subsequent studies couldovercome this vulnerability by recruitment of largernumbers of subjects with a pre-planned target of a cer-tain number for each age group. Secondly, subjects wereasked to watch a pre-determined specific video; however,individual concentration may have differed dependingon the participants’ interests. Watching the video was arelatively passive visual task as compared to other tasks,such as reading a book. Such usage may therefore exertdifferent effects on accommodation or ocular discom-fort. Thirdly, the video viewing time in this study wasshort as 1 hour, which might have made it difficult to esti-mate changes in the eyes due to prolonged use. If smartdevices are used for longer periods, the difference is likelyto be greater. In addition, the difference in the displaysizes of the smartphones and tablets used in the studymay have been insufficient. We used the most recently re-leased devices to reflect recent trends. However, as smart-phones are larger with the addition of more diversefunctions, the differences in the visual effects of the twodevices may have been underestimated due to the smalldifference in display size. Finally, Various tests may be af-fected by subjective fatigue, and the subjects’ conditionmay have changed over the duration of the two visits.In conclusion, accommodation change was more se-
vere after the use of a smartphone with a relatively smalldisplay when compared to that after the use of a tabletwith a larger display. And in terms of ocular discomfort,using smart devices with a smaller display size may pro-voke more discomfort. According to the results of thisstudy, we suggest that the display size of smart devicescan have different effects on the eye, so it should be ad-justed according to the user’s accommodative functionsand ocular discomfort when using smart devices.
AbbreviationsNPA: Near point of accommodation; NPC: Near point of convergence;NEI: National Eye Institute; tBUT: Tear film break-up time; ODAS: Oculardiscomfort analog scale
AcknowledgementsNot applicable.
Authors’ contributionsNJ and JW designed the study. JW analyzed the study and drafted allversions of the manuscript. YS advised on the design and analyses, andreviewed successive drafts of the manuscript. All authors have read andapproved the manuscript.
FundingNo funding was received.
Availability of data and materialsThe datasets used and analyzed during the current study are available fromthe corresponding author on reasonable request.
Kang et al. BMC Ophthalmology (2021) 21:44 Page 8 of 9

Ethics approval and consent to participateThe institutional review board of the Chung Ang University Hospitalapproved the research protocol. All participants provided written consentforms prior to data collection.
Consent for publicationNot Applicable.
Competing interestsThe authors declare that they have no competing interests.
Author details1Department of Ophthalmology, Airforce 16th Fighter Wing MedicalSquadrone, Yecheon, Gyeongsangbuk-Do, South Korea. 2Department ofOphthalmology, College of Medicine, Chung-Ang University Hospital, 102Heukseok-ro, Dongjak-gu, 06974 Seoul, South Korea.
Received: 5 July 2020 Accepted: 22 December 2020
References1. Statistics K. 2018 survey on the internet usage of Korea. National
Information Society Agency; 2019. Available from: https://www.nia.or.kr/site/nia_kor/ex/bbs/View.do?cbIdx=99870&bcIdx=21014&parentSeq=21014.Cited 2019 Dec 13.
2. Statistics K. 2018 survey on Smartphone overdependence of Korea. NationalInformation Society Agency; 2019. Available from: https://www.nia.or.kr/site/nia_kor/ex/bbs/View.do?cbIdx=65914&bcIdx=20876&parentSeq=20876.Cited 2019 Dec 13.
3. Thomson WD. Eye problems and visual display terminals–the facts and thefallacies. Ophthalmic Physiol Opt. 1998;18(2):111–9 Available from: http://www.ncbi.nlm.nih.gov/pubmed/9692030. Cited 2019 Dec 13.
4. Tosha C, Borsting E, Ridder WH, Chase C. Accommodation response andvisual discomfort. Ophthalmic Physiol Opt. 2009;29(6):625–33.
5. Siderov J, Chiu SC, Waugh SJ. Differences in the nearpoint of convergencewith target type. Ophthalmic Physiol Opt. 2001;21(5):356–60.
6. Rutstein RP, Fuhr PD, Swiatocha J. Comparing the amplitude ofaccommodation determined objectively and subjectively. Optom Vis Sci.1993;70(6):496–500.
7. Ostrin LA, Glasser A. Accommodation measurements in a prepresbyopicand presbyopic population. J Cataract Refract Surg. 2004;30(7):1435–44.
8. Adler P. Efficacy of treatment for convergence insufficiency using visiontherapy. Ophthalmic Physiol Opt. 2002;22(6):565–71.
9. Jaiswal S, Asper L, Long J, Lee A, Harrison K, Golebiowski B. Ocular andvisual discomfort associated with smartphones, tablets and computers:what we do and do not know. Clin Exp Optom. 2019;102(5):463–77.
10. Moulakaki AI, Recchiqni A, Águila AJDC, Esteye-Taboada JJ, Montés-Micó R.Assessing the accommodation response after near visual tasks usingdifferent handheld electronic devices. Arq Bras Oftalmol. 2017;80(1):9–13.
11. Woods J, Varikooty J, Fonn D, Jones LW. A novel scale for describingcorneal staining. Clin Ophthalmol. 2018;12:2369–75.
12. Kim H, Kim HT, Shin DH, Lim HT, Choi CY, Cho WJ, et al. Reduction of bluelight emission in internet-protocol television and its effect on ocular fatigue.J Korean Ophthalmol Soc. 2018;59(3):230–7.
13. Ames SL, Wolffsohn JS, Mcbrien NA. The development of a symptomquestionnaire for assessing virtual reality viewing using a head-mounteddisplay. Optom Vis Sci. 2005;82(3):168–76.
14. Naylor JS, Sanchez CA. Smartphone display size influences attitudes towardinformation consumed on small devices. Soc Sci Comput Rev. 2018;36(2):251–60 Available from: http://journals.sagepub.com/doi/10.1177/0894439317704161. Cited 2019 Dec 13.
15. Raptis D, Tselios N, Kjeldskov J, Skov MB. Does size matter? Investigating theimpact of mobile phone screen size on users’ perceived usability,effectiveness and efficiency. In: MobileHCI 2013 - proceedings of the 15thinternational conference on human-computer interaction with mobiledevices and services. 2013. p. 127–36.
16. Kim KJ, Sundar SS. Does screen size matter for smartphones? Utilitarian andhedonic effects of screen size on smartphone adoption. CyberpsycholBehav Soc Netw. 2014;17(7):466–73.
17. Jung NH, Chang M. Effects of screen size on smartphone functionality andusability for stroke patients with hemiparalysis. J Phys Ther Sci. 2016;28(4):1330–4.
18. Fincham J, Walton EF. The reciprocal actions of accommodation andconvergence. J Physiol. 1957;137(3):488–508.
19. Hirota M, Morimoto T, Kanda H, Endo T, Miyoshi T, Miyagawa S, et al.Objective evaluation of visual fatigue using binocular fusion maintenance.Transl Vis Sci Technol. 2018;7(2):9.
20. Kim J, Kane D, Banks MS. The rate of change of vergence-accommodationconflict affects visual discomfort. Vision Res. 2014;105:159–65.
21. Berens C, Hardy le GH, Pierce HF. Studies in ocular fatigue. II. Convergencefatigue in practice. Trans Am Ophthalmol Soc. 1926;24:262–87 Availablefrom: http://www.ncbi.nlm.nih.gov/pubmed/16692737. Cited 2019 Dec 13.
22. Win-Hall DM, Glasser A. Objective accommodation measurements inprepresbyopic eyes using an autorefractor and an aberrometer. J CataractRefract Surg. 2008;34(5):774–84.
23. Win-Hall DM, Glasser A. Objective accommodation measurements inpseudophakic subjects using an autorefractor and an aberrometer. JCataract Refract Surg. 2009;35(2):282–90.
24. Park M, Ahn YJ, Kim SJ, You J, Park KE, Kim SR. Changes in accommodativefunction of young adults in their twenties following Smartphone use. JKorean Ophthalmic Optics Soc. 2014;19(2):253–60. https://doi.org/10.14479/jkoos.2014.19.2.253.
25. Ukai K, Oyamada H, Ishikawa S. Changes in accommodation and vergencefollowing 2 hours of movie viewing through bi-ocular head-mounteddisplay. In: Accommodation and vergence mechanisms in the visual system.2000. p. 313–25.
26. Ha A, Kim YK, Park YJ, Jeoung JW, Park KH. Intraocular pressure changeduring reading or writing on smartphone. PLoS One. 2018;13(10):e0206061Bhattacharya S, editor. Available from: https://doi.org/http://dx.plos.org/10.1371/journal.pone.0206061. Cited 2019 Dec 13.
27. Sheedy J, Bergstrom N. Performance and comfort on near-eye computerdisplays. Optom Vis Sci. 2002;79(5):306–.
Publisher’s NoteSpringer Nature remains neutral with regard to jurisdictional claims inpublished maps and institutional affiliations.
Kang et al. BMC Ophthalmology (2021) 21:44 Page 9 of 9