a comparison of inward and outward foreign direct investment · a comparison of inward and outward...
TRANSCRIPT

International Journal of Business and Social Science Vol. 2 No. 20; November 2011
141
A Comparison of Inward and Outward Foreign Direct Investment Determinants in
Turkey
İbrahim Anıl
Professor
Marmara University
Faculty of Business Administration and Economics
Department Of Business Administration
Istanbul, Turkey
Ozgur Cakir
Professor
Marmara University
Faculty of Business Administration and Economics
Department Of Business Administration
Istanbul, Turkey
Cem Canel, Ph.D.
Chair
Department of Information Systems and Operations Management
Cameron School of Business
University of North Carolina Wilmington
601 S. College Drive
Wilmington NC 28403
USA
Rebecca Porterfield, Ph.D.
Director of International Programs
Cameron School of Business
University of North Carolina Wilmington
601 S. College Drive
Wilmington NC, 28403
USA
Abstract
This study compares the outward foreign direct investments (FDI) in Turkey with inward FDI taking into account
factors such as the location selection for outward FDI, the stimulus determinant of outward FDI and strategic
entrance options for both inward and outward FDI. Based on surveys and interviews with 107 firms and 169
facilities five factors affecting location selection for inward FDI were found, 1) to gain presence in new markets,
2) enabling faster market entry, 3) maintaining an adequate quality control, 4) enabling faster payback on
investment, and 5) economies of scale. However, the factors of outward FDI are as follows 1) the advantages of a
“first mover”, 2) the growth rate of the Turkish economy, 3) the level of industrial competition, 4) market size,
and 5) availability of low cost inputs. Differences are observed for acquisitions, greenfield operations, joint
venture or wholly owned subsidiaries.
Keywords: Inward FDI, Outward FDI, Ownership Pattern, Mode of Entry, Greenfield, Acquisitions and joint
venture
1. INTRODUCTION
Once a foreign investment decision is made firms have to select the country (ies) for investment and the entry
strategy enacted through such ownership as a greenfield operation, acquisition, wholly owned subsidiaries (WOS)
or joint ventures (JV) (Hennart and Park, 1993). Tatoglu and Glaister (1998a) stated in their analysis that the
relative importance of the motives is found not to vary with ownership pattern, but rather vary to a moderate
extent with the country of origin of the investment and the mode of entry (acquisition or greenfield), and to vary
most with size of the investment and industry of the investment. Analysis of factors in location selection in the
meta analysis by Chakrabarti (2001) reveals that market size and growth rate of an economy are the most
important indicators in the two investment types.
© Centre for Promoting Ideas, USA www.ijbssnet.com
142
Low labor cost is excluded from these factors because of low productivity and since the deregulation application
following neo-liberalism is not a determinant of unionization. Market size, economic growth, and government
policy (including repatriability of profits) have been found to be Turkey’s most important assets when considering
foreign direct investment (Coskun, 2001). Location selection in Turkey has become appealing for multinational
firms because of its market potential, geographic proximity, and low labor cost. Turkey has a large diversity of
markets due in part to its physical location between Asia and Europe. Based on a survey by the Istanbul Chamber
of Commerce (ITO) cited by Taslica (1995), one of the most important factors influencing potential investors is
the “Turkish Market.” It was ranked most important by 33.6% of survey participants for their investment
decisions. Moderately important factors are eliminating import restrictions, recognition and prestige, and using
Turkey as an export base. The least important factors are taxation and financial incentives, local inputs, cheaper
raw and intermediate materials, and lower wages (Coskun, 2001).
During the period of 1989 -2005 many Turkish firms made investments in the Turkic Republics where new
market economies emerged following the dissolution of the Soviet Union. Although there have been some studies
related specifically to FDI in some Turkic countries (Bitzenis, 2007), there have been few studies about the
Turkish FDI’s, analyzing why and how those companies chose outward countries for FDI, their competitors, and
their performances in those countries. Anıl et al., (2007) focused on outward FDI investments of Turkish firms
towards seven countries of the former USSR between 1989 and 2005. The reliable records of outward FDI cannot
be obtained by the Turkish Treasury because of the existence of the shadow economy. Turkey has no investments
in developed countries except opening bank branches that are called “finance investments”. The direct capital
investment of Turkey is negligible except for investments made in the former Soviet Union countries. These
countries can be grouped into three categories: Turkic Republics in Central Asia, Balkan countries, the Russian
Federation and neighboring countries. The three homogenous country groups are designated as follows:
Turkmenistan, Uzbekistan, Kirghizstan and Kazakhstan for Turkic Republics in Central Asia, Bulgaria and
Romania for Balkan countries and the Russian Federation itself and its neighboring countries.
The results of a study by Tatoğlu and Glaister (2000) based on a questionnaire conducted on 98 firms from 13
developed countries about FDI are similar to the findings of the research conducted by the Istanbul Trade
Chamber in terms of effects of location selection on investment decisions (Erdilek, 1982, Coşkun, 2001). The
results of the study by Tatoğlu and Glaister (2000) and the study by Marmara University Scientific Research
Commission (Anıl et al., 2007) are similar. The reasons for the inwards FDI of firms in developed countries and
the outwards FDI of Turkish firms to developing countries are common in both studies and they encompass the
same period until 1998. Both studies are compared to each other and are analyzed in the present study taking into
account location selection, type of investment, type of ownership, cultural familiarity and previous experience.
Therefore this research focuses on the comparison of ownership patterns and strategic rationale of inward and
outward foreign direct investment for Turkish companies engaged in Turkic expansion.
2. THEORETICAL FRAMEWORK
Although there are many studies concerning “greenfield or acquisition decisions,” that is how many shares of a
firm will be shared with others for investment; there is no well-developed theory about the determinant factors of
the above-mentioned selections (Barkema and Vermeulen, 1998). Important variables that are distinguished
among acquisitions and greenfield investments are multinational experience of the parent firm (Kogut and Singh,
1988; Hennart and Park, 1993; Hennart and Reddy, 1997), the size of the parent firm (Caves and Mehra, 1986;
Kogut and Singh, 1988), the relative size of the investment (Caves and Mehra, 1986; Hennart and Park, 1993;
Padmanabhan and Cho, 1995), the cultural distance (Kogut and Singh, 1988), and research and development
intensity of the parent firm (Kogut and Singh, 1988; Hennart and Park 1993; Padmanabhan and Cho, 1995).
Some studies provide certain evidence for using institutional, cultural and transaction cost variables in predicting
acquisition and greenfield start-ups in international growth. The results obtained by the above studies also
suggest that organizations which have certain capabilities can use their capacity with greenfield start-ups easily.
It is suggested that diversification can be easily realized with greenfield applications in high growth markets. Two
recent efforts used transaction cost theory in explaining how firms make a selection between greenfield start-ups
and acquisitions (Hennart and Park, 1993; Cho and Padmanabhan, 1995). However, Robins (1987) and Kogut
and Sing (1988) suggest that the explanations for selections “…should be evaluated with factors stemming from
the institutional and cultural contexts” (Kogut and Singh, 1988, pg. 412).
International Journal of Business and Social Science Vol. 2 No. 20; November 2011
143
The researchers imply that institutional/cultural contexts and transaction costs should be examined simultaneously
in order to understand the diversification selection (selection between greenfield start-ups or acquisitions) of
firms. Studies on the detection of variables of preferences in investment decisions argue that the service sectors
and production sectors can act differently because of the differences in risk dimensions and trust need in terms of
the transition cost economy (Brouthers and Brouthers, 2003). While the peripheral uncertainties and risk
dimensions of production investments affect the selection of firms, behavioral uncertainties, trust tendency and
asset specificity affect the selections of the service providers because of the labor intensive nature of the service
(Delios and Beamish, 1999; Erramilli and Rao, 1993; Anderson and Gatignon, 1988). Some studies argue that
firms tend to interiorize the transactions while the specificity of assets is increasing and joint venture is preferred
while the specificity of assets is decreasing (Delios and Beamish, 1999; Anderson and Gatignon, 1988). The
majority of FDI inflows have been made up of mergers and acquisitions, mainly targeting service sectors and the
real estate. Turkey needs to attract greenfield investments, especially in the manufacturing industries in order to
achieve growth in the future (Yilmaz, 2009).
According to Tatoglu and Glaister (1998b), in the first quarter of 1995, International Joint Ventures (IJVS)
accounted for about 53% of foreign equity ventures (FEV) in Turkey while Wholly Owned Subsidiaries (WOS)
accounted for nearly 43%. Over half of the total 2,888 foreign equity venture formations recorded are created
with firms from European countries, and around one quarter of the total number of FEVs are formed by firms
from the Middle and Far East with less than 8% from the US (GDFI, 1995).
There are two different opinions about the effect of peripheral uncertainty and selection type. Williamson (1991)
argues that joint venture is used less in high peripheral uncertainties because harmony between parties cannot be
provided immediately. Some researchers, (Anderson and Gatignon, 1988; Kim and Hwang, 1992) argue that joint
venture is beneficial for accelerating harmony because of its flexibility in conditions of high uncertainty.
Defenders of transition costs, despite all these arguments, argue that the wholly owned subsidiary is preferable in
order to achieve control over firms and to lower the transaction costs in conditions of high uncertainty (Chiles and
Mcmackin, 1996). Some studies on the selections of production firms state that production firms prefer joint
ventures when there are high uncertainties in the host country in order to reduce the financial burdens on them.
The findings are compatible with the study by Anderson and Gatignon (1988) that examines the entry of
American production firms to foreign markets and concludes that production firms prefer joint ventures in high
risk markets.
Turkey also has distinctive cultural, historical, as well as economic ties with surrounding countries. Although
they have many cultural ties with surrounding countries, their political structure is democratic, and is familiar for
Western firms (Coskun, 2001). In general, firms entering markets with only a few cultural differences perceive
the risk as low and therefore use greenfield entry, thus maximizing advantages particular to the firm. By contrast,
firms entering markets with many cultural differences perceive the risk as high and prefer to use the acquisition
method (Chatterjee, 1990; Lie, 1995; Hofstede, 1989; Yip, 1982).
3. RESEARCH METHODOLOGY
3.1 Inward FDI
Ninety percent of the firms which were ranked by trade attachés affiliated to consulates and business associations
were interviewed and a questionnaire was administered. The same questionnaire form used by Tatoğlu and
Glaister (1998) was used for data collection. Thus, it was possible to compare attitudes measured with the same
scale. In this study, data from 107 firms and 169 facilities that directly invested in four Turkic Republics,
Bulgaria, Romania and Russia were collected through surveys and in-depth interviews. This method was used to
discover the determinants of the investment and location decision making of these firms and the fundamental
dynamics of the global emerging firms. In order to ensure an accurate comparison with developed countries’
determinants, the factors affecting the decision making processes of the survey group were obtained using the
same determinants used to identify the factors within developed countries. Most of the Turkish firms that went to
the Turkic Republics for direct investment decided to find new markets and to use the competitive advantage of
being the first to enter into the market. Those firms, which found cheap goods, labor and quality resources
decided to invest in these markets only to find appropriate resources whilst totally ignoring the domestic market
and some of them wanted to export those products.

© Centre for Promoting Ideas, USA www.ijbssnet.com
144
3.2 Outward FDI
The questionnaire to identify the determinants of Turkish FDI’s was given to 107 firms with wholly owned
subsidiaries and 169 facilities in Bulgaria, Romania, Uzbekistan, Kazakhstan, Turkmenistan, Kyrgyzstan and
Russia. The researchers personally went to the countries and asked the managers who made the investment
decisions to fill out the survey forms. With the Foreign Economic Relations Board and the country’s commerce
consulates, a sample was formed which is calculated from the total census by analyzing the businesses with more
than fifty employees. According to the list 20 companies did not wish to participate in the survey, resulting in an
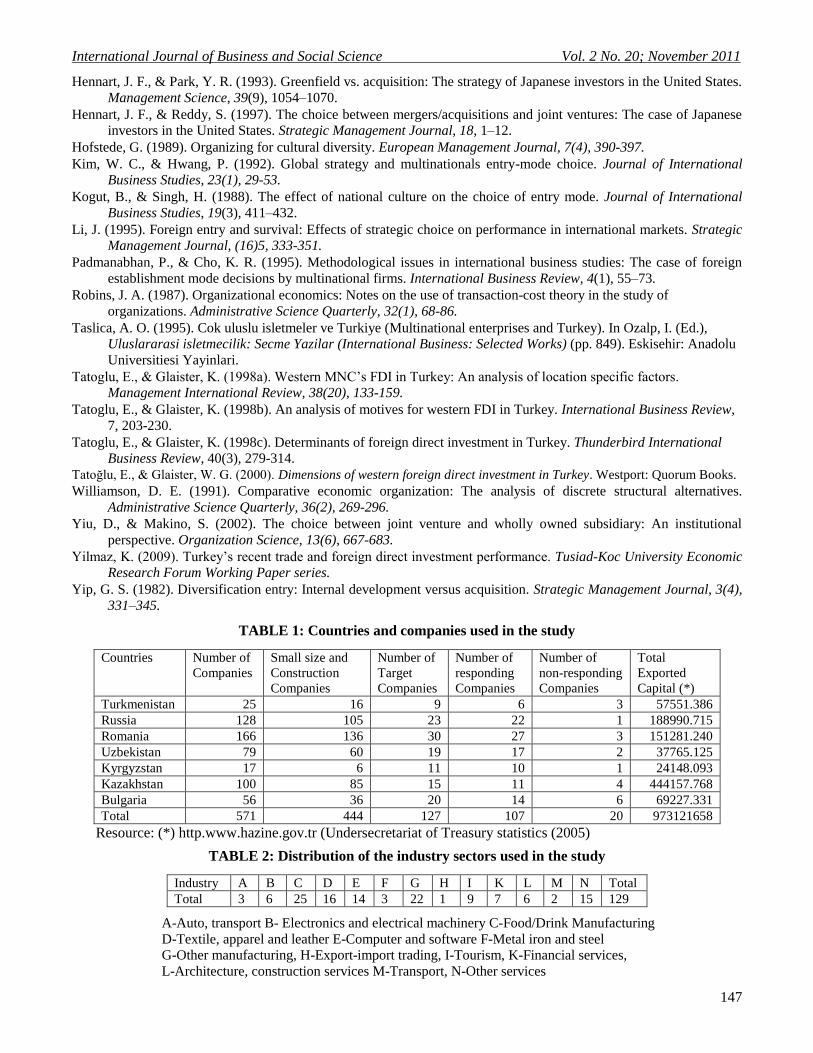
84 % response rate. As it can be seen from the total investments amounts shown in Table 1 the majority of the
companies consist of small-scale businesses. The average investment amount is 1,704 million dollars. Table 2
shows the industrial distribution of the sample. The 107 companies in the sample had operations in 129 different
sectors. Some of the companies had more than one factory in the same sector, which provided 169 companies in
the data set. In this study the survey used was developed by Tatoglu and Glaister (1998). Tatoglu and Glaister
(2000) provide the details for the development, accuracy and confidence results of the survey form. In addition to
demographic the survey form enabled comparison of results by developed and developing countries. In this
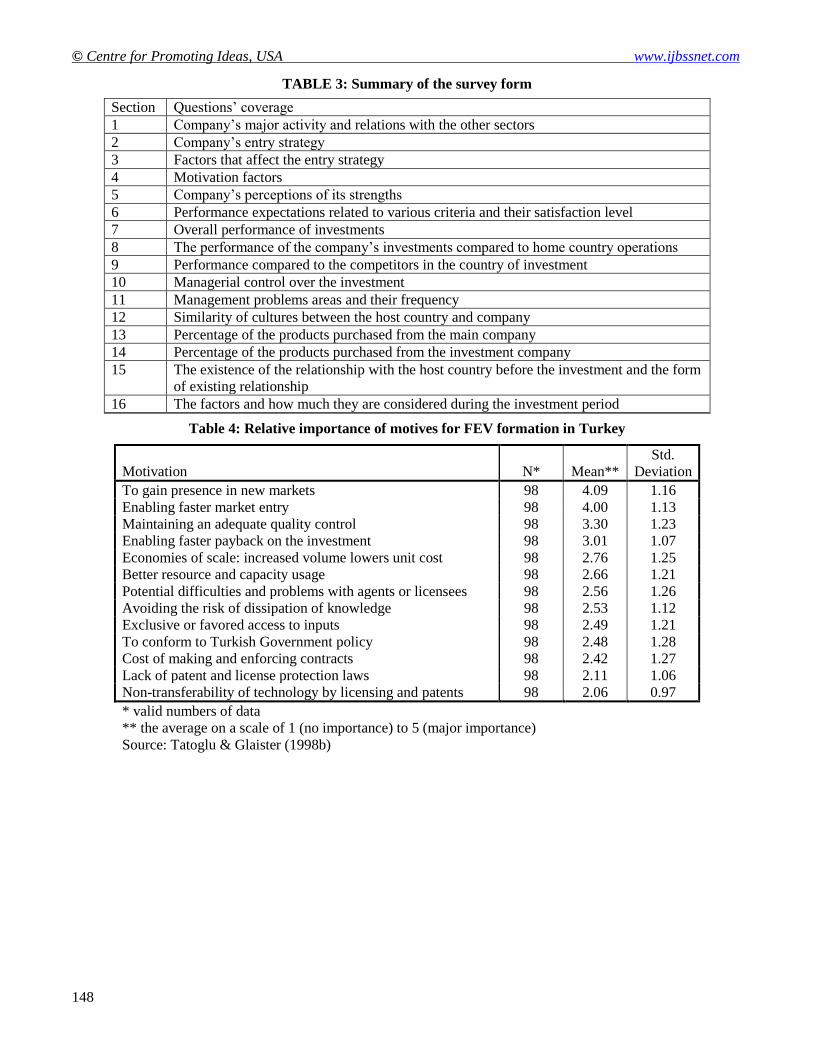
research a survey form consisting of 16 sections as reflected in Table 3.
4. FINDINGS ABOUT INWARD FOREIGN DIRECT INVESTMENT
4.1. Findings About Location Selection
There are thirteen variables which aim to measure location selection determinants of FDI into Turkey. The rank
order of these variables on the basis of means which show the relative importance of each variable can be seen in
Table 4. It is clear that the most important variable is “To gain presence in new markets”, and the successive four
are “Enabling faster market entry”, “Maintaining an adequate quality control”, “Enabling faster payback on the
investment” and “Economies of scale: increased volume lower unit cost”. The sample indicates that only the top
three variables have a mean higher than the median value of three which shows these factors to be significantly
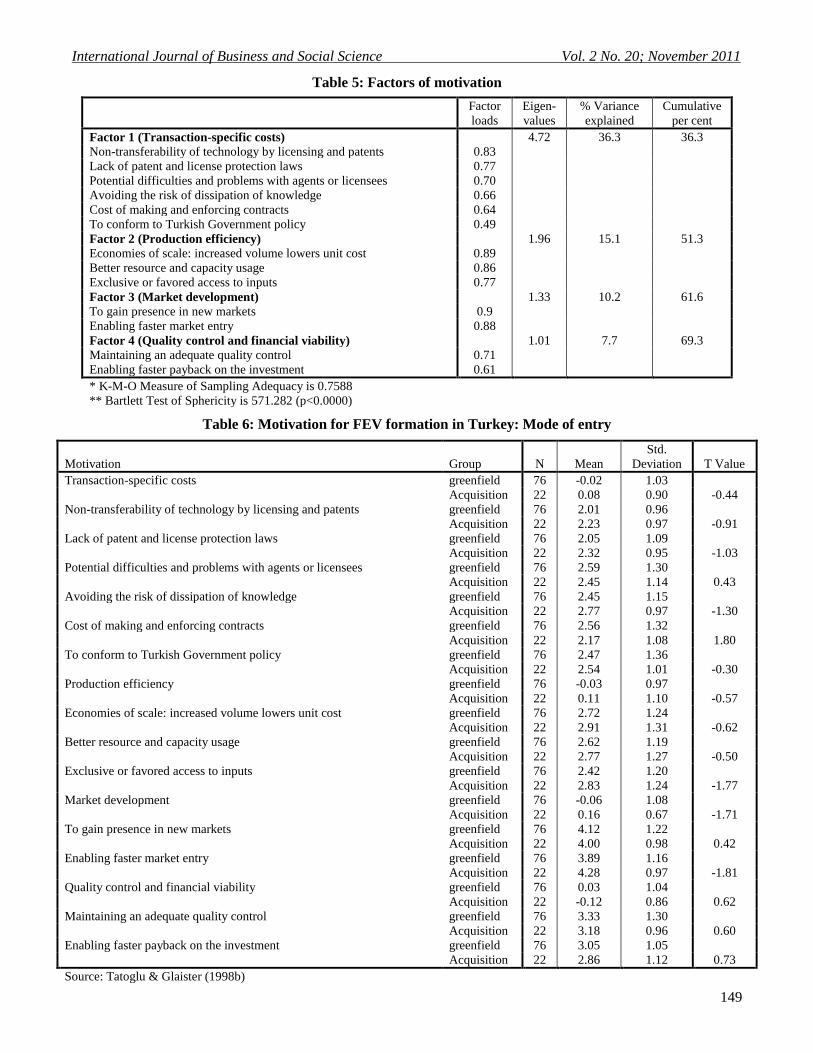
important in determining FDI into Turkey. Factor analysis in Table 5 results in four factors of thirteen variables.
The factors determined in order of most importance are “Transaction-specific costs”, “Production efficiency”,
“Market development”, and “Quality control and financial viability”.
3.2. Findings About the Type of Investment
Table 6 shows differences of thirteen location selection determinants in terms of the type of investment. It is seen
that convictions about “Enabling faster market entry”, the “Cost of making and enforcing contracts”, “exclusive
or favored access to inputs” and “Market development” affect preferences in regard to greenfield or acquisition.
That is, there is a significant difference between two groups at the 0.05 significance level. Accordingly, firms
who perceive the “Cost of making and enforcing contracts” as high prefer the greenfield investment type while
firms who perceive “Enabling faster market entry”, “exclusive or favored access to inputs” and “Market
development” as high prefer the acquisition investment type.
3.3. Findings About Type of Ownership Pattern
Table 7 shows differences of thirteen location selection determinants in terms of the ownership patterns. There
are four significant differences in terms of the preferences about capital structure (type of ownership). They are
the “Cost of making and enforcing contracts”, “Enabling faster payback on the investment”, “Maintaining an
adequate quality control” and “Avoiding the risk of dissipation of knowledge”. Firms who perceive these
variables as high prefer WOS.
4. FINDINGS ABOUT OUTWARD FOREIGN DIRECT INVESTMENT
4.1 Findings About Location Selection
There are nineteen variables which aim to measure location selection determinants of FDI from Turkey. The rank
order of these variables on the basis of means which show the relative importance of each variable can be seen in
Table 8. Statistically the most significant variable is “Being the first mover”, and the successive four are “Level
of industry competition “, “Growth rate of economy”, “Market size” and “Low cost inputs”. The last column in
Table 8 shows t-statistics of comparing means around the value 3 which is the median measure. Only three
variables do not have significant differences around median, “Government policy toward FDI”, “Tax advantages”,
and “Geographical proximity”. Factor analysis in Table 9 results in six factors of eighteen variables. The factors
determined in order of most importance are “Investment risk”, Government regulations”, Market potential”, “Cost
advantages”, “Location advantages” and “Labor supply”.

International Journal of Business and Social Science Vol. 2 No. 20; November 2011
145
4.2 Findings About the Type of Investment
Table 10 shows differences of nineteen location selection determinants in terms of the type of investment. It is
seen that convictions about the growth rate of the Turkish economy, the degree of unionization and the proximity
of the country geographically affect preferences in regard to greenfield or acquisition. That is, there is a
significant difference between two groups at the 0.05 significance level. Accordingly, firms who perceive
“Geographical proximity”, “The growth rate of economy” and “Level of unionization” as high prefer the
greenfield investment type.
4.3 Findings about Type of Ownership Pattern
Table 11 shows differences of nineteen location selection determinants in terms of the ownership patterns. There
is just one significant difference in terms of the preferences about capital structure (type of ownership). It is
“Level of industry competition” and firms who perceive it as high prefer WOS.
4.4 Findings About Cultural Familiarity
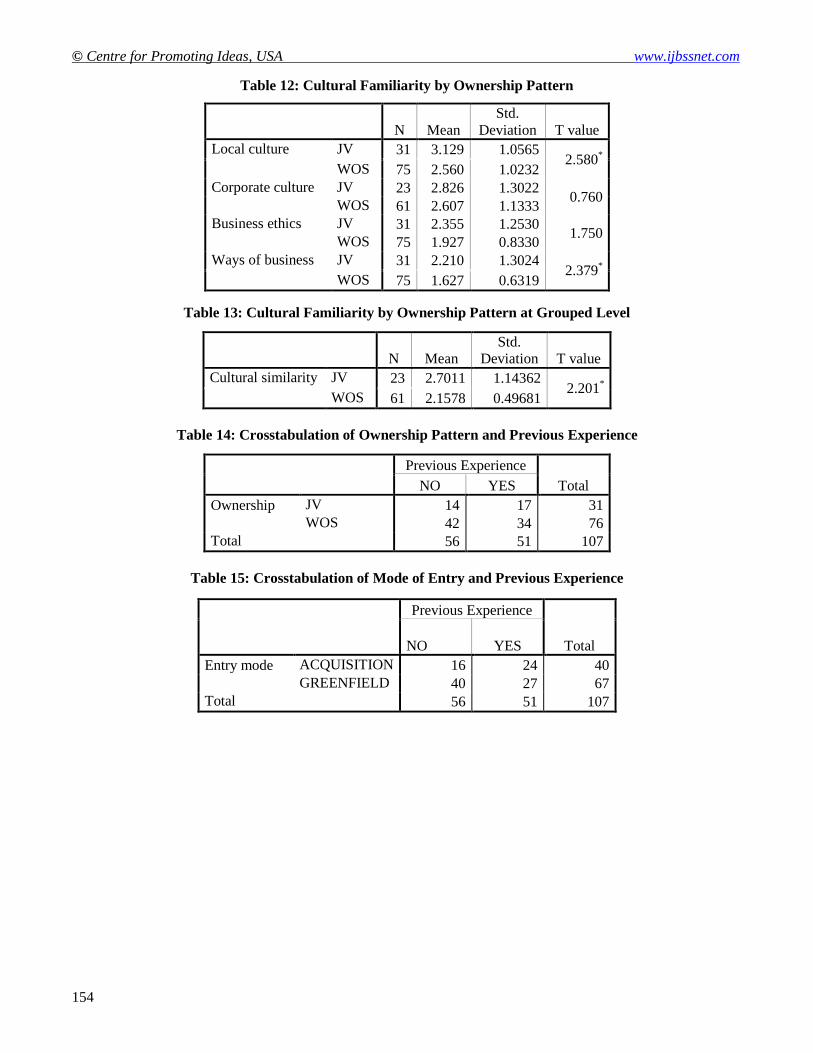
There is a significant difference between WOS and JV groups about “similarity level of local cultures” and
“similarity level of ways of business” at the 0.05 significance level. Accordingly, firms that have high levels of
perception about the similarity of local cultures and similarity of ways of business prefer JV ownership. There is
no significant difference between “corporate culture” and “similarity of business ethics” in terms of ownership
pattern. Table 12 and 13 show the significant differences. There is a significant difference between WOS and JV
patterns in terms of newly formed variable which is derived by the means of cultural variables above. JV is
preferable in high levels of cultural familiarity. Additionally, the relationship between cultural familiarity and
mode of entry is analyzed but no significant difference can be determined.
4.5 Findings About Previous Experiences
In this survey, there are some companies who have previous business relations in the host country and some who
do not have previous business relations. Associations between previous experience and both ownership pattern
(Table 14) and mode of entry (Table 15) were analyzed by using cross tabulations but no symmetric or
asymmetric significant relationships were determined. So it can be said that previous experience does not affect
the ownership pattern and mode of entry (approximate significances are greater than 0.05). Table 16 shows the
differences between companies with previous experience in the host country and those without previous
experience in terms of location selection determinants. It is obvious that there are some significant differences
between those with experience and those without. The variables: Government policy toward FDI, Goods quality
inputs, incentives, Level of unionization and International transport and communication cost have significant
differences in terms of previous experience. Companies who have no previous business relations in host country
perceive these variables as major determinants about investment decisions.
5. CONCLUSIONS
The following five determinants have the highest importance relative to location selection for inward Turkish
FDI. These are to gain presence in new markets, enabling faster market entry, maintaining an adequate quality
control, enabling faster payback on investment, and economies of scale, successively. Location selection
determinants for inward Turkish FDI denote four major factors. Each factor has more than one determinant.
These factors are transaction-specific costs, production efficiency, market development, and quality control and
financial viability. The following five determinants have the highest importance relative to location selection for
outward Turkish FDI. These are advantage of being the first mover, level of industry competition, growth rate of
economy, market size, and low cost inputs, successively. Location selection determinants for outward Turkish
FDI denote six major factors. Each factor has more than one determinant. These factors are investment risk,
government regulations and incentives, market potential, comparative cost advantages, strategic location
advantages, and labor supply and infrastructure.
The perception of inward Turkish FDI’s relative to the importance of making and enforcing contracts, exclusive
or favored access to inputs, market development and enabling faster market entry has significant differences in
terms of mode of entry. Firms in greenfield mode attach higher importance to making and enforcing contracts
than firms in acquisition mode. Firms in acquisition mode attach higher importance to exclusive or favored
access to inputs, market development and enabling faster market entry than firms in greenfield mode. The
perception of outward Turkish FDI’s relative to the importance of growth rate of economy, geographical
proximity, and level of unionization has significant differences in terms of mode of entry.

© Centre for Promoting Ideas, USA www.ijbssnet.com
146
Firms in greenfield mode attach higher importance to these determinants than firms in acquisition mode. The
perception of inward Turkish FDI relative to the importance of avoiding the risk of dissipation of knowledge, the
cost of making and enforcing contracts, enabling faster payback on investment, and maintaining adequate quality
control has significant differences in terms of ownership pattern. WOS’s attach higher importance to these
determinants than JV’s. The perception of outward Turkish FDI relative to the importance of level of industry
competition has significant differences in terms of ownership pattern. WOS’s attach higher importance to level of
industry competition than JV’s. The perception of Turkish FDI relative to the importance of domestic cultural
similarity has significant differences in terms of ownership pattern. JV’s attach higher importance to domestic
cultural similarity than WOS’s. The perception of Turkish FDI relative to the importance of ways of business
similarity has significant differences in terms of ownership pattern. JV’s attach higher importance to ways of
business similarity than WOS’s. The perception of Turkish FDI relative to the importance of all aspects of
cultural similarities has significant differences in terms of ownership pattern. JV’s attach higher importance to all
aspects of cultural similarities than WOS’s.
There is no any association between ownership pattern and previous experience in the host country in terms of
outward Turkish FDI. There is not any association between mode of entry and previous experience in the host
country in terms of outward Turkish FDI. The perception of Turkish FDI relative to the importance of government
policy toward FDI, incentives, international transport and communications cost, goods quality inputs costs and
level of unionization has significant differences in terms of previous experience. Firms that have no previous
experience attach higher importance to these determinants than firms that have previous experience. Although
both inward and outward FDI focuses primarily on market development issues (Table 17), more emphasis is
placed on cost savings with inward FDI (3 of 5 factors). This may be explained due to the fact that inward FDI
implies some working knowledge of the market already whereas outward FDI is in fact focused more on market
development. Similarly, outward FDI in a greenfield operation would likely focus on market opportunity factors
identified through an external environmental factors. Statistically this research confirms traditional strategy
orientations.
REFERENCES
Anderson, E., & Gatignon, H. (1988). Modes of foreign entry-transaction cost-analysis and propositions. Journal of
International Business Studies, 17(3), 1-26.
Anıl, I., Armutlulu, İ., Sungur, N., Bakoğlu, R., & Aşkun, B. (2007). Türkiye’den gelişmekte olan ulkelere yapılan doğrudan sermaye yatırımları. Istanbul: Marmara Üniversitesi, Bilimsel Araştırmalar Komisyonu Yayını.
Barkema, H. G., & Vermeulen, F. (1998). International expansion through start-up acquisition: A learning perspective.
Academy of Management Journal, 41(1), 7-26.
Bitzenis, A. (2007). Determinants of foreign direct investment: Evidence from multinationals in the post-crisis era of
Bulgaria in the late 1990s. Southeast European and Black Sea Studies, 7(1), 83-111.
Brouthers, K. D., & Brouthers, L. E. (2003). Transaction cost-enhanced entry-mode choice and firm performance.
Strategic Management Journal, December (24).
Caves, R. E., & Mehra, S. K. (1986). Entry of foreign multinationals into US manufacturing industries. In M. E. Porter
(Ed.), Competition in global industries (pp. 449-482). Boston, MA: Harvard Business School Press.
Chakrabarti, A. (2001). The determinants of foreign direct investment: Sensitivity analyses of cross-country
regressions. Keyklos, 54.
Chatterjee, S. (1990). Excess resources, utilization cost and mode of entry. Academy of Management Journal, 33(4),
780-800.
Chiles, T. H. & Mcmackin, J. F. (1996). Integrating variable risk preferences, trust, and transaction cost economics.
The Academy of Management Review, 21(1), 73-99.
Coşkun, R. (2001). Determinants of direct foreign investment in Turkey. European Business Review, 13(4), 221 - 227.
Delios, A., & Beamish, P.W. (1999). Ownership strategies for Japanese firms: Transactional institutional and
experience influences. Strategic Management Journal, (20)10, 915–933.
Erdilek, A. (1982). Direct foreign investment in Turkish manufacturing: An analysis of conflicting objectives and
frustrated expectations of host country. Tübingen: Kieler Studien, Paul Siebeck.
Erramilli, M. K., & Rao, J. P. (1990). Choice of foreign market entry mode by service firms: Role of market
knowledge. Management International Review, 30(2), 135-150.
General Directorate of Foreign Investment. (1995). Foreign Investment Report (March 1995). Ankara: Turkey.
Hennart, J. F. (1988). A transaction cost theory of equity joint ventures. Strategic Management Journal, 9(4), 361–374.
International Journal of Business and Social Science Vol. 2 No. 20; November 2011
147
Hennart, J. F., & Park, Y. R. (1993). Greenfield vs. acquisition: The strategy of Japanese investors in the United States.
Management Science, 39(9), 1054–1070.
Hennart, J. F., & Reddy, S. (1997). The choice between mergers/acquisitions and joint ventures: The case of Japanese
investors in the United States. Strategic Management Journal, 18, 1–12.
Hofstede, G. (1989). Organizing for cultural diversity. European Management Journal, 7(4), 390-397.
Kim, W. C., & Hwang, P. (1992). Global strategy and multinationals entry-mode choice. Journal of International Business Studies, 23(1), 29-53.
Kogut, B., & Singh, H. (1988). The effect of national culture on the choice of entry mode. Journal of International
Business Studies, 19(3), 411–432.
Li, J. (1995). Foreign entry and survival: Effects of strategic choice on performance in international markets. Strategic Management Journal, (16)5, 333-351.
Padmanabhan, P., & Cho, K. R. (1995). Methodological issues in international business studies: The case of foreign
establishment mode decisions by multinational firms. International Business Review, 4(1), 55–73.
Robins, J. A. (1987). Organizational economics: Notes on the use of transaction-cost theory in the study of
organizations. Administrative Science Quarterly, 32(1), 68-86.
Taslica, A. O. (1995). Cok uluslu isletmeler ve Turkiye (Multinational enterprises and Turkey). In Ozalp, I. (Ed.),
Uluslararasi isletmecilik: Secme Yazilar (International Business: Selected Works) (pp. 849). Eskisehir: Anadolu
Universitiesi Yayinlari.
Tatoglu, E., & Glaister, K. (1998a). Western MNC’s FDI in Turkey: An analysis of location specific factors.
Management International Review, 38(20), 133-159.
Tatoglu, E., & Glaister, K. (1998b). An analysis of motives for western FDI in Turkey. International Business Review,
7, 203-230.
Tatoglu, E., & Glaister, K. (1998c). Determinants of foreign direct investment in Turkey. Thunderbird International Business Review, 40(3), 279-314.
Tatoğlu, E., & Glaister, W. G. (2000). Dimensions of western foreign direct investment in Turkey. Westport: Quorum Books.
Williamson, D. E. (1991). Comparative economic organization: The analysis of discrete structural alternatives.
Administrative Science Quarterly, 36(2), 269-296.
Yiu, D., & Makino, S. (2002). The choice between joint venture and wholly owned subsidiary: An institutional
perspective. Organization Science, 13(6), 667-683.
Yilmaz, K. (2009). Turkey’s recent trade and foreign direct investment performance. Tusiad-Koc University Economic Research Forum Working Paper series.
Yip, G. S. (1982). Diversification entry: Internal development versus acquisition. Strategic Management Journal, 3(4),
331–345.
TABLE 1: Countries and companies used in the study
Countries Number of
Companies
Small size and
Construction
Companies
Number of
Target
Companies
Number of
responding
Companies
Number of
non-responding
Companies
Total
Exported
Capital (*)
Turkmenistan 25 16 9 6 3 57551.386
Russia 128 105 23 22 1 188990.715
Romania 166 136 30 27 3 151281.240
Uzbekistan 79 60 19 17 2 37765.125
Kyrgyzstan 17 6 11 10 1 24148.093
Kazakhstan 100 85 15 11 4 444157.768
Bulgaria 56 36 20 14 6 69227.331
Total 571 444 127 107 20 973121658
Resource: (*) http.www.hazine.gov.tr (Undersecretariat of Treasury statistics (2005)
TABLE 2: Distribution of the industry sectors used in the study
Industry A B C D E F G H I K L M N Total
Total 3 6 25 16 14 3 22 1 9 7 6 2 15 129
A-Auto, transport B- Electronics and electrical machinery C-Food/Drink Manufacturing
D-Textile, apparel and leather E-Computer and software F-Metal iron and steel
G-Other manufacturing, H-Export-import trading, I-Tourism, K-Financial services,
L-Architecture, construction services M-Transport, N-Other services
© Centre for Promoting Ideas, USA www.ijbssnet.com
148
TABLE 3: Summary of the survey form
Section Questions’ coverage
1 Company’s major activity and relations with the other sectors
2 Company’s entry strategy
3 Factors that affect the entry strategy
4 Motivation factors
5 Company’s perceptions of its strengths
6 Performance expectations related to various criteria and their satisfaction level
7 Overall performance of investments
8 The performance of the company’s investments compared to home country operations
9 Performance compared to the competitors in the country of investment
10 Managerial control over the investment
11 Management problems areas and their frequency
12 Similarity of cultures between the host country and company
13 Percentage of the products purchased from the main company
14 Percentage of the products purchased from the investment company
15 The existence of the relationship with the host country before the investment and the form
of existing relationship
16 The factors and how much they are considered during the investment period
Table 4: Relative importance of motives for FEV formation in Turkey
Motivation N* Mean**
Std.
Deviation
To gain presence in new markets 98 4.09 1.16
Enabling faster market entry 98 4.00 1.13
Maintaining an adequate quality control 98 3.30 1.23
Enabling faster payback on the investment 98 3.01 1.07
Economies of scale: increased volume lowers unit cost 98 2.76 1.25
Better resource and capacity usage 98 2.66 1.21
Potential difficulties and problems with agents or licensees 98 2.56 1.26
Avoiding the risk of dissipation of knowledge 98 2.53 1.12
Exclusive or favored access to inputs 98 2.49 1.21
To conform to Turkish Government policy 98 2.48 1.28
Cost of making and enforcing contracts 98 2.42 1.27
Lack of patent and license protection laws 98 2.11 1.06
Non-transferability of technology by licensing and patents 98 2.06 0.97
* valid numbers of data
** the average on a scale of 1 (no importance) to 5 (major importance)
Source: Tatoglu & Glaister (1998b)
International Journal of Business and Social Science Vol. 2 No. 20; November 2011
149
Table 5: Factors of motivation
Factor
loads
Eigen-
values
% Variance
explained
Cumulative
per cent
Factor 1 (Transaction-specific costs) 4.72 36.3 36.3
Non-transferability of technology by licensing and patents 0.83
Lack of patent and license protection laws 0.77
Potential difficulties and problems with agents or licensees 0.70
Avoiding the risk of dissipation of knowledge 0.66
Cost of making and enforcing contracts 0.64
To conform to Turkish Government policy 0.49
Factor 2 (Production efficiency) 1.96 15.1 51.3
Economies of scale: increased volume lowers unit cost 0.89
Better resource and capacity usage 0.86
Exclusive or favored access to inputs 0.77
Factor 3 (Market development) 1.33 10.2 61.6
To gain presence in new markets 0.9
Enabling faster market entry 0.88
Factor 4 (Quality control and financial viability) 1.01 7.7 69.3
Maintaining an adequate quality control 0.71
Enabling faster payback on the investment 0.61
* K-M-O Measure of Sampling Adequacy is 0.7588
** Bartlett Test of Sphericity is 571.282 (p<0.0000)
Table 6: Motivation for FEV formation in Turkey: Mode of entry
Motivation Group N Mean
Std.
Deviation T Value
Transaction-specific costs greenfield 76 -0.02 1.03
Acquisition 22 0.08 0.90 -0.44
Non-transferability of technology by licensing and patents greenfield 76 2.01 0.96
Acquisition 22 2.23 0.97 -0.91
Lack of patent and license protection laws greenfield 76 2.05 1.09
Acquisition 22 2.32 0.95 -1.03
Potential difficulties and problems with agents or licensees greenfield 76 2.59 1.30
Acquisition 22 2.45 1.14 0.43
Avoiding the risk of dissipation of knowledge greenfield 76 2.45 1.15
Acquisition 22 2.77 0.97 -1.30
Cost of making and enforcing contracts greenfield 76 2.56 1.32
Acquisition 22 2.17 1.08 1.80
To conform to Turkish Government policy greenfield 76 2.47 1.36
Acquisition 22 2.54 1.01 -0.30
Production efficiency greenfield 76 -0.03 0.97
Acquisition 22 0.11 1.10 -0.57
Economies of scale: increased volume lowers unit cost greenfield 76 2.72 1.24
Acquisition 22 2.91 1.31 -0.62
Better resource and capacity usage greenfield 76 2.62 1.19
Acquisition 22 2.77 1.27 -0.50
Exclusive or favored access to inputs greenfield 76 2.42 1.20
Acquisition 22 2.83 1.24 -1.77
Market development greenfield 76 -0.06 1.08
Acquisition 22 0.16 0.67 -1.71
To gain presence in new markets greenfield 76 4.12 1.22
Acquisition 22 4.00 0.98 0.42
Enabling faster market entry greenfield 76 3.89 1.16
Acquisition 22 4.28 0.97 -1.81
Quality control and financial viability greenfield 76 0.03 1.04
Acquisition 22 -0.12 0.86 0.62
Maintaining an adequate quality control greenfield 76 3.33 1.30
Acquisition 22 3.18 0.96 0.60
Enabling faster payback on the investment greenfield 76 3.05 1.05
Acquisition 22 2.86 1.12 0.73
Source: Tatoglu & Glaister (1998b)

© Centre for Promoting Ideas, USA www.ijbssnet.com
150
Table 7: Motivation for FEV formation in Turkey: Ownership pattern
Motivation Group N Mean
Std.
Deviation T Value
Transaction-specific costs WOS 59 0.06 1.01
JV 39 -0.08 1.00 0.66
Non-transferability of technology by licensing and patents WOS 59 2.12 0.97
JV 39 1.97 0.96 0.73
Lack of patent and license protection laws WOS 59 2.07 1.07
JV 39 2.18 1.05 -0.50
Potential difficulties and problems with agents or licensees WOS 59 2.67 1.39
JV 39 2.38 1.02 1.18
Avoiding the risk of dissipation of knowledge WOS 59 2.63 1.15
JV 39 2.28 1.06 1.74
Cost of making and enforcing contracts WOS 59 2.62 1.31
JV 39 2.13 1.15 1.98
To conform to Turkish Government policy WOS 59 2.43 1.23
JV 39 2.56 1.37 -0.50
Production efficiency WOS 59 0.01 1.05
JV 39 -0.01 0.94 0.04
Economies of scale: increased volume lowers unit cost WOS 59 2.72 1.25
JV 39 2.82 1.25 -0.37
Better resource and capacity usage WOS 59 2.69 1.23
JV 39 2.61 1.18 0.30
Exclusive or favored access to inputs WOS 59 2.55 1.26
JV 39 2.41 1.14 0.56
Market development WOS 59 0.06 1.08
JV 39 -0.09 0.88 0.75
To gain presence in new markets WOS 59 4.14 1.19
JV 39 4.03 1.13 0.46
Enabling faster market entry WOS 59 4.10 1.09
JV 39 3.84 1.18 1.10
Quality control and financial viability WOS 59 0.12 0.94
JV 39 -0.18 1.06 1.47
Maintaining an adequate quality control WOS 59 3.48 1.27
JV 39 3.09 1.16 1.76
Enabling faster payback on the investment WOS 59 3.17 1.08
JV 39 2.77 1.01 1.85
Source: Tatoglu & Glaister (1998b, 1998c))

International Journal of Business and Social Science Vol. 2 No. 20; November 2011
151
Table 8: Relative Importance of Location Selection Determinants for Turkish Outward FDI
N*
Mean**
Std. Deviation T value
Advantage of being the first mover 107 4.743 0.6881 26.204***
Level of industry competition 106 3.717 1.4720 5.015***
Growth rate of economy 107 3.715 1.3824 5.350***
Market size 107 3.463 1.5642 3.059***
Low cost inputs 105 3.438 1.3880 3.234***
Access to neighboring markets 107 3.374 1.7295 2.236***
Purchasing power of customers 107 3.318 1.4446 2.275***
Repatriability of profits 107 3.313 1.3503 2.398***
Government policy toward FDI 107 3.000 1.6325 0.000
Tax advantages 106 2.986 1.6683 -0.087
Geographical proximity 107 2.692 1.7879 -1.784
Int. transport and communication cost 107 2.687 1.5729 -2.059***
Economic stability 107 2.673 1.5693 -2.156***
Level of infrastructure 107 2.654 1.4082 -2.540***
Qualified local personnel 106 2.415 1.3336 -4.516***
Goods quality inputs 106 2.396 1.6017 -3.881***
Political stability 107 2.336 1.6523 -4.154***
Incentives 107 2.075 1.6409 -5.833***
Level of unionization 106 1.358 0.8640 -19.561***
Valid N (listwise) 104
* valid numbers of data.
** the average on a scale of 1 (no importance) to 5 (major importance)
*** significant difference occurs at median value 3
Table 9: Factors of Location Selection of Turkish Outward FDI
Factor
Loads
Eigen-
values
% Variance
Explained
Cumulative Per
Cent Cronbach Alpha
Factor 1 (Investment Risk) 4.11 13.81 13.81 0.88
Economic stability 0.841
Political stability 0.839
Factor 2 (Government
Regulations) 2.25 11.48 25.29 0.69
Tax advantages 0.719
Incentives 0.718
Government policy toward FDI 0.622
Factor 3 (Market Potential) 1.96 11.14 36.43 0.67
Purchasing power of customers 0.835
Market size 0.801
Growth rate of economy 0.521
Level of unionization 0.510
Factor 4 (Cost Advantages) 1.38 11.10 47.54 0.66
Low cost inputs 0.816
Goods quality inputs 0.603
Access to neighboring markets 0.469
Factor 5 (Location Advantages) 1.30 10.66 58.20 0.50
Int. transport and communication
cost 0.792
Geographical proximity 0.708
Repatriability of profits 0.496
Factor 6 (Labor Supply) 1.00 8.42 66.62 0.53
Qualified local personnel 0.786
Level of industry competition 0.770
Level of infrastructure 0.487
* K-M-O Measure of Sampling Adequacy is 0.6620
** Bartlett Test of Sphericity is 610.445 (p<0.05)

© Centre for Promoting Ideas, USA www.ijbssnet.com
152
Table 10: Relative Importance of Variables by Mode of Entry
N Mean Std. Deviation T Value
Market size ACQUISITION 40 3.475 1.5850 0.063
GREENFIELD 67 3.455 1.5636
Growth rate of economy ACQUISITION 40 3.350 1.4597 -2.146
*
GREENFIELD 67 3.933 1.2965
Political stability ACQUISITION 40 2.338 1.6148 0.005
GREENFIELD 67 2.336 1.6864
Economic stability ACQUISITION 40 2.775 1.6406 0.518
GREENFIELD 67 2.612 1.5345
Level of infrastructure ACQUISITION 40 2.563 1.3549 -0.519
GREENFIELD 67 2.709 1.4464
Qualified local personnel ACQUISITION 40 2.500 1.4322 0.508
GREENFIELD 66 2.364 1.2787
Government policy toward FDI ACQUISITION 40 3.063 1.4771 0.317
GREENFIELD 67 2.963 1.7284
Incentives ACQUISITION 40 2.000 1.6172 -0.363
GREENFIELD 67 2.119 1.6654
Int. transport and communication cost ACQUISITION 40 2.338 1.4384 -1.794
GREENFIELD 67 2.896 1.6226
Repatriability of profits ACQUISITION 40 3.375 1.2545 0.365
GREENFIELD 67 3.276 1.4123
Goods quality inputs ACQUISITION 40 2.600 1.5981 1.020
GREENFIELD 66 2.273 1.6033
Low cost inputs ACQUISITION 40 3.563 1.2669 0.719
GREENFIELD 65 3.362 1.4618
Tax advantages ACQUISITION 40 2.613 1.5379 -1.813
GREENFIELD 66 3.212 1.7143
Geographical proximity ACQUISITION 40 2.200 1.6825 -2.239
*
GREENFIELD 67 2.985 1.7964
Level of unionization ACQUISITION 40 1.175 0.3848 -2.078
*
GREENFIELD 66 1.470 1.0410
Purchasing power of customers ACQUISITION 40 3.150 1.4772 -0.928
GREENFIELD 67 3.418 1.4265
Level of industry competition ACQUISITION 40 3.900 1.4106 0.997
GREENFIELD 66 3.606 1.5077
Access to neighboring markets ACQUISITION 40 3.550 1.6633 0.813
GREENFIELD 67 3.269 1.7717
Advantage of being the first mover ACQUISITION 40 4.750 0.7763 0.081
GREENFIELD 67 4.739 0.6358

International Journal of Business and Social Science Vol. 2 No. 20; November 2011
153
Table 11: Relative Importance of Variables by Ownership Pattern
N Mean
Std.
Deviation T value
Market size JV 31 3.548 1.6500 0.361
WOS 76 3.428 1.5378
Growth rate of economy JV 31 3.774 1.4308 0.282
WOS 76 3.691 1.3711
Political stability JV 31 2.548 1.6450 0.846
WOS 76 2.250 1.6583
Economic stability JV 31 2.677 1.6409 0.019
WOS 76 2.671 1.5504
Level of infrastructure JV 31 2.661 1.3378 0.033
WOS 76 2.651 1.4446
Qualified local personnel JV 30 2.583 1.3004 0.815
WOS 76 2.349 1.3491
Government policy toward FDI JV 31 2.839 1.8138 -0.651
WOS 76 3.066 1.5606
Incentives JV 31 2.290 1.7358 0.867
WOS 76 1.987 1.6041
Int. transport and communication cost JV 31 2.548 1.7096 -0.580
WOS 76 2.743 1.5220
Repatriability of profits JV 31 3.468 1.4659 0.755
WOS 76 3.250 1.3051
Goods quality Inputs JV 30 2.367 1.6914 -0.119
WOS 76 2.408 1.5763
Low cost inputs JV 30 3.650 1.3592 0.989
WOS 75 3.353 1.3993
Tax advantages JV 30 2.933 1.7798 -0.203
WOS 76 3.007 1.6340
Geographical proximity JV 31 2.645 1.8357 -0.171
WOS 76 2.711 1.7800
Level of unionization JV 30 1.200 0.4842 -1.556
WOS 76 1.421 0.9697
Purchasing power of customers JV 31 3.226 1.6874 -0.381
WOS 76 3.355 1.3437
Level of industry competition JV 31 3.161 1.7530 -2.257
*
WOS 75 3.947 1.2829
Access to neighboring markets JV 31 3.484 1.7102 0.419
WOS 76 3.329 1.7465
Advantage of being the first mover JV 31 4.742 0.5755 -0.010
WOS 76 4.743 0.7325
© Centre for Promoting Ideas, USA www.ijbssnet.com
154
Table 12: Cultural Familiarity by Ownership Pattern
N Mean
Std.
Deviation T value
Local culture JV 31 3.129 1.0565 2.580
*
WOS 75 2.560 1.0232
Corporate culture JV 23 2.826 1.3022 0.760
WOS 61 2.607 1.1333
Business ethics JV 31 2.355 1.2530 1.750
WOS 75 1.927 0.8330
Ways of business JV 31 2.210 1.3024 2.379
*
WOS 75 1.627 0.6319
Table 13: Cultural Familiarity by Ownership Pattern at Grouped Level
N Mean
Std.
Deviation T value
Cultural similarity JV 23 2.7011 1.14362 2.201
*
WOS 61 2.1578 0.49681
Table 14: Crosstabulation of Ownership Pattern and Previous Experience
Previous Experience
Total NO YES
Ownership JV 14 17 31
WOS 42 34 76
Total 56 51 107
Table 15: Crosstabulation of Mode of Entry and Previous Experience
Previous Experience
Total
NO YES
Entry mode ACQUISITION 16 24 40
GREENFIELD 40 27 67
Total 56 51 107

International Journal of Business and Social Science Vol. 2 No. 20; November 2011
155
Table 16. Location Selection Determinants by Previous Experiences
N Mean Std. Deviation T value
Market size NO 35 3.686 1.5675 -0.358
YES 51 3.520 1.5328
Growth rate of economy NO 35 4.229 1.0870 1.835
YES 51 3.461 1.4520
Political stability NO 35 2.657 1.7813 1.203
YES 51 2.137 1.4835
Economic stability NO 35 2.900 1.5520 0.716
YES 51 2.559 1.5958
Level of infrastructure NO 35 2.671 1.5289 0.598
YES 51 2.569 1.3785
Qualified local personnel NO 35 2.629 1.3080 0.170
YES 51 2.392 1.4259
Government policy toward FDI NO 35 3.600 1.4990 3.772
*
YES 51 2.412 1.5547
Incentives NO 35 2.429 1.7870 2.822
*
YES 51 1.627 1.2643
Int. transport and communication cost NO 35 2.714 1.6192 2.001
*
YES 51 2.373 1.5094
Repatriability of profits NO 35 2.900 1.1869 -0.076
YES 51 3.324 1.3410
Goods quality inputs NO 35 2.914 1.7884 3.226
*
YES 51 1.902 1.2846
Low cost inputs NO 35 3.686 1.4506 0.552
YES 50 3.360 1.2779
Tax advantages NO 35 3.171 1.6888 0.964
YES 51 2.824 1.6698
Geographical proximity NO 35 2.571 1.7704 1.892
YES 51 2.353 1.7980
Level of unionization NO 35 1.657 1.2589 2.432
*
YES 51 1.157 0.4182
Purchasing power of customers NO 35 3.771 1.1903 1.636
YES 51 3.078 1.5472
Level of industry competition NO 34 4.088 1.1110 -0.584
YES 51 3.804 1.5623
Access to neighboring markets NO 35 3.629 1.6285 1.934
YES 51 3.039 1.7659
Advantage of being the first mover NO 35 4.900 0.2921 -0.030
YES 51 4.745 0.6883
Table 17: Comparison Based On Location Criteria for Inward and Outward FDI
Inward FDI Outward FDI
1. New Markets 1.Advantage of being first mover
2. Faster Market Entry 2.Level of industry competition
3. Adequate quality control 3.Growth rate of economy
4. Faster payback period 4.Market size
5. Increased scale economies 5.Low cost inputs
Table 18: Rationale for Greenfield versus Acquisition Strategy (Priorities)
Inward FDI Outward FDI
Greenfield: Greenfield:
1. Making and enforcing contracts 1. Growth rate of economy
2. Geographical proximity
3. Level of unionization
Acquisition: Acquisition:
1. Exclusive or favored access to inputs None
2. Marketing development
3. Enabling faster market entry