a comprehensive model of factors associated with
TRANSCRIPT

A comprehensive model of factors associated with capability to ‘live well’ for family
caregivers of people living with mild-to-moderate dementia: findings from the IDEAL study
Linda Clare ScD,1,2,3 Yu-Tzu Wu PhD,1,2 Catherine Quinn PhD,1,2 Ian Rees Jones PhD,4
Christina R Victor PhD,5 Sharon M Nelis PhD,1,2 Anthony Martyr PhD,1,2 Rachael Litherland
MSc,6 James A Pickett PhD,7 John V Hindle MBBS,8,9 Roy W Jones MBBS,10 Martin Knapp
PhD,11 Michael D Kopelman PhD,12 Robin G Morris PhD,13 Jennifer M Rusted PhD,14
Jeanette M Thom PhD,15 Ruth A Lamont PhD,1,2 Catherine Henderson PhD,11 Isla Rippon
PhD,5 Alexandra Hillman PhD,4 & Fiona E Matthews PhD,16 on behalf of the IDEAL study
team
1. Centre for Research in Ageing and Cognitive Health (REACH), School of
Psychology, University of Exeter, Exeter, UK
2. PenCLAHRC, University of Exeter Medical School, Exeter, UK
3. Wellcome Centre for Cultures and Environments of Health, University of Exeter,
Exeter, UK
4. Wales Institute for Social and Economic Research, Data and Methods, Cardiff
University, Cardiff, UK
5. College of Health and Life Sciences, Brunel University London, London, UK
6. Innovations in Dementia, Exeter, UK
7. Alzheimer’s Society, London, UK
8. Department of Care for the Elderly, Betsi Cadwaladr University Health Board,
Llandudno, UK
9. School of Psychology, Bangor University, Bangor, UK
10. RICE (The Research Institute for the Care of Older People), Bath, UK
11. Personal Social Services Research Unit, London School of Economics and Political
Science, London, UK
12. Psychological Medicine, King’s College London, Institute of Psychiatry Psychology
and Neuroscience
13. Department of Psychology, King’s College London Institute of Psychiatry,
Psychology and Neuroscience, London, UK
14. School of Psychology, University of Sussex, Brighton, UK
15. School of Medical Sciences, University of New South Wales, Sydney, Australia
16. Institute for Health and Society, Newcastle University, Newcastle upon Tyne, UK
brought to you by COREView metadata, citation and similar papers at core.ac.uk
provided by Newcastle University E-Prints

Corresponding author: Professor Linda Clare, REACH, University of Exeter Medical School,
South Cloisters, St Luke’s Campus, Exeter EX1 2LU, UK. [email protected]
http://psychology.exeter.ac.uk/reach/
Word counts: Abstract 198; Main text 3173; Tables 2; Figures 1
Funding sources
The IDEAL study was supported by the Economic and Social Research Council (UK) and the
National Institute for Health Research (UK) through grant ES/L001853/2 ‘Improving the
experience of dementia and enhancing active life: living well with dementia’ (Investigators:
L. Clare, I.R. Jones, C.R. Victor, J.V. Hindle, R.W. Jones, M. Knapp, M.D. Kopelman, R.
Litherland, A. Martyr, F.E. Matthews, R.G. Morris, S.M. Nelis, J.A. Pickett, C. Quinn, J.M.
Rusted, J. Thom). The support of the ESRC and NIHR is gratefully acknowledged. The
funders had no role in the study design, data collection, data analysis and interpretation,
writing of the report, or the decision to submit the article for publication.

Abstract (234 words)
Introduction: Understanding key influences on outcomes for caregivers of people with
dementia is hampered by inconsistent conceptualisation and measurement of outcomes and
limited evidence about the relative impact of different variables. We aimed to address these
issues.
Method: We analysed data from 1283 caregivers of community-dwelling individuals with
mild-to-moderate dementia in the IDEAL cohort. We generated a ‘living well’ latent factor
from measures of quality of life, satisfaction with life and well-being. We used structural
equation modelling to derive latent variables for seven domains reflecting caregivers’
perceptions of their personal resources and experiences, and to examine the associations with
caregivers’ perceptions of their capability to ‘live well’.
Results: The domain of Psychological characteristics and psychological health was most
strongly related to living well (2.53; 95% CI 2.08, 2.97), followed by Physical fitness and
physical health (1.48, 95% CI 1.04, 1.91) and Experiencing caregiving (1.34; 95% CI 0.99,
1.70). Capitals, assets and resources (0.68, 95% CI 0.35, 1.00) and Relationship with the
person with dementia (-0.22, 95% CI -0.41, -0.03) had smaller, significant associations.
Social location (0.28, 95% CI -0.33, 0.89) and Managing everyday life with dementia (0.06,
95% CI -0.15, 0.28) were not significantly associated with living well.
Discussion: These findings demonstrate the importance of supporting caregivers’
psychological and physical health and their ability to develop and maintain positive coping
strategies, as well as enabling them to maintain vital social capitals, assets and resources.
Keywords
Quality of life, satisfaction with life, well-being, health, stress
A comprehensive model of factors associated with capability to ‘live well’ for family
caregivers of people living with mild-to-moderate dementia: findings from the IDEAL
study
Introduction
Family members and friends (here together termed ‘caregivers’) provide vital unpaid care and
support for people with dementia living in the community. In the UK, for example, caregivers
provide 1.34 billion hours of unpaid care to people with dementia each year, equating to a
cost of £11.6 billion or 44% of the total cost of dementia care.1
People with dementia have needs for care which are different to, and greater than, those of
other groups with long-term health problems or disabilities, and these evolve and increase
over time as the disease progresses.2 Compared to both the general population and caregivers
supporting people with other illnesses or disabilities, caregivers of people with dementia
experience poorer quality of life (QoL),3, 4 satisfaction with life5 and well-being.6 These are
all indices of capability to ‘live well’ while providing care. ‘Living well’ means experiencing
the best possible level of well-being, reflected in a subjective sense of ‘comfort, function and
contentment with life’ (p 32).7
Caring for a person with dementia can bring many challenges to the ability to live well,8
including loss and grief, isolation and loneliness, depression, anxiety and exhaustion, and the
demands of providing care may need to be balanced against the caregiver’s other
responsibilities or own health problems. The potential stresses of providing family care and
their impact on the caregiver have been captured in the influential stress-process model of
caregiving9 and the concept of caregiver burden.10 Equally, however, it has been noted that
burden is not a strong predictor of QoL,11 and other factors have a role to play. Well-being
among those caring for a person with dementia is more closely associated with the
characteristics of the caregiver and the caregiving situation than with the illness
characteristics of the person with dementia or the objective level of burden.12 Caregivers’
own resources, including social support13 and personal strengths such as personality traits,14
an optimistic outlook and feelings of competence,15 and use of problem-focused rather than
emotion-based coping strategies16 underpin maintenance of mental health and are associated
with better well-being. Furthermore, it is increasingly recognised that caregiving itself can

lead to positive experiences, such as accomplishment and enjoyment of the role, feelings of
mutuality, increased family cohesion, and personal growth and purpose in life.17-19
A comprehensive understanding of these positive and negative influences could inform
knowledge about how to provide effective support for caregivers of people with dementia.
However, evidence about potential influences on indices of capability to live well is relatively
limited. A recent synthesis included 41 studies and examined the associations between 47
variables, grouped into 10 themes, and caregiver QoL.20 This demonstrated that caregiver
QoL is affected by multiple factors. The authors point out that heterogeneity among studies
precluded calculation of standardized effect sizes and direct comparisons, and the number of
statistically significant associations reported in studies may have been inflated due to reliance
on correlational analyses without correction for multiple comparisons. Thus, it was not
possible to identify how variables may be interrelated or determine which variables or groups
of variables demonstrate the strongest associations.
Furthermore, in caregiving literature the terms QoL, satisfaction with life and well-being are
frequently conflated or used interchangeably at both conceptual and measurement levels.11, 21-
25 While numerous studies have attempted to identify associations between individual
variables and one of these key measures, given that these three concepts are correlated and
show similar associations with key variables,26, 27 combining them into a single factor might
demonstrate stronger and more consistent associations across a wider range of variables.
In this study we aimed to address this inconsistency in concepts and measures by combining
standardised measures of QoL, satisfaction with life and subjective well-being into a single
‘living well’ factor and comprehensively modelling influences on capability to live well for
caregivers. Using data from the Improving the experience of Dementia and Enhancing Active
Life (IDEAL) cohort study,28 we grouped 48 potentially associated variables into 7 domains,
used multivariate modelling to derive latent variables for these domains, and employed
structural equation modelling to examine how these domains were associated with each other
and with ‘living well’ for caregivers of people with mild-to-moderate dementia.

Research Design and Methods
Design
IDEAL is a longitudinal cohort study of people living with dementia and their caregivers
throughout Great Britain (England, Scotland and Wales). Trained interviewers visit
participants’ homes and conduct face-to-face interviews. An involvement group of people
living with dementia and caregivers, the Action on Living Well: Asking You (ALWAYs)
group, advises on the design and conduct of the study and contributes to interpreting the
results. This analysis is based on cross-sectional data from the first wave of data collection
and uses version 2.0 of the dataset. IDEAL was approved by the Wales Research Ethics
Committee 5 (reference 13/WA/0405), and the Ethics Committee of the School of
Psychology, Bangor University (reference 2014 – 11684). IDEAL is registered with the UK
Clinical Research Network (UKCRN), number 16593.
Participants
The participants in this study are the caregivers of people living with dementia recruited into
the IDEAL cohort. People with dementia living in the community were recruited through
memory clinics and other specialist services in 29 National Health Service sites, and through
the online Join Dementia Research portal, between July 2014 and August 2016. Inclusion
criteria were a clinical diagnosis of dementia and a Mini-Mental State Examination29 score of
15 or over, and ability to provide informed consent. Exclusion criteria were other terminal
illness and any significant risk to interviewers conducting home visits. In total 1547 people
with dementia agreed to participate. When a person with dementia joined the study, a
caregiver was invited to take part as well. ‘Caregiver’ was defined as the main family
member or friend providing unpaid care and support to the person with dementia. There were
no specific inclusion or exclusion criteria for caregivers. In total 1283 caregivers agreed to
participate; of these 1045 (67.6%) lived with the participating person with dementia.
Outcome measures
The outcomes explored in this analysis were caregivers’ subjective perceptions of QoL,
satisfaction with life and well-being, combined into a single latent factor of ‘living well’.
QoL was assessed with the World Health Organization QoL-BREF (WHOQOL-BREF).30
The 26 items cover four domains, physical health, psychological, social relationships and
environment, plus two general questions, and are rated on a 1-5 scale. The mean score for

items within each domain is used to calculate the domain score. The domain score is then
multiplied by 4 to give a score out of 100. For the purposes of the present analysis, to derive a
single QoL score, the four domains and two general questions were included in a factor
analysis model and a predicted factor score was derived for those with complete information.
Satisfaction with life was assessed with the Satisfaction with Life Scale (SwLS).31 The five
items are rated on a 1-7 scale and responses are added to give a total score out of 35. Higher
scores indicate greater life satisfaction. Well-being was assessed with the World Health
Organization-Five Well-Being Index (WHO-5).32 The five items are rated on a 0-5 scale and
responses are added to give a total score out of 25, which is multiplied by 4 to give a score
out of 100. Higher scores indicate greater well-being.
Measures of potential predictor variables
The 7 life domains addressed in the IDEAL study caregiver interview covered 48 possible
predictor variables which were considered for inclusion in the structural equation model. The
7 domains were as follows:
Capitals, assets and resources – this reflected social resources, social networks, and
participation in social and cultural activities.
Social location – this reflected socio-economic status and perceived social standing.
Psychological characteristics and psychological health – this reflected psychological
traits and dispositions, including personality characteristics, optimism, self-esteem
and self-efficacy, as well as loneliness and depression.
Physical fitness and physical health – this reflected physical activity, lifestyle and
health conditions.
Managing everyday life with dementia – this included perceived severity of and
distress at symptoms, and involvement of the person with dementia in decision
making.
Relationship with the person with dementia – this included assessments of current and
past relationship quality.
Experiencing caregiving – this reflected both positive and challenging aspects of
caregiving, such as competence, coping, stress and social restriction.
Supplementary Table 1 summarises the variables considered under each domain, and how
these were measured.
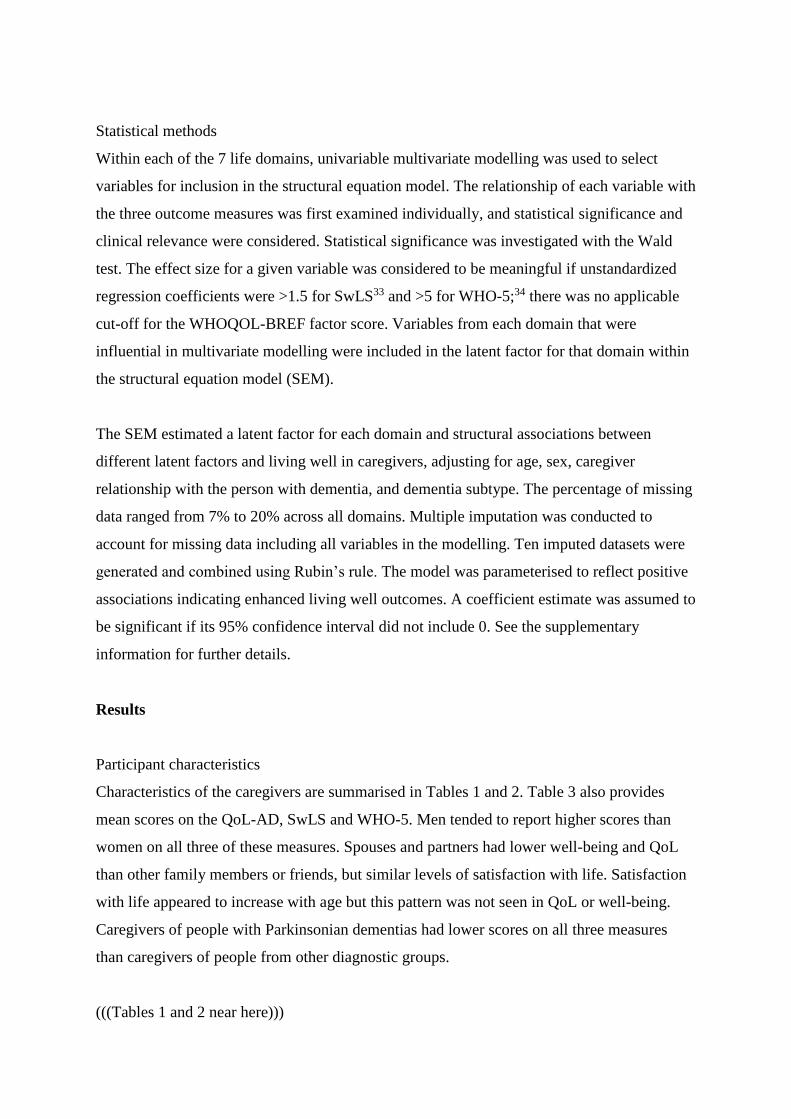
Statistical methods
Within each of the 7 life domains, univariable multivariate modelling was used to select
variables for inclusion in the structural equation model. The relationship of each variable with
the three outcome measures was first examined individually, and statistical significance and
clinical relevance were considered. Statistical significance was investigated with the Wald
test. The effect size for a given variable was considered to be meaningful if unstandardized
regression coefficients were >1.5 for SwLS33 and >5 for WHO-5;34 there was no applicable
cut-off for the WHOQOL-BREF factor score. Variables from each domain that were
influential in multivariate modelling were included in the latent factor for that domain within
the structural equation model (SEM).
The SEM estimated a latent factor for each domain and structural associations between
different latent factors and living well in caregivers, adjusting for age, sex, caregiver
relationship with the person with dementia, and dementia subtype. The percentage of missing
data ranged from 7% to 20% across all domains. Multiple imputation was conducted to
account for missing data including all variables in the modelling. Ten imputed datasets were
generated and combined using Rubin’s rule. The model was parameterised to reflect positive
associations indicating enhanced living well outcomes. A coefficient estimate was assumed to
be significant if its 95% confidence interval did not include 0. See the supplementary
information for further details.
Results
Participant characteristics
Characteristics of the caregivers are summarised in Tables 1 and 2. Table 3 also provides
mean scores on the QoL-AD, SwLS and WHO-5. Men tended to report higher scores than
women on all three of these measures. Spouses and partners had lower well-being and QoL
than other family members or friends, but similar levels of satisfaction with life. Satisfaction
with life appeared to increase with age but this pattern was not seen in QoL or well-being.
Caregivers of people with Parkinsonian dementias had lower scores on all three measures
than caregivers of people from other diagnostic groups.
(((Tables 1 and 2 near here)))

Variables included in the analysis
The variables retained for inclusion in each domain through univariable multivariate
modelling are summarised in Table 3. Full details of the stages of modelling are provided in
the supplementary information.
(((Table 3 near here)))
Relationships among the latent variables
In the final model, following multiple imputation analysis and with adjustment,
Psychological characteristics and psychological health was most strongly related to living
well (2.53; 95% CI 2.08, 2.97), followed by Physical fitness and physical health (1.48, 95%
CI 1.04, 1.91) and Experiencing caregiving (1.34; 95% CI 0.99, 1.70). Capitals, assets and
resources (0.68, 95% CI 0.35, 1.00) and Relationship (-0.22, 95% CI -0.41, -0.03) had
smaller but still significant associations. Social location (0.28, 95% CI -0.33, 0.89) and
Managing everyday life with dementia (0.06, 95% CI -0.15, 0.28) were not significantly
associated with living well. A visual representation of the model is presented in Figure 1.
Discussion
We have presented a comprehensive model of factors associated with ‘living well’ for a large
sample of 1283 caregivers of people with mild-to-moderate dementia, drawn from socially
and environmentally diverse areas of Great Britain. This analysis uniquely combined 48
individual predictor variables to derive 7 latent factors reflecting key domains of the
caregiving experience, and three outcome variables to derive a single ‘living well’ factor, in
order to create a model demonstrating the significant associations with ‘living well’ and the
relative strength of these associations. The model indicates that caregivers’ psychological
characteristics and psychological health are most strongly associated with subjective
perceptions of ‘living well’, while their physical fitness and physical health, and their
experience of caregiving, also demonstrate important associations. Social resources play a
more limited but still important role. Social class and perceived social status are not
associated with whether or not the caregiver is ‘living well’. Current relationship with the
person with dementia, again, plays a limited through still important role, while dementia-

related problems reflected in perceptions of neuropsychiatric symptoms are not associated
with ‘living well’. These findings provide a more integrated understanding of influences on
outcomes for caregivers than hitherto available.
Previous research demonstrates that good mental and physical health are consistently
associated with caregiver QoL.20 These factors are recognised in the stress process model,9
where depression, anxiety and poor physical health are seen as resulting from a combination
of objective and subjective stressors and strains. Several studies indicate an association
between depression and poorer outcomes for caregivers.13, 35-37 While there has been a
considerable focus on depression in previous research, the impact of psychological
characteristics has received much less attention. Our modelling incorporated a range of
psychological characteristics alongside depression, and the final model included the
personality trait of neuroticism, optimism, self-esteem and the subjective sense of loneliness.
Recent work has indicated the relevance of personality traits,14 while hope has been identified
as related to better QoL,37 and optimism has been associated with greater life satisfaction.15
Our study builds on this by grouping several psychological factors together and including
these alongside other non-psychological predictors. This provides a stronger foundation for
emphasising the importance of psychological characteristics and psychological health among
carers of people with dementia.
Alongside these personal characteristics, we focused on the social capitals, assets and
resources that were available to the caregivers in our sample. The final model included
frequency of social contact, availability of resources within the caregiver’s social network
that could be called upon to address particular needs, and civic participation. Caregivers’
perceptions of social support have been identified previously as important for QoL,
satisfaction with life and well-being.11, 38, 39 A recent review found no clear association with
QoL,20 but this was based on data from only two studies. Our more comprehensive
examination of the role of social capitals, assets and resources, in the form of social support
and civic participation, reinforces the finding that social support plays an important role in
enabling carers to live well.
As regards the caregivers’ experience of caregiving, our model included stress, social
restriction and role captivity. Caregivers’ perceptions of the experience of caregiving are
likely to be underpinned by both general psychological characteristics and health and the

availability of support and resources. Previous reviews have indicated that stress is related to
poorer QoL.20, 37 The caregiver’s perception of the quality of the relationship with the person
with dementia was also important in our model. One study40 found that closeness in the
relationship was associated with better caregiver well-being, but also noted that subsequent
decline in closeness over time has a detrimental effect.
Two of the seven domains covered in our modelling did not show significant associations
with living well. One of these, Managing everyday life with dementia, reflected perceived
severity of and distress at neuropsychiatric symptoms. Farina20 found that the relationship
between presence of behavioural and psychological symptoms in the person with dementia
and caregiver QoL was unclear, with only about half of the included studies finding an
association. The IDEAL cohort included participants who, at baseline, had mild-to-moderate
dementia and were living in the community; hence, levels of neuropsychiatric symptoms may
have been relatively low, precluding the possibility of finding an association between
perceptions of these and outcomes for caregivers, should such an association exist. The other,
Social location, considered demographic characteristics of the caregiver and our modelling
included an objective assessment of socio-economic status as well as the caregiver’s own
perceptions of status in relation to others, and in the community and wider society. The final
model included only the caregiver’s perceptions and found no association with living well.
Similarly, Farina20 found no strong evidence regarding associations between demographic
characteristics of the caregiver and caregiver QoL.
There are a number of limitations to this study that must be acknowledged. The analysis is
based on cross-sectional data and causal direction cannot be inferred. Selection of variables
was necessary in developing the model, and while the variables remaining were those with
clear domain-specific relationships, some small effects may have been omitted in the final
modelling stage. The participating caregivers were providing care to people with mild-to-
moderate dementia living in the community, and associations may be different for caregivers
of people who have more advanced dementia or who are receiving institutional care. The
analysis included all participating caregivers and adjusted for the relationship to the person
with dementia. However, the majority of caregivers were spouses or partners, and their
experiences may differ from those of adult children or other family members or friends
providing care. We were unable to consider cultural and ethnic differences as the sample

consisted almost entirely of white British individuals. Caregivers from black and minority
ethnic groups may be less likely to access health services and related support16 and hence are
important to consider.41 Future research might test this or similar models with different
groups of caregivers. It would also be valuable to examine whether associations persist when
examined longitudinally. Changes might be expected, for example, where social support39 or
closeness in the relationship40 decline, neuropsychiatric symptoms increase in number and
severity, or the person with dementia moves into institutional care.5 Further waves of follow-
up in IDEAL will provide this longitudinal perspective.
The model presented here indicates key predictors of caregivers’ capability to live well,
comprising evaluations of QoL, satisfaction with life and well-being. This builds on previous
research to provide a template for conceptualising the elements that should be included when
considering how best to support caregivers of people with mild-to-moderate dementia living
in the community. Optimising mental and physical health is vital. Beyond this, understanding
the profile of psychological characteristics and how this influences each caregiver’s
experience would make it possible to target support more precisely to those caregivers who
would most benefit from it. This would include encouraging the development of effective
coping strategies. Similarly, understanding the nature of each caregiver’s social networks and
resources and how these change over time39 would highlight ways in which information and
support could be augmented in order to meet important needs for connection with others42
and alleviate negative impacts of caregiving.
In conclusion, these findings present new evidence about the relative impact of different
aspects of the experience of caregivers of community-dwelling individuals with mild-to-
moderate dementia on caregivers’ QoL, satisfaction with life and well-being, incorporating a
wider range of potential predictor variables than previously considered. The findings
demonstrate the importance of supporting caregivers’ psychological and physical health and
their ability to develop and maintain positive coping strategies, as well as enabling caregivers
to maintain vital social capitals, assets and resources. Greater understanding of the
contribution of these domains of experience to caregivers’ capability to live well will help to
inform policy discussions and decisions about health and social care provision, so as to
enhance the support available to caregivers of people with dementia.

Acknowledgements
We are grateful to the three UK research networks, the NIHR Clinical Research Network in
England, the Scottish Dementia Network (SDN) and Health and Care Research Wales, for
supporting the study. We thank the local principal investigators and staff at our NHS sites,
the IDEAL study participants and their families, the members of the ALWAYs group,
including members of the Alzheimer’s Society Research Network, and Dr Nori Graham and
members of the Project Advisory Group. We are grateful to Nada Savitch for setting up and
early facilitation of the ALWAYs group.
Conflicts of interest
The authors report no conflicts of interest
Authorship Contribution
Authors Clare, Quinn, Jones, Victor, Nelis, Martyr, Pickett, Hindle, Jones, Knapp, Kopelman,
Morris, Rusted and Thom were involved in the original conception and design of the project,
and secured funding. Authors Wu, Matthews, and Clare are responsible for the data analysis
and interpretation. The lead author Clare was responsible for drafting the article. All authors
have contributed to the critical revision of the article, and provided final approval of the
version to be published.

References
1. Prince MJ, Knapp M, Guerchet M, et al. Dementia UK: Second Edition – Overview.
London: Alzheimer’s Society; 2014.
2. Prince MJ, Prina M, Guerchet M. World Alzheimer Report 2013: Journey of Caring:
An Analysis of Long-Term Care for Dementia. London: Alzheimer's Disease
International; 2013.
3. Garzón-Maldonado FJ, Gutiérrez-Bedmar M, García-Casares N, et al. Health-related
quality of life in caregivers of patients with Alzheimer disease. Neurología (English
Edition). 2017;32:508-515.
4. Koyama A, Matsushita M, Hashimoto M, et al. Mental health among younger and
older caregivers of dementia patients. Psychogeriatrics. 2017;17:108-114.
5. Ask H, Langballe EM, Holmen J, et al. Mental health and wellbeing in spouses of
persons with dementia: the Nord-Trondelag Health Study. BMC Publ Health.
2014;14:413.
6. Pinquart M, Sorensen S. Differences between caregivers and noncaregivers in
psychological health and physical health: a meta-analysis. Psychol Aging.
2003;18:250-267.
7. Institute Of Medicine. Living Well with Chronic Illness: A Call for Public Health
Action. Washington: National Academies Press; 2012.
8. Merrilees J. The impact of dementia on family caregivers: what is research teaching
us? Curr Neurol Neurosci Rep. 2016;16:88.
9. Pearlin LI, Mullan JT, Semple SJ, et al. Caregiving and the stress process: an
overview of concepts and their measures. Gerontologist. 1990;30:583-594.
10. Zarit SH, Reever KE, Bach-Peterson J. Relatives of the impaired elderly: correlates of
feelings of burden. Gerontologist. 1980;20:649-655.
11. Chappell NL, Reid RC. Burden and well-being among caregivers: examining the
distinction. Gerontologist. 2002;42:772-780.
12. George LK, Gwyther LP. Caregiver well-being: a multidimensional examination of
family caregivers of demented adults. Gerontologist. 1986;26:253-259.
13. Au A, Shardlow SM, Teng YUE, et al. Coping strategies and social support-seeking
behaviour among Chinese caring for older people with dementia. Ageing Soc.
2013;33:1422-1441.

14. Kim SK, Park M, Lee Y, et al. Influence of personality on depression, burden, and
health-related quality of life in family caregivers of persons with dementia. Int
Psychogeriatr. 2017;29:227-237.
15. Sutter M, Perrin PB, Peralta SV, et al. Beyond strain: personal strengths and mental
health of Mexican and Argentinean dementia caregivers. J Transcult Nurs.
2016;27:376-384.
16. Brodaty H, Donkin M. Family caregivers of people with dementia. Dialogues Clin
Neurosci. 2009;11:217-228.
17. Crellin NE, Orrell M, McDermott O, et al. Self-efficacy and health-related quality of
life in family carers of people with dementia: a systematic review. Aging Ment
Health. 2014;18:954-969.
18. Pinquart M, Sorensen S. Associations of caregiver stressors and uplifts with
subjective well-being and depressive mood: a meta-analytic comparison. Aging Ment
Health. 2004;8:438-449.
19. Yu DSF, Cheng ST, Wang J. Unravelling positive aspects of caregiving in dementia:
An integrative review of research literature. Int J Nurs Stud. 2018;79:1-26.
20. Farina N, Page TE, Daley S, et al. Factors associated with the quality of life of family
carers of people with dementia: A systematic review. Alzheimers Dement.
2017;13:572-581.
21. McConaghy R, Caltabiano ML. Caring for a person with dementia: exploring
relationships between perceived burden, depression, coping and well-being. Nurs
Health Sci. 2005;7:81-91.
22. Perren S, Schmid R, Herrmann S, et al. The impact of attachment on dementia-related
problem behavior and spousal caregivers' well-being. Am J Bioeth. 2007;9:163-178.
23. Arango Lasprilla JC, Moreno A, Rogers H, et al. The effect of dementia patient's
physical, cognitive, and emotional/ behavioral problems on caregiver well-being:
findings from a Spanish-speaking sample from Colombia, South America. Am J
Alzheimers Dis Other Demen. 2009;24:384-395.
24. De Oliveira DC, Hlebec V. Predictors of satisfaction with life in family carers:
evidence from the third European quality of life survey. Teorija in Praksa.
2016;53:503-523.
25. Hazzan AA, Ploeg J, Shannon H, et al. Caregiver perceptions regarding the
measurement of level and quality of care in Alzheimer's disease. BMC Nurs.
2015;14:54.

26. Pinquart M, Sorensen S. Influences of socioeconomic status, social network, and
competence on subjective well-being in later life: a meta-analysis. Psychol Aging.
2000;15:187-224.
27. Pinquart M, Sorensen S. Gender differences in caregiver stressors, social resources,
and health: an updated meta-analysis. J Gerontol B Psychol Sci Soc Sci. 2006;61:P33-
45.
28. Clare L, Nelis SM, Quinn C, et al. Improving the experience of dementia and
enhancing active life - living well with dementia: study protocol for the IDEAL study.
Health Qual Life Outcomes. 2014;12:164.
29. Folstein MF, Folstein SE, McHugh PR. “Mini-mental state”. A practical method for
grading the cognitive state of patients for the clinician. J Psychiatr Res. 1975;12:189-
198.
30. Skevington SM, Lotfy M, O'Connell KA, et al. The World Health Organization's
WHOQOL-BREF quality of life assessment: psychometric properties and results of
the international field trial. A report from the WHOQOL group. Qual Life Res.
2004;13:299-310.
31. Diener E, Emmons RA, Larsen RJ, et al. The Satisfaction With Life Scale. J Pers
Assess. 1985;49:71-75.
32. Bech P. Measuring the dimension of psychological general well-being by the WHO-5.
Qual Life Newslett. 2004;32:15-16.
33. Kobau R, Sniezek J, Zack Matthew M, et al. Well‐being assessment: an evaluation of
well‐being scales for public health and population estimates of well‐being among US
adults. Appl Psychol Health Well-Being. 2010;2:272-297.
34. Topp CW, Østergaard SD, Søndergaard S, et al. The WHO-5 Well-Being Index: a
systematic review of the literature. Psychother Psychosom. 2015;84:167-176.
35. Bruvik FK, Ulstein ID, Ranhoff AH, et al. The quality of life of people with dementia
and their family carers. Dement Geriatr Cogn Disord. 2012;34:7-14.
36. Papastavrou E, Andreou P, Middleton N, et al. Family burden, quality of life,
depression and perceptions of social capital in dementia care. 27th International
Conference of Alzheimer's Disease International. 2012:91-95.
37. Schulz R, O'Brien AT, Bookwala J, et al. Psychiatric and physical morbidity effects
of dementia caregiving: prevalence, correlates, and causes. Gerontologist.
1995;35:771-791.

38. Haley WE, Roth DL, Coleton MI, et al. Appraisal, coping, and social support as
mediators of well-being in black and white family caregivers of patients with
Alzheimer's disease. J Consult Clin Psychol. 1996;64:121-129.
39. Clay OJ, Roth DL, Wadley VG, et al. Changes in social support and their impact on
psychosocial outcome over a 5-year period for African American and White dementia
caregivers. Int J Geriatr Psychiatry. 2008;23:857-862.
40. Fauth E, Hess K, Piercy K, et al. Caregivers' relationship closeness with the person
with dementia predicts both positive and negative outcomes for caregivers' physical
health and psychological well-being. Aging Ment Health. 2012;16:699-711.
41. Dilworth-Anderson P, Williams IC, Gibson BE. Issues of race, ethnicity, and culture
in caregiving research: a 20-year review (1980-2000). Gerontologist. 2002;42:237-
272.
42. Pini S, Ingleson E, Megson M, et al. A needs-led framework for understanding the
impact of caring for a family member with dementia. Gerontologist. 2018;58:e68-e77.

Table 1. Characteristics of the caregivers (n = 1283)
N (%)
Ethnicity (n = 1276)
White British
Other
1228 (96.2)
48 (3.8)
First language (n = 1278)
English
Welsh
Other
1258 (98.4)
7 (0.6)
13 (1.0)
Religion (n = 1273)
Christian
Other religion
No religion
978 (76.6)
28 (2.19)
267 (20.9)
Highest level of education
(n = 1232)
No qualifications
School certificate age 16
School certificate age 18
College-level
265 (21.5)
274 (22.2)
374 (30.4)
319 (25.9)
Marital status (n = 1267)
Married/cohabiting
Divorced/separated
Widowed
Single (never married)
1172 (92.1)
44 (4.5)
14 (1.1)
37 (2.9)
Hours per day spent caring
(n = 1235)
None
1 – 3
4 – 5
6 – 10
>10 but not overnight
>10 including overnight
Other
82 (6.6)
390 (31.5)
104 (8.4)
99 (8.0)
56 (4.5)
415 (33.6)
89 (7.2)

Table 2. Means and standard deviations of scores on living well measures for the whole
sample and by caregiver age, sex, relationship to person with dementia and dementia subtype
N (%) SwLS WHO-5 WHOQOL-BREF
Caregiver age
<65 369 (28.8) 22.7 (6.8) 53.1 (19.3) -0.15 (2.40)
65-69 208 (16.2) 23.5 (6.9) 56.8 (20.8) 0.16 (2.05)
70-74 267 (20.8) 23.7 (6.4) 56.2 (20.9) -0.01 (1.92)
75-79 223 (17.4) 24.6 (5.7) 55.6 (18.1) 0.16 (1.77)
80+ 216 (16.8) 25.0 (6.1) 56.0 (19.6) -0.05 (1.90)
Caregiver sex
Men 402 (31.3) 25.5 (5.9) 61.7 (19.0) 0.43 (2.04)
Women 881 (68.7) 23.0 (6.6) 52.4 (19.4) -0.19 (2.05)
Dementia subtype
AD 715 (55.3) 24.1 (6.4) 56.6 (19.6) 0.10 (2.03)
VaD 142 (11.1) 23.4 (6.3) 53.0 (19.3) -0.14 (2.07)
Mixed AD/VaD 263 (20.5) 24.4 (6.5) 55.2 (19.9) 0.05 (2.14)
FTD 45 0(3.5) 21.9 (7.2) 53.2 (21.8) -0.17 (2.18)
PDD 43 0(3.4) 21.5 (5.6) 50.1 (19.0) -0.40 (1.82)
DLB 43 0(3.4) 20.4 (7.9) 47.7 (20.9) -0.69 (2.12)
Other 32 0(2.5) 23.2 (6.4) 56.9 (18.3) -0.38 (2.16)
Relationship with person with dementia
Spouse/partner 1039 (81.0) 23.7 (6.4) 54.8 (19.9) -0.07 (1.97)
Other 244 (19.0) 24.1 (6.9) 57.1 (19.2) 0.32 (2.40)
Whole sample
Total 1283 (100) 23.8 (6.5)
Range 5 to
35
N=1240
55.3 (19.8)
Range 0 to
100
N= 1247
0.0 (2.1)
Range -7.9 to 4.7
N=1233
Note: abbreviations Alzheimer’s disease (AD), vascular dementia (VaD), frontotemporal
dementia (FTD), Parkinson’s disease dementia (PDD), dementia with Lewy bodies (DLB),
Satisfaction with Life Scale (SwLS), World Health Organization-Five Well-Being Index
(WHO-5)

Table 3. Variables included in the latent factors for each domain in the structural equation
model
Latent Variable
Capitals, assets and
resources (CAR)
Frequency of social contact [O], Social resources[C], Civic
participation[B]
Social location (SL) Social comparison[O], Perceived social status[O], Perceived
community status[O]
Psychological
characteristics and health
(PSY)
Neuroticism[C], Optimism[C], Loneliness[O],
Depression[B], Subjective age[O], Self-esteem[O]
Physical fitness and health
(PHY)
Smoking[O], Eyesight[O], Self-rated health[O]
Managing everyday life
with dementia (MEL)
Distress at neuropsychiatric symptoms of the person with
dementia[O]
Relationship with person
with dementia (CR)
Current relationship quality[O]
Experiencing caregiving
(EC)
Social restriction[O], Role captivity[O], Stress[O]
[B]: binary variable; [O]: ordinal variable; [C]: continuous variable

Figure 1. Associations between the seven domains and caregivers’ QoL, well-being and
satisfaction with life (n = 1283; adjusted for age, sex, relationship with person with dementia,
and dementia subtype)
Note: Satisfaction with Life Scale (SwLS), World Health Organization-Five Well-Being Index
(WHO-5); World Health Organization QoL-BREF (WHOQOL-BREF)
Psychological
characteristics and health
WHOQOL-BREF
SwLS
WHO-5 Living well
2.53
1.34
3.42 0.68
1.48
1 (fixed)
0.40
Physical fitness
and health
Experiencing
caregiving
Capitals, assets
and resources 0.06
0.28
Social location
-0.22
Managing
everyday life
with dementia
Current
relationship

A comprehensive model of factors associated with quality of life, satisfaction with life and well-
being for family carers of people living with mild-to-moderate dementia: findings from the
IDEAL study
Supplementary information
Analytical methods
The analysis was based on version 2.0 of the IDEAL dataset.
The analysis first investigated the relationships between individual measures and living well outcomes
using linear regression modelling and adjusting for age, sex, dementia subtypes and type of caregiving
relationship. This was used to quantify the strength and direction of individual associations. Within
each of the seven domains reflecting carers’ perceptions of their personal resources and experiences
(Supplementary Table 1), all variables were fitted in one multivariate regression model adjusting for
age, sex, subtypes and type of carers. Based on the adjusted results, three selection criteria were
applied to identify the variables most clearly related to life satisfaction (Satisfaction with Life Scale;
SwLS), wellbeing (World Health Organization-Five Well-Being Index; WHO-5) and quality of life
(World Health Organization Quality of Life-BREF; WHOQOL-BREF) and to simplify the model as
much as possible:
(a) Statistical significance: Wald test was used to examine whether the associations between living
well outcomes and a specific measurement achieved statistical significance.
(b) Meaningful difference: The effect sizes were considered to be meaningful when unstandardised
regression coefficients achieved SwLS>1.5 or WHO-5>5.0. Since there is no cut-off for the
WHOQOL-BREF factor score, this criterion only applied to the other two living well measures.
These cut-offs were determined to address the need for clinical relevance and based on the
literature.
(c) Binary/ordinal variables: If there was a dose-response relationship, the measure was used as an
ordinal variable. Categorical variables were regrouped into binary variables if appropriate.
After the selection process using multivariate modelling, structural equation modelling (SEM) was
employed to generate a latent factor for the selected variables within each domain and build a
structural model examining the associations between individual latent factors and the living well
latent with SwLS fixed at 1. The variances of individual latent factors were fixed at 1. Two domains
had only one variable each: for Managing everyday life with dementia this was the Neuropsychiatric
Inventory Questionnaire distress scale and for Relationship it was the Positive Affect Index assessing
current relationship quality. The results of SEM for the other five domains are reported in

Supplementary Table 2. A full model was fitted to include the five latent factors and two individual
variables, and was adjusted for age, sex, dementia subtypes and type of caregiving relationship. To
account for correlations between latent factors and stabilise estimates in the full model, loneliness was
found to also be important in the experiencing caregiving domain. To enable the model to reflect a
positive perspective on ‘living well’ the scales of the three living well measures were reversed. The
results of the full model are reported in Supplementary Table 3. Multiple imputation was used to
address missing data in selected variables and living well outcomes. The percentage of missing data
was between 7% and 20% across all domains. Age, sex, dementia subtypes and type of caregiving
relationship were also included in the imputation model. Since imputation of ten datasets is usually
sufficient to address potential variability of coefficient estimates,1 ten imputed datasets were
generated and combined using Rubin’s rule.2 All analyses were conducted using Stata 14.2.
Supplementary Table 1. Variables under each domain considered for inclusion in the structural
equation model
Variables Scale/source and reference
SOCIAL CAPITALS, ASSETS AND RESOURCES
Frequency of social contact Office for National Statistics Social Capital Scale3
Social network Lubben Social Network Scale4
Social resources Resource Generator-UK5
Social participation Office for National Statistics Social Capital Scale3
Civic participation Office for National Statistics Social Capital Scale3
Neighbourhood trust Office for National Statistics Social Capital Scale3
Neighbourhood willingness to help Office for National Statistics Social Capital Scale3
Education Highest level of education achieved
Cultural activity Questions from Cultural Capital and Social Exclusion
Survey6
SOCIAL LOCATION
Socio-economic status Socio-economic status based on occupation7
Social comparison Single item

Perceived status in society MacArthur Scale of Subjective Social Status (social
ladder)8
Perceived status in community MacArthur Scale of Subjective Social Status (community
ladder)8
PSYCHOLOGICAL CHARACTERISTICS AND HEALTH
Personality Mini-IPIP9
Religion Single item10
Spirituality Single item
Optimism Life Orientation Test-Revised11
Self-esteem Rosenberg Self-Esteem Scale12; single item13
Self-efficacy Generalized Self-Efficacy Scale14
Loneliness De Jong Gierveld Loneliness Scale15; single item
Depression Center for Epidemiologic Studies Depression Scale-
Revised16
Subjective age Single item
Life events Modified 10-item Social Readjustment Rating Scale17
PHYSICAL FITNESS AND HEALTH
Physical activity General Practice Physical Activity Questionnaire18
Falls Number of falls in past year19
Eyesight Single item19
Hearing Single item19
Alcohol consumption Currently does/does not consume alcohol
Smoking Current smoker/former smoker/never smoked
Self-rated health Single item20
Health conditions Charlson Co-morbidity Index21, 22
MANGING EVERYDAY LIFE WITH DEMENTIA
Hours of care Single item
Distress at neuropsychiatric
symptoms
Neuropsychiatric Inventory Questionnaire23
RELATIONSHIP WITH PERSON WITH DEMENTIA
Current relationship quality Positive Affect Index24
Past relationship quality Positive Affect Index24
EXPERIENCING CAREGIVING

Positive aspects of caregiving Positive aspects of caregiving25
Role captivity Role captivity26
Caregiving competence Caregiving competence27
Management of situation – firm Management of situation26
Management of situation – things Management of situation26
Management of situation – busy Management of situation26
Management of situation – learn Management of situation26
Management of meaning –
experiences
Management of meaning26
Management of meaning –
comparisons
Management of meaning26
Management of meaning – larger
sense
Management of meaning26
Social restriction Modified Social Restriction Scale28
Stress Relative Stress Scale29
Coping Single item30

Supplementary Table 2. Results of structural equation modelling for the five latent factors
(a) Social capitals, assets and resources (CAR)
Model 1 Model 2
Measurement: living well
SwLS 1 1
WHO-5 3.32 (3.07, 3.57) 3.32 (3.07, 3.58)
WHOQOL-BREF 0.41 (0.38, 0.44) 0.39 (0.36, 0.42)
Measurement: Capitals, assets and resources
Frequency of social contact
Ordinal variable 0.53 (0.42 0.65) 0.66 (0.56, 0.76)
Civic participation
High vs low (ref.) 0.06 (0.02, 0.09) 0.05 (0.01, 0.09)
Social resources
Continuous variable -3.50 (-4.18, -2.81) -2.84 (-3.34, -2.34)
Structural
CAR -> Living well 1.68 (1.24, 2.12) 2.16 (1.65, 2.67)
Model 1: unadjusted; Model 2: adjusted for age, sex, subtypes and type of carers
(b) Social location (SLC)
Model 1 Model 2
Measurement: living well
SwLS 1 1
WHO-5 3.33 (3.09, 3.57) 3.34 (3.10, 3.58)
WHOQOL-BREF 0.41 (0.38, 0.44) 0.40 (0.37, 0.43)
Measurement: Social locations
Social comparison
Ordinal variable 0.40 (0.31, 0.48) 0.43 (0.29, 0.57)
Societal ladder
Ordinal variable 0.64 (0.58, 0.70) 0.63 (0.54, 0.72)
Community ladder
Ordinal variable 0.54 (0.49, 0.59) 0.53 (0.46, 0.60)
Structural
SLC -> Living well 2.19 (1.71, 2.68) 2.24 (1.55, 2.93)
Model 1: unadjusted; Model 2: adjusted for age, sex, subtypes and type of carers

(c) Psychological characteristics & health (PSY)
Model 1 Model 2
Measurement: living well
SwLS 1 1
WHO-5 3.32 (3.08, 3.56) 3.33 (3.09, 3.57)
WHOQOL-BREF 0.39 (0.36, 0.42) 0.39 (0.36, 0.42)
Measurement: Psychological characteristics & health
Personality- Neuroticism
Continuous variable 2.24 (2.06, 2.42) 2.25 (2.08, 2.44)
Optimism
Continuous variable -2.45 (-2.67, -2.22) -2.43 (-2.66, -2.20)
Depression
Yes vs No (ref.) 0.19 (0.17, 0.22) 0.19 (0.17, 0.22)
Subjective age
Ordinal variable -0.27 (-0.31, -0.23) -0.27 (-0.31, -0.23)
Self-esteem (Rosenberg)
Ordinal variable -0.73 (-0.78, -0.69) -0.72 (-0.78, -0.68)
Loneliness
Ordinal variable 0.37 (0.33, 0.40) 0.36 (0.32, 0.40)
Structural
PSY -> Living well -4.41 (-4.75, -4.07) -4.45 (-4.80, -4.10)
Model 1: unadjusted; Model 2: adjusted for age, sex, subtypes and type of carers

(d) Physical fitness & health (PHY)
Model 1 Model 2
Measurement: living well
SwLS 1 1
WHO-5 3.34 (3.11, 3.58) 3.37 (3.13, 3.60)
WHOQOL-BREF 0.47 (0.43, 0.51) 0.45 (0.41, 0.48)
Measurement: Physical fitness & health
Eyesight
Ordinal variable 0.38 (0.33, 0.44) 0.39 (0.33, 0.44)
Self-rated health
Ordinal variable 0.71 (0.64, 0.78) 0.70 (0.63, 0.76)
Smoking
Ordinal variable 0.09 (0.05, 0.13) 0.09 (0.05, 0.13)
Structural
PHY -> Living well -3.07 (-3.45, -2.69) -3.19 (-3.58, -2.81)
Model 1: unadjusted; Model 2: adjusted for age, sex, subtypes and type of carers
(e) Experiencing caregiving (EC)
Model 1 Model 2
Measurement: living well
SwLS 1 1
WHO-5 3.28 (3.03, 3.53) 3.28 (3.03, 3.53)
WHOQOL-BREF 0.37 (0.35, 0.40) 0.37 (0.34, 0.40)
Measurement: Experiencing caregiving
Stress
Ordinal variable 0.76 (0.72, 0.79) 0.75 (0.71, 0.78)
Role captivity
Ordinal variable 0.54 (0.50, 0.58) 0.55 (0.51, 0.59)
Social restriction
Ordinal variable (ref.) 0.27 (0.22, 0.32) 0.28 (0.23, 0.33)
Structural
EC -> Living well -3.42 (-3.77, -3.06) -3.39 (-3.75, -3.03)
Model 1: unadjusted; Model 2: adjusted for age, sex, subtypes and type of carers

Supplementary Table 3. Results of structural equation modelling including all five latent factors,
neuropsychiatric inventory distress scale (NPI) and current relationship quality (CR)
Unadjusted Adjusted
Measurement model (LW)
SwLS 1 (fixed) 1 (fixed)
WHO-5 3.43 (3.19, 3.66) 3.42 (3.19, 3.66)
WHOQOL-BREF 0.40 (0.38, 0.43) 0.40 (0.38, 0.43)
Structural association
PSY 2.54 (2.15, 2.93) 2.53 (2.08, 2.97)
PHY 1.37 (1.06, 1.68) 1.48 (1.04, 1.91)
EC 1.32 (0.97, 1.66) 1.34 (0.99, 1.70)
CAR 0.58 (0.34, 0.83) 0.68 (0.35, 1.00)
SLC 0.08 (-0.17, 0.34) 0.28 (-0.33, 0.89)
NPI 0.08 (-0.13, 0.28) 0.06 (-0.15, 0.28)
CR -0.21 (-0.40, -0.03) -0.22 (-0.41, -0.03)
Correlation/Covariance
(PSY, PHY) 0.54 (0.45, 0.62) 0.54 (0.46, 0.62)
(PSY, EC) 0.55 (0.50, 0.61) 0.56 (0.50, 0.61)
(PSY, CAR) 0.27 (0.18, 0.36) 0.26 (0.17, 0.35)
(PSY, SLC) -0.48 (-0.57, -0.38) -0.59 (-0.84, -0.34)
(PSY, NPI) 0.36 (0.29, 0.43) 0.36 (0.29, 0.43)
(PSY, CR) -0.36 (-0.43, -0.30) -0.36 (-0.43, -0.30)
(PHY, EC) 0.26 (0.17, 0.34) 0.26 (0.18, 0.34)
(PHY, CAR) 0.28 (0.18, 0.38) 0.28 (0.18, 0.39)
(PHY, SLC) -0.42 (-0.52, -0.31) -0.53 (-0.77, -0.28)
(PHY, NPI) 0.17 (0.09, 0.24) 0.17 (0.09, 0.25)
(PHY, CR) -0.10 (-0.19, -0.02) -0.11 (-0.19, -0.02)
(EC, CAR) 0.07 (-0.03, 0.18) 0.05 (-0.05, 0.16)
(EC, SLC) -0.20 (-0.30, -0.11) -0.31 (-0.57, -0.05)
(EC, NPI) 0.64 (0.58, 0.69) 0.64 (0.58, 0.69)
(EC, CR) -0.56 (-0.62, -0.50) -0.56 (-0.62, -0.50)
(CAR, SLC) -0.35 (-0.45, -0.26) -0.33 (-0.46, -0.20)
(CAR, NPI) -0.04 (-0.13, 0.05) -0.05 (-0.13, 0.04)
(CAR, CR) -0.02 (-0.10, 0.07) 0.00 (-0.09, 0.08)
(SLC, NPI) -0.15 (-0.23, -0.06) -0.23 (-0.43, -0.03)
(SLC, CR) 0.17 (0.09, 0.24) 0.22 (0.09, 0.35)
(NPI, CR) -0.40 (-0.46, -0.34) -0.40 (-0.46, -0.34)
Adjusted for age, sex, subtypes and type of carers

References
1. von Hippel PT. How many imputations do you need? A two-stage calculation using a
quadratic rule. Sociological Methods & Research. 2018.
2. Rubin DB. Multiple imputation after 18+ years. Journal of the American Statistical
Association. 1996;91:473-489.
3. Office for National Statistics. Harmonised concepts and questions for social data
sources, secondary standards. Social capital. Titchfield, UK: Office for National
Statistics; 2008.
4. Lubben J, Blozik E, Gillmann G, et al. Performance of an abbreviated version of the
Lubben Social Network Scale among three European community-dwelling older adult
populations. Gerontologist. 2006;46:503-513.
5. Webber MP, Huxley PJ. Measuring access to social capital: the validity and reliability
of the Resource Generator-UK and its association with common mental disorder. Soc
Sci Med. 2007;65:481-492.
6. Thomson K. Cultural capital and social exclusion survey: technical report. London:
National Centre for Social Research; 2004.
7. Office for National Statistics. Standard Occupational Classification 2010. Volume 3.
The National Statistics Socio-economic Classification: (Rebased on the SOC2010)
User Manual. Basingstoke: Palgrave Macmillan; 2010.

8. Adler NE, Epel ES, Castellazzo G, et al. Relationship of subjective and objective
social status with psychological and physiological functioning: preliminary data in
healthy white women. Health Psychol. 2000;19:586-592.
9. Donnellan MB, Oswald FL, Baird BM, et al. The Mini-IPIP scales: tiny-yet-effective
measures of the Big Five factors of personality. Psychol Assess. 2006;18:192-203.
10. Loewenthal KM, MacLeod AK, Cinnirella M. Are women more religious than men?
Gender differences in religious activity among different religious groups in the UK.
Pers Individ Dif. 2002;32:133-139.
11. Scheier MF, Carver CS, Bridges MW. Distinguishing optimism from neuroticism
(and trait anxiety, self-mastery, and self-esteem): a reevaluation of the Life
Orientation Test. J Pers Soc Psychol. 1994;67:1063-1078.
12. Rosenberg M. Society and the adolescent self-image. Princeton, NJ: Princeton
University Press; 1965.
13. Robins RW, Hendin HM, Trzesniewski KH. Measuring global self-esteem: construct
validation of a single-item measure and the Rosenberg self-esteem scale. Pers Soc
Psychol Bull. 2001;27:151-161.
14. Schwarzer R, Jerusalem M. Generalized Self-Efficacy Scale. In: Weinman J, Wright
S, Johnston M, editors. Measures in health psychology: a user’s portfolio Causal and
control beliefs. Windsor, UK: NFER-NELSON; 1995. p. 35-37.
15. De Jong Gierveld J, Tilburg TV. A 6-item scale for overall, emotional, and social
loneliness confirmatory tests on survey data. Res Aging. 2006;28:582-598.
16. Eaton WW, Smith C, Ybarra M, et al. Center for Epidemiologic Studies Depression
Scale: review and revision (CESD and CESD-R). In: Maruish ME, editor. The Use of

Psychological Testing for Treatment Planning and Outcomes Assessment. 3rd ed.
Mahwah, NJ: Lawrence Erlbaum; 2004. p. 363-377.
17. Holmes TH, Rahe RH. The Social Readjustment Rating Scale. J Psychosom Res.
1967;11:213-218.
18. National Health Service. The General Practice Physical Activity Questionnaire
(GPPAQ): a screening tool to assess adult physical activity levels, within primary
care. London: Department of Health; 2009.
19. Marmot M, Oldfield Z, Clemens S, et al. English Longitudinal Study of Ageing:
Wave 2 2004-2005. In: Service UD, editor. 27th ed2017.
20. Bowling A. Just one question: if one question works, why ask several? J Epidemiol
Community Health. 2005;59:342-345.
21. Charlson ME, Charlson RE, Peterson JC, et al. The Charlson comorbidity index is
adapted to predict costs of chronic disease in primary care patients. J Clin Epidemiol.
2008;61:1234-1240.
22. Charlson ME, Pompei P, Ales KL, et al. A new method of classifying prognostic
comorbidity in longitudinal studies: development and validation. J Chronic Dis.
1987;40:373-383.
23. Kaufer DI, Cummings JL, Ketchel P, et al. Validation of the NPI-Q, a brief clinical
form of the Neuropsychiatric Inventory. J Neuropsychiatry Clin Neurosci.
2000;12:233-239.
24. Bengtson VL, Schrader SS. Parent-child relations. In: Mangon DJ, Peterson WA,
editors. Research instruments in social gerontology: Social roles and social
participation. Minnesota: University of Minnesota Press; 1982. p. 115-185.
25. Tarlow BJ, Wisniewski SR, Belle SH, et al. Positive Aspects of Caregiving
contributions of the REACH project to the development of new measures for
Alzheimer’s caregiving. Res Aging. 2004;26:429-453.
26. Pearlin LI, Mullan JT, Semple SJ, et al. Caregiving and the stress process: an
overview of concepts and their measures. Gerontologist. 1990;30:583-594.
27. Robertson SM, Zarit SH, Duncan LG, et al. Family caregivers’ patterns of positive
and negative affect. Fam Relat. 2007;56:12-23.
28. Balducci C, Mnich E, McKee KJ, et al. Negative impact and positive value in
caregiving: validation of the COPE index in a six-country sample of carers.
Gerontologist. 2008;48:276-286.
29. Greene JG, Smith R, Gardiner M, et al. Measuring behavioural disturbance of elderly
demented patients in the community and its effects on relatives: a factor analytic
study. Age Ageing. 1982;11:121-126.
30. McKee KJ, Philp I, Lamura G, et al. The COPE index--a first stage assessment of
negative impact, positive value and quality of support of caregiving in informal carers
of older people. Aging Ment Health. 2003;7:39-52.