a comprehensive study of manganese deposition...
TRANSCRIPT

A2812 Journal of The Electrochemical Society, 164 (12) A2812-A2822 (2017)0013-4651/2017/164(12)/A2812/11/$37.00 © The Electrochemical Society
A Comprehensive Study of Manganese Deposition and SideReactions in Li-Ion Battery Electrodes
Yoon Koo Lee,a Jonghyun Park,∗,b and Wei Lu∗,z
Department of Mechanical Engineering, University of Michigan, Ann Arbor, Michigan 48109, USA
A thorough investigation of both manganese (Mn) deposition onto graphite and its side reactions was conducted based on com-plementary techniques including CV, EIS, GCPL, ICP-OES, SEM and EDS. Each measurement revealed a specific aspect of thedegradation phenomena, which taken together all pointed in a common direction. This study focused on 1) deposition mechanismsand effects of manganese ions on the SEI layer; 2) the effects of manganese deposition on electrochemical performance; and 3) directobservation of decomposed layers induced by manganese deposition. It was confirmed that adding Mn(PF6)2 salt in the electrolyteresults in severe capacity decrease and impedance rise. It is found that manganese ions in the electrolyte participate to generateMn-containing SEI layers when depositing onto the graphite surface accompanied by additional side reactions. Interestingly, beforemanganese ions deposit onto the graphite electrode, they enhance cell capacity due to additional oxidation reactions. It is foundthat the reaction of manganese ions changes with the voltage conditions during charge or discharge and the lithiation status of thegraphite electrode.© 2017 The Electrochemical Society. [DOI: 10.1149/2.1851712jes] All rights reserved.
Manuscript submitted June 6, 2017; revised manuscript received September 5, 2017. Published September 16, 2017.
Spinel LiMn2O4 (LMO) is one of the most widely used com-mercialized cathode materials because of its low cost, environmentalfriendliness, high electronic/ionic conductivity, and excellent rate ca-pability and safety.1 However, this material exhibits significant capac-ity fade during cycling or storage at elevated temperatures. Severalmechanisms of capacity fade have been proposed,2 and manganesedissolution is one of the most important causes, especially at elevatedtemperatures.3,4 Manganese dissolution can be attributed to severalpossible mechanisms: 1) the disproportionation reaction of manganese(2Mn3+ → Mn4+ + Mn2+) becomes faster at high temperatures, andMn2+ ions are soluble in the electrolyte;5 2) manganese dissolutionaccelerates at high voltage due to acids from the oxidation of the sol-vent molecules;6 and 3) the solubility of manganese ions increasesdue to phase transition at high or low voltage regions during cycling.7
Manganese dissolution leads to loss of active material, structural in-stability, and rise of ohmic resistance. All these are directly related tocapacity fade of the LMO cathode material.
Moreover, dissolved manganese ions are deposited onto thegraphite anode and can deplete the lithium in the anode out.8 Con-sequently, the overall capacity is decreased. Several studies, how-ever, showed that lithium deintercalation due to manganese deposi-tion could not completely explain the capacity decrease. There mustbe accompanying side reactions related to manganese deposition—this is critically responsible for the capacity decrease of the graphiteelectrode.9–11 For instance, electrochemical impedance spectroscopy(EIS)12 and cyclic voltammetry (CV)11,12 were applied to observe sidereactions originating from manganese deposition. The accumulationof manganese on the electrode surface was confirmed by differentmeasurement techniques such as X-ray photoelectron spectroscopy(XPS),10,13 X-ray absorption spectroscopy (XAS),14,15, secondary ionmass spectrometry (SIMS),16,17 inductively coupled plasma – opti-cal emission spectroscopy (ICP-OES),10 electron probe microanalysis(EPM),10 scanning electron microscopy (SEM)18 and energy disper-sive spectroscopy (EDS).18 These results were measured either bydissolving manganese ions from the cathode material or by addingsalt-containing Mn2+ ions in the electrolyte. However, Shilina et al.recently argued that Mn3+ not Mn2+ is the dominant species dis-solved from the LiMn2O4 material while Mn2+ is predominant for theLiNi0.5Mn1.5O4 material.19 This result is contradicting to the previousknowledge that Mn2+ ions are the only soluble species that dissolve
∗Electrochemical Society Member.aPresent Address: Battery R&D, LG Chem Gwacheon R&D Center, Gyeonggi-do13818, Korea.
bPresent Address: Department of Mechanical and Aerospace Engineering, MissouriUniversity of Science and Technology, Rolla, Missouri 65409, USA.
zE-mail: [email protected]
from the LiMn2O4 cathode material. While this aspect needs to beinvestigated further, it was quite clear that additional manganese wasobserved with decomposed electrolyte products in the SEI layers ofthe graphite surface under various experimental conditions.
There are several studies focused on manganese contaminationof graphite materials. The catalytic effect of deposited products to-ward solvent reduction was proposed as an additional capacity fadephenomenon.11,20 Several XPS measurements were conducted to en-lighten the mechanisms of manganese deposition by elucidating thechemical state of the manganese in the SEI layer of the graphite. Theoxidation state of manganese present in the SEI layer of the graphitediffers from the literature in the case of Mn metal,12,21–23 Mn2+ orMn3+.4,14,20 Previous studies still suspected that the metallic state ofmanganese induces solvent reduction on the graphite surface.11,20 Thereasons for this speculation owe to the fact that 1) Mn metal was foundfrom XPS measurement;12,21 2) Mn2+ and Mn3+ (a form of MnCO3,MnO2 or Mn2O3) does not possess sufficient electronic conductiv-ity to induce additional electrolyte decomposition;4,20 and 3) capacityfade solely due to manganese reduction is too small and cannot ex-plain continuous capacity decrease.9,10 Accordingly, manganese ionsreduce to manganese metal and then re-oxidize with electrolyte toform manganese compounds which cause significant capacity fadedue to higher conductivity of the metallic surface. On the other hand,a recent study proposed that a metathesis reaction took place betweenMn2+ and some species from the SEI layer, rather than reductionreactions which led to the formation of metallic manganese.13,14 Itis suggested that the manganese oxidation state does not depend onchemical potential or reactions during the discharge/charge process.The researchers proposed an ion-exchange model for manganese de-position on the graphite anode. From the XPS measurement, the man-ganese compound formed on the anode surface was identified as MnF2
and MnCO3, which was not affected much by the reductive/oxidativeconditions.13 Currently, the oxidation state of manganese in the SEIlayer and the mechanisms of manganese deposition are still beingdebated in the literature.
Recently, researchers tried to investigate why different oxidationstates of manganese in the graphite were observed. One of the previousstudies conducted experiments to determine the effect of manganesecontamination on the SEI layer.20 They claimed a two-step processinvolving manganese deposition in which Mn2+ reduces to Mn0 in thefirst step, followed by the re-oxidation of Mn0 converting to MnCO3.This is a possible reason why different oxidation states of manganesecan be observed. Another study proposed that the oxidation state ofmanganese depends on the lithiation state of graphite.24 They claimedthat manganese is present as Mn2+ ions in the delithiate graphiteelectrode whereas it is in a reduced state in the lithiated graphiteelectrode. They also proposed that Mn2+ ions are transported as neutral
) unless CC License in place (see abstract). ecsdl.org/site/terms_use address. Redistribution subject to ECS terms of use (see 35.3.99.1Downloaded on 2017-12-01 to IP

Journal of The Electrochemical Society, 164 (12) A2812-A2822 (2017) A2813
complexes in which the cation is chelated by carboxylated groups.This complex is sufficiently bound to avoid cation exchange in theouter SEI layer so that it reaches the inner layer where Mn2+ ionscan be chemisorbed at the surface with the oxidation state of Mn0 orMn1. Vissers et al. also proposed a similar hypothesis that manganeseions deposit onto the outer surface of the inner inorganic SEI layer inwhich the manganese ions are reduced from an oxidation state of 2 toan oxidation state of 1 during lithiation of the graphite.17 Wandt et al.proposed that the oxidation state of manganese can be changed withdifferent environmental conditions.15 During operating conditions, theoxidation state of manganese is found to be 2+ both on lithiated andde-lithiated graphite, whereas manganese is found to be in metallicstate with ex-situ analysis. From these observations it can be inferredthat the oxidation state of manganese in graphite is sensitive to theconditions of samples and the lithiation state of the graphite electrode.
The objective of this study is to investigate the effect of man-ganese deposition and its side reactions on the graphite anode. Inorder to achieve a comprehensive understanding of the complicatedmechanisms of manganese deposition on graphite electrode, multiplecomplementary measurements were applied under various experimen-tal conditions. From the previous literature, we found that the oxida-tion state of manganese in graphite is sensitive to the conditions ofsamples and the lithiation state of the graphite electrode.15,20,24 There-fore, fresh, lithiated and de-lithiated graphite samples were preparedto differentiate the possible mechanisms of manganese deposition ongraphite samples of different conditions. Cyclic voltammetry and EISwere performed to differentiate the oxidation/reduction reactions andto identify the corresponding manganese contamination mechanismson SEI layers. The amount of deposited manganese, capacity andimpedance were quantitatively measured to elucidate the impact ofmanganese deposition on the graphite electrode. Finally, mechanismsof the formation of manganese compounds were proposed based onthe experiments.
Experimental
Since individual measurement techniques provide only limitedinformation about a certain phenomenon, we employed multiplecomplementary measurements in various experimental conditions toachieve a comprehensive understanding of manganese deposition.Several electrochemical measurement techniques, such as CV, EIS andcapacity measurement, were employed to investigate how manganeseions influence the graphite electrode in terms of cell performance andcapacity retention. Additional measurements such as ICP-OES, SEMand EDS were performed to strengthen the hypothesis made from theelectrochemical measurements. In this work we focused on three maintopics in order to investigate both manganese deposition and consecu-tive side reactions. These include 1) reaction mechanisms and effectsof manganese ions deposition on the SEI layer; 2) effects of man-ganese deposition on the electrochemical performance; and 3) directobservation of decomposed layers induced by manganese deposition.
First, interactions between manganese ions and the SEI layerswere investigated. In this work, fresh and formation-cycled graphiteelectrodes were both prepared to differentiate the impact of man-ganese ions on the graphite with and without SEI layers. Generally,the manganese ions are generated from the dissolution of the cathodematerials; thus, transport and deposition into the anode are expectedafter the formation of the SEI layer. However, an investigation of theimpact of manganese ions while forming the SEI layer would providea contrast to the reaction of manganese deposition after SEI layersare already formed. Also, the SEI layer itself is not a robust structure,especially at high temperatures. Consequently, the amount of man-ganese ions from the accelerated dissolution may have an impact onthe reformation of SEI layer due to its instability. By comparing theinteractions between fresh and formation-cycled graphite electrodewith manganese ions in the electrolyte, mechanisms and impact ofmanganese ions on the SEI layer will be better understood. To doso, cyclic voltammetry, galvanostatic cycling with potential limitation(GCPL) and EIS were applied. By applying different measurement
techniques to the graphite samples, different aspects of electrochemi-cal reaction can be identified. Second, electrochemical measurementsand ICP-OES measurements were performed to quantify the effectof manganese deposition. After cell capacities and impedances wereidentified, ICP-OES measurements were carried out to measure theexact amount of manganese deposited on the graphite. By compar-ing the amount of deposited manganese and changes in capacity andimpedance, the connections between manganese deposition and theirinfluence on cell performance were investigated. In addition, sepa-rate experiments were performed to measure the amount of lithiumextracted from the graphite anode due to manganese ions. These ex-periments can provide information parallel to previous experimentswith regard to the Mn-Li exchange mechanism.
Finally, in order to examine whether manganese actually inducesside reactions and forms decomposed layers, manganese metal surfacewas observed. Previous studies have shown that manganese depositedonto the graphite surface was detected by various techniques such asXPS,12 SIMS,16 ICP-OES and EPM.10 In turn, it was proposed that thedecomposed layer would be formed due to drastic decomposition ofthe electrolyte on the manganese metal surface.12 In this work, in orderto clearly observe the decomposed layers formed on the metallic stateof the manganese surface, the graphite electrode was replaced witha manganese metal. Both fresh and cycled manganese metal surfaceswere directly observed to see whether manganese is responsible forforming decomposed layers using the scanning electron microscope(SEM). Elemental analysis was also conducted on these samples usingenergy dispersive spectroscopy (EDS) to confirm that metallic statesof manganese form an additional passivation layer with electrolytedecomposition products.
Sample preparation.—Fresh graphite negative electrodes weremade from graphite powder (TIMREX SLP30, TIMCAL) and PVDF(Kureha KF 7208) binder in a weight ratio of 90:10. They were mixedtogether in a Speedo Mixer (FlackTek Inc.) for 15 minutes. The mixedslurry was coated on a thin copper foil and dried in vacuum at 100◦Cfor 24 hours, then transferred into an argon-filled glove box (MBraun)with less than 0.1 ppm of oxygen and moisture in order to avoid ex-posure to ambient air. Next, graphite electrodes were assembled tosealed 2032 type coin cells (MTI) with a lithium foil (Alfa Aesar)counter and reference electrode with a separator (Celgard 2320). Wedid not confirm the water content in the electrolyte, but followed care-ful preparation procedures to avoid exposure to moisture. In order toreduce any possible impact of manganese ions on the lithium metal,an excessive amount of lithium foil was used. Moreover, dissolvedmanganese ions were mostly on the graphite anode. Vissers et al.17 in-vestigated the manganese exchange reaction and found with ICP-MSthat the SEI layer will sequester the manganese ions from the elec-trolyte. Their results revealed that each of the primary constituents ofthe inner iorganic SEI layer was able to sequester manganese ions fromthe electrolyte. In the case of Li2CO3-containing electrolyte which isa known constituent of the SEI layer, the concentration of manganesewas dropped by a factor of 1488 from 38.700 to 0.026 ug/g. Due tothe these reasons, we assume that the interaction between manganeseions and the lithium metal is negligible.
Formation cycling was performed by the first three cycles from 1.5V to 0.01 V at a rate of C/10 using a battery testing system (VMP3multi-channel potentiostat, Biologic). Next, lithiated and delithiatedgraphite was achieved by holding the voltage at 0.1 V and 1.0 V for3 hours, respectively. Finally, the cycled cell was disassembled in theglove box and reassembled with the electrolyte possessing differentconcentrations of manganese for further experiments.
According to the previous literature, the amount of manganese dis-solved from the cathode electrode has been measured under differentstorage and cycling conditions. The amount of manganese dissolvedis affected by the applied potential, charge/discharge conditions, op-erating temperature, carbon content, calcination temperature and sur-face area of the cathode particle, and so on.6,25–27 Depending on theoperating conditions, the amount of dissolved manganese can varyfrom 30 ppm6 to 1500 ppm26 after 50 cycles at room temperature
) unless CC License in place (see abstract). ecsdl.org/site/terms_use address. Redistribution subject to ECS terms of use (see 35.3.99.1Downloaded on 2017-12-01 to IP
A2814 Journal of The Electrochemical Society, 164 (12) A2812-A2822 (2017)
conditions. Jang et al. measured about 20∼60 ppm of manganese con-centration after 50 cycles between 3.6 V and 4.3 V with differentialpulse polarography.6 They also measured the amount of manganesewith different applied potentials during storage conditions (up to 1800minutes), which measured up to 41 ppm at 4.2 V. However, Xia etal. measured 1540 ppm of manganese concentration after 50 cyclesbetween 3.5 V and 4.5 V at the room temperature and 7000 ppm ofmanganese at 50◦C.26 We carefully selected a range of manganeseconcentrations from 50 to 200 ppm in our study which is a reasonablerepresentative range of manganese concentrations according to mostliteratures. In order to investigate the direct impact of manganese ionson the graphite electrode, the desired concentrations of manganesewere dissolved in the electrolyte in advance. 50, 100, 150 and 200 ppmof Mn(PF6)2 were added into an electrolyte composed of 1M of LiPF6
salt (Sigma-Aldrich) in ethylene carbonate (EC, Sigma-Aldrich) anddimethyl carbonate (DMC, Sigma-Aldrich) of 1:1 solvent mixturesto achieve the target concentration of manganese in the electrolyte.The Mn(PF6)2 salt was synthesized by reacting silver hexafluorophos-phate (AgPF6, Sigma-Aldrich) with the manganese chloride (MnCl2,Sigma-Aldrich) in ethanol. The mixture was distilled to isolate thesynthesized Mn(PF6)2. The moisture in Mn(PF6)2 was removed byheating it in a vacuum oven overnight at 90◦C. The exact concentra-tion of manganese in the electrolyte was measured with ICP-OES.In order to confirm that there is no additional source of supply ofmanganese ions, the total amount of manganese was measured forthree samples after disassembly. The total amount of manganese afterdisassembly of the cell was very similar to the amount that was addedto the electrolyte.
Electrochemical measurements.—
1. Cyclic voltammetry was applied to the lithium foil/graphite com-posite electrode half-cell to measure redox currents and currentpeak changes immediately following the addition of differentconcentrations of manganese. CV was carried out at 0.5 mV/sbetween 0.1 V and 3.0 V. Interfacial currents and current peakswere measured.
2. Capacity was measured using graphite/lithium half-cells at C/10from 0.1 V to 0.9 V for 20 cycles. Additionally, some new cellswere cycled at C/100 from 2.0 V to 3.0 V, which is above thedeposition potential of Mn/Mn(II) (1.87 V vs. Li/Li+), in orderto prevent manganese deposition.
3. EIS measurements were performed to measure impedance changedue to different concentrations of manganese and different poten-tial of the graphite/electrolyte interface after the capacity wasmeasured. Each concentration of manganese was measured withEIS at different voltages (0.1, 0.3, 0.5, 0.7 and 0.9 V) and differentmanganese concentrations (0, 50, 100, 150 and 200 ppm) in theelectrolyte. Before conducting EIS measurements, the cells wererested in the open circuit voltage (OCV) condition for 2 hoursto achieve stabilized potentials. AC impedance spectra were ob-tained by applying sinusoidal waves with amplitude of 5 mV overfrequencies ranging from 100 kHz to 10 mHz.
ICP-OES measurements.—In order to determine the correlationbetween manganese deposition and capacity retention, the amount ofmanganese deposited on the graphite was measured after the capacityof the cells was measured. After disassembly from the coin cells, thecycled graphite electrodes were immersed in 25% nitric acid in waterfor 24 hours to extract the manganese. Next, ICP-OES measurementswere carried out on the dissolved manganese from the graphite using aPerkin-Elmer Optima 2000 DV. Also, the amount of lithium that wasdeintercalated from the lithiated graphite was measured as a functionof manganese concentration in the electrolyte. The graphite negativeelectrode was discharged with lithium metal (a reference electrode)and held at 0.05 V (x is about 0.9 in LixC6) for 3 hours before storageto achieve lithiated graphite electrodes. Samples were stored in 1 mLof EC: DMC (1:1 by volume) with 0, 50 and 100 ppm of manganeseions at room temperature for 7 and 14 days.
SEM and EDS measurements.—The coin cells were first madewith Li metal as a negative electrode and manganese metal as a pos-itive electrode with 1M of LiPF6 in EC: DMC (1:1 by volume) elec-trolyte and then cycled using the potentiodynamic cycling method.The cycled manganese metal surface was cleaned with DMC andscanned using SEM. SEM characterizations were carried out us-ing a FEI Nova 200 NanoLab operating at 20 kV with a Schottkyfield emitter. Next, an elemental analysis was performed on the man-ganese metal surface by EDS. EDS analyses were performed usinga FEI Nova 200 NanoLab attached with an energy dispersive X-rayspectrometer.
Results and Discussion
Cyclic voltammetry measurements of fresh graphite electrodeswith different concentrations of manganese ions.—Figure 1 showsthe results of cyclic voltammetry for the fresh graphite electrode with0, 100 and 200 ppm of manganese ions in the graphite/lithium half-cell during the 1st cycle, the 10th cycle, and the 20th cycle. In thetwo-electrode cell lithium metal was used as both the counter andthe reference electrode. While a three-electrode cell would give moreprecise potential relative to a reference electrode, it is difficult toachieve in a coin cell setup so two electrode cells have been widelyused. We expect the difference between two and three electrode cellsto be small since we used an excessive amount of lithium foil andthe current in our experiment was small. In addition, our aim was toidentify well-known current peaks instead of focusing on the precisepotential of the electrode relative to a reference, so two-electrode cellswere sufficient for this purpose.
First, in Figure 1 we can clearly observe changes in the peaksof anodic and cathodic currents depending on the concentration ofmanganese ions. Region A can be interpreted as the electrolyte re-duction, SEI formation and manganese deposition peak, whereas Band C represent lithium intercalaction and deintercalation peak re-gions, respectively. Higher concentrations of manganese ions in theelectrolyte caused increases in the cathodic current at potentials be-tween 2.0 V and 0.5 V and decreases in the anodic current peaklocated between 0.3 V and 0.6 V as well as in the cathodic currentpeak located near 0.1 V to 0.3 V. Manganese deposition occurred dur-ing the reductive current scan below the standard redox potential ofMn/Mn(II), which is about 1.87 V (vs. Li/Li+). After the manganesewas deposited, subsequent electrolyte reduction reactions followedin the potential region of 0.8 V to 0.6 V. In the potential range of0.5 V to 0.2 V, co-intercalation of the solvent and subsequent re-duction of the electrolyte molecules occurred while forming the SEIlayer.28 During SEI formation, electrolyte decomposition productssuch as (CH2OCO2Li)2, ROLi, and LiF were generated on the graphitesurface.29 However, due to the higher reactivity of manganese metalon the surface, the electrolyte reduction accelerated more violentlywith higher concentrations of manganese ions in the electrolyte. Dueto the additional electrolyte reduction and manganese deposition re-actions, decomposed layers might grow thicker and hinder lithiumions from the intercalation/deintercalation process. Consequently, theability for lithium to (de)intercalate into the graphite would decreaseconsiderably. It can be seen in Figure 1a that the cathodic current atpotentials between 0.2 V and 0.1 V and the anodic current at potentialsbetween 0.1 V and 0.4 V (where lithium intercalation/deintercalationreactions dominated) decreased significantly with higher concentra-tions of manganese ions.
Next, manganese ions in the electrolyte created additional reactionduring the initial cycling. Figure 1a shows that with manganese ionsin the electrolyte, the anodic current peak between 0.3 V and 0.6 Vdecreased while broadening, and shifted slightly to the higher potentialregion.
Finally, as the cycle number increased, the redox current relatedto side reactions such as electrolyte reduction and manganese depo-sition decreased, while the current related to lithium deintercalationincreased. We extracted relevant peaks of the CV curves in Figure1 and plotted them in Figure 2 as a function of the cycle number.
) unless CC License in place (see abstract). ecsdl.org/site/terms_use address. Redistribution subject to ECS terms of use (see 35.3.99.1Downloaded on 2017-12-01 to IP

Journal of The Electrochemical Society, 164 (12) A2812-A2822 (2017) A2815
(a) 0 0.5 1 1.5 2-0.06
-0.04
-0.02
0
0.02
0.04
0.06
0.08
Voltage(V)
Cu
rre
nt d
en
sity
(A/g
)
A
B
C
(b) 0 0.5 1 1.5 2-0.04
-0.02
0
0.02
0.04
0.06
0.08
Voltage(V)
Cu
rre
nt D
en
sity
(A/g
)
(c)0 0.5 1 1.5 2
-0.04
-0.02
0
0.02
0.04
0.06
0.08
Voltage(V)
Cu
rre
nt D
en
sity
(A/g
)
Figure 1. Cyclic voltammetry of fresh graphite electrode by adding differentconcentrations of manganese ions into the electrolyte in the graphite/lithiumcell. (a) 1st cycle, (b) 10th cycle, (c) 20th cycle. Cyclic voltammetry wascarried out at 0.5 mV/s between 0.1 V and 3.0 V.
Figure 2a shows that the reductive current peak at potentials between2.0 V and 0.5 V, which corresponds to manganese deposition and elec-trolyte reduction, decreased significantly after the first cycle. Figure 2bshows that the anodic current peak related to lithium deintercalation,which was located between 0.3 V and 0.6 V, increased with the cyclenumber. This increase of the anodic current peak can be attributed tothe slow wetting process of the active material30 and the subsequentprogressive change toward a stable SEI layer on graphite.31 By com-
(a) 0 5 10 15 200.005
0.01
0.015
0.02
0.025
0.03
Cycle number
)g/
A(ytisn
ed
ka
ept
nerr
uC
cid
oht
aC
0ppm100ppm200ppm
(b) 0 5 10 15 200.01
0.02
0.03
0.04
0.05
0.06
0.07
Cycle number
An
od
ic C
urr
en
t pe
ak
de
nsi
ty(A
/g)
0ppm100ppm200ppm
Figure 2. Change of current peaks with cycle number from freshgraphite/lithium cell added with different concentrations of manganese ions.Shown are (a) cathodic current peak at region A in Figure 1, and (b) anodiccurrent peak at region C in Figure 1. Cyclic voltammetry was carried out at0.5 mV/s between 0.1 V and 3.0 V.
paring the figures in Figure 1, we can also observe that the anodiccurrent peak became narrower with the cycle number.
Cyclic voltammetry measurements of formation-cycled graphiteelectrodes with different concentrations of manganese ions.—Figure3a shows the CV curve in the 1st cycle right after adding differentconcentrations of manganese ions into lithiated graphite/lithium cell.Since the formation-cycled graphite samples contained lithium ions inthe particles before the cell was reassembled, redox currents associatedwith the lithium deintercalation process were significantly larger thanthose in Figure 1. In the 1st cycle we can see that a higher concentrationof manganese ions resulted in an increase of the anodic current in thepeak region. Interestingly, this trend is opposite to that of fresh graphiteelectrodes, where a higher concentration of manganese ions resultedin a decrease of the anodic current in the peak region. This differencehighlighted the significance of the state of the electrodes, where theformation-cycled graphite electrodes in Figure 3a were lithiated tostart with.
Figure 3b shows the cyclic voltammetry curves at the 5th cycleafter adding different concentrations of manganese ions to formation-cycled lithiated graphite. Similar to the fresh graphite electrode, wefound that a higher concentration of manganese caused a decrease
) unless CC License in place (see abstract). ecsdl.org/site/terms_use address. Redistribution subject to ECS terms of use (see 35.3.99.1Downloaded on 2017-12-01 to IP
A2816 Journal of The Electrochemical Society, 164 (12) A2812-A2822 (2017)
(a) 0 0.5 1 1.5 2-0.6
-0.4
-0.2
0
0.2
0.4
0.6
0.8
1
1.2
Voltage(V)
Cu
rre
nt D
en
sity
(A/g
)
(b) 0 0.5 1 1.5 2-0.4
-0.3
-0.2
-0.1
0
0.1
0.2
0.3
Voltage(V)
Cu
rre
nt D
en
sity
(A/g
)
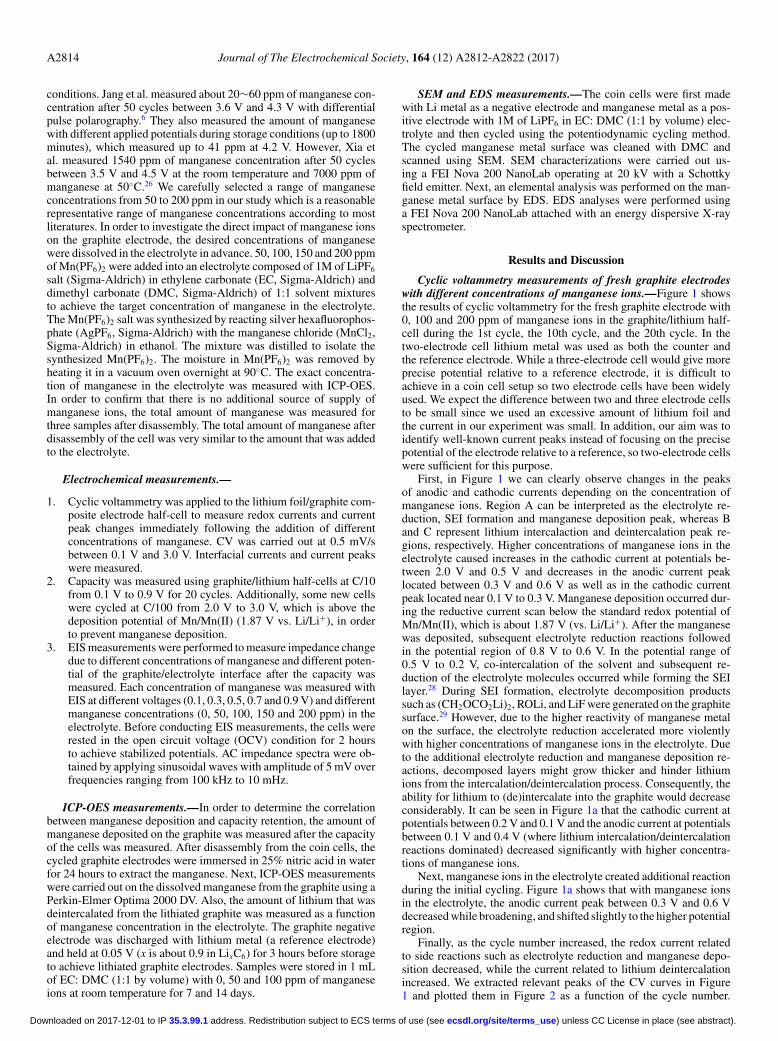
Figure 3. Cyclic voltammetry of formation-cycled graphite by adding dif-ferent concentrations of manganese ions into the electrolyte in the lithiatedgraphite/lithium cell. (a) 1st cycle, (b) 5th cycle. The process involves forma-tion cycling and voltage holding to get lithiated graphite, cell disassembly touse electrolyte added with different concentrations of manganese ions, and cellreassembly. Cyclic voltammetry was carried out at 0.5 mV/s between 0.1 Vand 3.0 V.
in reversible lithium intercalation/deintercalation currents. Both thecathodic and anodic current peaks with a higher concentration ofmanganese ions were smaller than those with a lower concentrationof manganese ions. Smaller interfacial currents can be interpretedas a decrease of the amount of lithium insertion/deinsertion into thegraphite, resulting in capacity fade. As a result, higher concentrationsof manganese ions in the cell cause a reduction of reversible interfacialcurrents.
We found that higher concentrations of manganese in the elec-trolyte led to higher anodic current peaks in the 1st cycle, but lowerpeaks in and after the 2nd cycle, as shown in Figure 4. This sug-gests that manganese ions contributed to an increase of the anodiccurrent peak before manganese deposition occurred. The current peakdecreased remarkably after the 1st cycle and stabilized in subsequentcycles. The higher anodic current associated with the higher concen-tration of manganese in the 1st cycle suggests that more irreversibleoxidative reaction occurred during the first CV cycle right after addingmanganese ions into the cell. We found that manganese ions have apositive effect on cell performance by increasing the redox current
1 2 3 40
0.2
0.4
0.6
0.8
1
1.2
1.4
Cycle number
Cu
rre
nt p
ea
k d
en
sity
(A/g
)
0ppm100ppm200ppm
Figure 4. Change of anodic current peak with cycle number from formation-cycled lithiated graphite/lithium cell added with different concentrations ofmanganese ions.
before the manganese ions deposit onto the graphite. However, thecathodic and anodic currents significantly decreased right after thereductive scan was finished.
Figure 5a shows the CV curves in the 1st cycle after adding man-ganese ions into the formation-cycled delithiated graphite/lithium cell.The anodic and cathodic currents decreased remarkably after reassem-bly of the cell, especially at higher concentrations of manganese ions.These results are in contrast to those in Figure 3a, which used lithiatedgraphite for the anode. A higher concentration of manganese causeda dramatic increase in the interfacial current in the lithiated graphite,whereas it caused a decrease in the delithiated graphite electrode.Our hypothesis of this difference is that manganese facilitated lithiumdeinterlacation in the lithiated graphite which had lots of initially in-tercalated lithium ions to work with during the first cycle. After thefirst cycle, the effect was dominated by manganese deposition whichreduced the interfacial current.
The CV curves in the 5th cycle with different concentrations ofmanganese ions in formation-cycled delithiated graphite are shownin Figure 5b. Comparing to Figure 5a, the peak of anodic currentincreased while the peak of cathodic current for lithium intercalationdecreased. Higher concentrations of manganese ions in the electrolytecaused a larger decrease in interfacial currents. It is expected thatmanganese ions deposited relatively fast onto the graphite surface be-cause of the higher standard redox potential of Mn/Mn(II) (1.87 V vs.Li/Li+) compared to the potential of lithium intercalation into graphite(< 0.3 V vs Li/Li+). Deposited manganese may react with othercomponents such as C and O originating from electrolyte reductionand form another electrolyte interface layer containing manganese.Manganese deposition on graphite not only forces cyclable lithiumto deintercalate from the graphite, but also induces electrolyte re-duction reactions, both of which result in significant capacity fade.The reduction of exchange current associated with lithium intercala-tion/deintercalation at higher concentrations of manganese ions alsonegatively impacts the power performance.
By comparing the CV results of fresh, lithiated and de-lithiatedgraphite electrodes, we can obtain several important observations.The major difference among these results can be found in the A andthe C regions of the CV curves. An increase of the cathodic cur-rent peak in region A with the manganese concentration was onlyobserved in fresh graphite electrodes. This region is mainly causedby electrolyte reduction and SEI formation, which are significantlyinfluenced by manganese ions. It is very likely that manganese ions
) unless CC License in place (see abstract). ecsdl.org/site/terms_use address. Redistribution subject to ECS terms of use (see 35.3.99.1Downloaded on 2017-12-01 to IP

Journal of The Electrochemical Society, 164 (12) A2812-A2822 (2017) A2817
(a) 0 0.5 1 1.5 2-0.08
-0.06
-0.04
-0.02
0
0.02
0.04
0.06
Voltage(V)
Cu
rre
nt D
en
sity
(A/g
)
(b) 0 0.5 1 1.5 2-0.06
-0.04
-0.02
0
0.02
0.04
0.06
Voltage(V)
Cu
rre
nt D
en
sity
(A/g
)
Figure 5. Cyclic voltammetry of formation-cycled graphite by adding differ-ent concentrations of manganese ions into the electrolyte in the delithiatedgraphite/lithium cell. (a) 1st cycle, (b) 5th cycle. The process involves forma-tion cycling and voltage holding to get delithiated graphite, cell disassemblyto use electrolyte added with different concentrations of manganese ions, andcell reassembly. Cyclic voltammetry was carried out at 0.5 mV/s between 0.1V and 3.0 V.
accelerate electrolyte reduction and SEI formation when SEI layersare forming. However, these cathodic peaks disappear after SEI lay-ers are formed, which suggests an ending of aggressive electrolytereduction following SEI formation. An increase of the anodic peakin region C with the manganese concentration was only observed inlithiated graphite electrodes during the first cycle. Delithiated graphiteelectrodes showed an opposite trend. A common observation is thatthe anodic current peak in region C decreased with the manganeseconcentration after the first cycle.
Capacity measurements of fresh graphite electrodes with differ-ent concentrations of manganese ions.—Figure 6 shows the chargeand discharge capacity of fresh graphite electrodes after adding dif-ferent concentrations of manganese into the cell.
In the 1st cycle, the charge capacity decreased significantly dueto SEI growth and irreversible electrochemical decomposition of theelectrolyte. This phenomenon is known as irreversible charge loss(ICL) originating from solvent reduction and SEI formation, which isone of the major characteristics of the SEI layer.29 However, higherconcentrations of manganese ions in the electrolyte caused significant
(a) 0 5 10 15 20 25180
200
220
240
260
280
300
320
340
Cycle number
Ave
rag
e c
ap
aci
ty(m
Ah
/g)
0ppm100ppm200ppm
(b) 0 5 10 15 20275
280
285
290
295
300
305
310
315
320
325
Cycle number
Ave
rag
e C
ap
aci
ty(m
Ah
/g)
0ppm100ppm200ppm
Figure 6. Change of (a) charge and (b) discharge capacity of fresh graphiteelectrode with cycle number after adding 0, 100 and 200 ppm of manganeseions in the electrolyte.
irreversible loss of charge capacity when forming SEI layer on thegraphite electrode. For example, the charge capacity of the cell de-creased by 37% with 200 ppm of manganese ions and by only 17%when no manganese ions was added, as shown in Figure 6a. It is highlylikely that manganese ions in the electrolyte were deposited earlier dueto the higher standard potential as compared to electrolyte reductionand SEI layer formation. Higher reactivity of deposited manganesecan induce additional electrolyte reduction and growth of decomposedlayers. The charge capacity became stable after the initial SEI layerswere formed.
The discharge capacity during the first few cycles does not decreaseas significantly as the charge capacity.32 Still, the discharge capacityof the graphite electrode decreased continuously during the 20 cycles,as shown in Figure 6b. It is obvious that higher concentrations ofmanganese ions caused greater capacity decrease. In the early stage,adding 200 ppm manganese ions in comparison to adding 100 ppmmanganese ions does not appear to cause an immediate conspicuousdifference on the capacity or the CV curve. However, this can affectlonger term continuous degradation by harming the passivation effectof the SEI layer. As can be seen in Figure 6b, the capacity differencebetween adding 100 ppm and 200 ppm is not significant in the earlystage, but increases to about 10% after 20 cycles. After 20 cycles, therewas about 15% of capacity decrease with 200 ppm of manganese ions
) unless CC License in place (see abstract). ecsdl.org/site/terms_use address. Redistribution subject to ECS terms of use (see 35.3.99.1Downloaded on 2017-12-01 to IP
A2818 Journal of The Electrochemical Society, 164 (12) A2812-A2822 (2017)
0 5 10 15 20 25 30 3560
80
100
120
140
160
180
200
220
240
260
Cycle number
dis
cha
rge
ca
pa
city
(mA
h/g
)
0ppm100ppm200ppm
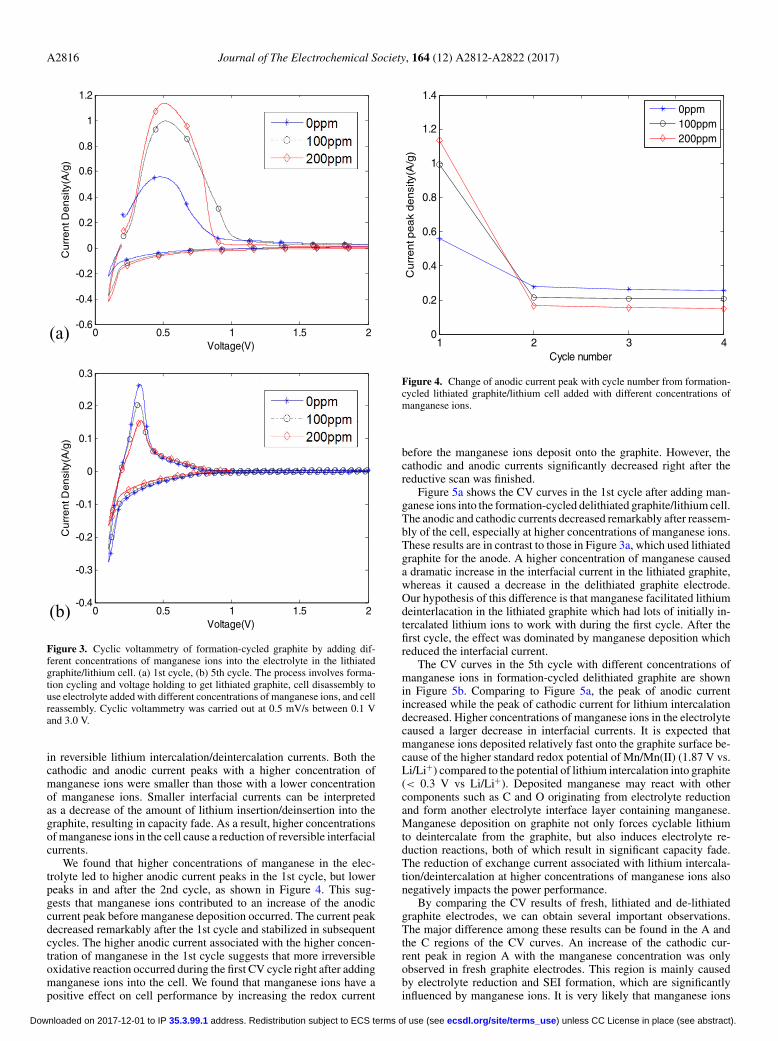
Figure 7. Change of discharge capacity of lithiated graphite electrode beforeand after adding 0, 100 and 200 ppm of manganese ions in the electrolyte.Cycled lithiated graphite electrode was disassembled and reassembled withelectrolyte of added manganese ions after the 3rd cycle. Different manganeseconcentrations take effect since the 4th cycle.
in the electrolyte. Presumably, deposited manganese with electrolytedecomposition products on the graphite surface hindered the lithia-tion/delithiation process during cycling, which affected the unceasingdecline of the discharge capacity of the cell. Moreover, the capacityof the cells kept decreasing as the cycle number increased, whichmeans that passivation of the SEI layer was not fully established onthe graphite surface. These results agreed with the previous study,20
which proposed that high electronic conductivity of the manganesemetal formed on the graphite surface might be the reason for this lackof passivation effect.
Capacity measurement formation-cycled graphite electrodeswith different concentrations of manganese ions.—Capacity changeof formation-cycled graphite electrode was measured before and afteradding different concentrations of manganese ions in the electrolyte,as shown in Figure 7. Because the cyclable lithium ions resided inthe lithiated graphite electrode, the capacity slightly increased duringthe 4th cycle when the cell was reassembled after the formation cy-cle. Consistent with the previous CV findings using lithiated graphite(which determined that the redox current increased due to oxidative re-action), capacity increased more when higher concentrations of man-ganese in the electrolyte were added to the cell. Increases of dischargecapacity were probably due to the additional electrons coming fromoxidative reaction right after the addition of manganese ions. How-ever, in subsequent cycles the rate of capacity decrease with higherconcentrations of manganese ions was significantly higher than thatof the lower manganese concentration. It seems that the manganeseions in the electrolyte increase capacities in the cell initially, whichpositively affect the cell during initial cycling before manganese depo-sition. However, manganese deposition and consequent side reactionseventually increase the rate of capacity decrease. For instance, morethan 50% of the capacity decreased after 20 cycles, when 200 ppm ofmanganese ions were added into the cell.
In order to support the claim that manganese ions improve capacityand cell performance before they deposit onto the graphite, additionalexperiments were performed. Cycled lithiated graphite was reassem-bled with and without manganese ions and cycled between 2.0 V to3.0 V with C/100 rate to avoid manganese from depositing and in-ducing side reactions on the graphite surface. Upon discharge of thelithiated graphite electrode, oxidative reaction should occur when thevoltage rises from 0.1 V to 3.0 V. However, manganese deposition and
0 5 10 150.75
0.8
0.85
0.9
0.95
1
Cycle number
Cap
acity
/initi
al C
apac
ity
0ppm200ppm
Figure 8. Discharge capacity of cycled lithiated graphite reassembled withand without manganese ions. The cells were cycled between 2.0 V to 3.0 Vwith C/100 rate to avoid manganese deposition and electrolyte reduction. Thecycled lithiated graphite electrode was reassembled after the 2nd cycle. It wasfound that manganese ions contribute to increasing discharge capacity if theydo not deposit on the graphite and provoke side reactions.
electrolyte reduction is avoided by limiting the potential window from3.0 V to 2.0 V of the cathodic current. C/100 charge and dischargerate was used in this experiment since the amount of lithium whichcan be inserted into the graphite is very limited. Figure 8 shows thedischarge capacity of graphite before and after adding 0 ppm and 200ppm of manganese ions into the electrolyte, respectively. It is obviousthat manganese ions contribute to increase discharge capacity if theydo not deposit on the graphite and provoke side reactions.
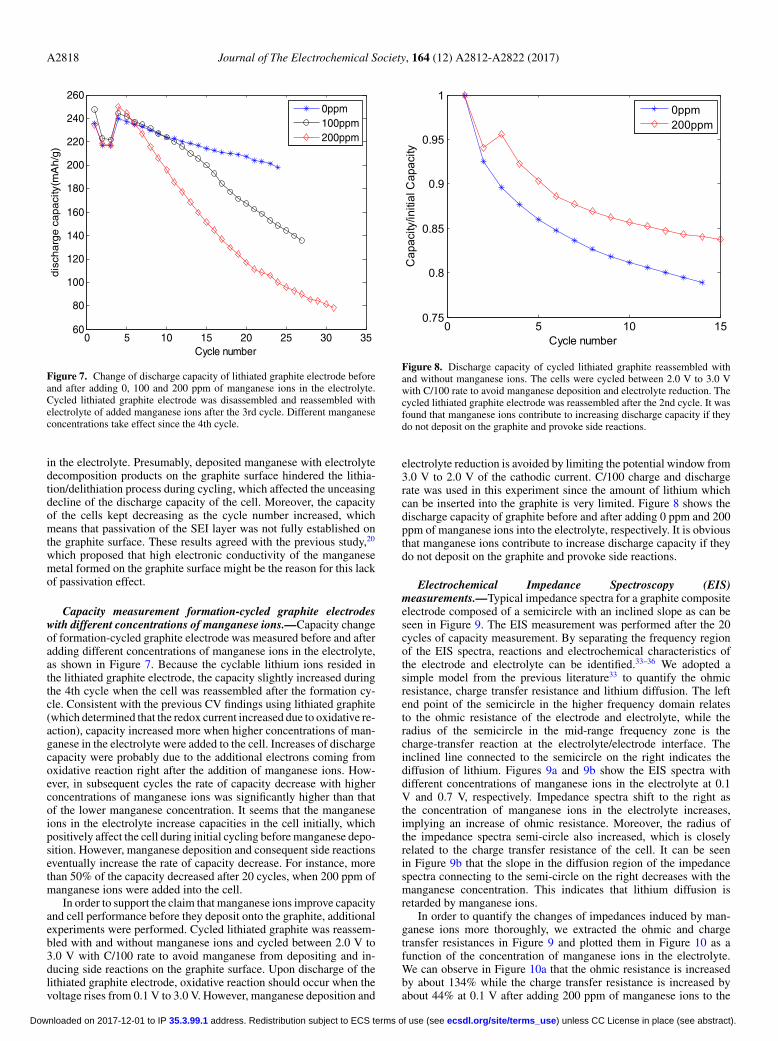
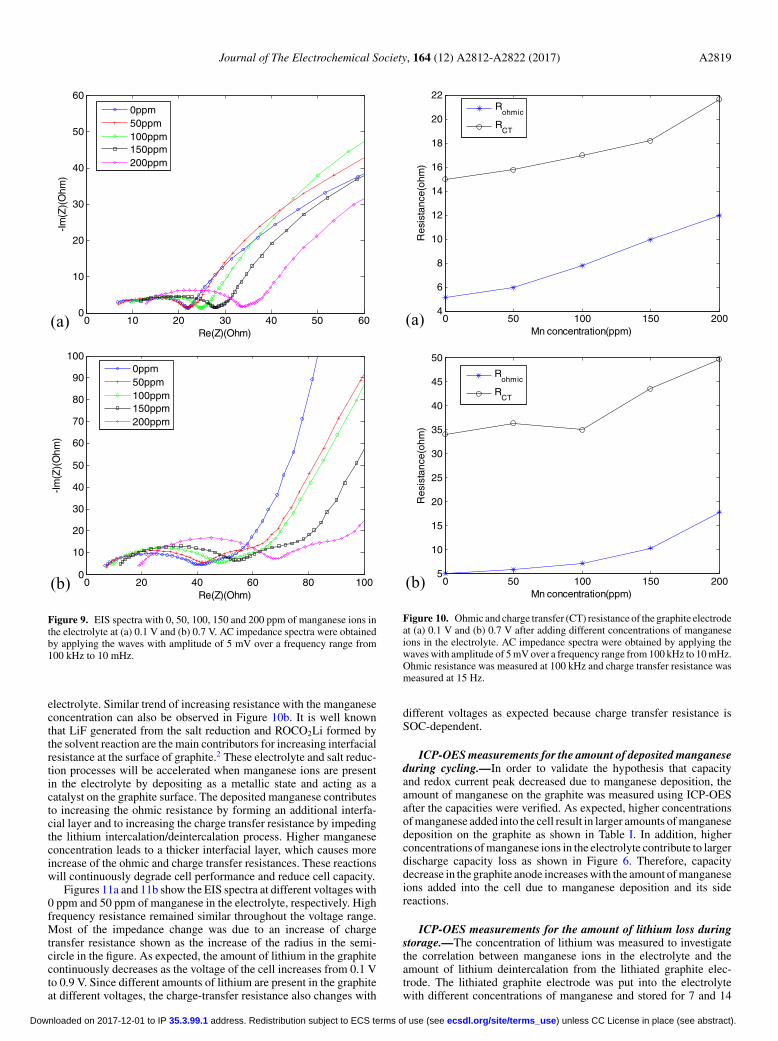
Electrochemical Impedance Spectroscopy (EIS)measurements.—Typical impedance spectra for a graphite compositeelectrode composed of a semicircle with an inclined slope as can beseen in Figure 9. The EIS measurement was performed after the 20cycles of capacity measurement. By separating the frequency regionof the EIS spectra, reactions and electrochemical characteristics ofthe electrode and electrolyte can be identified.33–36 We adopted asimple model from the previous literature33 to quantify the ohmicresistance, charge transfer resistance and lithium diffusion. The leftend point of the semicircle in the higher frequency domain relatesto the ohmic resistance of the electrode and electrolyte, while theradius of the semicircle in the mid-range frequency zone is thecharge-transfer reaction at the electrolyte/electrode interface. Theinclined line connected to the semicircle on the right indicates thediffusion of lithium. Figures 9a and 9b show the EIS spectra withdifferent concentrations of manganese ions in the electrolyte at 0.1V and 0.7 V, respectively. Impedance spectra shift to the right asthe concentration of manganese ions in the electrolyte increases,implying an increase of ohmic resistance. Moreover, the radius ofthe impedance spectra semi-circle also increased, which is closelyrelated to the charge transfer resistance of the cell. It can be seenin Figure 9b that the slope in the diffusion region of the impedancespectra connecting to the semi-circle on the right decreases with themanganese concentration. This indicates that lithium diffusion isretarded by manganese ions.
In order to quantify the changes of impedances induced by man-ganese ions more thoroughly, we extracted the ohmic and chargetransfer resistances in Figure 9 and plotted them in Figure 10 as afunction of the concentration of manganese ions in the electrolyte.We can observe in Figure 10a that the ohmic resistance is increasedby about 134% while the charge transfer resistance is increased byabout 44% at 0.1 V after adding 200 ppm of manganese ions to the
) unless CC License in place (see abstract). ecsdl.org/site/terms_use address. Redistribution subject to ECS terms of use (see 35.3.99.1Downloaded on 2017-12-01 to IP
Journal of The Electrochemical Society, 164 (12) A2812-A2822 (2017) A2819
(a) 0 10 20 30 40 50 600
10
20
30
40
50
60
Re(Z)(Ohm)
-Im(Z
)(O
hm)
0ppm50ppm100ppm150ppm200ppm
(b) 0 20 40 60 80 1000
10
20
30
40
50
60
70
80
90
100
Re(Z)(Ohm)
-Im(Z
)(O
hm)
0ppm50ppm100ppm150ppm200ppm
Figure 9. EIS spectra with 0, 50, 100, 150 and 200 ppm of manganese ions inthe electrolyte at (a) 0.1 V and (b) 0.7 V. AC impedance spectra were obtainedby applying the waves with amplitude of 5 mV over a frequency range from100 kHz to 10 mHz.
electrolyte. Similar trend of increasing resistance with the manganeseconcentration can also be observed in Figure 10b. It is well knownthat LiF generated from the salt reduction and ROCO2Li formed bythe solvent reaction are the main contributors for increasing interfacialresistance at the surface of graphite.2 These electrolyte and salt reduc-tion processes will be accelerated when manganese ions are presentin the electrolyte by depositing as a metallic state and acting as acatalyst on the graphite surface. The deposited manganese contributesto increasing the ohmic resistance by forming an additional interfa-cial layer and to increasing the charge transfer resistance by impedingthe lithium intercalation/deintercalation process. Higher manganeseconcentration leads to a thicker interfacial layer, which causes moreincrease of the ohmic and charge transfer resistances. These reactionswill continuously degrade cell performance and reduce cell capacity.
Figures 11a and 11b show the EIS spectra at different voltages with0 ppm and 50 ppm of manganese in the electrolyte, respectively. Highfrequency resistance remained similar throughout the voltage range.Most of the impedance change was due to an increase of chargetransfer resistance shown as the increase of the radius in the semi-circle in the figure. As expected, the amount of lithium in the graphitecontinuously decreases as the voltage of the cell increases from 0.1 Vto 0.9 V. Since different amounts of lithium are present in the graphiteat different voltages, the charge-transfer resistance also changes with
(a) 0 50 100 150 2004
6
8
10
12
14
16
18
20
22
Mn concentration(ppm)
Res
ista
nce(
ohm
)
Rohmic
RCT
(b) 0 50 100 150 2005
10
15
20
25
30
35
40
45
50
Mn concentration(ppm)
Res
ista
nce(
ohm
)
Rohmic
RCT
Figure 10. Ohmic and charge transfer (CT) resistance of the graphite electrodeat (a) 0.1 V and (b) 0.7 V after adding different concentrations of manganeseions in the electrolyte. AC impedance spectra were obtained by applying thewaves with amplitude of 5 mV over a frequency range from 100 kHz to 10 mHz.Ohmic resistance was measured at 100 kHz and charge transfer resistance wasmeasured at 15 Hz.
different voltages as expected because charge transfer resistance isSOC-dependent.
ICP-OES measurements for the amount of deposited manganeseduring cycling.—In order to validate the hypothesis that capacityand redox current peak decreased due to manganese deposition, theamount of manganese on the graphite was measured using ICP-OESafter the capacities were verified. As expected, higher concentrationsof manganese added into the cell result in larger amounts of manganesedeposition on the graphite as shown in Table I. In addition, higherconcentrations of manganese ions in the electrolyte contribute to largerdischarge capacity loss as shown in Figure 6. Therefore, capacitydecrease in the graphite anode increases with the amount of manganeseions added into the cell due to manganese deposition and its sidereactions.
ICP-OES measurements for the amount of lithium loss duringstorage.—The concentration of lithium was measured to investigatethe correlation between manganese ions in the electrolyte and theamount of lithium deintercalation from the lithiated graphite elec-trode. The lithiated graphite electrode was put into the electrolytewith different concentrations of manganese and stored for 7 and 14
) unless CC License in place (see abstract). ecsdl.org/site/terms_use address. Redistribution subject to ECS terms of use (see 35.3.99.1Downloaded on 2017-12-01 to IP

A2820 Journal of The Electrochemical Society, 164 (12) A2812-A2822 (2017)
(a) 0 20 40 60 80 1000
20
40
60
80
100
Re(Z)(Ohm)
-Im(Z
)(O
hm)
0.1V0.3V0.5V0.7V0.9V
(b) 0 20 40 60 80 1000
20
40
60
80
100
Re(Z)(Ohm)
-Im(Z
)(O
hm)
0.1V0.3V0.5V0.7V0.9V
Figure 11. EIS spectra at 0.1, 0.3, 0.5, 0.7, and 0.9 V (vs. Li/Li+) with adding(a) 0 ppm and (b) 50 ppm of manganese ions in the electrolyte. AC impedancespectra were obtained by applying the waves with amplitude of 5 mV over afrequency range from 100 kHz to 10 mHz.
days in order to observe the effect of manganese on the chargedgraphite anode. Table II shows the amount of deposited manganeseon the graphite and the amount of lithium in the electrolyte measuredusing ICP-OES.
As expected, higher concentrations of manganese ions put into theelectrolyte cause the deposition of more manganese on the graphitesurface. Moreover, the amount of dissolved lithium in the electrolyteis increased if we put higher concentrations of manganese in the elec-trolyte. Even with 0 ppm of manganese in the electrolyte, 2.7 mols
Table I. Amount of manganese deposited on the graphite withdifferent concentrations of manganese.
Manganese concentration Amount of manganese(ppm) deposited on the graphite (ug)
50 8.7783100 14.528150 28.078200 31.378
Measured by ICP-OES after the capacity measurement shown inFigure 6.
Table II. Amount of manganese deposited on the graphite andamount of dissolved lithium in the electrolyte.
Mn Amount of manganese Amount of dissolvedDuration concentration deposited on graphite lithium in electrolyte
(days) (ppm) (umol) (umol)
7 0 0.00102 2.74927 50 0.10584 3.48417 100 0.17673 4.4027
14 0 0.00134 2.756414 50 0.11412 5.4639
The graphite negative electrode was discharged with lithium metal (areference electrode) and held at 0.05V (x is about 0.9 in LixC6) for 3hours before storage to achieve lithiated graphite electrodes. Sampleswere stored in 1 mL of EC: DMC (1:1 by volume) with 0, 50 and 100ppm manganese at room temperature for 7 and 14 days.
of lithium were dissolved into the electrolyte, which might be pro-duced from lithium deintercalation due to the self-discharge of lithi-ated graphite. For instance, during long-term storage in open circuitvoltage conditions, a current leakage will contribute to building theSEI layer by reacting with the electrolyte. Moreover, protic speciescoming from water are also reducible by consuming electrons fromthe graphite8,
H+ + e− → 1
2H2 [1]
H2O + e− → 1
2H2 + OH− [2]
In Table II we can clearly see the effect of manganese ions since theamount of lithium coming out from the graphite increased remarkablyas a larger amount of manganese was deposited. Moreover, the numberof mols of lithium deintercalated from the graphite was much morethan the stoichiometric amount of lithium from the manganese-lithiumexchange mechanism9,12, or
yMn2+ + LixC6 → yMn + Lix−2yC6 + 2yLi+ [3]
These results show that manganese ions cause more than justmanganese-lithium exchange, which appears to be only a small portionof the overall capacity degradation. It is supposed that the additionalformation of decomposed layers induced by manganese depositionprovokes lithium deintercalation and the generation of decomposedproducts which additionally consume lithium from the graphite elec-trode.
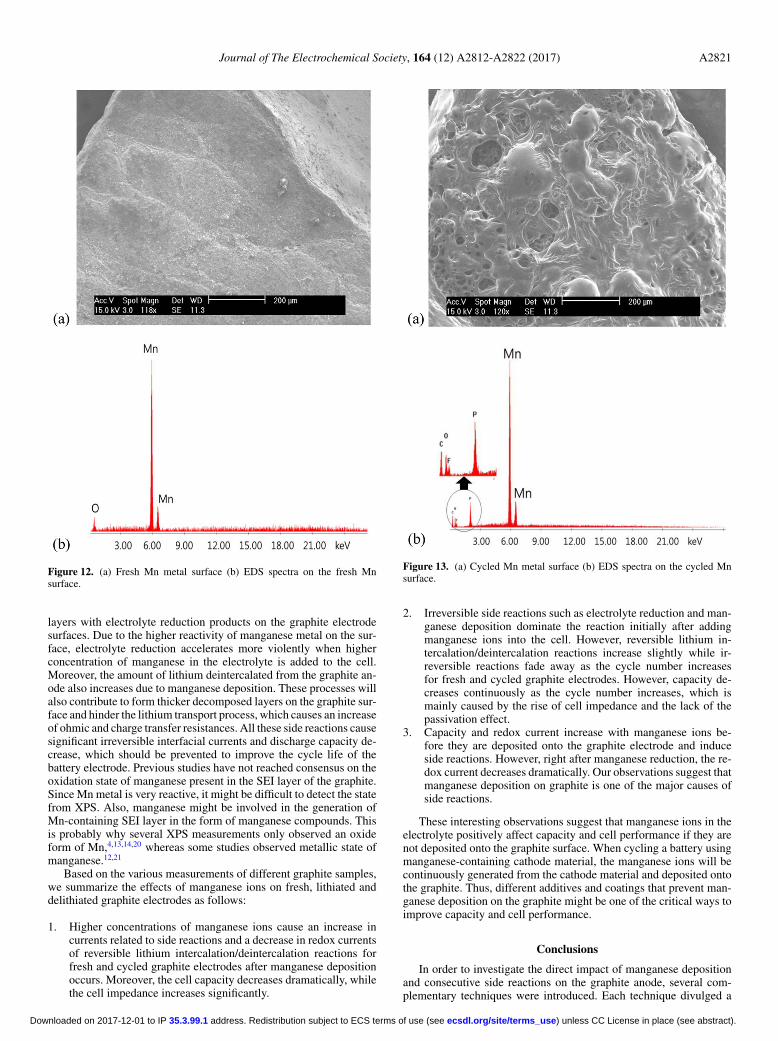
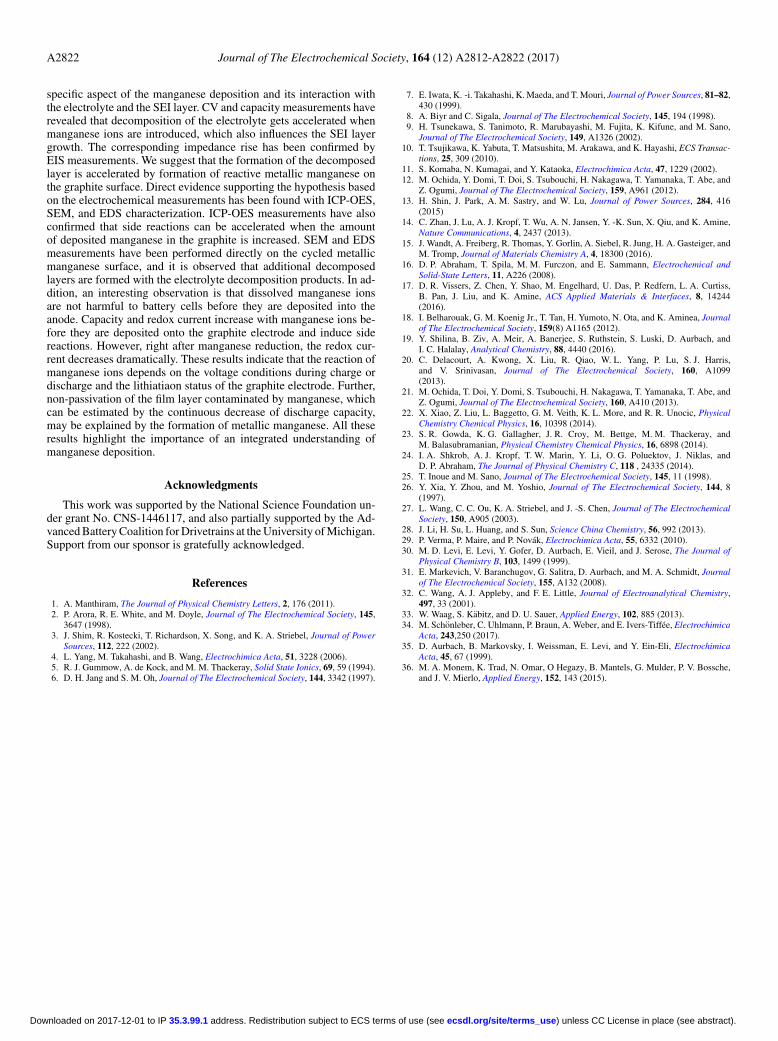
SEM and EDS measurements.—We predicted that depositedmanganese metal induces the formation of decomposed layers withelectrolyte reduction products on the graphite surface. In order to ex-amine the hypothesis, microscopic observations and elemental anal-ysis were conducted via SEM and EDS, respectively. For clear ob-servation of the layer generated on the manganese metal surface, wereplaced the graphite anode with manganese metal. Figure 12 andFigure 13 show the images of the manganese metal before and aftercycling as well as the EDS spectra on the manganese surface. Bycomparing fresh and cycled manganese metal surfaces, it is clear thatadditional decomposed layers are formed on the manganese metal sur-face. From the EDS spectra analysis, C, F and P element were detectedin the cycled manganese metal surface as seen in Figure 13b. Theseelements originate from the electrolyte decomposition product of theelectrolyte and are the components of additional layers provoked bymanganese metal surfaces. Similar processes can take place with thedeposited manganese on the graphite anode surface.
In conclusion, it is obvious that manganese ions in the electrolyteprovoke not only the dissolution of lithium in the electrolyte by reduc-tion of manganese but also the formation of additional decomposed
) unless CC License in place (see abstract). ecsdl.org/site/terms_use address. Redistribution subject to ECS terms of use (see 35.3.99.1Downloaded on 2017-12-01 to IP
Journal of The Electrochemical Society, 164 (12) A2812-A2822 (2017) A2821
Figure 12. (a) Fresh Mn metal surface (b) EDS spectra on the fresh Mnsurface.
layers with electrolyte reduction products on the graphite electrodesurfaces. Due to the higher reactivity of manganese metal on the sur-face, electrolyte reduction accelerates more violently when higherconcentration of manganese in the electrolyte is added to the cell.Moreover, the amount of lithium deintercalated from the graphite an-ode also increases due to manganese deposition. These processes willalso contribute to form thicker decomposed layers on the graphite sur-face and hinder the lithium transport process, which causes an increaseof ohmic and charge transfer resistances. All these side reactions causesignificant irreversible interfacial currents and discharge capacity de-crease, which should be prevented to improve the cycle life of thebattery electrode. Previous studies have not reached consensus on theoxidation state of manganese present in the SEI layer of the graphite.Since Mn metal is very reactive, it might be difficult to detect the statefrom XPS. Also, manganese might be involved in the generation ofMn-containing SEI layer in the form of manganese compounds. Thisis probably why several XPS measurements only observed an oxideform of Mn,4,13,14,20 whereas some studies observed metallic state ofmanganese.12,21
Based on the various measurements of different graphite samples,we summarize the effects of manganese ions on fresh, lithiated anddelithiated graphite electrodes as follows:
1. Higher concentrations of manganese ions cause an increase incurrents related to side reactions and a decrease in redox currentsof reversible lithium intercalation/deintercalation reactions forfresh and cycled graphite electrodes after manganese depositionoccurs. Moreover, the cell capacity decreases dramatically, whilethe cell impedance increases significantly.
Figure 13. (a) Cycled Mn metal surface (b) EDS spectra on the cycled Mnsurface.
2. Irreversible side reactions such as electrolyte reduction and man-ganese deposition dominate the reaction initially after addingmanganese ions into the cell. However, reversible lithium in-tercalation/deintercalation reactions increase slightly while ir-reversible reactions fade away as the cycle number increasesfor fresh and cycled graphite electrodes. However, capacity de-creases continuously as the cycle number increases, which ismainly caused by the rise of cell impedance and the lack of thepassivation effect.
3. Capacity and redox current increase with manganese ions be-fore they are deposited onto the graphite electrode and induceside reactions. However, right after manganese reduction, the re-dox current decreases dramatically. Our observations suggest thatmanganese deposition on graphite is one of the major causes ofside reactions.
These interesting observations suggest that manganese ions in theelectrolyte positively affect capacity and cell performance if they arenot deposited onto the graphite surface. When cycling a battery usingmanganese-containing cathode material, the manganese ions will becontinuously generated from the cathode material and deposited ontothe graphite. Thus, different additives and coatings that prevent man-ganese deposition on the graphite might be one of the critical ways toimprove capacity and cell performance.
Conclusions
In order to investigate the direct impact of manganese depositionand consecutive side reactions on the graphite anode, several com-plementary techniques were introduced. Each technique divulged a
) unless CC License in place (see abstract). ecsdl.org/site/terms_use address. Redistribution subject to ECS terms of use (see 35.3.99.1Downloaded on 2017-12-01 to IP
A2822 Journal of The Electrochemical Society, 164 (12) A2812-A2822 (2017)
specific aspect of the manganese deposition and its interaction withthe electrolyte and the SEI layer. CV and capacity measurements haverevealed that decomposition of the electrolyte gets accelerated whenmanganese ions are introduced, which also influences the SEI layergrowth. The corresponding impedance rise has been confirmed byEIS measurements. We suggest that the formation of the decomposedlayer is accelerated by formation of reactive metallic manganese onthe graphite surface. Direct evidence supporting the hypothesis basedon the electrochemical measurements has been found with ICP-OES,SEM, and EDS characterization. ICP-OES measurements have alsoconfirmed that side reactions can be accelerated when the amountof deposited manganese in the graphite is increased. SEM and EDSmeasurements have been performed directly on the cycled metallicmanganese surface, and it is observed that additional decomposedlayers are formed with the electrolyte decomposition products. In ad-dition, an interesting observation is that dissolved manganese ionsare not harmful to battery cells before they are deposited into theanode. Capacity and redox current increase with manganese ions be-fore they are deposited onto the graphite electrode and induce sidereactions. However, right after manganese reduction, the redox cur-rent decreases dramatically. These results indicate that the reaction ofmanganese ions depends on the voltage conditions during charge ordischarge and the lithiatiaon status of the graphite electrode. Further,non-passivation of the film layer contaminated by manganese, whichcan be estimated by the continuous decrease of discharge capacity,may be explained by the formation of metallic manganese. All theseresults highlight the importance of an integrated understanding ofmanganese deposition.
Acknowledgments
This work was supported by the National Science Foundation un-der grant No. CNS-1446117, and also partially supported by the Ad-vanced Battery Coalition for Drivetrains at the University of Michigan.Support from our sponsor is gratefully acknowledged.
References
1. A. Manthiram, The Journal of Physical Chemistry Letters, 2, 176 (2011).2. P. Arora, R. E. White, and M. Doyle, Journal of The Electrochemical Society, 145,
3647 (1998).3. J. Shim, R. Kostecki, T. Richardson, X. Song, and K. A. Striebel, Journal of Power
Sources, 112, 222 (2002).4. L. Yang, M. Takahashi, and B. Wang, Electrochimica Acta, 51, 3228 (2006).5. R. J. Gummow, A. de Kock, and M. M. Thackeray, Solid State Ionics, 69, 59 (1994).6. D. H. Jang and S. M. Oh, Journal of The Electrochemical Society, 144, 3342 (1997).
7. E. Iwata, K. -i. Takahashi, K. Maeda, and T. Mouri, Journal of Power Sources, 81–82,430 (1999).
8. A. Biyr and C. Sigala, Journal of The Electrochemical Society, 145, 194 (1998).9. H. Tsunekawa, S. Tanimoto, R. Marubayashi, M. Fujita, K. Kifune, and M. Sano,
Journal of The Electrochemical Society, 149, A1326 (2002).10. T. Tsujikawa, K. Yabuta, T. Matsushita, M. Arakawa, and K. Hayashi, ECS Transac-
tions, 25, 309 (2010).11. S. Komaba, N. Kumagai, and Y. Kataoka, Electrochimica Acta, 47, 1229 (2002).12. M. Ochida, Y. Domi, T. Doi, S. Tsubouchi, H. Nakagawa, T. Yamanaka, T. Abe, and
Z. Ogumi, Journal of The Electrochemical Society, 159, A961 (2012).13. H. Shin, J. Park, A. M. Sastry, and W. Lu, Journal of Power Sources, 284, 416
(2015)14. C. Zhan, J. Lu, A. J. Kropf, T. Wu, A. N. Jansen, Y. -K. Sun, X. Qiu, and K. Amine,
Nature Communications, 4, 2437 (2013).15. J. Wandt, A. Freiberg, R. Thomas, Y. Gorlin, A. Siebel, R. Jung, H. A. Gasteiger, and
M. Tromp, Journal of Materials Chemistry A, 4, 18300 (2016).16. D. P. Abraham, T. Spila, M. M. Furczon, and E. Sammann, Electrochemical and
Solid-State Letters, 11, A226 (2008).17. D. R. Vissers, Z. Chen, Y. Shao, M. Engelhard, U. Das, P. Redfern, L. A. Curtiss,
B. Pan, J. Liu, and K. Amine, ACS Applied Materials & Interfaces, 8, 14244(2016).
18. I. Belharouak, G. M. Koenig Jr., T. Tan, H. Yumoto, N. Ota, and K. Aminea, Journalof The Electrochemical Society, 159(8) A1165 (2012).
19. Y. Shilina, B. Ziv, A. Meir, A. Banerjee, S. Ruthstein, S. Luski, D. Aurbach, andI. C. Halalay, Analytical Chemistry, 88, 4440 (2016).
20. C. Delacourt, A. Kwong, X. Liu, R. Qiao, W. L. Yang, P. Lu, S. J. Harris,and V. Srinivasan, Journal of The Electrochemical Society, 160, A1099(2013).
21. M. Ochida, T. Doi, Y. Domi, S. Tsubouchi, H. Nakagawa, T. Yamanaka, T. Abe, andZ. Ogumi, Journal of The Electrochemical Society, 160, A410 (2013).
22. X. Xiao, Z. Liu, L. Baggetto, G. M. Veith, K. L. More, and R. R. Unocic, PhysicalChemistry Chemical Physics, 16, 10398 (2014).
23. S. R. Gowda, K. G. Gallagher, J. R. Croy, M. Bettge, M. M. Thackeray, andM. Balasubramanian, Physical Chemistry Chemical Physics, 16, 6898 (2014).
24. I. A. Shkrob, A. J. Kropf, T. W. Marin, Y. Li, O. G. Poluektov, J. Niklas, andD. P. Abraham, The Journal of Physical Chemistry C, 118 , 24335 (2014).
25. T. Inoue and M. Sano, Journal of The Electrochemical Society, 145, 11 (1998).26. Y. Xia, Y. Zhou, and M. Yoshio, Journal of The Electrochemical Society, 144, 8
(1997).27. L. Wang, C. C. Ou, K. A. Striebel, and J. -S. Chen, Journal of The Electrochemical
Society, 150, A905 (2003).28. J. Li, H. Su, L. Huang, and S. Sun, Science China Chemistry, 56, 992 (2013).29. P. Verma, P. Maire, and P. Novak, Electrochimica Acta, 55, 6332 (2010).30. M. D. Levi, E. Levi, Y. Gofer, D. Aurbach, E. Vieil, and J. Serose, The Journal of
Physical Chemistry B, 103, 1499 (1999).31. E. Markevich, V. Baranchugov, G. Salitra, D. Aurbach, and M. A. Schmidt, Journal
of The Electrochemical Society, 155, A132 (2008).32. C. Wang, A. J. Appleby, and F. E. Little, Journal of Electroanalytical Chemistry,
497, 33 (2001).33. W. Waag, S. Kabitz, and D. U. Sauer, Applied Energy, 102, 885 (2013).34. M. Schonleber, C. Uhlmann, P. Braun, A. Weber, and E. Ivers-Tiffee, Electrochimica
Acta, 243,250 (2017).35. D. Aurbach, B. Markovsky, I. Weissman, E. Levi, and Y. Ein-Eli, Electrochimica
Acta, 45, 67 (1999).36. M. A. Monem, K. Trad, N. Omar, O Hegazy, B. Mantels, G. Mulder, P. V. Bossche,
and J. V. Mierlo, Applied Energy, 152, 143 (2015).
) unless CC License in place (see abstract). ecsdl.org/site/terms_use address. Redistribution subject to ECS terms of use (see 35.3.99.1Downloaded on 2017-12-01 to IP