c) deposition of manganese in drinking distribution system
TRANSCRIPT
APPLIED AND ENVIRONMENTAL MICROBIOLOGY, Mar. 1990, p. 628-639 Vol. 56, No. 30099-2240/90/030628-12$02.00/0Copyright C) 1990, American Society for Microbiology
Deposition of Manganese in a Drinking Water Distribution SystemL. I. SLY,'* M. C. HODGKINSON,2t AND VULLAPA ARUNPAIROJANA'
Department of Microbiology, University of Queensland, St. Lucia, Brisbane,' and Gold Coast City Council Water QualityCentre, Coombabah, Gold Coast,2 Australia
Received 21 November 1989/Accepted 28 November 1989
The deposition of manganese in a water distribution system with manganese-related "dirty water" problemswas studied over a 1-year period. Four monitoring laboratories with Robbins biofilm sampling devices fitted tothe water mains were used to correlate the relationship among manganese deposition, the level of manganesein the water, and the chlorination conditions. Manganese deposition occurred by both chemical and microbialprocesses. Chemical deposition occurred when Mn(II) not removed during water treatment penetrated thefilters and entered the distribution system, where it was oxidized by chlorine and chlorine dioxide used fordisinfection. Microbial deposition occurred in areas with insufficient chlorination to control the growth ofmanganese-depositing biofilm. At 0.05 mg of Mn(II) per liter, the chemical deposition rate was much greaterthan microbial deposition. Significant deposition occurred at 0.03 mg of manganese per liter, and dirty watercomplaints were not eliminated until manganese levels were continuously <0.02 mg/liter and chlorination levelswere >0.2 mg/liter. A guideline level of 0.01 mg of manganese per liter is recommended.
Manganese is the second most abundant metal in theearth's crust after iron (10). Like iron, manganese is re-garded as a nuisance rather than a toxic component ofdrinking water (24, 25). However, the presence of manga-nese in raw water presents special problems for watertreatment authorities because, unlike iron, manganese is notoxidized by air at neutral pH and is not removed duringwater treatment processes unless a chemical oxidation stepis included.The presence of even low levels of manganese in reticu-
lated water may result in deposition of manganese oxides onpipeline surfaces (1, 3, 4, 24, 25). These deposits causerestriction of water flow and in hydroelectric pipelines resultin head loss at the turbines due to increased frictional forcesat the surface (3, 11, 14, 20, 21).
In drinking-water distribution systems, sloughing of man-ganese oxide deposits results in water of poor aestheticquality which has a brown-black color and undesirable tasteand which causes staining of fixtures, equipment, swimmingpools, and laundry (1, 3, 12, 19, 24, 25). Such problems arewidespread (5, 13).To control these manganese-related problems in water
distribution systems, water-regulatory bodies set recom-mended levels. Most water authorities adhere to the WorldHealth Organization recommended level of 0.05 mg/liter(23). This level is a compromise value set primarily tominimize staining. There is little published experimentalevidence available to support the designation of recom-mended levels, which vary widely (Table 1).
In this paper, we report the results of an investigation ofmanganese deposition in a water distribution system with ahistory of manganese-related consumer complaints.
MATERIALS AND METHODS
Study location. The study was undertaken at the GoldCoast, 100 km south of Brisbane, Queensland, Australia.Following the commissioning in 1983 of the Molendinar
* Corresponding author.t Present address: Department of Chemistry, Queensland Univer-
sity of Technology, Brisbane, Australia.
water treatment plant, which draws water from the Hinzedam, sporadic occurrences of manganese-related "dirty wa-ter" have occurred. The problem was particularly acuteduring the summer period, December through March. TheMolendinar water treatment plant is a 100-megaliters/dayplant that uses alum coagulation, sedimentation, and sandfiltration followed by disinfection by chlorine and chlorinedioxide. Since 9 January 1986, settled water has been treatedwith chlorine dioxide prior to filtration to oxidize and re-move manganese.Monitoring laboratories. Four monitoring laboratories
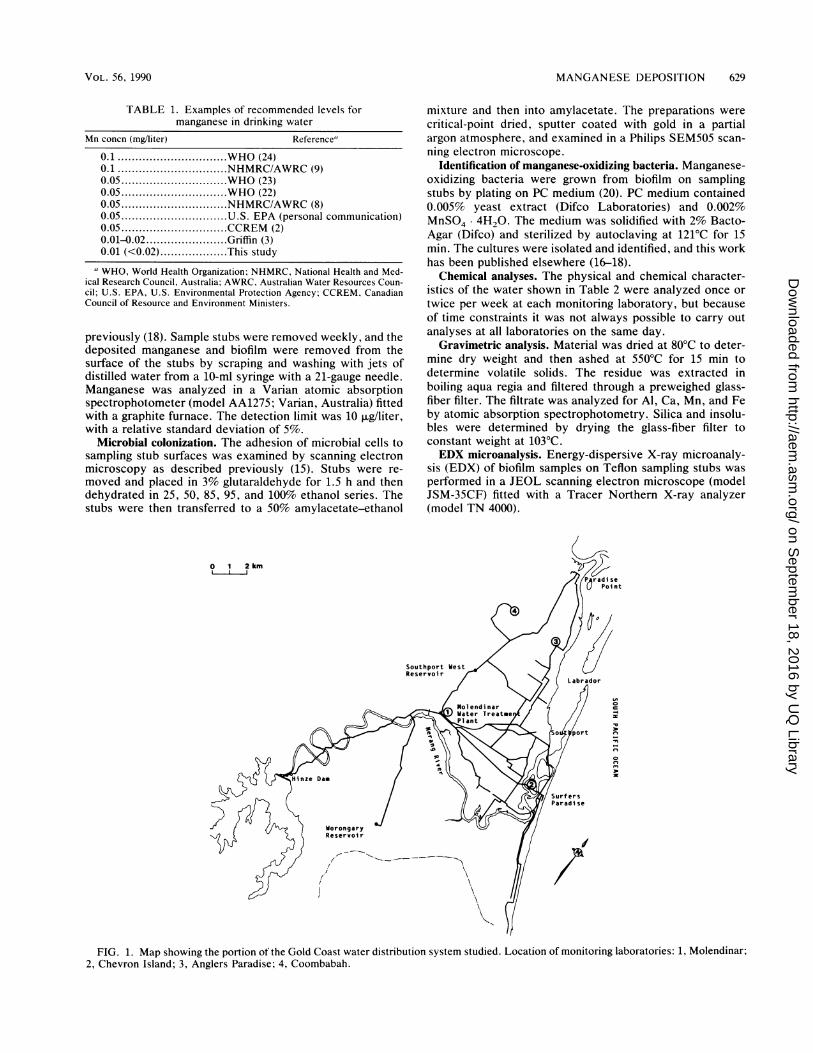
were established at points along the distribution system (Fig.1) to represent the range of conditions. The first monitoringpoint was at Molendinar immediately after the clear waterreservoir at the water treatment plant. The second point wasat Chevron Island approximately 7.5 km from Molendinar.The third point was located at Anglers Paradise approxi-mately 10 km from Molendinar and was near to the northernextremity of the distribution system. These three laborato-ries were sited directly adjacent to 300-mm-diameter trunkmains so that the water studied closely approximated theconditions in the trunk mains at each point. The fourthlaboratory was sited at Coombabah on a 225-mm-diameterdistribution main with low flow and poor residual chlorina-tion. The commissioning of the monitoring laboratories wasstaggered, and the periods of monitoring are shown in Table3.
Experimental apparatus. Experiments on biofilm develop-ment and manganese deposition were conducted with Rob-bins biofilm sampling devices (6) connected to the watermain at each monitoring laboratory through a 50-mm (insidediameter) polyethylene pipe terminating in a 12-mm (insidediameter) connection. Each Robbins device was sterilizedbefore installation, and the flow rate was controlled by avalve and monitored by a flow meter (Signet Scientific modelMK577). Flow rates were adjusted to a water velocity of 0.5m/s to simulate average conditions in the mains. The waterpressure was controlled by a 350-kPa pressure-limitingvalve.Manganese deposition. Manganese deposition was moni-
tored by following the levels of manganese deposited on thesurface of the Robbins device sampling stubs as described
628
on Septem
ber 18, 2016 by UQ
Libraryhttp://aem
.asm.org/
Dow
nloaded from
MANGANESE DEPOSITION 629
TABLE 1. Examples of recommended levels formanganese in drinking water
Mn concn (mg/liter) Reference"
0.1....... WHO (24)0.1 .. .....NHMRC/AWRC (9)0.05....... WHO (23)0.05....... WHO (22)0.05....... NHMRC/AWRC (8)0.05....... U.S. EPA (personal communication)0.05....... CCREM (2)0.01-0.02....... Griffin (3)0.01 (<0.02)....... This study
" WHO, World Health Organization; NHMRC, National Health and Med-ical Research Council, Australia; AWRC, Australian Water Resources Coun-cil; U.S. EPA, U.S. Environmental Protection Agency; CCREM, CanadianCouncil of Resource and Environment Ministers.
previously (18). Sample stubs were removed weekly, and thedeposited manganese and biofilm were removed from thesurface of the stubs by scraping and washing with jets ofdistilled water from a 10-ml syringe with a 21-gauge needle.Manganese was analyzed in a Varian atomic absorptionspectrophotometer (model AA1275; Varian, Australia) fittedwith a graphite furnace. The detection limit was 10 pLg/liter,with a relative standard deviation of 5%.
Microbial colonization. The adhesion of microbial cells tosampling stub surfaces was examined by scanning electronmicroscopy as described previously (15). Stubs were re-moved and placed in 3% glutaraldehyde for 1.5 h and thendehydrated in 25, 50, 85, 95, and 100% ethanol series. Thestubs were then transferred to a 50% amylacetate-ethanol
mixture and then into amylacetate. The preparations werecritical-point dried, sputter coated with gold in a partialargon atmosphere, and examined in a Philips SEM505 scan-ning electron microscope.
Identification of manganese-oxidizing bacteria. Manganese-oxidizing bacteria were grown from biofilm on samplingstubs by plating on PC medium (20). PC medium contained0.005% yeast extract (Difco Laboratories) and 0.002%MnSO4 4H20. The medium was solidified with 2% Bacto-Agar (Difco) and sterilized by autoclaving at 121°C for 15min. The cultures were isolated and identified, and this workhas been published elsewhere (16-18).
Chemical analyses. The physical and chemical character-istics of the water shown in Table 2 were analyzed once ortwice per week at each monitoring laboratory, but becauseof time constraints it was not always possible to carry outanalyses at all laboratories on the same day.
Gravimetric analysis. Material was dried at 80°C to deter-mine dry weight and then ashed at 550°C for 15 min todetermine volatile solids. The residue was extracted inboiling aqua regia and filtered through a preweighed glass-fiber filter. The filtrate was analyzed for Al, Ca, Mn, and Feby atomic absorption spectrophotometry. Silica and insolu-bles were determined by drying the glass-fiber filter toconstant weight at 103°C.EDX microanalysis. Energy-dispersive X-ray microanaly-
sis (EDX) of biofilm samples on Teflon sampling stubs wasperformed in a JEOL scanning electron microscope (modelJSM-35CF) fitted with a Tracer Northern X-ray analyzer(model TN 4000).
0 1 2 kmlI
SouthportReservoir
SurfersParadise
I- ~~~~~~~~~~~~~~~N
/'
//
FIG. 1. Map showing the portion of the Gold Coast water distribution system studied. Location of monitoring laboratories: 1, Molendinar;2, Chevron Island; 3, Anglers Paradise; 4, Coombabah.
VOL. 56, 1990
0
3-
n
n
on Septem
ber 18, 2016 by UQ
Libraryhttp://aem
.asm.org/
Dow
nloaded from
APPL. ENVIRON. MICROBIOL.
TABLE 2. Physicochemical characteristics of water leaving the Molendinar water treatment plant during the study period
Parameter (mg/liter)Level
(efcer- p (OC) Total Soluble Total Soluble2Had(rence)' pH Temp TotlMn Mnb TFe Feb NH4-N N03-N P04-P S042 TOCc Cl2 ClO2 TDSd ness asCaCO3
Range 7.4-7.8 14-26 <0.01-0.15 <0.01-0.02 <0.01-0.05 <0.01-0.04 <0.01 0.01-0.25 <0.01 20-25 1.0-5.0 0.3-2.0 0-1.0 90-110 50-60WHO recom- 6.5-8.5 0.10 0.3 10 400 0.2-0.5 1,000 500mended(24, 25)
NHMRC/ 6.5-8.5 0.10 0.3 10 400 0.2-0.5 1,000 500AWRCrecom-mended (9)
a WHO, World Health Organization; NHMRC/AWRC, National Health and Medical Research Council/Australian Water R, sources Council.b Defined as fraction passing through a 0.45-p.m filter.c TOC, Total organic carbon.d TDS, Total dissolved solids.e NTU, Nephelometric turbidity units.
RESULTS
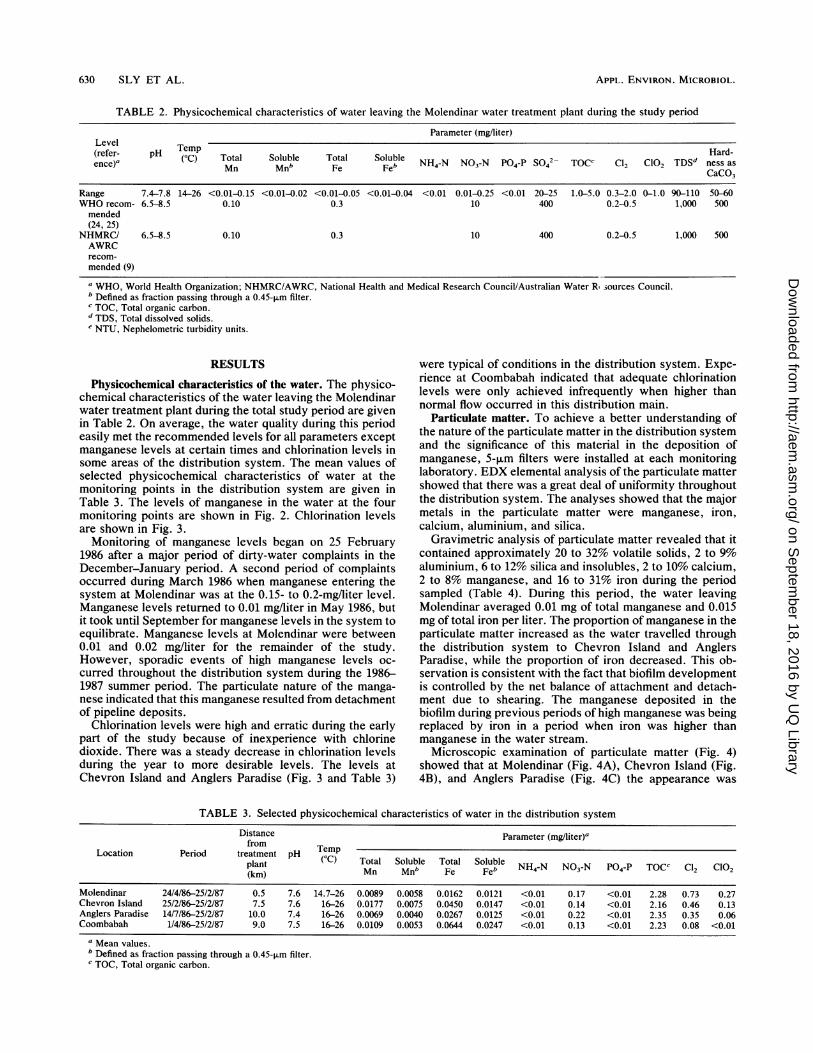
Physicochemical characteristics of the water. The physico-chemical characteristics of the water leaving the Molendinarwater treatment plant during the total study period are givenin Table 2. On average, the water quality during this periodeasily met the recommended levels for all parameters exceptmanganese levels at certain times and chlorination levels insome areas of the distribution system. The mean values ofselected physicochemical characteristics of water at themonitoring points in the distribution system are given inTable 3. The levels of manganese in the water at the fourmonitoring points are shown in Fig. 2. Chlorination levelsare shown in Fig. 3.
Monitoring of manganese levels began on 25 February1986 after a major period of dirty-water complaints in theDecember-January period. A second period of complaintsoccurred during March 1986 when manganese entering thesystem at Molendinar was at the 0.15- to 0.2-mg/liter level.Manganese levels returned to 0.01 mg/liter in May 1986, butit took until September for manganese levels in the system toequilibrate. Manganese levels at Molendinar were between0.01 and 0.02 mg/liter for the remainder of the study.However, sporadic events of high manganese levels oc-curred throughout the distribution system during the 1986-1987 summer period. The particulate nature of the manga-nese indicated that this manganese resulted from detachmentof pipeline deposits.
Chlorination levels were high and erratic during the earlypart of the study because of inexperience with chlorinedioxide. There was a steady decrease in chlorination levelsduring the year to more desirable levels. The levels atChevron Island and Anglers Paradise (Fig. 3 and Table 3)
were typical of conditions in the distribution system. Expe-rience at Coombabah indicated that adequate chlorinationlevels were only achieved infrequently when higher thannormal flow occurred in this distribution main.
Particulate matter. To achieve a better understanding ofthe nature of the particulate matter in the distribution systemand the significance of this material in the deposition ofmanganese, 5-rim filters were installed at each monitoringlaboratory. EDX elemental analysis of the particulate mattershowed that there was a great deal of uniformity throughoutthe distribution system. The analyses showed that the majormetals in the particulate matter were manganese, iron,calcium, aluminium, and silica.
Gravimetric analysis of particulate matter revealed that itcontained approximately 20 to 32% volatile solids, 2 to 9%aluminium, 6 to 12% silica and insolubles, 2 to 10% calcium,2 to 8% manganese, and 16 to 31% iron during the periodsampled (Table 4). During this period, the water leavingMolendinar averaged 0.01 mg of total manganese and 0.015mg of total iron per liter. The proportion of manganese in theparticulate matter increased as the water travelled throughthe distribution system to Chevron Island and AnglersParadise, while the proportion of iron decreased. This ob-servation is consistent with the fact that biofilm developmentis controlled by the net balance of attachment and detach-ment due to shearing. The manganese deposited in thebiofilm during previous periods of high manganese was beingreplaced by iron in a period when iron was higher thanmanganese in the water stream.
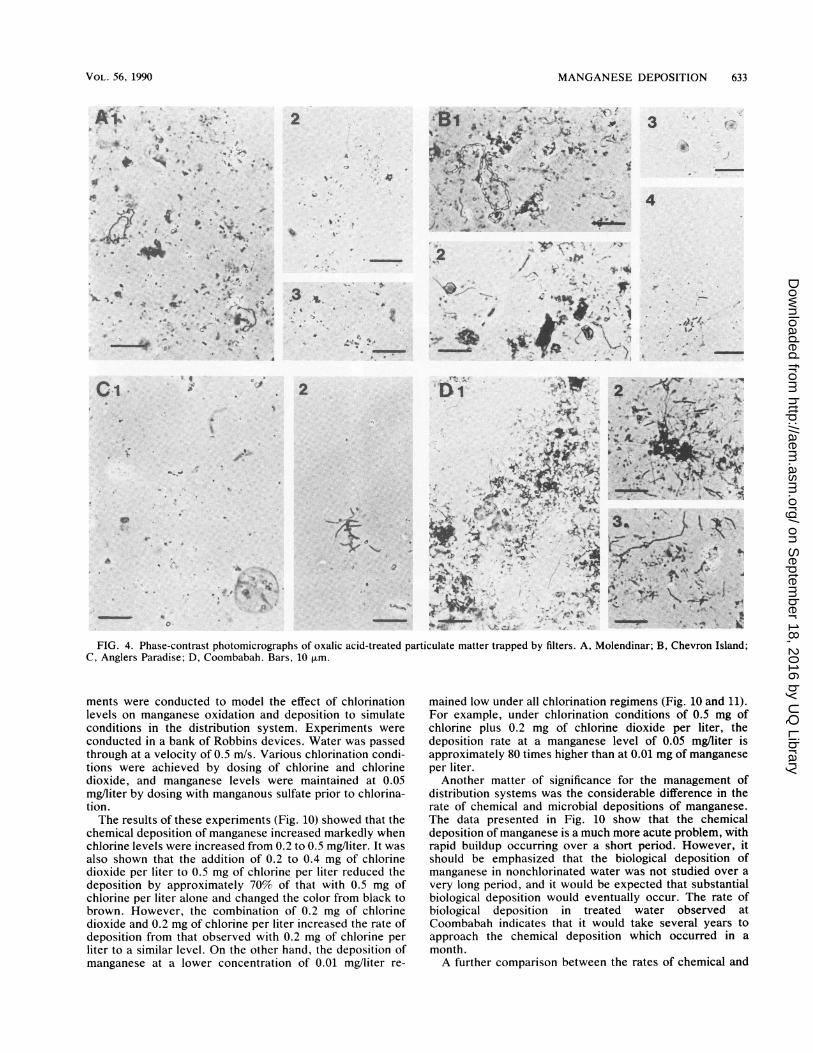
Microscopic examination of particulate matter (Fig. 4)showed that at Molendinar (Fig. 4A), Chevron Island (Fig.4B), and Anglers Paradise (Fig. 4C) the appearance was
TABLE 3. Selected physicochemical characteristics of water in the distribution system
Distance Parameter (mg/liter)afrom Temp
Location Period treatment pH (OC) Total Soluble Total Solubleplant Mn Mnb Fe FeSb NH4-N N03-N P04-P TOC' C12 C102(kin)
Molendinar 24/4/86-25/2/87 0.5 7.6 14.7-26 0.0089 0.0058 0.0162 0.0121 <0.01 0.17 <0.01 2.28 0.73 0.27Chevron Island 25/2/86-25/2/87 7.5 7.6 16-26 0.0177 0.0075 0.0450 0.0147 <0.01 0.14 <0.01 2.16 0.46 0.13Anglers Paradise 14/7/86-25/2/87 10.0 7.4 16-26 0.0069 0.0040 0.0267 0.0125 <0.01 0.22 <0.01 2.35 0.35 0.06Coombabah 1/4/86-25/2/87 9.0 7.5 16-26 0.0109 0.0053 0.0644 0.0247 <0.01 0.13 <0.01 2.23 0.08 <0.01
a Mean values.b Defined as fraction passing through a 0.45-pLm filter.c TOC, Total organic carbon.
630 SLY ET AL.
on Septem
ber 18, 2016 by UQ
Libraryhttp://aem
.asm.org/
Dow
nloaded from
MANGANESE DEPOSITION 631
TABLE 2-Continued
Parameter (mg/liter) Condu ColorTurbi- dtivity (appar-
nyali Free Sodi- Potas- Cal- Magne- Alu- Cop- Bicar- Car- Chlo- Sul- dityUe at 25°C ent)
CaCO3 CO2 um sium cium sium im- per Lead Znc bon- bon- de fide (N (S/cm) units)
30-40 4-6 10-12 1.3-1.6 15-20 3-5 0.01-0.04 0.02-0.05 0.005-0.1 0.01-0.15 35-45 1-2 15-20 20-25 1-2 110-170 3-5200 75 150 0.2 1.0 5.0 250 1 15
300 200 0.2 1.0 0.05 5.0 400 5 15
essentially similar. The material was the brown-black colorof metal oxides and contained organic matter and a fewmicrobial cells of diverse morphology, including rod-shaped,spiral, and filamentous bacteria and a variety of algae. A fewcells with Pedomicrobium-like morphology were also ob-served. The appearance of the material at Coombabah wasmarkedly different in that there was a much higher number ofmicrobial cells, particularly a Pedomicrobium sp., whichfrequently occurred in clumps as well as single cells (Fig.4D).
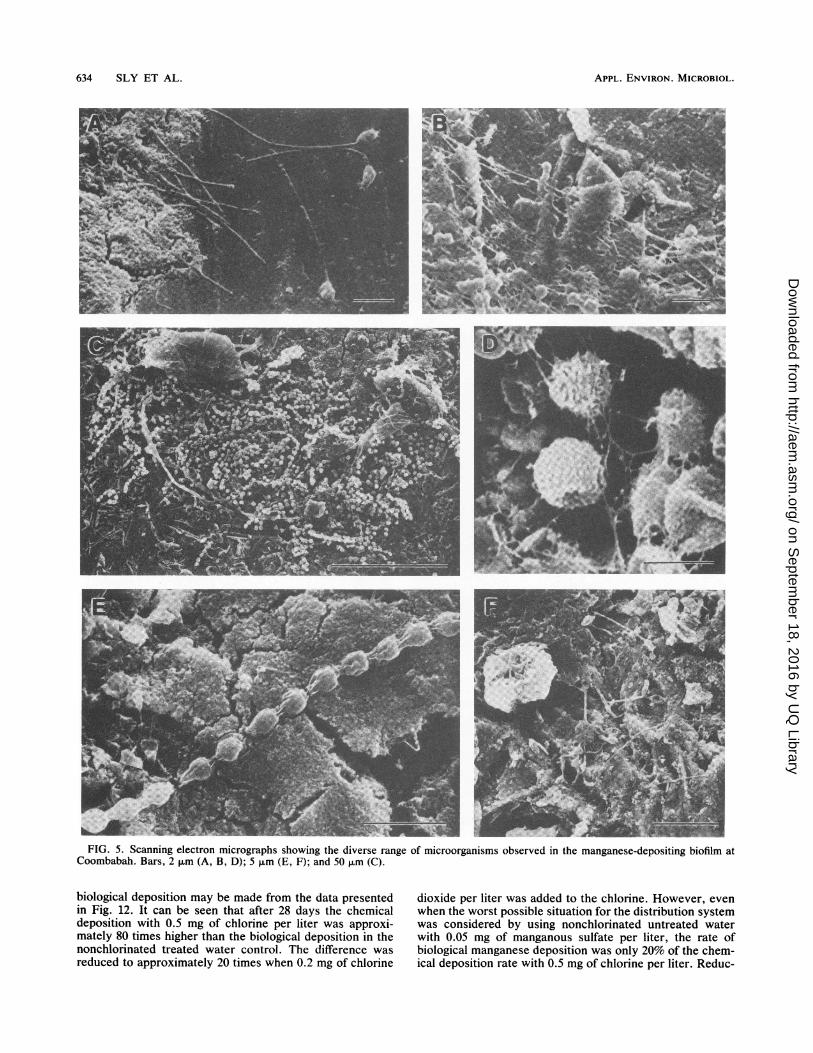
Deposition of manganese in the distribution system. Micro-bial manganese-depositing biofilm was only observed atCoombabah and only during periods of zero chlorination(Fig. SA and B). The dominant manganese-depositing micro-organisms were Pedomicrobium manganicum and a Metal-logenium sp. (16-18). A diverse range of other microorgan-isms was also observed in the biofilm (Fig. SC, D, E, and F).The need to maintain chlorination residuals in the distri-
bution system can be clearly seen by following the progressof manganese deposition at Coombabah (Fig. 6) with chlo-rination levels (Fig. 3). From the commencement of moni-toring on 1 April 1986, biofilm developed and manganese wasdeposited until a transient spike of 0.04 mg of chlorine
A0.15
E 0.10
c
0.050
0
dioxide per liter appeared on 20 May 1986 and the biofilmwas removed. Biofilm again developed until increased waterflow at Coombabah allowed an average residual of 0.15 mg ofchlorine per liter and transient chlorine dioxide to be main-tained during the period 3 July 1986 to 24 September 1986,and the biofilm was again removed by chlorination and keptunder control. After 24 September 1986, water consumptionat Coombabah was reduced, zero chlorination conditionsprevailed, and biofilm again developed until it was removedagain by two transient appearances of chlorine on 20 to 24November 1986 and 16 to 18 December 1986. No furtherchlorine was observed at Coombabah during the studyperiod, and biofilm and manganese deposition resumed.These observations serve to illustrate that intermittent chlo-rination has the potential to cause manganese-related dirtywater by the removal of manganese-depositing biofilm.
Microbial manganese-depositing biofilm was not observedat the Molendinar, Chevron Island, or Anglers Paradisemonitoring laboratory during the study period, confirmingthe adequacy of the prevailing chlorination levels to controlbiofilm development.However, evidence of chemical deposition of manganese
was observed at Molendinar and Chevron Island during the
1 l Il 'II I irl| 7
2/3 30/3 27/4 25/5 22/6 20/7
1986
T T I I I
17/8 14/9 12/10 9/11
Date
FIG. 2. Manganese levels in the distribution system at Molendinar (-), Chevron Island (0), Anglers Paradise (A), and Coombabah (0).A, Total manganese; B, soluble manganese.
0.05-
ico
.0
0U)
7/12 4/1 1/2 1/3
1987
B
dt F;i:;A- qr-,..Izqbomm r-
VOL. 56, 1990
O -1
on Septem
ber 18, 2016 by UQ
Libraryhttp://aem
.asm.org/
Dow
nloaded from
APPL. ENVIRON. MICROBIOL.
1.0 -
-0.5
2
2.0
1.0
0
2/3 30/3 27/4 25/5 22/6 20/7 17/8 14/9 12/10 9/11 7/12 4/1 1/2 1/3
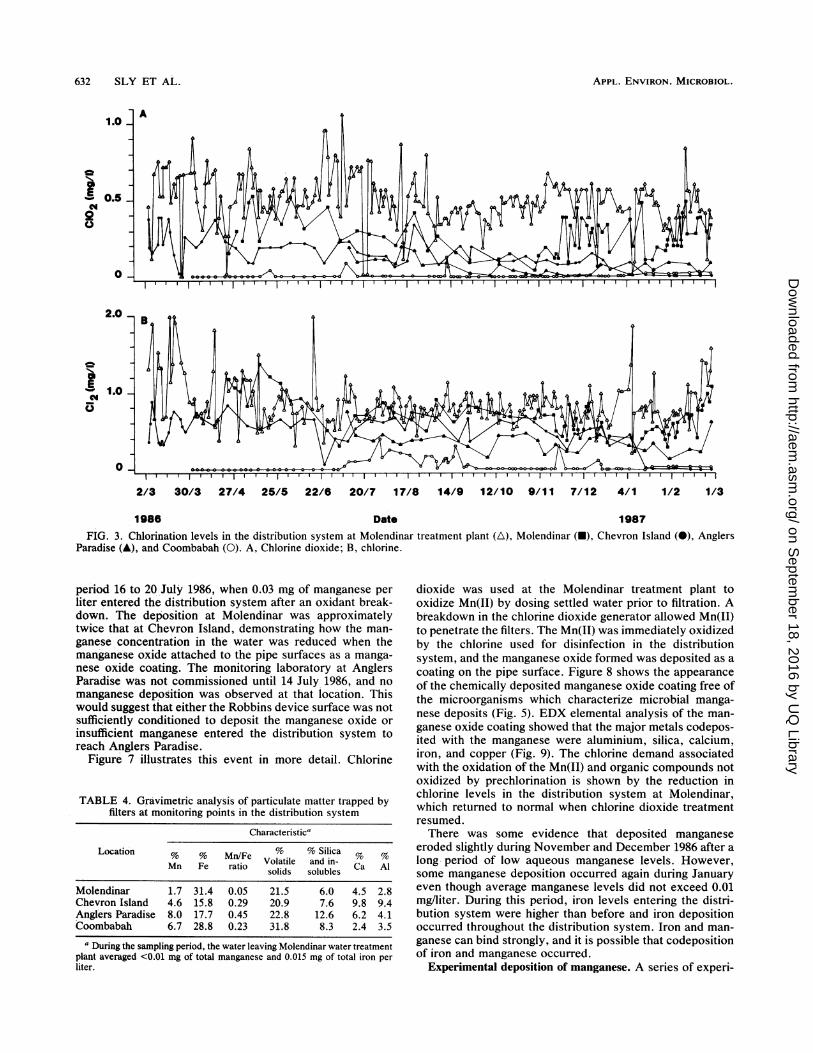
1986 Date 1987FIG. 3. Chlorination levels in the distribution system at Molendinar treatment plant (A), Molendinar (A), Chevron Island (-), Anglers
Paradise (A), and Coombabah (0). A, Chlorine dioxide; B, chlorine.
period 16 to 20 July 1986, when 0.03 mg of manganese perliter entered the distribution system after an oxidant break-down. The deposition at Molendinar was approximatelytwice that at Chevron Island, demonstrating how the man-ganese concentration in the water was reduced when themanganese oxide attached to the pipe surfaces as a manga-nese oxide coating. The monitoring laboratory at AnglersParadise was not commissioned until 14 July 1986, and nomanganese deposition was observed at that location. Thiswould suggest that either the Robbins device surface was notsufficiently conditioned to deposit the manganese oxide orinsufficient manganese entered the distribution system toreach Anglers Paradise.
Figure 7 illustrates this event in more detail. Chlorine
TABLE 4. Gravimetric analysis of particulate matter trapped byfilters at monitoring points in the distribution system
Characteristica
Location % % Mn/Fe % % Silica % %Volatile and in-Mn Fe ratio solids solubles Ca Al
Molendinar 1.7 31.4 0.05 21.5 6.0 4.5 2.8Chevron Island 4.6 15.8 0.29 20.9 7.6 9.8 9.4Anglers Paradise 8.0 17.7 0.45 22.8 12.6 6.2 4.1Coombabah 6.7 28.8 0.23 31.8 8.3 2.4 3.5
a During the sampling period, the water leaving Molendinar water treatmentplant averaged <0.01 mg of total manganese and 0.015 mg of total iron perliter.
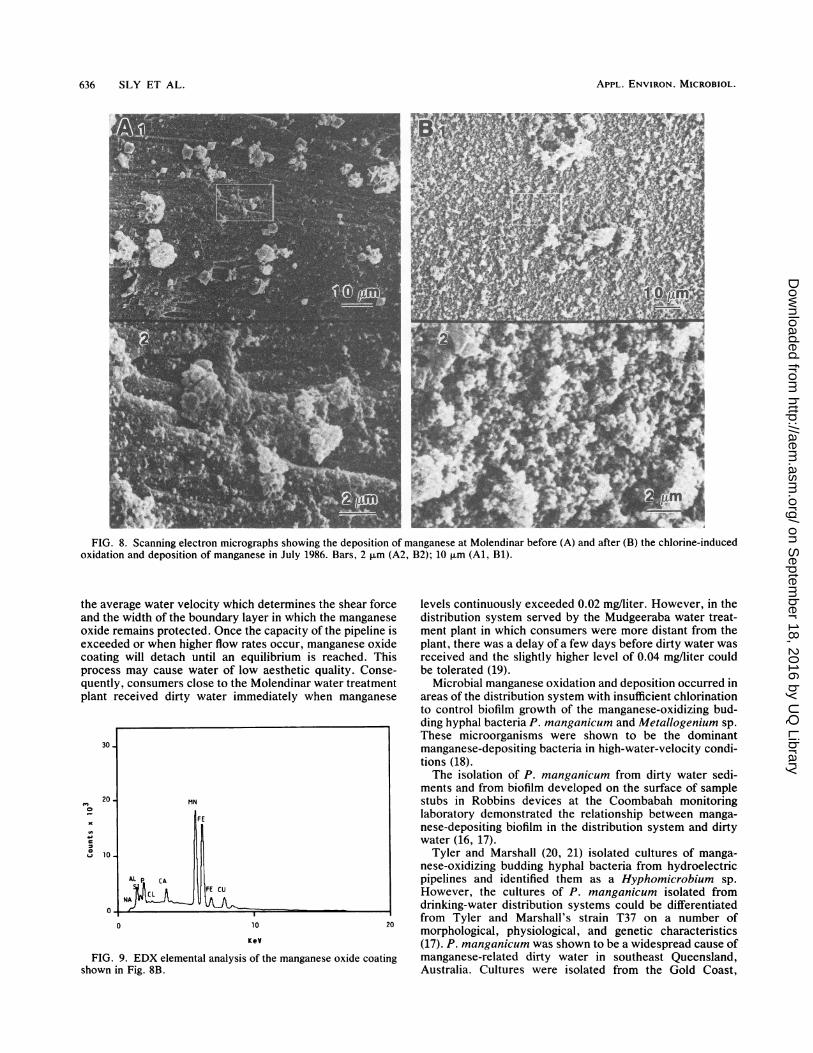
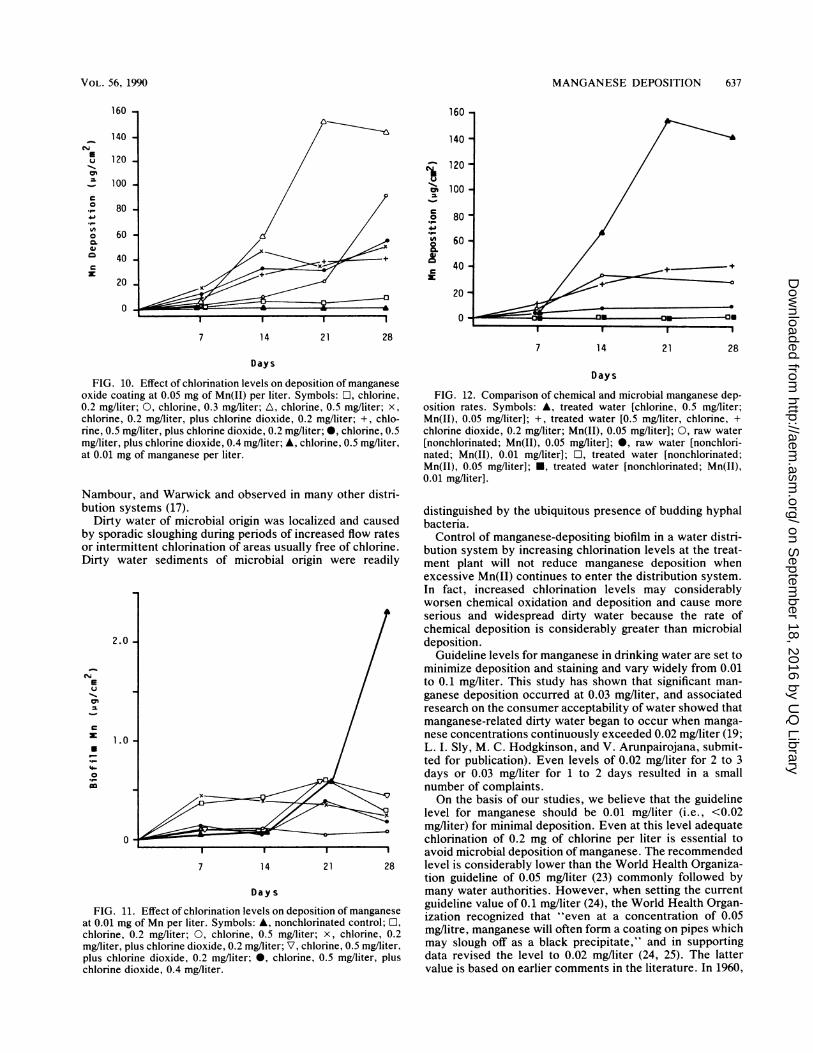
dioxide was used at the Molendinar treatment plant tooxidize Mn(II) by dosing settled water prior to filtration. Abreakdown in the chlorine dioxide generator allowed Mn(II)to penetrate the filters. The Mn(II) was immediately oxidizedby the chlorine used for disinfection in the distributionsystem, and the manganese oxide formed was deposited as acoating on the pipe surface. Figure 8 shows the appearanceof the chemically deposited manganese oxide coating free ofthe microorganisms which characterize microbial manga-nese deposits (Fig. 5). EDX elemental analysis of the man-ganese oxide coating showed that the major metals codepos-ited with the manganese were aluminium, silica, calcium,iron, and copper (Fig. 9). The chlorine demand associatedwith the oxidation of the Mn(II) and organic compounds notoxidized by prechlorination is shown by the reduction inchlorine levels in the distribution system at Molendinar,which returned to normal when chlorine dioxide treatmentresumed.There was some evidence that deposited manganese
eroded slightly during November and December 1986 after along period of low aqueous manganese levels. However,some manganese deposition occurred again during Januaryeven though average manganese levels did not exceed 0.01mg/liter. During this period, iron levels entering the distri-bution system were higher than before and iron depositionoccurred throughout the distribution system. Iron and man-ganese can bind strongly, and it is possible that codepositionof iron and manganese occurred.
Experimental deposition of manganese. A series of experi-
632 SLY ET AL.
on Septem
ber 18, 2016 by UQ
Libraryhttp://aem
.asm.org/
Dow
nloaded from
MANGANESE DEPOSITION 633
2
4.
'I .* .. . .
4 .5.
3 .
3 '- .t
_#*
5, a - $
,42 r k s + s
sY ;'*'';'-';:!
4
.v.5, .1k,
I ____
;39I 2
FIG. 4. Phase-contrast photomicrographs of oxalic acid-treated particulate matter trapped by filters. A, Molendinar; B, Chevron Island;C, Anglers Paradise; D, Coombabah. Bars, 10 ,um.
ments were conducted to model the effect of chlorinationlevels on manganese oxidation and deposition to simulateconditions in the distribution system. Experiments wereconducted in a bank of Robbins devices. Water was passedthrough at a velocity of 0.5 m/s. Various chlorination condi-tions were achieved by dosing of chlorine and chlorinedioxide, and manganese levels were maintained at 0.05mg/liter by dosing with manganous sulfate prior to chlorina-tion.The results of these experiments (Fig. 10) showed that the
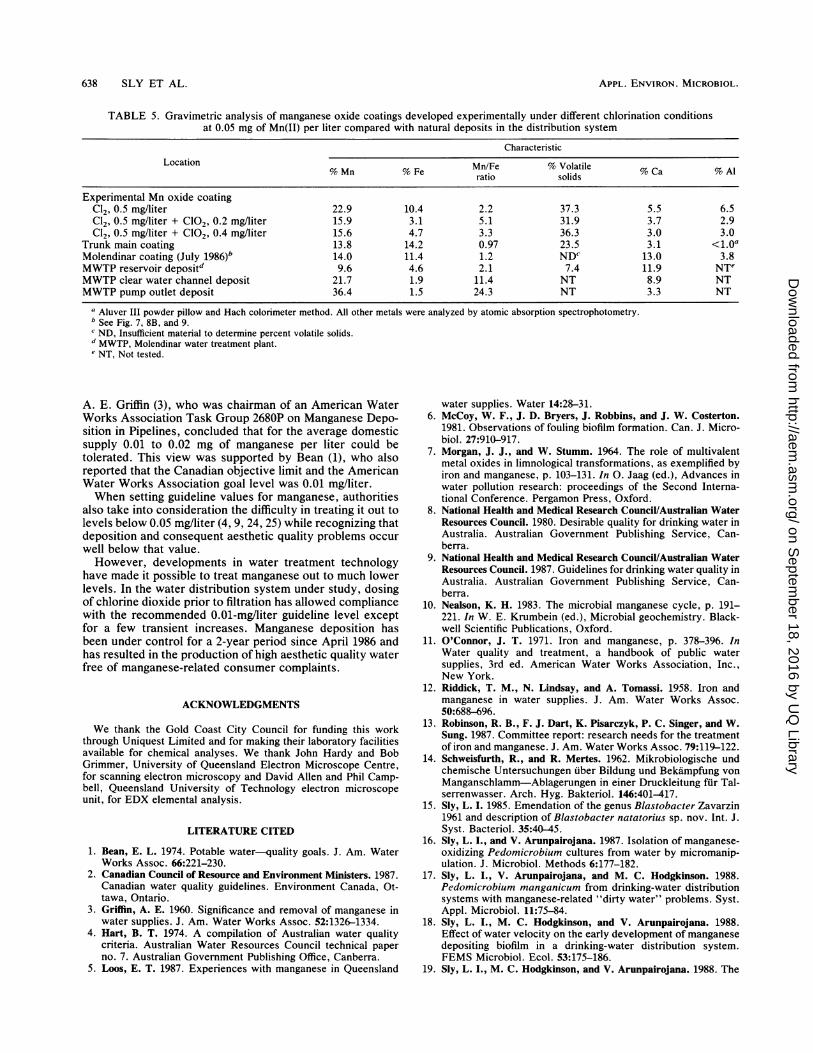
chemical deposition of manganese increased markedly whenchlorine levels were increased from 0.2 to 0.5 mg/liter. It wasalso shown that the addition of 0.2 to 0.4 mg of chlorinedioxide per liter to 0.5 mg of chlorine per liter reduced thedeposition by approximately 70% of that with 0.5 mg ofchlorine per liter alone and changed the color from black tobrown. However, the combination of 0.2 mg of chlorinedioxide and 0.2 mg of chlorine per liter increased the rate ofdeposition from that observed with 0.2 mg of chlorine perliter to a similar level. On the other hand, the deposition ofmanganese at a lower concentration of 0.01 mg/liter re-
mained low under all chlorination regimens (Fig. 10 and 11).For example, under chlorination conditions of 0.5 mg ofchlorine plus 0.2 mg of chlorine dioxide per liter, thedeposition rate at a manganese level of 0.05 mg/liter isapproximately 80 times higher than at 0.01 mg of manganeseper liter.Another matter of significance for the management of
distribution systems was the considerable difference in therate of chemical and microbial depositions of manganese.The data presented in Fig. 10 show that the chemicaldeposition of manganese is a much more acute problem, withrapid buildup occurring over a short period. However, itshould be emphasized that the biological deposition ofmanganese in nonchlorinated water was not studied over avery long period, and it would be expected that substantialbiological deposition would eventually occur. The rate ofbiological deposition in treated water observed atCoombabah indicates that it would take several years toapproach the chemical deposition which occurred in amonth.A further comparison between the rates of chemical and
VOL. 56, 1990
on Septem
ber 18, 2016 by UQ
Libraryhttp://aem
.asm.org/
Dow
nloaded from
APPL. ENVIRON. MICROBIOL.
FIG. 5. Scanning electron micrographs showing the diverse range of microorganisms observed in the manganese-depositing biofilm atCoombabah. Bars, 2 pm (A, B, D); 5 ,um (E, F); and 50 p.m (C).
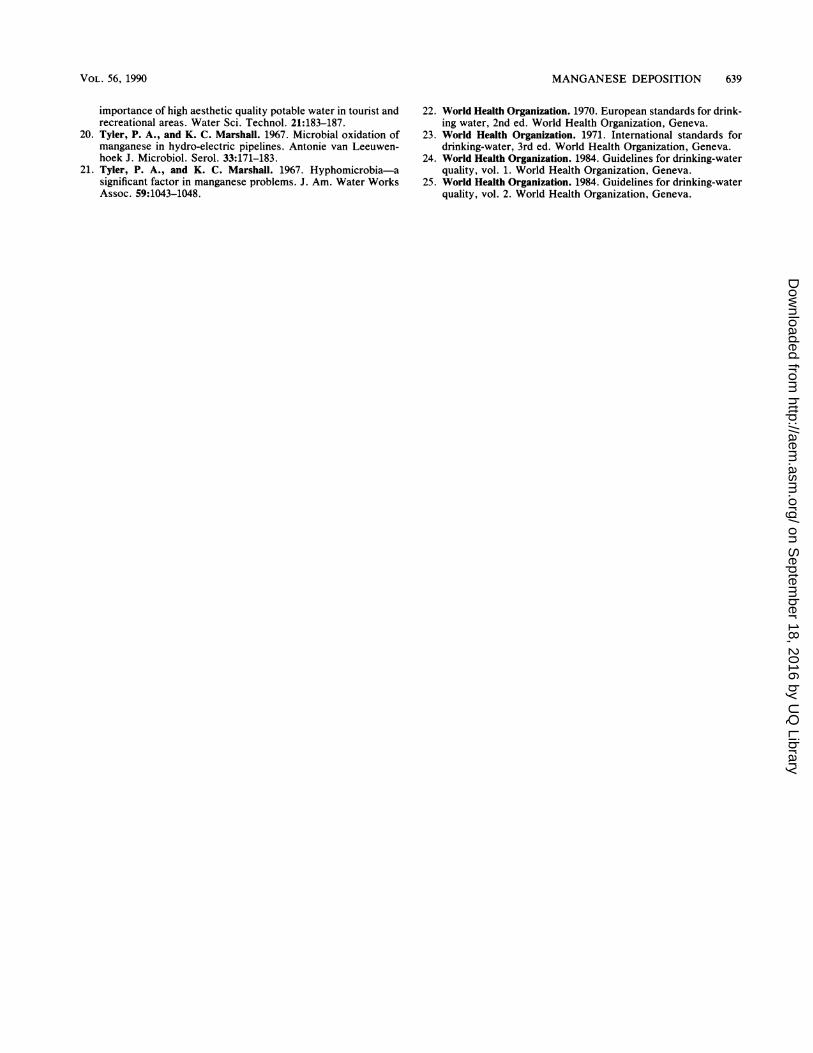
biological deposition may be made from the data presentedin Fig. 12. It can be seen that after 28 days the chemicaldeposition with 0.5 mg of chlorine per liter was approxi-mately 80 times higher than the biological deposition in thenonchlorinated treated water control. The difference wasreduced to approximately 20 times when 0.2 mg of chlorine
dioxide per liter was added to the chlorine. However, evenwhen the worst possible situation for the distribution systemwas considered by using nonchlorinated untreated waterwith 0.05 mg of manganous sulfate per liter, the rate ofbiological manganese deposition was only 20% of the chem-ical deposition rate with 0.5 mg of chlorine per liter. Reduc-
634 SLY ET AL.
on Septem
ber 18, 2016 by UQ
Libraryhttp://aem
.asm.org/
Dow
nloaded from
MANGANESE DEPOSITION 635
22
18
I.-
Ec
14
10
6-
2
2/3 30/3 27/4 25/5 22/6 20/7 17/8 14/9 12/10 9/11 7/12 4/1 1/2 1/3
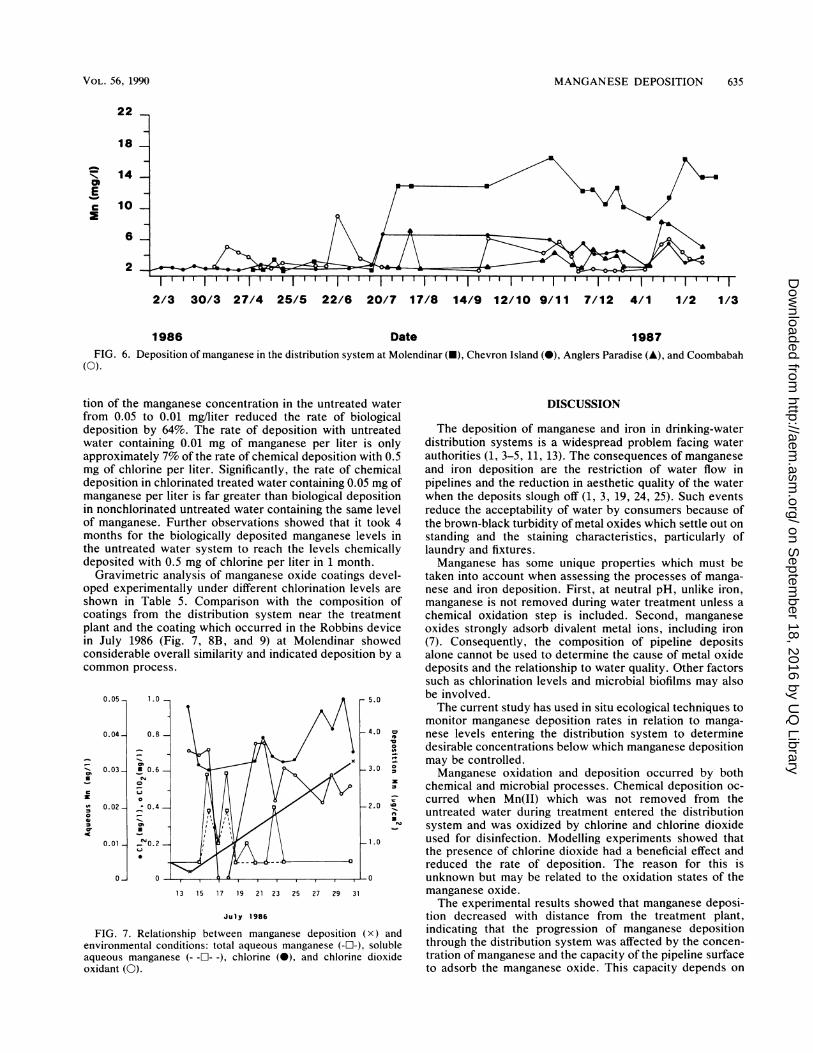
1986 Date 1987FIG. 6. Deposition of manganese in the distribution system at Molendinar (U), Chevron Island (0), Anglers Paradise (A), and Coombabah
(0).
tion of the manganese concentration in the untreated waterfrom 0.05 to 0.01 mg/liter reduced the rate of biologicaldeposition by 64%. The rate of deposition with untreatedwater containing 0.01 mg of manganese per liter is onlyapproximately 7% of the rate of chemical deposition with 0.5mg of chlorine per liter. Significantly, the rate of chemicaldeposition in chlorinated treated water containing 0.05 mg ofmanganese per liter is far greater than biological depositionin nonchlorinated untreated water containing the same levelof manganese. Further observations showed that it took 4months for the biologically deposited manganese levels inthe untreated water system to reach the levels chemicallydeposited with 0.5 mg of chlorine per liter in 1 month.
Gravimetric analysis of manganese oxide coatings devel-oped experimentally under different chlorination levels areshown in Table 5. Comparison with the composition ofcoatings from the distribution system near the treatmentplant and the coating which occurred in the Robbins devicein July 1986 (Fig. 7, 8B, and 9) at Molendinar showedconsiderable overall similarity and indicated deposition by acommon process.
0.05
0.04
4,
0.03
0.02
0.01
0_
1.0
0.8
7- 0.6.
C-I 0.4.-
-
-f'0.2.~
13 15 17 19 21 23 25 27 29 31
July 1986
FIG. 7. Relationship between manganese deposition (X) andenvironmental conditions: total aqueous manganese (-O-), solubleaqueous manganese (- -El- -), chlorine (0), and chlorine dioxideoxidant (0).
DISCUSSION
The deposition of manganese and iron in drinking-waterdistribution systems is a widespread problem facing waterauthorities (1, 3-5, 11, 13). The consequences of manganeseand iron deposition are the restriction of water flow inpipelines and the reduction in aesthetic quality of the waterwhen the deposits slough off (1, 3, 19, 24, 25). Such eventsreduce the acceptability of water by consumers because ofthe brown-black turbidity of metal oxides which settle out onstanding and the staining characteristics, particularly oflaundry and fixtures.Manganese has some unique properties which must be
taken into account when assessing the processes of manga-nese and iron deposition. First, at neutral pH, unlike iron,manganese is not removed during water treatment unless achemical oxidation step is included. Second, manganeseoxides strongly adsorb divalent metal ions, including iron(7). Consequently, the composition of pipeline depositsalone cannot be used to determine the cause of metal oxidedeposits and the relationship to water quality. Other factorssuch as chlorination levels and microbial biofilms may alsobe involved.The current study has used in situ ecological techniques to
monitor manganese deposition rates in relation to manga-nese levels entering the distribution system to determinedesirable concentrations below which manganese depositionmay be controlled.Manganese oxidation and deposition occurred by both
chemical and microbial processes. Chemical deposition oc-curred when Mn(II) which was not removed from theuntreated water during treatment entered the distributionsystem and was oxidized by chlorine and chlorine dioxideused for disinfection. Modelling experiments showed thatthe presence of chlorine dioxide had a beneficial effect andreduced the rate of deposition. The reason for this isunknown but may be related to the oxidation states of themanganese oxide.The experimental results showed that manganese deposi-
tion decreased with distance from the treatment plant,indicating that the progression of manganese depositionthrough the distribution system was affected by the concen-tration of manganese and the capacity of the pipeline surfaceto adsorb the manganese oxide. This capacity depends on
VOL. 56, 1990
on Septem
ber 18, 2016 by UQ
Libraryhttp://aem
.asm.org/
Dow
nloaded from
APPL. ENVIRON. MICROBIOL.
FIG. 8. Scanning electron micrographs showing the deposition of manganese at Molendinar before (A) and after (B) the chlorine-inducedoxidation and deposition of manganese in July 1986. Bars, 2 ,um (A2, B2); 10 p.m (Al, Bi).
the average water velocity which determines the shear forceand the width of the boundary layer in which the manganeseoxide remains protected. Once the capacity of the pipeline isexceeded or when higher flow rates occur, manganese oxidecoating will detach until an equilibrium is reached. Thisprocess may cause water of low aesthetic quality. Conse-quently, consumers close to the Molendinar water treatmentplant received dirty water immediately when manganese
30 -
20 MN
10
0 10 20
KeV
FIG. 9. EDX elemental analysis of the manganese oxide coatingshown in Fig. 8B.
levels continuously exceeded 0.02 mg/liter. However, in thedistribution system served by the Mudgeeraba water treat-ment plant in which consumers were more distant from theplant, there was a delay of a few days before dirty water wasreceived and the slightly higher level of 0.04 mg/liter couldbe tolerated (19).
Microbial manganese oxidation and deposition occurred inareas of the distribution system with insufficient chlorinationto control biofilm growth of the manganese-oxidizing bud-ding hyphal bacteria P. manganicum and Metallogenium sp.These microorganisms were shown to be the dominantmanganese-depositing bacteria in high-water-velocity condi-tions (18).The isolation of P. manganicum from dirty water sedi-
ments and from biofilm developed on the surface of samplestubs in Robbins devices at the Coombabah monitoringlaboratory demonstrated the relationship between manga-nese-depositing biofilm in the distribution system and dirtywater (16, 17).
Tyler and Marshall (20, 21) isolated cultures of manga-nese-oxidizing budding hyphal bacteria from hydroelectricpipelines and identified them as a Hyphomicrobium sp.However, the cultures of P. manganicum isolated fromdrinking-water distribution systems could be differentiatedfrom Tyler and Marshall's strain T37 on a number ofmorphological, physiological, and genetic characteristics(17). P. manganicum was shown to be a widespread cause ofmanganese-related dirty water in southeast Queensland,Australia. Cultures were isolated from the Gold Coast,
636 SLY ET AL.
on Septem
ber 18, 2016 by UQ
Libraryhttp://aem
.asm.org/
Dow
nloaded from
MANGANESE DEPOSITION 637
UUa'
0
c0._
4i.,-
0CL
K)
160
140
120
100
80
60
40
20
0
160
140
i._.cmC
0
0._
CL
K8
:
120
100
80
60
40
20
0
7 14 21 28
Days
FIG. 10. Effect of chlorination levels on deposition of manganeseoxide coating at 0.05 mg of Mn(II) per liter. Symbols: l, chlorine,0.2 mg/liter; 0, chlorine, 0.3 mg/liter; A, chlorine, 0.5 mg/liter; x,chlorine, 0.2 mg/liter, plus chlorine dioxide, 0.2 mg/liter; +, chlo-rine, 0.5 mg/liter, plus chlorine dioxide, 0.2 mg/liter; 0, chlorine, 0.5mg/liter, plus chlorine dioxide, 0.4 mg/liter; A, chlorine, 0.5 mg/liter,at 0.01 mg of manganese per liter.
Nambour, and Warwick and observed in many other distri-oution systems 17I).
Dirty water of microbial originby sporadic sloughing during perior intermittent chlorination of areDirty water sediments of micr
Eu
1-1cm
C
0-
4-
._-
2.0
1.0
0
7
D
FIG. 11. Effect of chlorination levat 0.01 mg of Mn per liter. Symbols:chlorine, 0.2 mg/liter; 0, chlorine,mg/liter, plus chlorine dioxide, 0.2 mgplus chlorine dioxide, 0.2 mg/liter; 4chlorine dioxide, 0.4 mg/liter.
.+
7 14 21 28
Days
FIG. 12. Comparison of chemical and microbial manganese dep-osition rates. Symbols: A, treated water [chlorine, 0.5 mg/liter;Mn(II), 0.05 mg/liter]; +, treated water [0.5 mg/liter, chlorine, +chlorine dioxide, 0.2 mg/liter; Mn(II), 0.05 mg/liter]; 0, raw water[nonchlorinated; Mn(II), 0.05 mg/liter]; *, raw water [nonchlori-nated; Mn(II), 0.01 mg/liter]; 0, treated water [nonchlorinated;Mn(II), 0.05 mg/liter]; M, treated water [nonchlorinated; Mn(II),0.01 mg/liter].
distinguished by the ubiquitous presence of budding hyphalwas localized and caused bacteria.
iods of increased flow rates Control of manganese-depositing biofilm in a water distri-as usually free of chlorine. bution system by increasing chlorination levels at the treat-obial origin were readily ment plant will not reduce manganese deposition when
excessive Mn(II) continues to enter the distribution system.In fact, increased chlorination levels may considerablyworsen chemical oxidation and deposition and cause moreserious and widespread dirty water because the rate ofchemical deposition is considerably greater than microbialdeposition.
Guideline levels for manganese in drinking water are set tominimize deposition and staining and vary widely from 0.01to 0.1 mg/liter. This study has shown that significant man-ganese deposition occurred at 0.03 mg/liter, and associatedresearch on the consumer acceptability of water showed thatmanganese-related dirty water began to occur when manga-nese concentrations continuously exceeded 0.02 mg/liter (19;L. I. Sly, M. C. Hodgkinson, and V. Arunpairojana, submit-ted for publication). Even levels of 0.02 mg/liter for 2 to 3days or 0.03 mg/liter for 1 to 2 days resulted in a smallnumber of complaints.On the basis of our studies, we believe that the guideline
level for manganese should be 0.01 mg/liter (i.e., <0.02mg/liter) for minimal deposition. Even at this level adequatechlorination of 0.2 mg of chlorine per liter is essential toavoid microbial deposition of manganese. The recommended
14 21 28 level is considerably lower than the World Health Organiza-tion guideline of 0.05 mg/liter (23) commonly followed by
ay s many water authorities. However, when setting the current
els on deposition of manganese guideline value of 0.1 mg/liter (24), the World Health Organ-A, nonchlorinated control; 0, ization recognized that "even at a concentration of 0.050.5 mg/liter; x, chlorine, 0.2 mg/litre, manganese will often form a coating on pipes which/liter; V, chlorine, 0.5 mg/liter, may slough off as a black precipitate," and in supporting*, chlorine, 0.5 mg/liter, plus data revised the level to 0.02 mg/liter (24, 25). The latter
value is based on earlier comments in the literature. In 1960,
VOL. 56, 1990
on Septem
ber 18, 2016 by UQ
Libraryhttp://aem
.asm.org/
Dow
nloaded from
APPL. ENVIRON. MICROBIOL.
TABLE 5. Gravimetric analysis of manganese oxide coatings developed experimentally under different chlorination conditionsat 0.05 mg of Mn(II) per liter compared with natural deposits in the distribution system
CharacteristicLocation M/e%Vltl% Mn % Fe Mra/iFe solids % Ca % Al
Experimental Mn oxide coatingCl2, 0.5 mg/liter 22.9 10.4 2.2 37.3 5.5 6.5Cl2, 0.5 mg/liter + C102, 0.2 mg/liter 15.9 3.1 5.1 31.9 3.7 2.9Cl2, 0.5 mg/liter + C102, 0.4 mg/liter 15.6 4.7 3.3 36.3 3.0 3.0
Trunk main coating 13.8 14.2 0.97 23.5 3.1 <1.0aMolendinar coating (July 1986)b 14.0 11.4 1.2 NDC 13.0 3.8MWTP reservoir depositd 9.6 4.6 2.1 7.4 11.9 NTeMWTP clear water channel deposit 21.7 1.9 11.4 NT 8.9 NTMWTP pump outlet deposit 36.4 1.5 24.3 NT 3.3 NT
a Aluver III powder pillow and Hach colorimeter method. All other metals were analyzed by atomic absorption spectrophotometry.b See Fig. 7, 8B, and 9.ND, Insufficient material to determine percent volatile solids.
d MWTP, Molendinar water treatment plant.NT, Not tested.
A. E. Griffin (3), who was chairman of an American WaterWorks Association Task Group 2680P on Manganese Depo-sition in Pipelines, concluded that for the average domesticsupply 0.01 to 0.02 mg of manganese per liter could betolerated. This view was supported by Bean (1), who alsoreported that the Canadian objective limit and the AmericanWater Works Association goal level was 0.01 mg/liter.When setting guideline values for manganese, authorities
also take into consideration the difficulty in treating it out tolevels below 0.05 mg/liter (4, 9, 24, 25) while recognizing thatdeposition and consequent aesthetic quality problems occurwell below that value.However, developments in water treatment technology
have made it possible to treat manganese out to much lowerlevels. In the water distribution system under study, dosingof chlorine dioxide prior to filtration has allowed compliancewith the recommended 0.01-mg/liter guideline level exceptfor a few transient increases. Manganese deposition hasbeen under control for a 2-year period since April 1986 andhas resulted in the production of high aesthetic quality waterfree of manganese-related consumer complaints.
ACKNOWLEDGMENTS
We thank the Gold Coast City Council for funding this workthrough Uniquest Limited and for making their laboratory facilitiesavailable for chemical analyses. We thank John Hardy and BobGrimmer, University of Queensland Electron Microscope Centre,for scanning electron microscopy and David Allen and Phil Camp-bell, Queensland University of Technology electron microscopeunit, for EDX elemental analysis.
LITERATURE CITED
1. Bean, E. L. 1974. Potable water-quality goals. J. Am. WaterWorks Assoc. 66:221-230.
2. Canadian Council of Resource and Environment Ministers. 1987.Canadian water quality guidelines. Environment Canada, Ot-tawa, Ontario.
3. Griffin, A. E. 1960. Significance and removal of manganese inwater supplies. J. Am. Water Works Assoc. 52:1326-1334.
4. Hart, B. T. 1974. A compilation of Australian water qualitycriteria. Australian Water Resources Council technical paperno. 7. Australian Government Publishing Office, Canberra.
5. Loos, E. T. 1987. Experiences with manganese in Queensland
water supplies. Water 14:28-31.6. McCoy, W. F., J. D. Bryers, J. Robbins, and J. W. Costerton.
1981. Observations of fouling biofilm formation. Can. J. Micro-biol. 27:910-917.
7. Morgan, J. J., and W. Stumm. 1964. The role of multivalentmetal oxides in limnological transformations, as exemplified byiron and manganese, p. 103-131. In 0. Jaag (ed.), Advances inwater pollution research: proceedings of the Second Interna-tional Conference. Pergamon Press, Oxford.
8. National Health and Medical Research Council/Australian WaterResources Council. 1980. Desirable quality for drinking water inAustralia. Australian Government Publishing Service, Can-berra.
9. National Health and Medical Research Council/Australian WaterResources Council. 1987. Guidelines for drinking water quality inAustralia. Australian Government Publishing Service, Can-berra.
10. Nealson, K. H. 1983. The microbial manganese cycle, p. 191-221. In W. E. Krumbein (ed.), Microbial geochemistry. Black-well Scientific Publications, Oxford.
11. O'Connor, J. T. 1971. Iron and manganese, p. 378-396. InWater quality and treatment, a handbook of public watersupplies, 3rd ed. American Water Works Association, Inc.,New York.
12. Riddick, T. M., N. Lindsay, and A. Tomassi. 1958. Iron andmanganese in water supplies. J. Am. Water Works Assoc.50:688-696.
13. Robinson, R. B., F. J. Dart, K. Pisarczyk, P. C. Singer, and W.Sung. 1987. Committee report: research needs for the treatmentof iron and manganese. J. Am. Water Works Assoc. 79:119-122.
14. Schweisfurth, R., and R. Mertes. 1962. Mikrobiologische undchemische Untersuchungen uber Bildung und Bekampfung vonManganschlamm-Ablagerungen in einer Druckleitung fur Tal-serrenwasser. Arch. Hyg. Bakteriol. 146:401-417.
15. Sly, L. I. 1985. Emendation of the genus Blastobacter Zavarzin1961 and description of Blastobacter natatorius sp. nov. Int. J.Syst. Bacteriol. 35:40-45.
16. Sly, L. I., and V. Arunpairojana. 1987. Isolation of manganese-oxidizing Pedomicrobium cultures from water by micromanip-ulation. J. Microbiol. Methods 6:177-182.
17. Sly, L. I., V. Arunpairojana, and M. C. Hodgkinson. 1988.Pedomicrobium manganicum from drinking-water distributionsystems with manganese-related "dirty water" problems. Syst.Appl. Microbiol. 11:75-84.
18. Sly, L. I., M. C. Hodgkinson, and V. Arunpairojana. 1988.Effect of water velocity on the early development of manganesedepositing biofilm in a drinking-water distribution system.FEMS Microbiol. Ecol. 53:175-186.
19. Sly, L. I., M. C. Hodgkinson, and V. Arunpairojana. 1988. The
638 SLY ET AL.
on Septem
ber 18, 2016 by UQ
Libraryhttp://aem
.asm.org/
Dow
nloaded from
MANGANESE DEPOSITION 639
importance of high aesthetic quality potable water in tourist andrecreational areas. Water Sci. Technol. 21:183-187.
20. Tyler, P. A., and K. C. Marshall. 1967. Microbial oxidation ofmanganese in hydro-electric pipelines. Antonie van Leeuwen-hoek J. Microbiol. Serol. 33:171-183.
21. Tyler, P. A., and K. C. Marshall. 1967. Hyphomicrobia-asignificant factor in manganese problems. J. Am. Water WorksAssoc. 59:1043-1048.
22. World Health Organization. 1970. European standards for drink-ing water, 2nd ed. World Health Organization, Geneva.
23. World Health Organization. 1971. International standards fordrinking-water, 3rd ed. World Health Organization, Geneva.
24. World Health Organization. 1984. Guidelines for drinking-waterquality, vol. 1. World Health Organization, Geneva.
25. World Health Organization. 1984. Guidelines for drinking-waterquality, vol. 2. World Health Organization, Geneva.
VOL. 56, 1990
on Septem
ber 18, 2016 by UQ
Libraryhttp://aem
.asm.org/
Dow
nloaded from