a computational fluid dynamics model for investigating air … · africa’s coal production is by...
TRANSCRIPT

Introduction
Coal is the most widely used primary fuel,accounting for about 36% of the total fuelconsumption of the world’s electricityproduction. According to Thopil and Pouris(2010), 68% of South Africa’s primary energyneeds are provided by coal. Coal can beextracted either by opencast or undergroundoperations. Approximately 50% of SouthAfrica’s coal production is by undergroundmining.
In underground coal mines differentextraction methods are used depending uponthe geological formations and other factors.The two major extraction methods are thebord-and-pillar and the longwall. Bord-and-pillar mining is the most common type ofunderground coal mining globally (Peng andChiang, 1984). Cutting operations areperformed using a continuous miner (CM) thatmakes extended cuts, known as box cuts, intothe mining face. To complete a cuttingoperation the CM makes four cuts. In someSouth African coal mines these cuts may eachbe 17.5 m long and 3.5 m wide. Figure 1shows a plan view of an underground bord-and-pillar layout. The final depth of the in-heading might be up to 35 m, the width up to7 m, and the height depends on the thicknessof the coal seam.
fThe extraction of coal, especially byunderground mining, is associated with anumber of hazards. Airborne dust andmethane gas are a risk to the miners andmining equipment. High concentrations ofrespirable coal dust are known to be a cause oflung disease (Chander et al., 1990; Cheng andZukovich, 1973), and should be avoided.
Methane gas and coal dust can causeexplosions that result in injuries and fatalities.In South Africa, since the first coal mineexplosion at Elandslaagte colliery in 1891, afurther 333 explosions resulted in 1 034deaths by the end of 1990 (Flint, 1990).According to Nundlall (1996) 78 flammablegas explosions, some of which were in coalmines, occurred in South Africa between 1988and 2005. Liu et al. (2010) conducted ananalysis of coal mine accidents in China from2005 to 2009. More than 3000 gas accidentswere reported in this period. Several attemptshave been made, with success, to improve coalmine safety. Esterhuizen and Gürtunca (2006)outlined the positive impact that research canhave on reducing coal mining accidents. Theyreported improvements with regards to thereduction of respiratory diseases, noise-induced hearing loss, musculoskeletaldisorders, traumatic injuries, mine disasters(including reducing and monitoring the risk offlammable atmosphere ignition), and fatalitiesand injuries due to ground failure. It wasshown that a significant reduction in coalmining fatalities has been achieved byimplementing a wide range of strategies andsolutions.
Since coal dust and methane gas causecoal mine accidents, their concentrations mustbe kept low. The Department of MineralResources (DMR) in South Africa issued a
A computational fluid dynamics model forinvestigating air flow patterns inunderground coal mine sectionsby D.D. Ndenguma*, J. Dirker*, and N.D.L. Burger*
SynopsisThis investigation compares the results from an experimental andnumerical study of air flow in a scaled-down underground coal mine model.This was done in order to determine if numerical analysis can be reliedupon when searching for ventilation solutions to control high concen-tration of coal dust and methane gas in underground coal mines. Steadystate analyses were used to identify flow patterns and recirculation regionswithin the mining section while transient state analyses were used todetermine the time taken to extract the initial air from the model. Theagreement between the experimental and numerical results indicates thatnumerical modelling is useful in this regard. The study went further todevise a method of determining the optimum position of the jet fan that isresponsible for mine-gas dilution at different stages of mining.
Keywordsnumerical modelling, computation fluid dynamics, CFD, mine ventilation.
* Department of Mechenical and AeronauticalEngineering, University of Pretoria, Pretoria, South Africa.
© The Southern African Institute of Mining andMetallurgy, 2014. ISSN 2225-6253. Paper receivedrrJun. 2011; revised paper received Jan. 2014.
419The Journal of The Southern African Institute of Mining and Metallurgy VOLUME 114 JUNE 2014 ▲

A computational fluid dynamics model for investigating air flow patterns
directive that the dust and methane concentration inunderground coal mines should not exceed 2.0 mg/m³ and0.5% by volume, respectively. Ventilation is a populartechnique that is used to control dust and methane gas inunderground coal mines to allowable concentrations. A jetfan is frequently employed as a source of air flow to ventilatethe in-heading. A higher air speed may, however, increaseairborne coal dust concentrations and increased ventilationrates should therefore be employed with care. A scrubber thatis mounted on the CM also plays a big role in reducing dustand methane gas, since if operating properly it will removeparticles from the air stream flowing over the machine.
Due to tight production schedules and harsh environ-mental conditions, it is difficult and costly to carry outexperiments in operational coal mines. Therefore, thisinvestigation was done using a comparatively inexpensive,and safer, computational fluid dynamics (CFD) modellingtechnique. This approach is aimed at aiding the search forsolutions to problems associated with airborne dust and highmethane gas concentrations in underground coal mines. CFDtechniques have been used in the past for mining ventilationstudies, but experimental validation is needed (Wala et al.,2007). In this investigation a scaled-down model of anunderground coal mine was used to validate the CFD model,wwhich allows predictions using the CFD model to be extendedto full-scale applications.
Steady-state and transient-state investigations were donenumerically and experimentally for a scaled-downunderground coal mine model. The experimental results wereused to validate the numerical analysis. Further numericalanalysis was carried out in order to develop a method fordetermining the optimum position range of the jet fan atdifferent lengths of in-heading.
Test facility
Steady-state and transient-state experiments were conductedusing a 15% scale underground coal mine model, shown inFigure 2. The intention in using a scale model was not torepresent a full-scale mine, but rather to validate the CFDmodel. This technique can later be used to simulate a full-scale mine.
All the walls of the model were made from hardboardexcept for the top and one side of the in-heading, which wereconstructed from clear Perspex to enable observation. Smokewwas used to visualize air motion during steady-state testsand to represent methane gas concentration during transienttests. The inside surface of the walls and floor were black to
fimprove smoke visibility. Important dimensions of the modelin-heading were as follows: 2 333 mm deep, 420 mm wide,and 333 mm high. These were representative of an actualmine section, which in some cases may have a depth of 35 m,width of 7 m, and a height of 5 m (see also Figure 1).
Air flow rates were scaled using a percentage volume flowmethod to resemble conditions in full-scale mining sectionsduring mining. In this method, the number of air changes perhour for the scaled model was the same as for the generalfull-scale application. Other suitable non-dimensionalparameters that would have led to a reasonable represen-tation of the full-scale application could not be identified. Airflow in the through-road was induced by a fan at the taperedoutlet of the through-road. This air velocity was set at 0.0665m/s at the centre of the through-road, representing 2 m/s inan actual mine. The jet fan was represented by means of anozzle connected to a compressed air system. The nozzle wasdesigned to achieve a jet-stream penetration of 1.733 m(equivalent to the 26 m obtained with actual miningequipment in a full-scale simulation, as measured experi-mentally at the Kloppersbos testing facility in South Africa)into the in-heading with a velocity of 10 m/s at the nozzleexit. The nozzle had a 10 mm exit diameter. The air flow wasregulated with a pressure control valve while the air velocitywas measured by an anemometer. The flow rate of thescrubber on the continuous miner was implemented in thescaled model by means of a speed-controlled fan. Thisrepresented a common operational configuration where thefiltered air is rejected directly backwards, and not towards thesidewall of the in-heading. Conditions both with and withoutthe scrubber in operation were considered.
Transient-state tests required measurement of the smokeconcentration. A measuring system consisting ofphotoelectric sensors, a data acquisition unit, and a computer,shown schematically in Figure 3, was used. Photoelectricsensors, (shown schematically in Figure 4) were constructedto detect the intensity of light reflected from smoke particles.A higher light intensity related to a higher smoke concen-tration. For each sensor, a light-emitting diode (LED) wasused as light source in one compartment while a phototran-sistor was located in the other compartment. As light was
▲
420 JUNE 2014 VOLUME 114 The Journal of The Southern African Institute of Mining and Metallurgy
Figure 1—A plan view of underground coal mine layout during mining
Figure 2—The coal mine model scaled down to 15% that was used forthe verification experiments
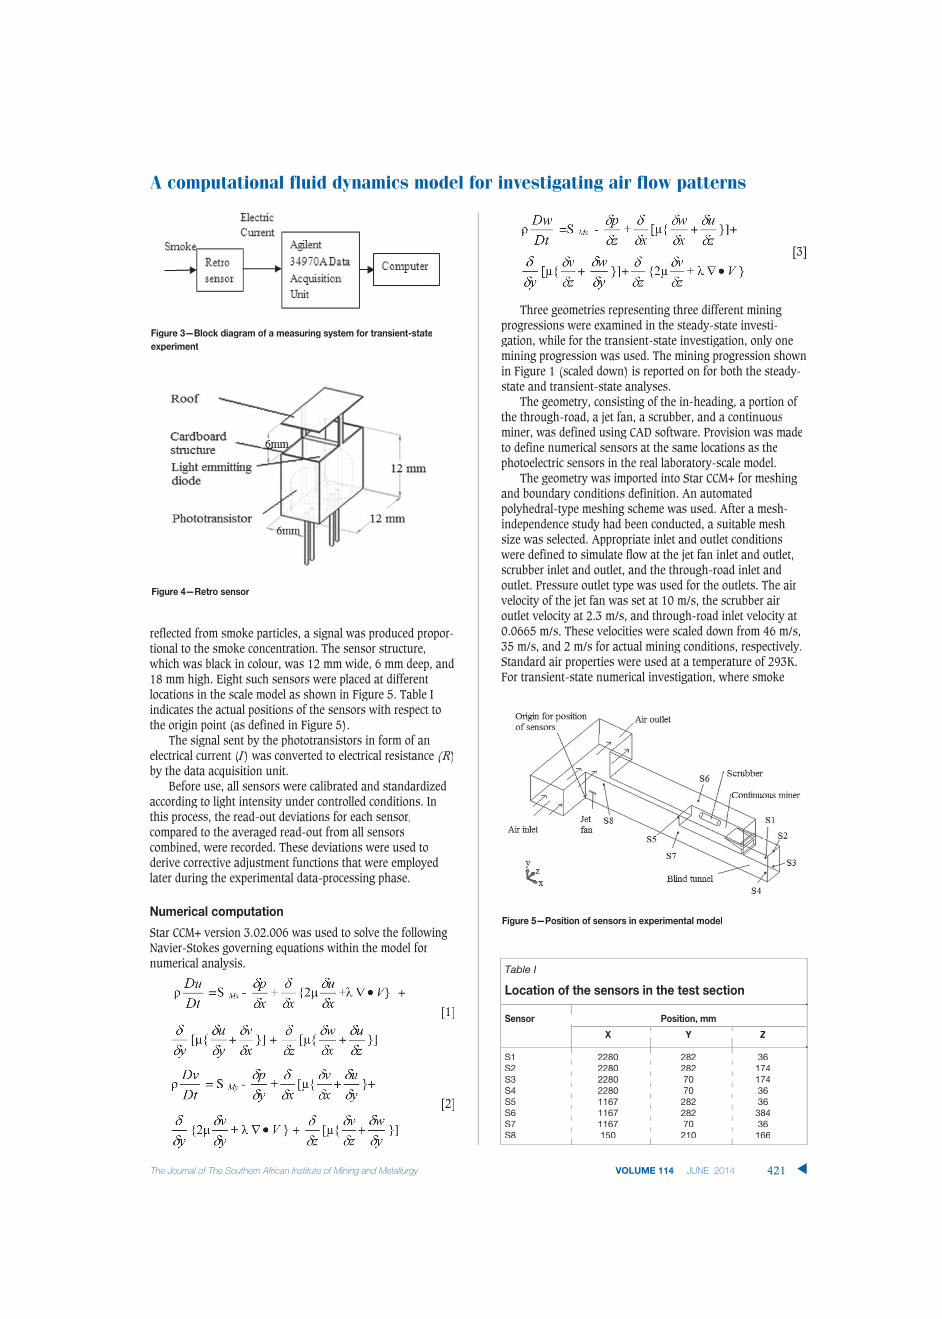
reflected from smoke particles, a signal was produced propor-tional to the smoke concentration. The sensor structure,wwhich was black in colour, was 12 mm wide, 6 mm deep, and18 mm high. Eight such sensors were placed at differentlocations in the scale model as shown in Figure 5. Table Iindicates the actual positions of the sensors with respect tothe origin point (as defined in Figure 5).
The signal sent by the phototransistors in form of anelectrical current (I(( ) was converted to electrical resistance (R)by the data acquisition unit.
Before use, all sensors were calibrated and standardizedaccording to light intensity under controlled conditions. Inthis process, the read-out deviations for each sensor,compared to the averaged read-out from all sensorscombined, were recorded. These deviations were used toderive corrective adjustment functions that were employedlater during the experimental data-processing phase.
Numerical computation
Star CCM+ version 3.02.006 was used to solve the followingNavier-Stokes governing equations within the model fornumerical analysis.
[1]
[2]
[3]
Three geometries representing three different miningprogressions were examined in the steady-state investi-gation, while for the transient-state investigation, only onemining progression was used. The mining progression shownin Figure 1 (scaled down) is reported on for both the steady-state and transient-state analyses.
The geometry, consisting of the in-heading, a portion ofthe through-road, a jet fan, a scrubber, and a continuousminer, was defined using CAD software. Provision was madeto define numerical sensors at the same locations as thephotoelectric sensors in the real laboratory-scale model.
The geometry was imported into Star CCM+ for meshingand boundary conditions definition. An automatedpolyhedral-type meshing scheme was used. After a mesh-independence study had been conducted, a suitable meshsize was selected. Appropriate inlet and outlet conditionswere defined to simulate flow at the jet fan inlet and outlet,scrubber inlet and outlet, and the through-road inlet andoutlet. Pressure outlet type was used for the outlets. The airvelocity of the jet fan was set at 10 m/s, the scrubber airoutlet velocity at 2.3 m/s, and through-road inlet velocity at0.0665 m/s. These velocities were scaled down from 46 m/s,35 m/s, and 2 m/s for actual mining conditions, respectively.Standard air properties were used at a temperature of 293K.For transient-state numerical investigation, where smoke
A computational fluid dynamics model for investigating air flow patterns
421The Journal of The Southern African Institute of Mining and Metallurgy VOLUME 114 JUNE 2014 ▲
Figure 3—Block diagram of a measuring system for transient-stateexperiment
Figure 4—Retro sensor
Figure 5—Position of sensors in experimental model
Table I
Location of the sensors in the test section
Sensor Position, mm
X Y Z
S1 2280 282 36S2 2280 282 174S3 2280 70 174S4 2280 70 36S5 1167 282 36S6 1167 282 384S7 1167 70 36S8 150 210 166
Y
282282707028228270210

A computational fluid dynamics model for investigating air flow patterns
f f fconcentration had to be modelled, fresh air from the jet fanand smoke were represented by a molecular weight of 29kg/kmol and 800 kg/kmol respectively. The properties of thesmoke phase in the numerical model were chosen to matchthe real properties as closely as possible.
Table II summarizes the CFD modelling settings used todefine the physical phenomenon of steady- and transient-state analyses.
Steady-state tests
In the steady-state investigation the aim was to identify airflow patterns in the in-heading. Three different minegeometries representing different mining progressions werestudied, but only one geometry is presented here. For all teststhe jet fan in the scale model was located 80 mm into the in-heading, 67 mm from the sidewall, and 47 mm above thefloor. Smoke was released from a smoke-producing deviceinto the in-heading through plastic tubes 5 mm in diameter.These were inserted through the floor of the model at numberof grid points as shown in Figure 6. The tube ends were alsoset at three different heights in order to observe as manypoints as possible.
Smoke was produced by burning a glycol/water mixturein a well-ventilated laboratory. The mixture was pumpedfrom the tank into a container where it was sprayed onto aheater element to produce smoke. The smoke was introducedinto the test section through the tube network.
Video clips of the flow patterns of air in the test sectionwwere recorded for analysis. Figure 7 shows a still image ofsmoke entering the test section. The video clips were recordedfrom the top and the side of test section.
The experimental procedure was as follows.
1. The valve on the compressed air system was openedto induce the correct volumetric flow rate and velocityat the nozzle representing the jet fan
2. The smoke tubes were inserted into three consecutiveholes along the width of the in-heading and set atsame level or height at a single time. The heights thatwere used were 47 mm, 165 mm, and 250 mm,measured from floor level. All other holes on the floorwere sealed off to avoid air leakages
3. A digital camera was set to capture data in form ofvideo clips
4. The smoke-producing device, the through-road fan,and observation light were all switched on and thelaboratory lights were switched off
ff f5. Once sufficient smoke flow was established, imagecapturing was initiated
6. After capturing data at one position, the three tubeswere set again at a different level or the next set ofholes. Steps 3 to 5 were repeated until all thedesignated points in the test section had beeninvestigated.
Comparison of steady-state experimental andnumerical results
The smoke direction observed from video clips was convertedinto vector format. In Figures 8A and 8B arrows are used toindicate the smoke direction obtained in this fashion. Thearrows indicate direction only, and not velocity. Experimentalresults on arbitrary planes are shown here for graphicalrepresentation purposes only. Also shown are the numericalsteady-state results from the top and the side view. Although
▲
422 JUNE 2014 VOLUME 114 The Journal of The Southern African Institute of Mining and Metallurgy
Table II
Physics model of continuum for steady-state and transient conditions
Steady state Transient state
Space Three–dimensional Three-dimensionalMotion Stationary StationaryMaterial Gas Multi-component gasFlow Segregated SegregatedState of equation Constant density Constant densityTime Steady TransientViscosity regime Turbulent TurbulentReynolds-averaged turbulence K-epsilon K-epsilonOptional physics model Segregated fluid temperature Segregated fluid temperature
K-epsilonSegregated fluid temperature
Figure 6—Positions of smoke tubes in the floor of the heading
Figure 7—Smoke entering the test section at points E1, E2, and E3 forobservation of air flow direction

the scrubber was involved in both methods, the air flowpattern of the scrubber is not included in the steady-stateresults for graphical representation purposes.
As can be seen, the air flow patterns for the experimentand simulation were similar. The air flow in both cases isrecirculating. This is not desirable for the purpose of dilutingmethane gas. The results for the other two geometriesshowed similar results. From this it was concluded that thenumerical and experimental results are in agreement. Basedon full-scale experimental measurements at the Kloppersbosfacility, similar recirculation patterns and penetration depthswwould be present with actual mining conditions andequipment. It could be argued that the flow pattern distri-bution is non-dimensional in nature.
Transient-state tests
Only a single mine geometry was used in the transient-stateanalysis, compared with three geometries in the steady-stateanalysis. Eight photoelectric sensors, as described earlier,wwere used to monitor smoke concentration levels at differentlocations in the in-heading.
The following sequence of activities was carried out tocomplete the transient-state experiment.
1. Phototransistors were connected to the data card2. The smoke-producing device was placed inside the
test section3. All inlets and outlets of the test section were sealed
off.4. Laboratory lights were switched off to avoid affecting
the phototransistors5. The light-emitting diodes were switched on6. Scans were initiated on the data acquisition unit and
readings were taken at intervals of 1 second7. The smoke-producing device was switched on to fill
the test section with smoke8. After 5 minutes the smoke-producing device was
removed carefully to prevent smoke from escapingfrom the test section.
9. The jet fan, scrubber fan, and the through-road fanwere switched on. At the same time the seals on thethrough-road inlet and outlet were removed. Thismarked the beginning of smoke extraction process
f10. The smoke extraction process was left to run until allthe smoke had been removed from the test section.This was determined when the readings from thesmoke sensors stabilized
11. Logged data was stored and analysed.
It was found that smoke from the glycol/water mixturewas not suitable due its high moisture content, whichcondensed inside the scale model. As an alternative, smokewas produced by a smouldering process, using differentwood-based solids as fuel, in a low-oxygen environment forsafety reasons.. This produced smoke with little or nomoisture content at a fast enough rate to fill the scale model.A well-ventilated laboratory was used.
Transient-state experimental and numerical results
Results for three of the eight sensors are presented anddiscussed here. These sensors are numbers 3, 7, and 8 asdefined in Figure 5. To make the comparison moremeaningful, both the experimental and numerical results areplotted on the same graphs. For this reason, the smokeconcentration scale, which was measured proportionally aselectrical resistance from the smoke sensors, was adjusted tomatch the mass-fraction scale obtained from the numericalresults on the graphs when all the smoke has beenevacuated. The scaling factor employed was determined fromthe smoke sensor readings at the beginning of a test (whenthe whole model was filled with smoke), and at the end of atest (when all smoke were cleared and steady-state smokeconcentration was reached). These points were matched withthe numerical mass fraction of air values at the beginningand at the end of the numerical simulation test run. Only therelative smoke extraction rate, as determined experimentallyand numerically, is thus of interest.
Figure 9 shows the plots of mass fraction of air againsttime as the fresh air from the jet fan diluted and expelled thesmoke from the in-heading. At mass fraction zero and timezero the in-heading was filled with smoke, but as the air wasblown into the in-heading the mass fraction of gas mixtureincreased until the in-heading was almost completely filledwith air. The matching experimental smoke concentration isplotted using the same time axes as for the numerical results.
As can be seen, for each sensor the time-dependent shapeof the plots for both experiment and numerical resultsappears to be similar. Of greatest importance is that thenumerical results predicted the time needed to clear the modelfrom smoke with relatively good accuracy.
Some deviations between the two sets of results werefound (Figure 9) and can be attributed to the following:
1. Friction between air and model wall in the experi-mental set-up was disregarded in the numericalanalysis
2. During the experiment there was a gap of about 3seconds between the opening of the in-heading inletand outlet and the switching on of the fans, while inthe numerical model these activities took placesimultaneously
3. The K-KK єmodel used in numerical analysis was basedon recommended settings for general boundary layercalculations. More suitable setting may exist.
A computational fluid dynamics model for investigating air flow patterns
The Journal of The Southern African Institute of Mining and Metallurgy VOLUME 114 JUNE 2014 423 ▲
Figure 8—Plan view of air flow patterns for the experiment (top) andnumerical analysis (bottom)

A computational fluid dynamics model for investigating air flow patterns
Development of a method for determining optimumfan position for a simplified geometry
Owing to the relatively good correlation between experi-mental and numerical results for both the steady and thetransient states, numerical-based analyses can be used todetermine, for instance, the optimum geometry of a jet fan ina blind in-heading.
Fan positions that result in minimum smoke extractiontimes for five different in-heading lengths and two differentwwidths were established. A full width (WmhWW = 420 mm) andhalf width (WmhWW = 210 mm) were explored. The results forthe width of 210 mm are included only for purposes ofillustration, since in this case there would be no space for thejjet fan.
The fan position was varied along the in-heading length,but its position with respect to the floor and the sidewallremained fixed. Since the last through-road is the mostproblematic area as far as dust and methane gas extraction isconcerned, the wall at the blind end was used as a sensorposition.
fA full in-heading length, Lmh = 2333 mm in the scaledmodel, is used here to illustrate how the searching exercisefor optimum fan positions for different in-heading lengthswas accomplished. The results for the four positions LfL =0 mm, LfL = 80 mm, LfL = 500 mm, and LfL = 1000 mm areshown in Figure 11. The extraction times that were obtainedfrom these positions were 285, 165, 560, and 765 secondsrespectively. The extraction time is defined as the timeneeded to reach a mass fraction of air of 0.99 (a massfraction of smoke of 0.01).
Additional search cases were conducted, which confirmedthat LfL = 80 mm was the optimum position for the in-headinglength of 2333 mm. The searching exercise revealed theoptimum fan position for different in-heading lengths, asshown in Table III.
▲
424 JUNE 2014 VOLUME 114 The Journal of The Southern African Institute of Mining and Metallurgy
Figure 9—Comparison of the rate of extraction of initial volume of air byexperiment and CFD methods at sensor locations 3, 7, and 8
Figure 10—Plan view of the mine showing fan position. Lmh and WmhWWare the scaled model heading length and width respectively, while Lf isthe fan position with respect to the heading entrance
Figure 11—Graph of mass fraction of air against time, showing the timetaken to extract smoke at four different fan positions
Table III
Optimum fan position for five different headinglengths with two different heading widths
Heading Length Fan Position in mm (Lf)
in mm (Lh) Heading Width = 420mm Heading Width = 210mm
467 15 20933 35 501400 80 1101867 70 952333 80 100

Some optimum results
From the results in Table III, a graph of fan position againstin-heading length was plotted as shown in Figure 12.
This graph shows that for widths of both 420 mm and210 mm, the trends for the optimum LfL value are similar. Fora given in-heading length, the optimum LfL value was greaterfor a width of 210 mm than for a width of 420 mm. Thisindicates that for narrower blind tunnels, the optimum jet fanposition appears to be deeper into the tunnel. The optimumfan position is, however, also influenced by factors such asthe tunnel height and volume flow rates, but a discussion ofthese falls beyond the scope of this paper. Similarbehavioural trends regarding the optimum position of the jetfan could be extrapolated to full-scale scenarios, providedthat the in-heading aspect ratios in terms of depth, height,and width remain the same.
Conclusions
VVentilation techniques are currently used to mitigate theproblems of coal dust and methane gas concentrations. Theobjective of this study was to investigate whether a numericaltechnique can be used to investigate the best methods ofcontrolling dust and methane gas concentrations inunderground coal mines. Due to practical limitation, CFDmodelling and experiments were conducted on a scaled-downunderground coal mine model instead of at an actual mine.
The numerical and experimental investigations yieldedsimilar results for both steady- and transient-state cases.From this it was concluded that a numerical technique couldbe used to establish optimized ventilation conditions inscaled-down blind in-headings.
The study further explored whether an optimum positionof the jet fan exists for a simplified in-heading. Optimum jetfan positions do in fact exist, which indicates that anoptimum jet fan position in full-scale mine application mayalso exist.
Since the study proved that numerical technique can beused to solve ventilation problems in the scaled-down coalmine model, this technique could be extended to other minevventilation and related studies, for example air conditioning.
Symbols
LfL Jet fan position from in-heading entrance [mm]
Lh In-heading length [mm]
P Pressure [Pa]
SMxS Body force in directions x [N]
SMyS Body force in directions y [N]
SMzS Body force in directions z [N]
t Time [s]
V Velocity vector (column) [m/s]
x, y, z Space coordinates [m]
u, v, w x, y, and z Velocity components [m/s]
ρ Density [kg/m3]
µ Viscosity due to linear deformation [kg/m.s]λ Viscosity due to volumetric deformation [kg/m.s]
References
CHANDER, S., ALABOYUN, A.R., and APLAN, F.F. 1990. On the mechanism of
capture of coal dust particles by sprays. Proceedings of the Third
Symposium on Respirable Dust in the Mineral Industries, Pittsburgh, PA,
17-19 October 1990.
CHENG, L. and ZUKOVICH, P.P. 1973. Respirable dust adhering to run-of-face
bituminous coals. US Department of the Interior, Bureau of Mines,
Pittsburgh, PA. RI 7765. NTIS No. PB 221-883.
ESTERHUIZEN, G.S. and GÜRTUNCA, R.G. 2006. Coal mine safety achievements in
the USA and the contribution of NIOSH research. Journal of the Southern
African Institute of Mining and Metallurgy, vol. 106, no. 12. pp. 813–820.
FLINT, J.D. 1990. Mine Gas and Coal Dust Explosions and Methane Outbursts –
Their Causes and Prevention. MSc dissertation. University of the
Witwatersrand, Johannesburg. pp. 3–8.
LIU, X., GUO, L., and ZHANG, Z. 2010. Statistics analysis of death accident in
coal mines from January 2005 to June 2009. Proceedings of the Asia-
Pacific Power and Energy Engineering Conference, APPEEC 2010,
Chengdu, China, 28-31 March 2010. pp. 5794–5796.
NUNDLALL, A.R. 2006. Case study: lessons learnt from recent flammable gas
explosions in South African hard rock mines. Journal of the Mine
Ventilation Society of South Africa, vol. 59, no. 2. pp. 64–69.
PENG, S.S. and CHIANG, H.S. 1984. Longwall Mining. Wiley–Interscience, New
York. ISBN 0-471-86881-7.
THOPIL, G.A. and POURIS, A. 2010. An overview of the electricity externality
analysis in South Africa within the international context. South African
Journal of Science, vol. 106, no. 11–12. Article no. 248 .
WALAWW , A.M., VYTKAVV , S., TAYLOR, C.D., and HUANG, G. 2007. Mine face
ventilation: a comparison of CFD results against benchmark experiments
for the CFD code validation. Mining Engineering, vol.59, no. 10. gg
pp. 49–55. ◆
A computational fluid dynamics model for investigating air flow patterns
The Journal of The Southern African Institute of Mining and Metallurgy VOLUME 114 JUNE 2014 425 ▲
Figure 12—Optimum fan position for in-heading lengths rangingbetween 467 mm and 2333 mm