a computationally efficient stereo vision algorithm for
TRANSCRIPT

A Computationally Efficient Stereo
Algorithm for Adaptive Cruise Control
by
Jason Robert Bergendahl
Submitted to the Department of Electrical Engineering andComputer Science
in partial fulfillment of the requirements for the degree of
Master of Science in Electrical Engineering
at the
MASSACHUSETTS INSTITUTE OF TECHNOLOGY
June 1997
@ Massachusetts Institute of Technology 1997. All rights reserved.
A uthor ........................ ............. ................
Department of Electricalngineering and Computer ScienceMay 9, 1997
Certified by....................... .. ...... rBerthold K.P. Horn
Professor of Electrical Engineering and Computer ScienceThesis Supervisor
A ccepted by .................. ..... ... .. ........Arthur C. Smith
Chairman, Departmental Committee on Graduate Students
JUL 24199ng.,JUL 2 4 1997
Vision

A Computationally Efficient Stereo Vision Algorithm for
Adaptive Cruise Control
by
Jason Robert Bergendahl
Submitted to the Department of Electrical Engineering and Computer Scienceon May 9, 1997, in partial fulfillment of the
requirements for the degree ofMaster of Science in Electrical Engineering
Abstract
A major obstacle in the application of stereo vision to intelligent transportation sys-tems is high computational cost. In this thesis, we present an edge based, subpixelstereo algorithm which is adapted to permit accurate distance measurements to ob-jects in the field of view in real-time using a compact camera assembly. Once com-puted, the 3-D scene information may be directly applied to a number of in-vehicleapplications, such as adaptive cruise control, obstacle detection, and lane tracking.On-road applications, such as vehicle counting and incident detection, are also pos-sible. A PC based three-camera stereo vision system, constructed with off-the-shelfcomponents, was built to serve as a tool for testing and refining algorithms whichapproach real-time performance. In-vehicle road trial results are presented and dis-cussed.
Thesis Supervisor: Berthold K.P. HornTitle: Professor of Electrical Engineering and Computer Science

Acknowledgments
I wish to thank Professor Berthold Horn for agreeing to supervise this thesis,
and for generously sharing his expertise in machine vision over the course of the
research project. I also extend my deep gratitude to Dr. Ichiro Masaki for proposing
this graduate work, and for his continued support and advice as the project evolved.
Partial support for this research from the National Science Foundation under Grant
No. MIP-9423221 is gratefully acknowledged.
The students of the Artificial Intelligence Lab provided lots of technical advice
and equally abundant friendship. I wish to extend special thanks to Marcelo Mizuki
for his unbounded generosity in helping out at various phases of the project. He safely
piloted the test vehicle during numerous road trials while I provided a steady stream
of distractions from the passenger's seat. Thanks to Gideon Stein for helping me get
started with this project, and for a number of stimulating discussions. Many thanks
to Polina Golland, Tony Ezzat, Tina Kapur, and Erik Miller.
The staff members in the AI Lab were also very helpful. I'd especially like to thank
Laurel Simons, Bruce Walton, Lisa Inglese for helping me to navigate the labyrinth
of purchasing, and Ron Wiken for his help with miscellaneous supplies and for giving
me a crash course on the milling machine.
I'd like to thank Eric Hopkins at Metrovideo in Wellesley, MA, for his assistance
in technical matters regarding video and image processing hardware. Kudos to the
staff at Imaging Technology Inc. in Bedford, MA, for their patient technical support.
Above all, I thank my family for their love and support in all that I have done,
from the beginning.

Contents
1 Introduction
2 A Special Geometry for Stereo Vision
2.1 Overview of stereo vision . . . . . . .
2.2 Camera orientation ......................
2.3 Computing depth .......................
2.4 Finding correspondences ...................
2.4.1 Epipolar constraint ..................
2.4.2 Feature based vs. area correlation methods . . . . .
2.4.3 Optical flow ............. .........
2.5 Using a third image ......................
2.5.1 Trinocular epipolar constraint . . . . . . . . . . . .
2.5.2 Increased accuracy through additional computation
2.5.3 Special geometry with three cameras . . . . . . . .
2.5.4 Trilinear relations . . . . . . . . . . . . . . . . . .
2.6 Subpixel estimation . . . . . . . . . . . . . . . . . . . . .
2.7 Related ITS systems .....................
3 Stereo Vision Algorithm
3.1 Overview of the algorithm .........
3.2 Feature extraction .............
3.3 Edge classification ..............
3.4 Localizing edges to integer pixel accuracy .
.... .. 13
... ... 14
.... .. 15
... ... 15
. . . . . . 16
... ... 18
.. ... . 18
. . . . . . 19
. . . . . . 20
. . . . . . 20
. . . . . . 21
. . . . . . 21
. ... .. 23
24
.... ... .. .... 24
... ... ... ... . 26
... ... ... ... . 28
. . . . . . . . . . . . . 28

3.5 Edge correspondences ........................... 30
3.6 Localizing edges to subpixel accuracy . ................. 33
3.7 Depth map ................................ 34
3.8 Histogram ... .. .. .. ... ........ ............. 34
4 Implementation 36
4.1 Cam eras . . . . . . . . . . . . . . . . . . . . . . . . . . . . . .. .. . 36
4.2 Reducing the camera data ........................ 38
4.3 PC based image processing hardware . ................. 41
4.4 Host PC . . . . . . . . . . . . . . . . . . . . . . . . . . . . . .. .. . 41
4.5 Alternative implementations ................... .... 42
5 Results 44
5.1 Sam ple results .................... ........... 44
5.2 Perform ance ................................ 50
5.3 Sources of error ...................... ........ 50
5.4 Estim ating errors ............................. 52
6 Conclusions 54
6.1 Conclusions .. .. .. .. ... .. .. .. . . . . . . . . . .. ... . 54
6.2 Future W ork ................................ 54

List of Figures
1-1 Maintaining a safe following distance with ACC . . . . . . . . . . . .
2-1 The epipolar constraint . ........................
2-2 The trinocular epipolar constraint . . . . . . . . . . . . . . . . . . .
3-1 Flow chart of stereo vision algorithm . . . . . . . . . . . . . . . . . .
3-2 Sobel edge detection. (a) Original image. (b) Gradient map . . . . .
3-3 Positive and negative edges. (a) Original image. (b) All edges. (c) Pos-
itive edges only. (d) Negative edges only . . . . . . . . . . . . . . . .
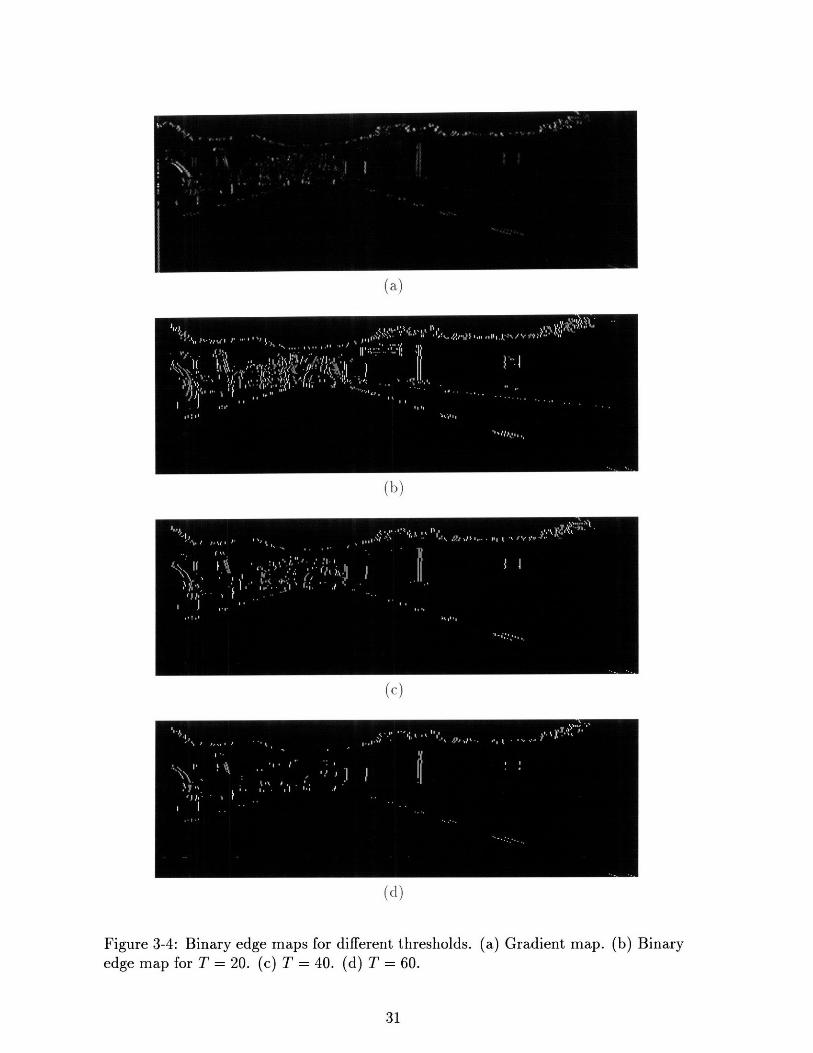
3-4 Binary edge maps for different thresholds. (a) Gradient map. (b) Bi-
nary edge map for T = 20. (c) T = 40. (d) T = 60 . . . . . . . . . .
3-5 Correspondence verified with the binary mask . . . . . . . . . . . . .
3-6 Subpixel edge location computed by parabolic interpolation . . . . .
3-7 Disparity histogram. (a) Before filtering. (b) After filtering, M = 1..
4-1
4-2
4-3
4-4
4-5
4-6
5-1
5-2
5-3
System architecture. ........
Shadows on the roadway.......
Specular reflection .........
Traveling through an underpass. . .
Zoomed region of interlaced image.
Camera data reduction........
Single vehicle. (a) Input triple. (b) Depth map. (c) Confidence map.
Filtered histogram for the example of Figure 5-1, M = 1 . . . . . . .
Multiple vehicles. (a) Input triple. (b) Depth map. (c) Confidence map.
.. .... ... ... ... .... 37
.. .... ... ... ... ... . 38
.. .... ... ... .. ... .. 39
. . . . . . . . . . . . . . . . . . . 39
. . . . . . . . . . . . . . . . . . . 40
. .... .... .. .. .... .. 40

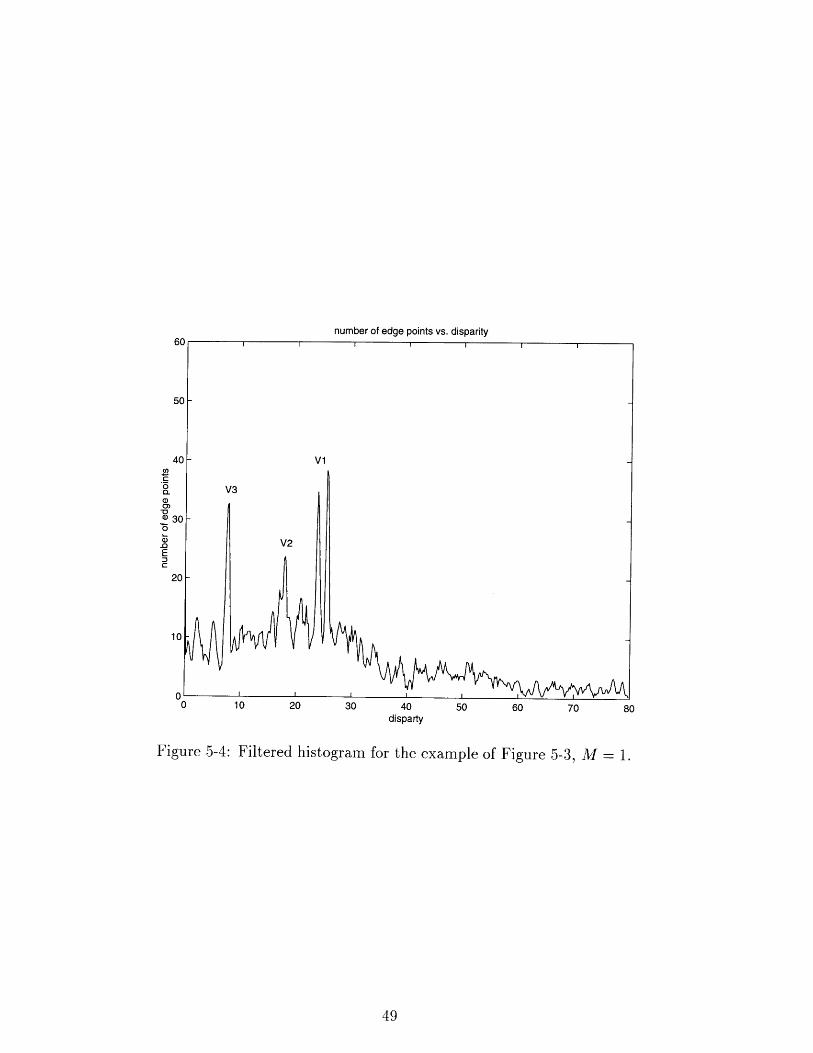
5-4 Filtered histogram for the example of Figure 5-3, M = 1. ........ 49
5-5 Comparison of combined and separate correlation of positive and neg-
ative edges. (a) Combined. (b) Positive edges only. (c) Negative edges
only. (d) Sum of (b) and (c). (e) Difference of (a) and (d). ...... . 53

List of Tables
5.1 Processing parameters ........................... 50
5.2 Breakdown of processing time ....................... 50

Chapter 1
Introduction
Intelligent transportations systems (ITS) have been the focus of considerable research
activity in both academic and industrial settings over the past several years. As part
of an effort to effectively manage existing transportation resources, one major goal of
ITS is to simultaneously increase the capacity and safety of existing roadways.
Automotive ITS systems may be classified as one of two types, on-road or in-
vehicle. On-road systems are so named because they are incorporated directly into
the transportation infrastructure. For instance, a stationary roadside ITS installa-
tion may perform automatic traffic monitoring for congestion management or incident
detection. If a detected situation merits a human response, the action may be co-
ordinated from a single, remote traffic management center. In-vehicle systems, by
contrast, are installed not into the infrastructure, but into individual vehicles. Typ-
ical in-vehicle applications include obstacle detection, lane tracking, and adaptive
cruise control (ACC).
ACC is an enhanced version of standard cruise control in which we control the
speed of the vehicle based on the scene on the roadway ahead. In particular, we
modulate the speed of the vehicle to automatically maintain a safe following distance
to a vehicle in front. In its most sophisticated form, lane markings are used to
distinguish vehicles in the same lane as the ACC-equipped vehicle. In Figure 1-1,
V1 is a vehicle equipped with the vision-based ACC system. The ACC system must
detect the lane markings in order to maintain a safe distance to the vehicle in the
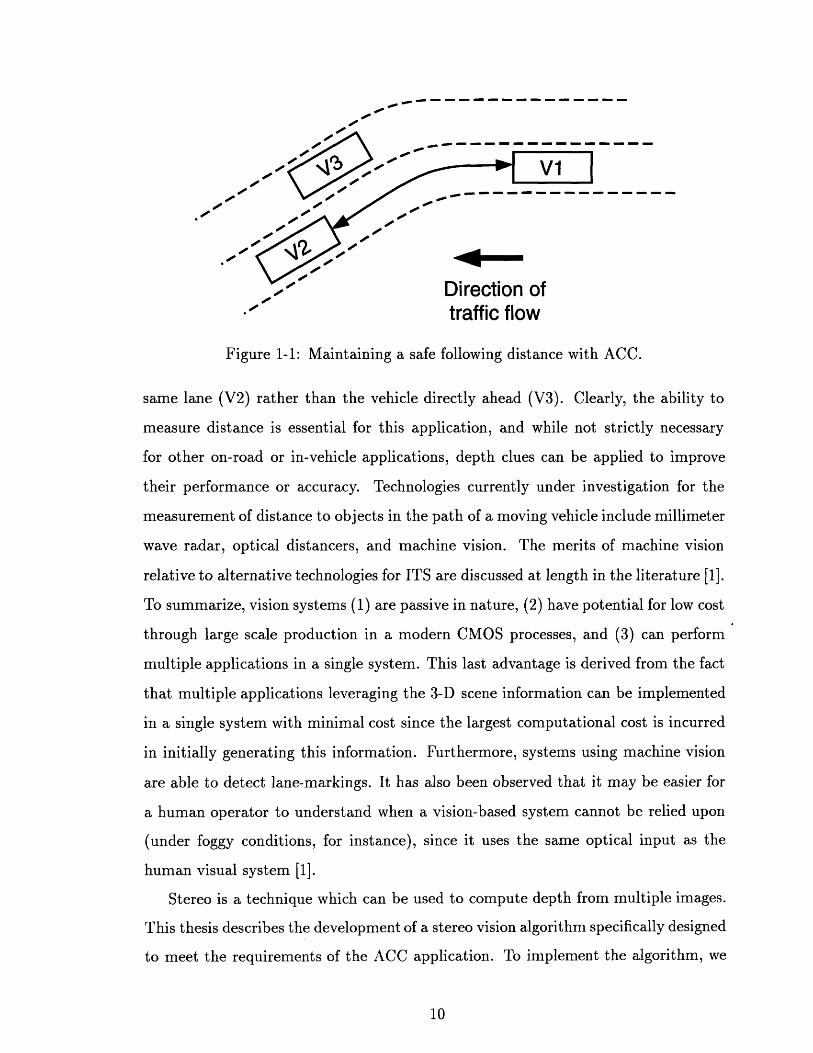
SOW.--- - - - - - -
r#
0 Ulirectlon OTtraffic flow
Figure 1-1: Maintaining a safe following distance with ACC.
same lane (V2) rather than the vehicle directly ahead (V3). Clearly, the ability to
measure distance is essential for this application, and while not strictly necessary
for other on-road or in-vehicle applications, depth clues can be applied to improve
their performance or accuracy. Technologies currently under investigation for the
measurement of distance to objects in the path of a moving vehicle include millimeter
wave radar, optical distancers, and machine vision. The merits of machine vision
relative to alternative technologies for ITS are discussed at length in the literature [1].
To summarize, vision systems (1) are passive in nature, (2) have potential for low cost
through large scale production in a modern CMOS processes, and (3) can perform
multiple applications in a single system. This last advantage is derived from the fact
that multiple applications leveraging the 3-D scene information can be implemented
in a single system with minimal cost since the largest computational cost is incurred
in initially generating this information. Furthermore, systems using machine vision
are able to detect lane-markings. It has also been observed that it may be easier for
a human operator to understand when a vision-based system cannot be relied upon
(under foggy conditions, for instance), since it uses the same optical input as the
human visual system [1].
Stereo is a technique which can be used to compute depth from multiple images.
This thesis describes the development of a stereo vision algorithm specifically designed
to meet the requirements of the ACC application. To implement the algorithm, we

have constructed a three-camera stereo vision system using off-the-shelf components.
The primary purpose of this physically compact hardware implementation is to enable
in-vehicle evaluation of the algorithm under realistic highway and imaging conditions.
Other recent efforts at MIT and elsewhere are focusing on developing the high-speed
VLSI hardware needed for cost-effective large scale implementation of vision algo-
rithms. Our system must deliver:
* reliable distance measurements with a short camera base line
* capability for on-road testing
* real-time performance
Accurate and reliable distance measurement to the objects on the roadway is clearly
needed. A short camera baseline is required to reduce overall system cost and to
minimize the impact on vehicle styling. We desire that the system be on-road capable
so that we can evaluate the performance of the algorithm for our target application,
adaptive cruise control, under realistic conditions. Finally, at typical highway speeds,
the roadway scene can change rapidly, hence we require real-time performance at video
rate (30 frames/sec) to keep the system updated. This last requirement seriously
limits the complexity of our algorithm.
This thesis is organized as follows. Chapter 2 provides background in stereo vision
and motivates the special camera geometry that we use in our system. Chapter 3
describes the individual steps of the stereo vision algorithm in detail. Chapter 4
describes the hardware and software implementations, and mentions a few related
VLSI developments. Chapter 5 presents and analyzes the results of the on-road trials.
In Chapter 6, we draw conclusions from this experiment, and make suggestions for
future work.

Chapter 2
A Special Geometry for Stereo
Vision
This chapter will discuss major techniques for stereo vision. We will discover that
many approaches, when applied in the most general case, are too computationally
intensive for use in a real-time application (many taking on the order of seconds on
a modern workstation). However, by introducing additional constraint, we are able
to come up with an algorithm simple enough for real-time execution. In particular,
we use a parallel axis geometry, and add a third camera. The motivation behind
these choices is described in this chapter, leading up to a detailed description of the
algorithm in Chapter 3.
2.1 Overview of stereo vision
The goal of stereo vision is to recover the structure of the 3-D environment from
two or more 2-D images. This process may be broken down into three main steps:
preprocessing, finding correspondences, and computing depth. To compute the depth
we must know how the cameras are arranged, and also know which image point pairs
correspond to the same point in the 3-D world. These image point pairs are called
conjugate points.

2.2 Camera orientation
The 2-D images that we use for stereo vision may be generated simultaneously by
multiple cameras distributed in space or, in the case of a static scene, by a single
camera in different positions at different times. To compute depth, we must be able
to relate the 3-D coordinate systems of the cameras, specifically their relative orien-
tation and position. This discussion will assume that the internal camera parameters
(focal length and position of the principle point) are known. The transformation of
the coordinate system of one camera into the coordinate system of another can be
decomposed into a rotation followed by a translation. For a 3-D point in the left
camera's coordinate system, rl, we can compute the coordinates of the same point in
the right camera's coordinate system rr as [2]:
rr = R ri + ro (2.1)
where R is the orthonormal matrix describing the rotation between the cameras, and
ro is the vector describing the translation. Given points in the 3-D world for which
both rl and rr are known, we can solve for R and ro. It turns out that a minimum of
five such points are required [2]. However, due to measurement errors (noisy image
data) we usually use a larger number of points and apply a sum of least squared error
technique to find the best estimate of rotation and translation.
The method of directly applying the internal and external camera calibration
parameters amounts to a matrix multiplication, which adds significant overhead to
the task of comparing just one pair of points in different views. We set aside this
approach in favor of constructing a special camera geometry which allows us to reduce
the computational load. In particular, we make the optical axes of the left and right
cameras parallel (R = I), align the x-axes of the cameras, and make allowances for
residual alignment errors in our algorithm.

2.3 Computing depth
Returning to the general case, let us assume that we know the left and right image
coordinates (denoted by ') corresponding to a single point in the 3-D world. Then
once we have computed R and ro, we may calculate the depth to the 3-D point (in the
coordinate systems of both the left and right cameras) by solving the linear system
formed by any two equations of [2]:
rl + r12 - r13 + r 14 = r (2.2)II I
21 r22+ r 23 Zj + r24 T z (2.3)If f f
r3 + r32 + r33 zi + r34 = Zr (2.4)
where r1...3 1...3 are the elements of R, and r1...3 4 are the elements of ro.
Consider the special case of two cameras with optical axes aligned and a baseline
oriented in the x (horizontal) direction with the world origin located midway between
the cameras. The world 3-D coordinates may be computed directly from the disparity
of corresponding image points as [2]:
(X/ + x')1 /2x = b I / r (2.5)( + )/ 2 (2.5)
y = b ( I + y)/2 (2.6)
z = b f (2.7)X1 - X r
where b is the length of the baseline, f is the focal length, and xx and x' are the x-
coordinates in the left and right images respectively. As we decrease the length of the
baseline, the uncertainty in the distance measurement increases due to quantization
error in the difference (x'-x'). The cameras should be placed further apart to increase
the accuracy of the depth estimation, but the images will become less similar. The
3-D point must be visible in both images, and non-overlap of the images becomes a
major issue when using a parallel-axis geometry and the large baseline.

epipolar line
Figure 2-1: The epipolar constraint.
2.4 Finding correspondences
In the previous section, we assumed that the conjugate point pairs were known.
Finding these conjugate points is the key problem in stereo vision. Given a point in
the base image, this amounts to a search for the corresponding point in the second
image. The search may reveal multiple candidate matches, or no matches at all if
the 3-D point is not visible in both images due to dissimilarity between the images
or occlusion.
2.4.1 Epipolar constraint
Fortunately, we do not need to perform our search over the entire image. Consider
a single point ri in the left image. We know that the 3-D point P corresponding
to this image point must lie on the line extending from ri through the center of
projection of the first camera 01. The projection of this line into the image plane of
the second camera is known as the epipolar line. We know that the right image point
r'r corresponding to ri must lie on this epipolar line as shown in Figure 2-1.
The plane defined by the centers of projection of the two cameras and a point in
the base image is known as the epipolar plane. This plane intersects each of the image
planes in a line; these are corresponding epipolar lines. The search for correspondences

may be formulated as follows: for a particular point in the base image, we compute
the epipolar line in the second image, and search for the "most similar" point along
that line. For efficiency reasons, we would like to process all points on a given epipolar
line in the base image at once.
In the special case of the parallel-axis camera geometry with the two cameras
arranged on a horizontal line, the corresponding epipolar lines are horizontal (pixel)
rows in the left and right images. This provides a framework for an efficient imple-
mentation of a stereo search which avoids explicit computation of the epipolar line in
the second image. The difficulty with this approach is that mechanical alignment of
the cameras is tedious, time-consuming and ultimately imperfect. The epipolar lines
will not exactly correspond to pixel rows. We still adopt this special camera configu-
ration because it facilitates direct comparison of points among the images with little
overhead.
The so-called correspondence problem in stereo vision has been studied for a long
time. Much of the recent theoretical work concerning point correspondences among
multiple views has been formulated using projective geometry for the reason that it
provides simple, linear relationships among the views. Good references on the use
of projective geometry in computer vision include [3, 4]. With this approach, the
fundamental matrix encodes the relationship between the images of a stereo pair and,
given a point in the base image, allows the corresponding epipolar line to be computed
in a straightforward way. Nevertheless, repeated matrix multiplications are too costly
for real-time execution.
2.4.2 Feature based vs. area correlation methods
Even with the search space restricted by geometric constraints, the problem of finding
conjugate points among the stereo images remains a difficult one. Many algorithms
attempt to solve the problem in two steps: local matching followed by global match-
ing [5]. In local matching, we search along the epipolar line for points that have
geometric properties similar to those of the base point. In global matching, we con-
sider the "big picture" to help disambiguate among local matches. This amounts

to enforcing a global consistency constraint. Disparity smoothness constraints and
coarse-to-fine techniques have been used for this purpose [6].
In our algorithm, we rely solely on local matching to find conjugate points. A
number of geometric properties have been used in the past, including edge orienta-
tion (after edge preprocessing), sign of zero crossing, and image intensity in a small
neighborhood; a combination of properties is often used. We consider the magnitude
and direction of the brightness gradient to evaluate local matches. Oftentimes algo-
rithms allow each point in the base image to be matched with at most one point in
the second image. This is a reasonable requirement since a single point in the 3-D
world may appear at most once in a given image. One approach to selecting among
multiple candidate matches is to score each match based only on our local matching
criteria and to pick the match with the highest score. The problem is that this in-
volves too much overhead for real-time execution. Our approach is to simply classify'
each permutation of point pairs as match or non-match, conceding the possibility
that a particular point may be involved in more than one match due to errors.
Rather than using individual point correspondences for local matching, some ap-
proaches apply area correlation of small patches of the original grey-scale or pre-
processed image to solve the correspondence problem. Instead of finding conjugate
points, this technique searches for conjugate patches among the different views which
have similar brightness patterns. This tends to produce a very dense depth map.
One problem with this approach is that it exhibits sensitivity to foreshortening; in
general the projection of a patch on the object will have different sizes when imaged
from different locations. The process of finding conjugate patches with area correla-
tion methods requires a large number of pixel comparisons, followed by computation
of a metric for estimating patch similarity, typically the sum of squared differences
(SSD) [7, 8]. The implementation of this approach is computationally intensive, de-
manding high degrees of parallelism.
The computational load can be reduced by matching only sparse features among
the views. This is the primary motivation for finding point correspondences between
1After including additional constraint; see Section 2.5.

features instead of patches. Although feature extraction typically requires a convo-
lution, off-the-shelf or custom hardware can be used to perform this computationally
expensive operation at high speed. One notable disadvantage of the feature based
approach is sparser depth maps; we are trading density of the depth map for speed.
However, if we are able to make some assumptions about the surface being imaged, it
is possible to interpolate the depth data to form a smooth depth map [6]. It should be
noted that even area correlation methods give unreliable depth estimates in uniform,
featureless regions.
2.4.3 Optical flow
Optical flow can also be used to deal with the correspondence problem. Treating two
successive images from a single camera as the two members of a stereo pair, we can
apply the methods of optical flow. If the change between images is small, we can
use the the assumption of smoothness of the flow field together with the optical flow
constraint equation to estimate the optical flow [2, 9]. Knowing the displacements
between the two images for each pixel is equivalent to knowing the correspondences.
In the case where the images are dissimilar (i.e., the displacements are large), we
can instead use a hierarchical, multi-resolution image representation which allows us
to use the optical flow constraint equation [10]. Unfortunately, solving for optical
flow with an iterative scheme may take several steps and therefore is not suitable for
real-time execution in the absence of special hardware.
2.5 Using a third image
While two images are sufficient to reconstruct the structure of the 3-D world, adding
a third image taken from another camera position can help to resolve the ambiguity
in stereo matching. This section will look at the use of a third image in solving the
correspondence problem.

epr
0103
anl
epl
~'r
Figure 2-2: The trinocular epipolar constraint.
2.5.1 Trinocular epipolar constraint
Adding an additional image allows us to extend the epipolar geometry considered
in the previous section. Given a point in the base image, we can search for points
with similar geometric properties (candidate matches) on the epipolar line in the
second image. Likewise, given the same base point, we conduct a search for candidate
matches on the epipolar line in the third image. To determine if a candidate match
in the second image is a true match, we can apply a simple test. Its epipolar line in
the third image must intersect the base point's epipolar line in the third image at or
near a point with similar geometric properties. False matches are still possible, if the
density of feature points is high enough.
Adding a third camera with its center of projection collinear with the centers of
projection of the base and second cameras does not introduce a trinocular epipolar
constraint. The problem is that the two epipolar lines in the third image coincide not
just at a single point, but at all points. The ambiguity in determining the correct
match has not been reduced. This suggests that using a geometry where the camera's
centers of projection are not collinear may be desirable. However, using a general cam-
era geometry requires computationally expensive coordinate transformations among
the views when comparing points. Using a special collinear camera geometry, it is
still possible to verify correspondence with a simple point check, without resorting to
01

the epipolar constraint.
2.5.2 Increased accuracy through additional computation
It should be clear from the above discussion that adding a third image has potential
for dramatically increasing the accuracy of the 3-D reconstruction by reducing errors
in the correspondence step. The cost is additional computational load. The tradeoff
between the increased computational load and accuracy of the result was explored
for the case of a general camera geometry in a paper by Dhond and Aggarwal [5]; the
method and result of the investigation will be summarized here.
To preserve generality, the algorithm implemented was low level, considering only
the epipolar constraint and geometric similarity between points. No global matching
was done to improve the result. The images were first preprocessed with the Lapla-
cian of Gaussian operator. The geometric criteria for corresponding image points was
that they have the same zero crossing sign, and that the difference in their edge orien-
tation be less than 300. The algorithm was implemented for two cameras, and simply
extended for the three camera system. Starting from synthetic images generated from
digital elevation maps and using the Lambertian surface model, the reconstruction
results were compared to ground truth.
The authors found that for reasonable simulation parameters, trinocular matching
showed a significant decrease in the number of false matches, by a factor of two or
more, as compared to the binocular scheme. Trinocular matching resulted in a 25%
increase in both the number of additions and multiplications. We conclude that a
third camera will likely reduce the number of false matches even when the cameras
are arranged in a special geometry.
2.5.3 Special geometry with three cameras
Adding a third camera may actually help to reduce the computational burden of
finding correct feature correspondences among the views while reducing the number
of false matches. To do this, we simply extend our previous geometry to accommodate

a third camera. In particular, we position the center camera at the midpoint of the
baseline between the left and right cameras, with its optical axis aligned. This causes
the corresponding epipolar lines to lie on horizontal (pixel) rows in all three images.
The center camera in our setup is used solely to disambiguate matches, not to provide
multiple binocular views. Given a candidate correspondence between two features in
the left and right image, we can quickly calculate the expected position of the feature
in the center image and check that it indeed exists there. The details of this check,
and ways of allowing for imperfections in camera alignment are given in the next
chapter.
2.5.4 Trilinear relations
Since the trinocular epipolar constraint is essentially two successive applications of
epipolar constraints, there is an inherent asymmetry to this method. Resorting to
projective geometry, the trilinear equations provide another way of considering the
relationships among the three images. The topic of trilinear relations has been a very
active one over the past few years. In essence, the trilinear relationship summarizes
the constraint on the positions of points corresponding to the same point in space all
three images at once with the 3 x 3 x 3 trilinear tensor (analogous to the fundamental
matrix in the binocular case). A clear derivation of the nine trilinear equations is
given in [4], and its advantages over the epipolar approach are discussed by Shashua
and Werman in [11]. We set aside trilinear relations for the same reason we set aside
projective geometry in the two-camera case: we cannot afford the required matrix
multiplications.
2.6 Subpixel estimation
We can see from Equation 2.7 that quantization in the disparity measurement (x)-x-)
reduces the accuracy of the depth measurement. Quantization arises since we restrict
possible edge positions to discrete points while in reality features fall on a continuum.
Features are usually allowed to occur only at integer pixel locations. If the localized

edge features in the left and right images are located at x' and xt, respectively, and
the true edge features occur at (x + cl) and (x' + Cr), then the error in the depth
measurement, Az, due to quantization is:
( 1 1Az b f (i - - •) -( ± (2.8)
which simplifies to:
Az = b - - C r (2.9)
For fixed ct and CE, decreasing the disparity will increase the error in the depth
measurement. The error is proportional to 1 and, since disparity is inversely
proportional to depth, z 2. For our ACC application, the system must be able to
reliably detect objects that are a considerable distance away. One way to decrease
the error in our depth measurement is to increase the camera baseline; however, a
short baseline is needed for our system to meet size and cost restrictions.
To overcome the trade-off between short baseline and accuracy in the distance
measurement, we adopt a subpixel resolution approach in localizing features [12, 13].
That is, we attempt to improve the accuracy of the distance measurement by es-
timating the location of the features to a subpixel resolution. This corresponds to
a reduction in the maximum magnitude of cE and Cr. We are trying to improve on
the resolution of the (preprocessed) camera image by interpolating between the pix-
els. A number of subpixel approaches have been compared for accuracy, robustness
and computation speed in [13], including a Gaussian approximation, center of mass
(CoM), linear interpolation, parabolic estimation, and Blais and Rioux (BR) detec-
tors. The error measurements are based on the assumption that the underlying peak
has the shape of a Gaussian distribution. All but the linear and BR estimators were
found to be reasonably unbiased. Low-order CoM estimators displayed high errors.
We picked the parabolic estimator for our algorithm because it is easy to implement,
efficient, and has reasonable performance.

2.7 Related ITS systems
Given the wide array of vision systems that have been built in recent years, we should
mention a few projects related to the present work. A team of researchers at Toyota
Central R&D Labs developed a real-time stereo vision system for ITS [14]. This two
camera system incorporates modules for edge segmentation, optical flow, stereo vision
and template matching.
An interesting three camera stereo vision algorithm using optically aligned cam-
eras positioned at the corners of an isosceles right triangle is described in [15]. Ross
built a practical three camera stereo vision system for autonomous robot vehicles
where the axes of the cameras are optically aligned and their centers are collinear [7].
Another real-time system, described in [16], combines subpixel estimation with an
area correlation technique.

Chapter 3
Stereo Vision Algorithm
The goal of the stereo vision algorithm is to recover the depth to features in the 3-D
environment in real-time using the special camera geometry described and motivated
in Chapter 2. In this chapter, the algorithm is described step-by-step.
3.1 Overview of the algorithm
The input to the algorithm is a stereo triple, acquired from the three cameras. The
specifics of the acquisition will be discussed with the system implementation in the
next chapter.
The first step is to generate the vertical edge gradient for each image, which
is accomplished using a convolution. Edge pixels in the left and right images are
matched using the center camera to help resolve ambiguities. For corresponding
edge pixels in the left and right images, the positions of the edges are estimated
to subpixel resolution and are used to compute a subpixel disparity. Notice that
subpixel estimation is performed only for edges involved in a match, in order to
save computation. We use the subpixel disparities to build an edge depth map and
histogram. From the histogram we attempt to locate the closest vehicle. Figure 3-1
shows a flow chart of our algorithm.

Figure 3-1: Flow chart of stereo vision algorithm.
25

3.2 Feature extraction
In the feature extraction step, we compute the magnitude of the brightness gradient
in the horizontal direction at each pixel. We chose to detect vertical edges since
they are characteristic of vehicle boundaries and lane markings when viewed from the
driver's vantage point. The edges are detected by convolving the original images with
a two-dimensional gradient operator.
A number of different operators have been proposed to perform edge detection
including first order filters such as Prewitt, Sobel, Frei-Chen and Canny [17] edge
detectors, and second order filters such as the Laplacian of Gaussian (LOG) [18].
Each of these operators is evaluated in [19] for its accuracy in localizing edges and
sensitivity to edge orientation. We chose the Sobel operator because it is particularly
easy to implement and demonstrates reasonable sensitivity to diagonal edges. Having
selected the shape of the edge detector, we must choose its size. Larger kernels are less
sensitive to noise than smaller kernels, but are not able to localize edges as accurately.
Convolutions with larger kernels also require more multiplies and adds and therefore
take more time and/or hardware to complete.
Edge detection is accomplished in our system as a convolution using the Sobel
operator with a 3 x 3 neighborhood (gradient in the horizontal direction only):
-1 0 1
h = -2 0 2 (3.1)
-1 0 1
The edge detection step may be written as
G(x, y) = hx(x, y) * E(x, y) (3.2)
where * denotes a two-dimensional convolution, E(x, y) represents brightness in the
original image, and G(x, y) represents the gradient map. A sample image before and
after edge detection is shown in Figure 3-2. Lighter regions of the gradient map

(b)
Figure 3-2: Sobel edge detection. (a) Original image. (b) Gradient map.
indicate stronger edges.
Another way to generate the gradient map is to take the ratio of the absolute
value of the contribution from the left half of the kernel to the contribution from the
right half. An advantage of this approach is that the value of the gradient is less
sensitive to the absolute value of the brightness. Two disadvantages of this approach
are that it requires floating point hardware and a divide operation. To retain integer
operation and to minimize computational expense, we reject this approach in favor
of executing a convolution with the signed Sobel kernel, h,, to find the difference.
Following edge detection, the gradient map is thresholded to eliminate false edges
introduced by noise. Here there is a tradeoff; using a threshold which is too high will
also eliminate valid edge points. The best threshold for a particular image may be
best determined by analysis of the statistics of the image [19]. However, due to our
processing time constraint, we do not have time to compute the image statistics for
every frame. A threshold of approximately 20% of the full-scale value of 255 is picked

somewhat subjectively on the basis of typical experimental results.
3.3 Edge classification
The simplest way to generate the gradient map is to consider only the magnitude of
the gradient. Alternatively, we can use the sign of the convolution result to classify
the edges as either positive or negative [20]. Regions which transition from dark
to light as we move from left to right in the image are called positive edges since
the result of the convolution is positive. Conversely, regions which transition from
light to dark as we move from left to right in the image are called negative edges.
Classifying edges as positive or negative is equivalent to quantizing the direction of
the gradient into the -x or x directions. Gradient maps showing the classification of
positive and negative edges for a sample image are shown in Figure 3-3. We can use
this classification to reduce the ambiguity in our stereo matching by only attempting
to match edges of the same type.
3.4 Localizing edges to integer pixel accuracy
To facilitate comparison of edges among the views, we perform what is essentially
a thinning operation on the gradient map by identifying the integer pixel positions
of local maxima. Specifically, a pixel at position (x, y) is classified as an edge if the
gradient magnitude at that point, G(x, y), exceeds the threshold, T, and the following
condition holds:
G(x - 1, y) 5 G(x, y) Ž G(x + 1, y) (3.3)
If the criterion is satisfied, the pixel B(x, y) of the output binary edge map is set to
the full scale value of 255. If the criterion is not satisfied, the point is not counted as
an edge and B(x, y) is set to zero. One problem with this approach is that when large
gradient values becomes clipped, i.e., G(x - 1,y) = G(x, y) = G(x + 1, y) = 255, it is
possible for a series of successive pixels to be marked in the edge map as individual
edges when in reality only a single edge exists. It is important for us to avoid clipping

(a)
(b)
(d)
Figure 3-3: Positive and negative edges. (a) Original image. (b) All edges. (c) Positiveedges only. (d) Negative edges only.

in the gradient map for this reason. We localize the edges in each of the left, center
and right gradient maps to produce corresponding edge maps. Binary edge maps
generated using a number of different thresholds are shown in Figure 3-4. Notice
that the number of edge points in the binary edge maps decreases significantly as the
threshold is increased.
3.5 Edge correspondences
The localized edge points in the left and right edge maps must be matched in order to
extract depth information. Due to the special camera geometry of the test setup, this
can be done in a simple, computationally efficient way. Consider a single row of width
m pixels, in the left binary edge map, BI(1 ... m, n), and the corresponding row in the
right edge map, Br(1 ... m, n). We can compare every edge point in Bl(1 ... m, n) with
every candidate edge point in Br(1 ... m, n). If a pair of edges correspond to the same
edge, we expect to find an edge point along the corresponding row in center image,
Be(1 ... m, n), midway between the pair. For example, to check for correspondence
between the edge points BI(i, n) and B,(j, n) we check for an edge point at Bc(+, n)
as shown in Figure 3-5.
The scope of the search for matches may be reduced, and processing time saved,
by exploiting the geometric constraint imposed by the camera arrangement. Suppose
we are attempting to match the edge point Bi(i, n) in the left edge map. It is not
necessary to search the corresponding row in the right edge map in its entirety; we
need only check the edges in B,(1... i, n). It is impossible for a true correspondence
to fall in the range B,((i + 1)... m,n) because negative depth is impossible. This
simple optimization is implemented in our system.
Since the cameras are imperfectly aligned, it is possible that for corresponding
edges there will not be an edge exactly where we expect to find one in the center
edge map. Hence, instead of specifying a single pixel in the center image, we specify
a small range. For the example above, we would allow B,(- + A, n), where A is
typically one or two pixels. Use of this binary mask is shown in Figure 3-5 where
(a)
(b)
(d)
Figure 3-4: Binary edge maps for differentedge map for T = 20. (c) T = 40. (d) T =
thresholds. (a) Gradient map. (b) Binary60.

Integer EdgePosition
-------- ------------------------------------MaskB1(i, n
Binary Mask
Bc( ,
-------------------------------- Br-----------, n)B,(j, n)
Figure 3-5: Correspondence verified with the binary mask.
Right
Center
Left

the width of the mask has been greatly exaggerated. Using a large value of A would
likely lead to an increase in the number of false correspondences. In the limit as
A --+ o, we effectively eliminate constraint provided by interaction from the center
camera altogether.
3.6 Localizing edges to subpixel accuracy
To improve the accuracy of the depth computation, we return to the left and right
gradient maps to estimate the position of matched edges to subpixel resolution, and
from them compute the subpixel disparity. Let G(x, y) represent an edge localized to
integer pixel accuracy, satisfying Equation 3.3. Trouble may arise when computing
the subpixel position of the edge in the case where the two neighboring gradient
amplitudes are equal, i.e., G(x - 1,y) = G(x, y) = G(x + 1, y), as in the case of
saturation. Under these conditions, Gaussian, linear, and parabolic interpolation
result in a divide by zero. A divide exception is easily avoided in software with a
conditional branch; if the gradient magnitudes are all equal, the estimated subpixel
edge location, ^, is set to the original integer edge location x.
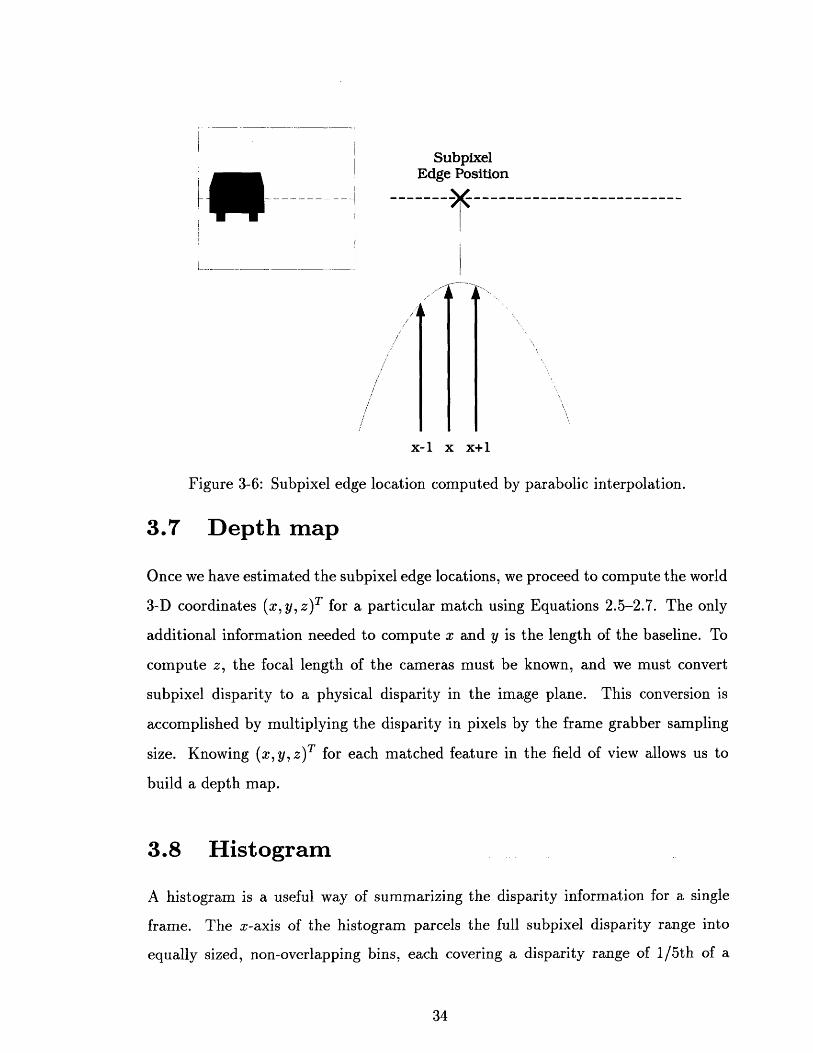
Given the more general case of unequal neighboring gradient amplitudes, we chose
to estimate subpixel edge locations by parabolic interpolation as shown in Figure 3-6.
Parabolic interpolation is used because it requires only three points, gives reasonably
accurate results, and can be implemented efficiently. The subpixel peak location, X,
can be estimated as:
2(G(x - 1, y) - G(x + 1, y)) + (G(x - 1, y) - G(x + 1, y))S= x G + - 2(G(x - 1, y) - 2G(x, y) + G(x + 1, y))(3.4)
The derivation of this result is straightforward. The expression is left in this unsim-
plified form since multiplication by a power of two may be implemented efficiently as
a bit shift operation.
4Subpixel
Edge Position
----- -------------------------
4lL
L A
x-1 x x+1
Figure 3-6: Subpixel edge location computed by parabolic interpolation.
3.7 Depth map
Once we have estimated the subpixel edge locations, we proceed to compute the world
3-D coordinates (x, y, z)T for a particular match using Equations 2.5-2.7. The only
additional information needed to compute x and y is the length of the baseline. To
compute z, the focal length of the cameras must be known, and we must convert
subpixel disparity to a physical disparity in the image plane. This conversion is
accomplished by multiplying the disparity in pixels by the frame grabber sampling
size. Knowing (x, y, z)T for each matched feature in the field of view allows us to
build a depth map.
3.8 Histogram
A histogram is a useful way of summarizing the disparity information for a single
frame. The x-axis of the histogram parcels the full subpixel disparity range into
equally sized, non-overlapping bins, each covering a disparity range of 1/5th of a
i
I_..._ _. ...._ '
/1
i
L

number of edge points vs. disparity
disparty disparty
(a) (b)
Figure 3-7: Disparity histogram. (a) Before filtering. (b) After filtering, M = 1.
pixel. The features are sparse, so most bins contain only a small number of edge
points. A moving average filter is applied to enhance concentrations of edge points
within a narrow disparity range. The moving average filter may be written as:
1 MS[n] = 2M + 1 x[n- k] (3.5)
k=-M
The number of neighboring bins averaged to compute y[n] is 2M + 1. Sample filtered
and unfiltered histograms are shown in Figure 3-7. A concentration of edge points
within a narrow disparity range, manifested as a peak in the histogram, is interpreted
as an object in the field of view. The depth to the object is computed as the average of
the subpixel disparities comprising the peak. This simple interpretation has obvious
shortcomings. While we expect that the edge points of a single object will be clustered
together in the field of view, the locality of edges is discarded in generating the
histogram. Also, two objects at the same distance cannot be distinguished.
a
S
0

Chapter 4
Implementation
Our system has three principal hardware components: the camera assembly, the PC
based image processing hardware, and the host PC. A block diagram of the system
architecture is shown in Figure 4-1. Power for the system is obtained exclusively from
the electrical supply of the test vehicle via the cigarette lighter.
4.1 Cameras
The system uses three Sony XC-75 CCD cameras. In our experimental setup, the left
and right cameras are spaced 252mm apart, with the center camera located at the
midpoint of the baseline. The cameras are mounted on a metal baseplate, machined to
assist in physical alignment. After mounting, the alignment of the cameras was fine-
tuned, and the cameras locked into position. The camera assembly is placed on the
dashboard of the test vehicle with the baseline oriented in the horizontal direction as
required by our choice of vertical edges as features. If the baseline orientation deviates
from true horizontal relative to the objects in the field of view, we will begin to lose
accuracy (the effective baseline length is decreasing) and the number of matched edge
points will decrease. Any such deviations should be slight however, since the cameras
are rigidly attached to the test vehicle which follows the contours of the roadway.
Attention to detail in matters of camera timing is critical to the success of the
implementation. The most stringent timing requirement is simultaneous acquisition

CameraAssembly
Figure 4-1: System architecture.
by all three cameras. The cameras are synchronized by a common signal generated
by the acquisition module, triggering the start of the integration period in all of
the cameras simultaneously. The integration period, sometimes thought of as being
controlled by an electronic shutter, is the interval during which the CCD element of
the camera collects photons. Smearing may occur in the images due to motion in
the field of view during the integration period. The amount of blurring was reduced
by selecting a short integration period of Ims and admitting more light to the CCD
element to preserve the overall brightness of the image. At typical highway speeds,
the vehicle travels only about 3cm in Ims.
Edge detection is also critical to the success of the implementation. Reliable edge
detection depends on having strong contrast at object boundaries, which in turn
depends on natural lighting conditions. The illumination of the roadway scene can
vary widely, from day to day as prevailing weather conditions change, or even moment
to moment such as when a passing cloud temporarily obstructs sunlight. Conditions
of point source illumination introduce a number of special difficulties. Shadows, such
as those to the right of the vehicle in Figure 4-2, can create brightness gradients

Figure 4-2: Shadows on the roadway.
where a physical object does not exist. There may also be specular reflections from
vehicles, as shown in Figure 4-3. Man-made structures can have a dramatic impact
on the illumination level such as when a vehicle travels beneath an overpass as shown
in Figure 4-4.
Auto-iris lenses can handle most of these practical problems. Auto-iris lenses
automatically control the iris aperture to maintain a preset average image brightness,
as determined from the video out signal fed back to the lens. The blooming in the
image due to strong reflections can be reduced by increasing the sensitivity of the
auto-iris lens to peak brightness. The auto-iris lenses that we use have focal length
35mm, yielding a horizontal field of view of 10.40 and vertical field of view of 7.9'
when used with our half-inch CCD element cameras. The horizontal pixel size is
12.6pm as determined from the frame grabber clock.
4.2 Reducing the camera data
Using a reduced image size allows us to complete the requisite pre- and post-processing
in a reasonable amount of time. Starting from the original 512 x 480 interlaced camera
image, we immediately restrict our attention to a region of interest of size 512 x 160
located at the center of the original camera image. This portion of the camera image
typically contains the information that we are most interested in, specifically the other
vehicles in the roadway and lane markings, whereas it is likely that the discarded
portions of the original camera image contain only sky and empty road.
The timing offset between the even and odd field integration periods in an in-
terlaced camera can produce shifted images when there is significant motion of the

Figure 4-3: Specular reflection.
Figure 4-4: Traveling through an underpass.

Figure 4-5: Zoomed region of interlaced image.
image in the camera's image plane. If the vertical motion of the cameras is rapid
enough, the even and odd fields in the interlaced image will reflect the motion of the
image in the image plane. Oscillations in the test vehicle's suspension, after striking
a bump, common to ordinary driving conditions caused noticeable difficulty in image
acquisition. To illustrate this effect, a zoomed region of an interlaced camera image is
shown in Figure 4-5. The effect was mitigated by subsampling the region of interest
in the vertical direction, i.e., either the even or odd field is discarded, and an input
image of size 512 x 80 results. The steps in camera data reduction are summarized in
Figure 4-6. Since we are interested in vertical edges, we are able to sacrifice vertical
resolution without affecting the accuracy of our depth estimates.
Captured Image Size 512 x 480
Restrict to Region 512 x 160
Restrict to Single Field 512 x 80
- -- - - - - - - - - - - - - -
- -- - - - - - - - - - - - -
Figure 4-6: Camera data reduction.
I

4.3 PC based image processing hardware
The host PC houses off-the-shelf image processing hardware, which has three prin-
ciple components: (1) an RGB acquisition module, (2) three image buffers, and (3)
a convolver. The acquisition module synchronizes the cameras and is capable of
capturing each of the three monochrome channels simultaneously. The acquisition
module and image buffers taken together logically form a traditional frame grabber.
The key component of the image processing hardware is a convolver which performs
edge detection using the 3 x 3 Sobel operator described previously. The convolver is
capable of performing this 3 x 3 convolution at a pixel rate of 40 MHz. The resulting
gradient amplitudes are scaled by a fraction (4/16) in the image processing hard-
ware to prevent clipping in the gradient maps, thereby preserving edge locality. The
image processing hardware exploits the high bandwidth of the PCI bus to transmit
the gradient maps to the main memory of the PC at high data rates (45 Mbytes/sec
measured).
4.4 Host PC
The PC is present to both serve as host to the image processing hardware and to
perform the high level functions of the algorithm. Once the gradient maps are pro-
duced and transmitted to the PC by the image processing hardware, the remainder
of the algorithm is executed in software by the PC's CPU. The 100 MHz Pentium
processor used in our implementation represents somewhat less than the state of the
art in processor performance in 1997, but it served its purpose. Its function is to com-
plete the higher level functions of the algorithm (steps following feature extraction)
in software.
The software runs in a 32-bit protected DOS environment. This provides compat-
ibility with existing software drivers for the image processing hardware, and allows
simple utilization of the large memory space needed to hold several images. The
software was written in the C programming language, with the emphasis placed on

efficiency and flexibility. Processing parameters and options are read from a user-
modified configuration file at run-time.
Significant effort was spent trying to minimize the execution time of the software.
An execution profiler was used to assist in this optimization phase. Recognizing that
a significant amount of overhead was incurred in sequential pixel accesses, parallelism
was exploited (i.e., process the left, center and right images within a single loop in
software) where allowed by the algorithm. In the computationally intensive correla-
tion step, the search space was reduced by exploiting the known camera geometry,
and by limiting the maximum possible disparity.
4.5 Alternative implementations
Our system implementation is intended only as a platform for developing a compu-
tationally efficient ACC algorithm. The hardware setup described in this chapter is
too costly and cumbersome to be installed in vehicles on a mass scale. Fortunately,
VLSI technology provides an avenue for high-volume, cost-effective implementation
of integrated imaging and computational systems. A few IC's specifically designed to
perform vision processing tasks are described here.
Analog VLSI shows strong potential for handling high bandwidth early vision
applications in real-time [21]. Analog implementations tend to be faster, smaller,
and consume less power than full digital implementations. Recent efforts include the
ADAP processor, an analog/digital hybrid chip with a number of configurable array
processors [22]. Each array processor consists of an analog ALU notable for its ability
to perform fast multiplies and divides. Edge detection and a simple vision algorithm
have been demonstrated with this chip. Interest in hardware based matching stems
from recognition of the fact that much of the computation of many stereo algorithms
is expended in the correlation step. A direct analog VLSI implementation of a 1-D
stereo correlation algorithm is described in [23].
Full digital implementations are also being investigated. To reduce the traditional
communication bottleneck between the imager and the processing elements, the pixel-

parallel processor merges image memory with an array of digital processors (one
per pixel) [24]. On the imager side, a CMOS imager with wide dynamic range has
been developed to handle the dramatic variations in illumination in outdoor lighting
situations [25].

Chapter 5
Results
On-road trials were conducted on a local highway to evaluate the performance of our
algorithm. The results of the trials are presented here.
5.1 Sample results
Reduction of the camera data results in an image of size 512 x 80 from each camera.
Images taken from the right, center and left cameras are combined to form an input
triple like the one shown in Figure 5-1(a). Our algorithm produces the edge depth
map of the scene as viewed by the center camera, shown in (b). Edges in the depth
map closer to the test vehicle appear in a lighter shade of gray. The lane markings
are evident in the depth map, but many edge points are missing. The confidence map
and its interpretation will be discussed later in the chapter.
We can also use the subpixel disparity information to construct the edge histogram
for the scene as discussed in Chapter 3. The filtered histogram generated for this first
example is shown in Figure 5-2. The peak located at a disparity of approximately 14
pixels corresponds to the closest vehicle in the field of view, V1. The depth z to V1 is
computed from the average of the subpixel disparities comprising the peak. We can
calculate x and y in a similar manner from the average x and y image coordinate of
the edges comprising the peak. Estimating the vehicle position by finding the centroid
of the 3-D edge points may provide a more accurate estimate of vehicle position, but

it requires a more involved computation. In any event, we have estimated the world
coordinates of the vehicle, (x, y, z)T. The process of measuring the distance to objects
in the field of view need not end with the closest object. The peak at a disparity of
approximately 4 pixels represents the more distant vehicle, V2, off to the right in the
field of view.
An example showing a slightly busier scene is shown in Figure 5-3, including partial
occlusion of one of the vehicles. The histogram reveals three significant peaks; the
vehicles V1, V2 and V3 are tagged in both the original image and the histogram. The
double peak corresponding to VI has an interesting cause. Upon examination, it was
seen that the peak at slightly lower disparity (approximately 23 pixels) corresponds
to the head-rest in the interior of V1, while the peak at slightly higher disparity
corresponds to the rear of the vehicle.

(a)
(b)
(c)
Figure 5-1: Single vehicle. (a) Input triple. (b) Depth map. (c) Confidence map.

number of edge points vs. disparity
0 10 20 30 40 50 60 70 80disparty
Figure 5-2: Filtered histogram for the example of Figure 5-1, M = 1.
0C
0.o.o•
E.
)

(a)
(b)
(c)
Figure 5-3: Multiple vehicles. (a) Input triple. (b) Depth map. (c) Confidence map.
number of edge points vs. disparity
0 10 20 30 40 50 60 70 80disparty
Figure 5-4: Filtered histogram for the example of Figure 5-3, M = 1.
2C,CL
a,_0
-o01)
E
C=1"5

CPU clock rate 100 MHzInput image size 512 x 80Convolution size 3 x 3Convolver clock rate 40 MHzDisparity search range 0 - 400Binary mask width 3 pixels
Table 5.1: Processing parameters.
Image acquisition 33Preprocessing inspecial hardware 10Processing in PC 19
Total 62Table 5.2: Breakdown of processing time.
5.2 Performance
The configuration and associated performance benchmarks of our system are summa-
rized in Tables 5.1 and 5.2. While the disparity search range is nominally 0-400, the
greatest measurable disparity is limited by the amount of overlap between the left
and right images. The PC processing time will increase as the number of edges in
the scene grows, due to the increased number of edge pair permutations that need to
be checked in the correlation step. The PC processing time and breakdown shown in
the tables reflect typical highway scenes like the one shown in Figure 5-3. Currently,
the overall performance of the system is 15 frames/sec.
Since the preprocessing in the image processing hardware and PC processing can
together be accomplished within a frame time (33ms), the system can be made real-
time by pipelining the image acquisition and processing steps.
5.3 Sources of error
Errors in the 3-D reconstruction may occur due to imperfections in the physical
implementation of the system, or due to shortcomings of the algorithm. The sources
Function Time (ms)

of error described in this section are cumulative. One type of error is inaccuracy in
the subpixel disparity estimate. Missed correspondences and false correspondences in
the correlation process are more serious.
We introduced a number of additional constraints on the camera geometry to make
the algorithm computationally efficient. The relative rotation and translation of the
cameras, established by physical alignment, is not perfect. Some small misalignment
invariably remains. It may even change slightly when the camera array is subjected
to vibration or shock during the course of normal use. Furthermore, we ignored the
internal calibration parameters which account for variations in the focal length and
the location of the principal point.
Errors are also introduced in the optical system. All real lenses exhibit some
degree of radial distortion. Long focal length lenses, such as the ones we are using,
reduce radial distortion because the lens surface has less curvature. Furthermore, the
lenses we use are intended for use with a larger CCD element, so we are effectively
considering the center of the image, the portion least susceptible to radial distortion.
Physical imperfections in the system result in missed correspondences. But even
if we had a system with perfect optics and camera calibration, we would still be
susceptible to false correspondences due to shortcomings of the algorithm. We use the
center camera to reduce ambiguity in the matching process, but it cannot definitively
determine whether a potential match is true or false. An unrelated edge point which
happens to fall at the expected position in the center image may incorrectly confirm
a candidate pair between the left and right images. Probabilistically, expanding the
range of acceptable positions with the binary mask increases the likelihood of a false
match, as would increasing the total number of edge points in the images. The
algorithm is also susceptible to periodic edge patterns which can generate a large
number of false correspondences, such as when a chain-link fence occurs in the field
of view. One way to fix this problem is to relocate the center camera from its center
position to some other location along the baseline.

5.4 Estimating errors
Visually, we identify errors in the depth map as points at a depth inconsistent with
that of its neighbors. Points along the same edge usually vary only gradually in
depth. One problem with verifying this consistency is that tracing edge contours can
be complicated process. This approach is unable to detect isolated false edge points.
For a given (x, y) coordinate in the disparity map, we expect at most one cor-
respondence because can can be at most a single correct measured depth z due to
occlusion. Therefore, if the case of multiple correspondences at a single (x, y) coor-
dinate, we can deduce that matches in excess of one must be false. We can identify
regions with a high concentration of excess matches by building a confidence map
which represents the number of extra correspondences, as shown in Figure 5-1(c) and
Figure 5-3(c). Greater excess matches are shown as darker grey; zero excess matches
is white. Notice the large concentration of false correlation in the region of the planar
license plate due to the high density of vertical lines the the plate's characters. The
large number of false matches is reflected by a dark cloud in the region of the place
in the confidence map. The largest number of excess matches occur in rows with a
large number of edge pixels. To be conservative in building the depth map, we always
accept the edge with the largest disparity.
In the previous section, we said that the number of false correspondences may be
reduced by reducing the number of edge points. The number of false edges can be re-
duced by considering positive and negative edges separately. Figure 5-5 shows the re-
duction in error due to separate matching for the example of Figure 5-3. Histogram (d)
shows much more distinguished edge concentrations than (a). Histogram (e) shows
the false correspondences due to false matches among positive and negative edges.
Unfortunately, we are unable to implement this improvement while maintaining per-
formance, due to a hardware limitation. However, this example shows that the ability
to correlation positive and negative edges separately is a valuable technique.

(a)
numb of edge points vs. dispaly
70 80
nurmbe of edge points vs dcsparty
60
40
0 10 20 30 40 50 60 70 so
d(spaby
(b)
dspay
(d)
number of dge points vs dsparity
0 10 o 30 40 5 60 70 80dspartny
(e)
Figure 5-5: Comparison of combined and separate correlation of positive and negativeedges. (a) Combined. (b) Positive edges only. (c) Negative edges only. (d) Sum of(b) and (c). (e) Difference of (a) and (d).
60I I
20
10
0 10 20 30 40 50 60dispady
(c)
i
E~hu~~n

Chapter 6
Conclusions
6.1 Conclusions
This thesis describes an edge based, subpixel stereo algorithm which is adapted to
permit accurate distance measurements to objects in the field of view in real-time
using a compact camera assembly. The emphasis was placed on computational effi-
ciency to achieve real-time performance. The performance benchmarks from on-road
trials indicate that real-time depth recovery is realizable using this system.
6.2 Future Work
There are a number of extensions that can be made to improve the performance of
the algorithm.
* Improve the reliability of the local matching step by considering additional
geometric properties, such the magnitude of the gradient.
* Incorporate a computationally efficient method for compensating for camera
misalignment.
* Use lane markings to identify the vehicle in the same lane.
* Use a sequence of frames to track vehicles in the field of view.

Bibliography
[1] I. Masaki. ASIC approaches for vision-based vehicle guidance. IEICE Trans.Electron., E76-C(12):1735-1743, December 1993.
[2] Berthold K.P. Horn. Robot Vision. MIT Press, Cambridge, MA, 1986.
[3] Olivier Faugeras. Three-dimensional computer vision: a geometric viewpoint.MIT Press, Cambridge, MA, 1993.
[4] 0. Faugeras and B. Mourrain. On the geometry and algebra of the point andline correspondences between N images. In Proceedings of the InternationalConference on Computer Vision, pages 951-956, Cambridge, MA, June 1995.
[5] U. Dhond and J.K. Aggarwal. A cost-benefit analysis of a third camera forstereo correspondence. International Journal of Computer Vision, 6(1):39-58,June 1991.
[6] E. Grimson. Computational experiments with a feature based stereo algorithm.Memo 762, MIT Artificial Intelligence Lab, October 1984.
[7] B. Ross. A practical stereo vision system. In Conf. on Computer Vision andPattern Recognition, pages 149-153, June 1993.
[8] M. Okutomi and T. Kanade. A multiple-baseline stereo. In Conf. on ComputerVision and Pattern Recognition, pages 63-68, June 1991.
[9] B.K.P. Horn and B. Schunck. Determining optical flow. Artificial Intelligence,17:185-204, 1981.
[10] J.R. Bergen and R. Hingorani. Hierarchical motion-based frame rate conversion.Technical report, David Sarnoff Research Center, Princeton, New Jersey, April1990.
[11] A. Shashua and M. Werman. Trilinearity of three perspective views and itsassociated tensor. In Proceedings of the International Conference on ComputerVision, pages 951-956, Cambridge, MA, June 1995.
[12] L. Kaminski, J. Allen, I. Masaki, and G. Lemus. Sub-pixel stereo vision forcost-effective intelligent vehicle applications. In Proc. of Intern. Symposium onIntelligent Vehicles, pages 7-12, September 1995.

[13] D. K. Naidu and R. B. Fisher. A comparison of algorithms for sub-pixel peakdetection. Dept. of Artificial Intelligence Research Paper 553, University of Ed-inburgh, Computer Science Department, Scotland, October 1991.
[14] Y. Ninomiya, S. Matsuda, M. Ohta, and Y. Harata. A real-time vision forintelligent vehicles. In Proc. of Intern. Symposium on Intelligent Vehicles, pages315-320, September 1995.
[15] C. Stewart and C. Dyer. The trinocular general support algorithm: a threecamera stereo algorithm for overcoming binocular matching errors. Technicalreport, Computer Science Dept., Univerity of Wisconsin-Madison, 1988.
[16] T. Kanade. A stereo machine for video-rate dense depth mapping and its new ap-plications. In Proc. of Image Understanding Workshop, pages 805-811, February1996.
[17] J. Canny. A computational approach to edge detection. IEEE Transactions onPattern Analysis and Machine Intelligence, 8(6):679-698, November 1986.
[18] D. Marr and E. Hildreth. Theory of edge detection. In Proc. of Royal SocietyLondon, Ser. B, Vol. 207, pages 187-217, 1980.
[19] William K. Pratt. Digital Image Processing. John Wiley and Sons, Inc., NewYork, second edition, 1991.
[20] I. Masaki et. al. New architecture paradigms for analog VLSI chips. In C. Kochand H. Li, editors, Vision Chips: Implementing Vision Algorithms with AnalogVLSI circuits, pages 353-375. IEEE Computer Society Press, 1995.
[21] J. Wyatt et. al. Analog VLSI systems for image acquisition and fast early visionprocessing. International Journal of Computer Vision, 8(3):217-230, August1992.
[22] David A. Martin. ADAP: A mixed-signal array processor with early vision appli-cations. PhD dissertation, Massachusetts Institute of Technology, Departmentof Electrical Engineering and Computer Science, August 1996.
[23] G. Erten and R. Goodman. Analog VLSI implementation for stereo correspon-dence between 2-D images. IEEE Transations on Neural Networks, 7(2):266-277,March 1996.
[24] J. Gealow et. al. System designs for pixel-parallel image processing. IEEETransactions on Very Large Scale Integration (VLSI) Systems, 4(1):32-41, March1996.
[25] S. Decker and C. Sodini. Comparison of CCD and CMOS pixels for a widedynamic range imager. 1995 IEEE Workshop on Charge-Coupled Devices andAdvances Image Sensors, April 1995.
) r •.-• ' :Q ',c ' , ....