a context-aware tour guide: user implicationsbura.brunel.ac.uk/bitstream/2438/6988/5/fulltext.pdfa...
TRANSCRIPT

A Context-Aware Tour Guide: User Implications
S. R. Gulliver* M. Patel G. Ghinea T. Serif
* School of Information Systems, Computing and Mathematics
Brunel University, UB8 3PH, United Kingdom.
Phone: +44 1895266103; Fax+44 1895251686
Abstract
1. Introduction
The rapid growth of mobile technologies has placed increased focus on "context-aware"
computing, which refers to a program or application feature that changes, depending on
the environmental conditions of the user throughout the operation of the application
(Simcock et al, 2003). The growth of context-aware computing has led to the
development of ubiquitous location dependent applications, such mobile tour guide
systems. Although providing regular updated information about the users’ current
location, as well as displaying detailed information about specific features linked to their
position, relatively limited work has been done investigating the impact of context-aware
information on system usability (Davies et al., 2005; Laakso et al., 2003).
This is precisely the issue addressed by this paper. The following paper compares two
tour guide systems developed for Brunel University (West London Uxbridge Campus);
one with context-aware user feedback and one without. This paper therefore looks at the
impact of using real-time context-aware tour guide on system usability. In so doing, we
hope to depart from the implicit assumption that, in early stages of proliferation,
“technology shapes usability” and highlight the specific usability issues that context-
aware systems raise and that designers of such systems must consequently take into
consideration. Accordingly, the structure of this paper is as follows:.
++++.
2. Background
2.1. Introducing Context-Aware Computing
The term “context aware” software was first introduced by Schilit and is categorised as

software that adapts according to the location of use, as well as the proximity of entities
(people, hosts, and / or devices). Moreover context-aware systems consider the
changes to such entities over time. Stated simply, it is a system that can examine the
computing environment and react to changes in the environment (Schilit et al, 94). Schilit
describes contextual information as relating to either:
Computing context: i.e. information relating to network connectivity, printers,
scanners, projectors, workstations (objects that would be found in a computing
environment), etc.
User context: such as location and orientation, or current social issues, etc.
Physical context: such as lighting, noise levels and temperature, etc
Subsequently this definition was refined by other researchers. Ryan et al. (1997) define
context as “location, identity, environment and time”. Dey (2000) defines context as
being any information that can be used to characterise the situation of an entity. An
entity can be a person, place, or object that is considered relevant to the interaction
between the user and an application, including the user and the applications themselves.
Moreover, in support of Schilit’s and Ryan et al., it has been argued that time is also
important. Chen and Kotz (Chen and Kotz, 2000) suggested time was an important
aspect of context aware computing, defining it as the fourth definition criterion:
Time context: such as month, time of day, season of year and date.
The concept of context is undergoing a continuous transformation and refinement. In a
point of view, close to us, Kakihara and Sørensen (2002) argue for including interaction
as an essential dimension of context, whilst Dourish (2003) espouses that the traditional
meaning of context is positivist-technical and ignores the social-phenomenological
aspect. He therefore argues that context and activity are inseparable.
Context aware computing can be used in applications supporting the following four
techniques (Schilit et al, 94):
1. Proximate Selection: this is where a user interface uses context information to
ensure that objects located in close proximity are emphasised to make it easier for
the user to choose certain functions.
2. Automatic Contextual Reconfiguration: this is the process of using context
information to remove existing components, add new components, or change the
connections between the components, in order to aid usability.
3. Contextual information and commands is where application outcomes and / or
results may differ depending on contextual information.
4. Context Triggered Actions are systems where contextual information is combined
with IF-THEN rules to specify how context aware systems should adapt.
Now that context aware computing, and its application, has been defined and described,
we shall take a look at existing context-aware Tour Guide applications.
2.2. Context aware Tour Guide Applications
Tour guides are one of the earliest and most well known applications of context-aware
computing. Such applications include AudioGPS (Holland et al., 2002), Deepmap (Kray,
2003), LAMP3D (Burrigat and Chittaro, 2005), LOL@ (Pospischil et al., 2002), GUIDE /
GECS (Cheverst et al., 2002 / Davies et al. 2005), Hippie Hipps (Oppermann and
Specht, 2000), as well as the TellMaris Guide, described by Laakso et al. (2003). This
section introduces two previously developed location-based mobile tourist guide systems
which are functionally closest to the developed Brunel Tour Guide system: Cyberguide
(Abowd et al., 1997) and Tourist Guide (Simcock et al., 2003).
Global Positioning System (GPS): A short introduction
GPS has become a commercial buzz-word in recent years, with most people associating
this technology with Satellite Navigation in-car tools. For the uninitiated, GPS is a
satellite positioning system that was created initially for military purposes, but is now
used commercially for purposes including tracing, navigation or even for location based
services. GPS is made up of twenty-four high-altitude satellites. Each satellite contains a
very precise atomic clock, which is continuously synchronised with a global network of
satellite tracking stations (Beisner et al, 1996). By combining signals from numerous
satellites, and determining the minute transmission delays between different satellites, a
GPS receiving device (or receiver) can calculate its relative position on Earth using
latitude, longitude and altitude values. By incorporating these values with software, the
user can determine both where he/she is, yet more importantly what is also available in
that present location. Although other location techniques exist, GPS allows simple,
accurate and affordable location based solutions, regardless the weather condition or
number of users (King, 2003).

2.2.1 Cyberguide
One of the context-aware tour guides was the Cyberguide [ABO96], which was initially
implemented as a building guide by the Future Computing Environments (FCE) group at
the Georgia Institute of Technology for the computer science department open days, and
was later improved and extended to guide its users through the city of Atlanta. The FCE
group were greatly influenced by PARCTab at Xerox PARC (Schilit et al., 1995), the
InfoPad project (Brodersen, 1997), the Active Badge System (Want et al., 1992) and the
Project Voyager Personal Shopping Assistant (Chan, 2001). Accordingly, the cyberguide
aimed to build applications that would take advantage of the hardware developed in the
PARCTab and InfoPad projects. Two outdoor cyberguide prototypes were developed to be
used; one was centred on the Georgia Institute of Technology campus and the second
prototype covered three residential areas surrounding the campus. The core of this system
is divided into four components, namely map component, information component,
positioning component, and the commutation component.
2.2.2 Tourist Guide
A similar piece of work was undertaken by Simcock et al [SIM03] who build a location
based tourist guide application, using a PDA and a GPS connection, and look at the
design and usability issues. The ‘Tourist Guide’ project investigated the use of context-
aware mobile computing using visitors of the Mawson Lakes campus based at the
University of South Australia and the North Terrace estate in the Adelaide city centre.
The portable device used in the project was the Compaq Aero PDA, which was
connected to a Garmin GPS navigation unit that provided the location information
needed to run the application.
The user interface has three main modes of interactions: map view, where the user
can see his/her location and the surrounding buildings on a map; guide view, where the
user is provided with a path of interesting attractions, and, finally, the attractions view,
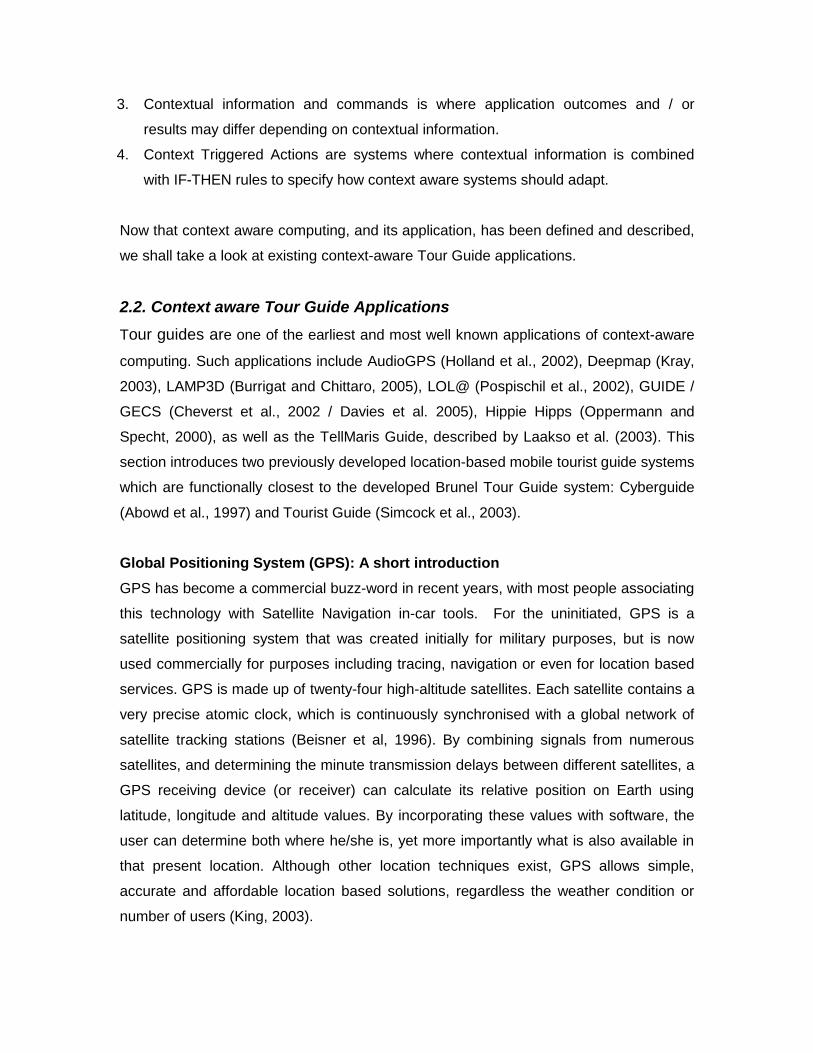
where the user is streamed audio-visual tourist information. As the user walked near to a
highlighted attraction, the system would automatically switch to attraction mode. The
location of an attraction was defined using four GPS coordinates that formed a polygon
around the attraction (see Figure1). The attraction mode accessed ‘Hotspot’ files, which
presented the user with contextually relevant sound, images, and text-based tourist
information. All the colour schemes and map annotations are designed in a manner that
is clearly visible to the user on the move.
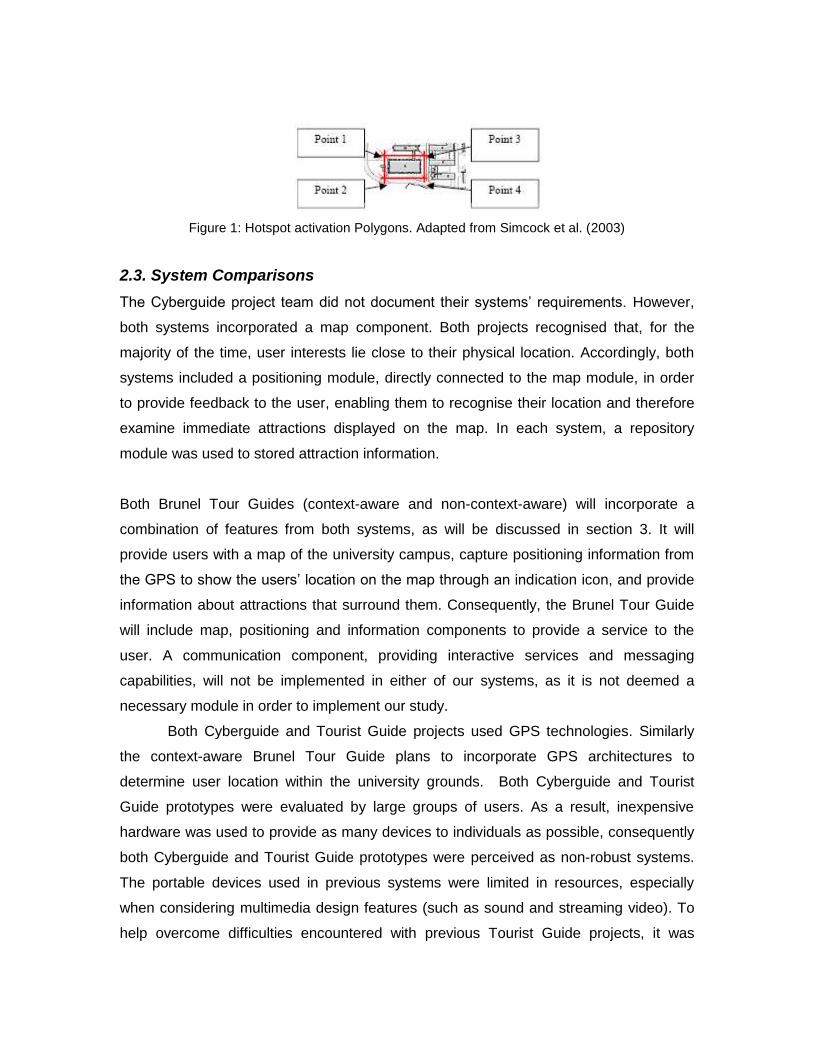
Figure 1: Hotspot activation Polygons. Adapted from Simcock et al. (2003)
2.3. System Comparisons
The Cyberguide project team did not document their systems’ requirements. However,
both systems incorporated a map component. Both projects recognised that, for the
majority of the time, user interests lie close to their physical location. Accordingly, both
systems included a positioning module, directly connected to the map module, in order
to provide feedback to the user, enabling them to recognise their location and therefore
examine immediate attractions displayed on the map. In each system, a repository
module was used to stored attraction information.
Both Brunel Tour Guides (context-aware and non-context-aware) will incorporate a
combination of features from both systems, as will be discussed in section 3. It will
provide users with a map of the university campus, capture positioning information from
the GPS to show the users’ location on the map through an indication icon, and provide
information about attractions that surround them. Consequently, the Brunel Tour Guide
will include map, positioning and information components to provide a service to the
user. A communication component, providing interactive services and messaging
capabilities, will not be implemented in either of our systems, as it is not deemed a
necessary module in order to implement our study.
Both Cyberguide and Tourist Guide projects used GPS technologies. Similarly
the context-aware Brunel Tour Guide plans to incorporate GPS architectures to
determine user location within the university grounds. Both Cyberguide and Tourist
Guide prototypes were evaluated by large groups of users. As a result, inexpensive
hardware was used to provide as many devices to individuals as possible, consequently
both Cyberguide and Tourist Guide prototypes were perceived as non-robust systems.
The portable devices used in previous systems were limited in resources, especially
when considering multimedia design features (such as sound and streaming video). To
help overcome difficulties encountered with previous Tourist Guide projects, it was
decided that a mobile laptop should be used for the purposes of the study.
Both guide systems aimed to develop a computer-based system that informs the
user of their location in a physical setting, providing information about objects within the
surrounding environment. Both aimed to prototype their systems on commercially
available hardware. However, neither of these projects aimed to evaluate the usability of
their systems and compare them to conventional (non context-aware) tour guide
systems.
Indeed, while evaluations of context-aware tourist guides are presented as standard,
with some work even focusing on field trials (Goodman et al., 2004), the exploration of
usability considerations in their development has been surprisingly limited. Of the efforts
in this sense, we mention Laakso et al. (2003) who investigated the usefulness of 3D
maps in such applications and that of Davies et al. (2005) who investigated user reaction
to the use of digital image capture and recognition in a modified version of GUIDE. From
a very different perspective, Elting et al. (2002) implemented a static tourist information
system and looked at the effect that different output modality-combinations have on the
devices’ effectiveness to transport information and on the user’s acceptance of the
system being used. As test data, it uses a web based tourist guide that contains text and
images and results show that the most appealing form of information transfer is
combined picture, text and speech. Nonetheless, previous work has not examined, from
a usability perspective, the use of interactive maps in context-aware tour guides, which
formed the focus of our efforts described in this paper.
The Brunel Tour Guide will address this point by comparing software that does and does
not incorporate information from the positioning component.
3. The Brunel Tourist Guide System
3.1. System Design
The non-context aware and context aware applications will be similar in terms of
appearance and functionality. The system architecture for both will consist of two to
three fundamental components, which include a map, positioning and information
components.
Figure 2 illustrates the relationship between all components. The non-GPS
system does not use GPS, and therefore a positioning component will not be included in
its system architecture. The primary point of interaction on the user interface will be a
map display of the campus. All major attractions / buildings were included in the tour
content and users will be able to distinguish the location of these by using the map.
Accordingly, when using the non-context-aware system, there will be a mechanism
allowing users to view detailed information about a particular building. Each building will
be allocated some kind of icon to represent its presence on the map, allowing users to
click on one to enter a range of information about that particular building. The
component will be broken down into details about a particular building, including a
textual description and images of the indoor contents. Additionally, this will also be
broken down, by presenting a list of departments/units associated with each building
and, subsequently, access to its relevant details.
REDRAW
Figure 2 – context-aware Brunel Guide system architecture
Because the Brunel Tour Guide is an upgrade of the non-GPS application, the only
addition to the program is the incorporation of a positioning component (see figure 2).
This is the variable that differentiates the two systems. This study is primarily concerned
with the usability impact of integrating this component. The role of the positioning
component determines the real-time location of the user: latitude, longitude and altitude,
respectively. These coordinates can be used to calculate the users’ pixel position on the
map. This pixel position represents the users’ current real-time location, which will be
visually displayed on the map through a user location icon. The map will include hidden
polygons, which each behave as a dynamic proximity location box - when the user walks
into one of these boxes, a list of buildings will be displayed, using pop-ups, of
information in the users’ proximity via the information component. Users will be able to
select which building they wish to view and, similar to the non-GPS system, the
associated information linked to each building.
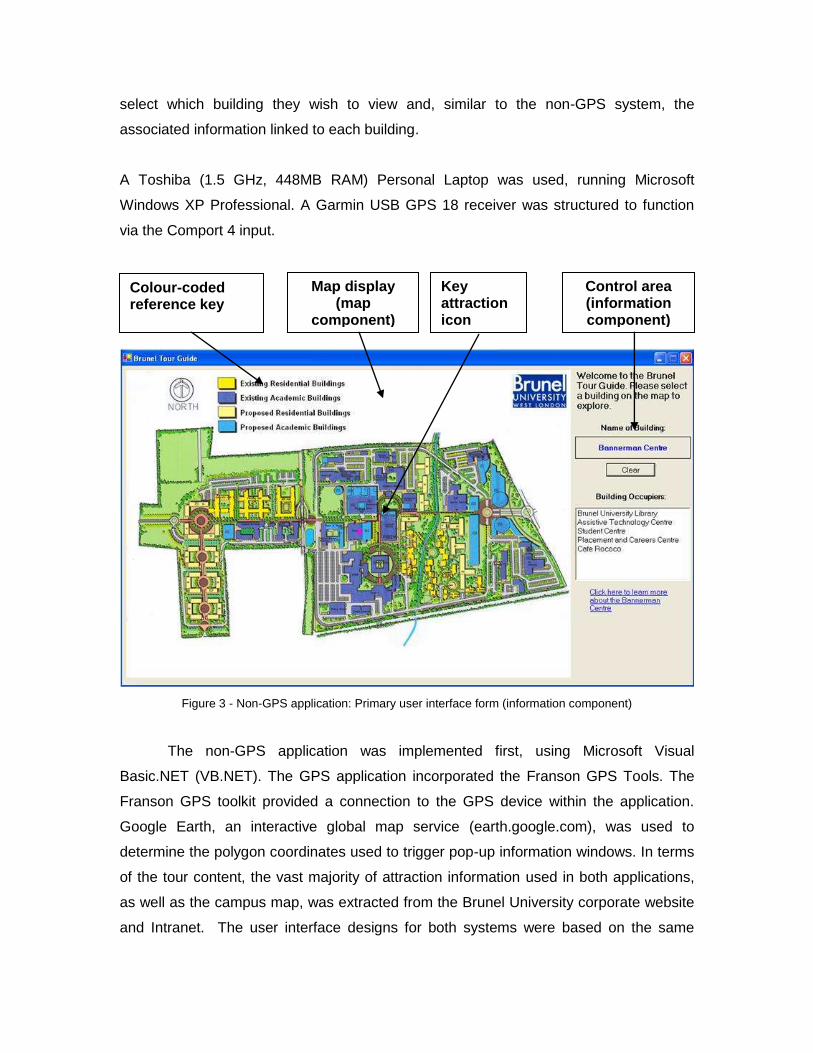
A Toshiba (1.5 GHz, 448MB RAM) Personal Laptop was used, running Microsoft
Windows XP Professional. A Garmin USB GPS 18 receiver was structured to function
via the Comport 4 input.
Figure 3 - Non-GPS application: Primary user interface form (information component)
The non-GPS application was implemented first, using Microsoft Visual
Basic.NET (VB.NET). The GPS application incorporated the Franson GPS Tools. The
Franson GPS toolkit provided a connection to the GPS device within the application.
Google Earth, an interactive global map service (earth.google.com), was used to
determine the polygon coordinates used to trigger pop-up information windows. In terms
of the tour content, the vast majority of attraction information used in both applications,
as well as the campus map, was extracted from the Brunel University corporate website
and Intranet. The user interface designs for both systems were based on the same
Key attraction icon
Map display (map
component)
Control area (information component)
Colour-coded reference key
basic interface design. Although the map display was defined as the primary point of
user interaction on the interface, a designated control area was included as input was
required when operating the non-context-aware Brunel systems (see Figure 3 and 4). A
total of one hundred and forty four user interface forms were created when implementing
the non-GPS application. One hundred and sixty two forms were created for the Brunel
Tour Guide. The association links between the forms in both systems were based on a
detailed use case and activity assessment. It was imperative to create a significant
amount of forms as both applications were to be visually driven.
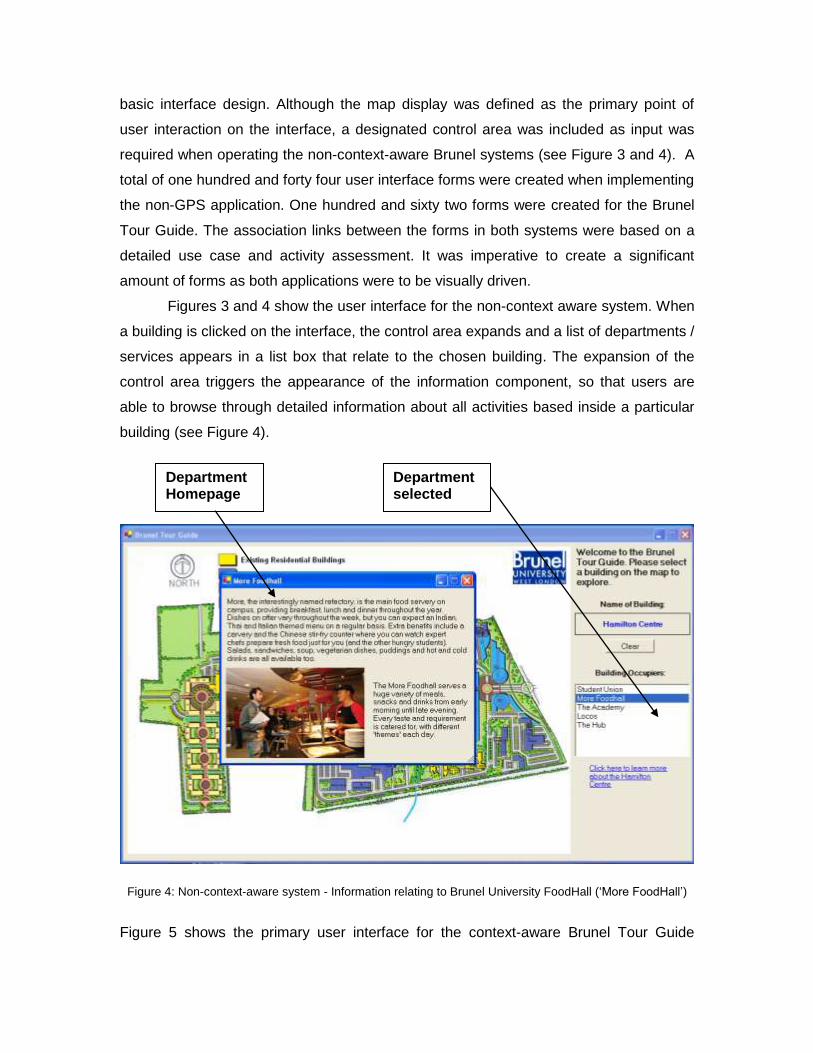
Figures 3 and 4 show the user interface for the non-context aware system. When
a building is clicked on the interface, the control area expands and a list of departments /
services appears in a list box that relate to the chosen building. The expansion of the
control area triggers the appearance of the information component, so that users are
able to browse through detailed information about all activities based inside a particular
building (see Figure 4).
Figure 4: Non-context-aware system - Information relating to Brunel University FoodHall (‘More FoodHall’)
Figure 5 shows the primary user interface for the context-aware Brunel Tour Guide
Department selected
Department Homepage
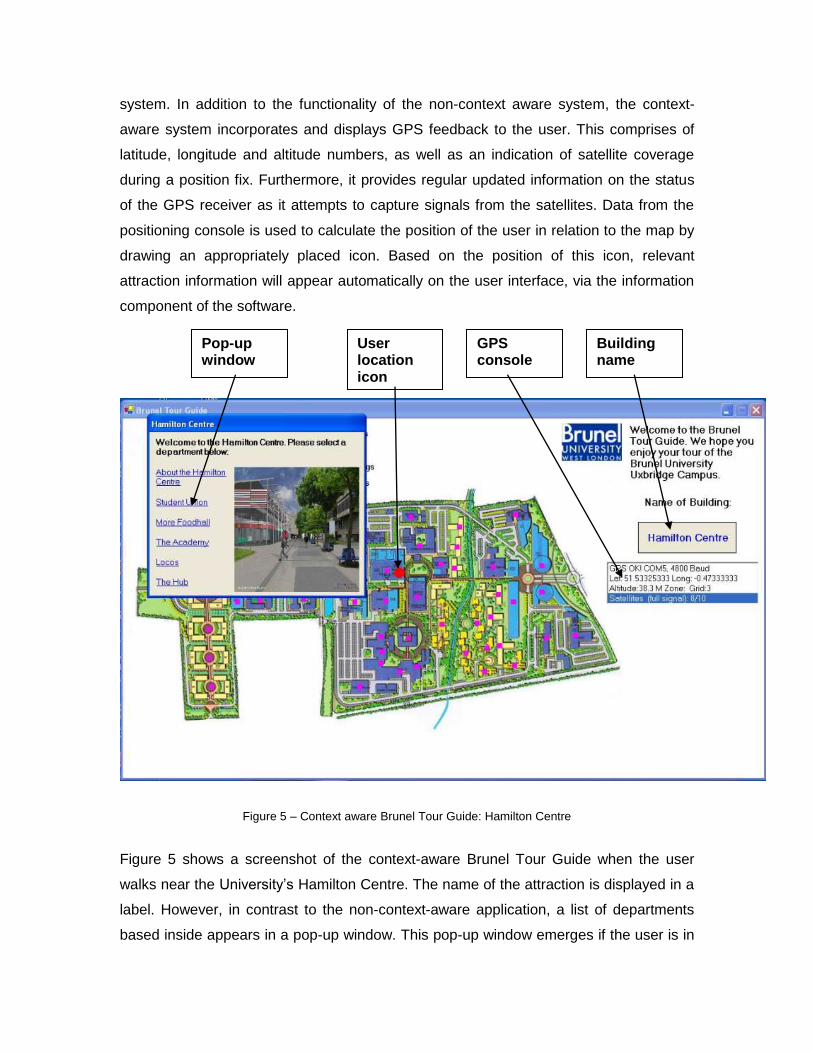
system. In addition to the functionality of the non-context aware system, the context-
aware system incorporates and displays GPS feedback to the user. This comprises of
latitude, longitude and altitude numbers, as well as an indication of satellite coverage
during a position fix. Furthermore, it provides regular updated information on the status
of the GPS receiver as it attempts to capture signals from the satellites. Data from the
positioning console is used to calculate the position of the user in relation to the map by
drawing an appropriately placed icon. Based on the position of this icon, relevant
attraction information will appear automatically on the user interface, via the information
component of the software.
Figure 5 – Context aware Brunel Tour Guide: Hamilton Centre
Figure 5 shows a screenshot of the context-aware Brunel Tour Guide when the user
walks near the University’s Hamilton Centre. The name of the attraction is displayed in a
label. However, in contrast to the non-context-aware application, a list of departments
based inside appears in a pop-up window. This pop-up window emerges if the user is in
Building name
Pop-up window
GPS console
User location icon
the physical vicinity of a particular building. The triggering of a pop-up window is
dependent on the GPS data shown in the GPS console. Data from the console shows
the position of the user in relation to the map by drawing a red icon at the relevant pixel
position. The icon is dynamic and flashes, in order to grab the attention of the user.
Based on the position of this icon, the appropriate pop-up window appears automatically
on the user interface.
4. Evaluation
Each system was assessed against three usability measurements: effectiveness,
efficiency and satisfaction. This section starts by discussing the evaluation strategy
applied in more detail. This is followed by a comparison of both context-aware and non-
context aware applications in order to determine whether the notification of real-time
feedback of user location positively or negatively influences three usability
measurements (efficiency, effectiveness and satisfaction). Subsequently, a list of
guidelines will be formulated to provide information on building GPS-based mobile tourist
guide software, supported by a summary of knowledge, findings and results obtained
during this study.
4.1 Evaluation Strategy
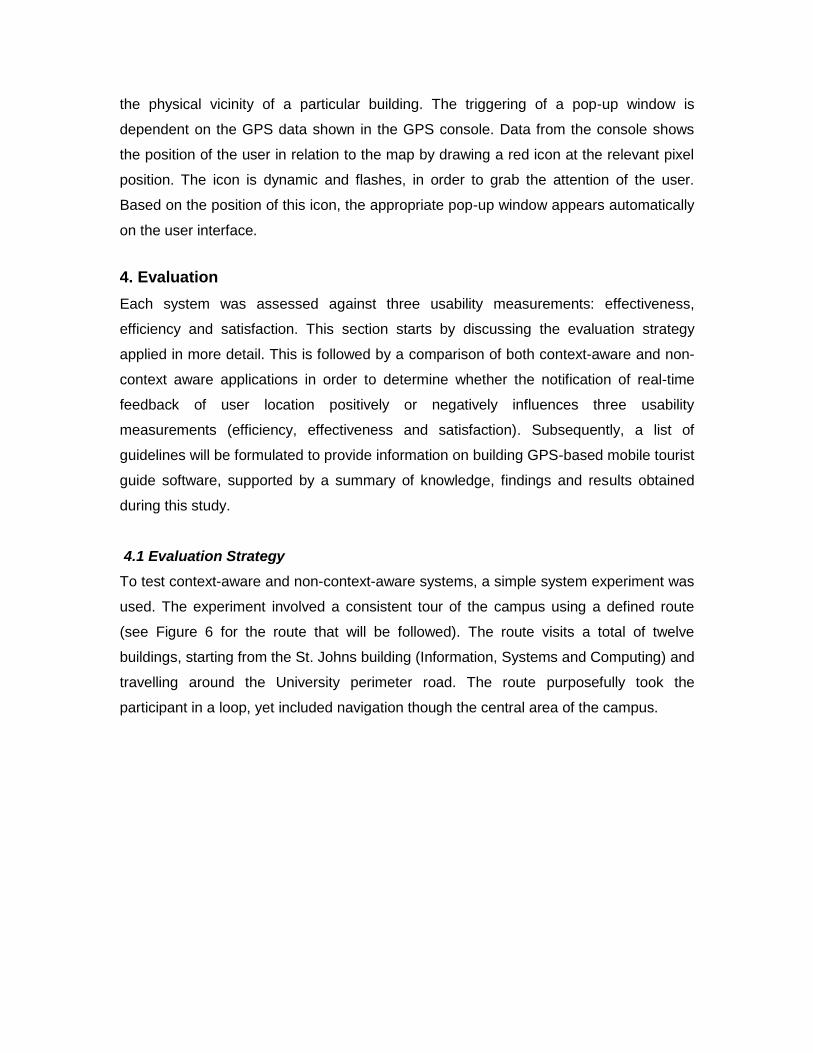
To test context-aware and non-context-aware systems, a simple system experiment was
used. The experiment involved a consistent tour of the campus using a defined route
(see Figure 6 for the route that will be followed). The route visits a total of twelve
buildings, starting from the St. Johns building (Information, Systems and Computing) and
travelling around the University perimeter road. The route purposefully took the
participant in a loop, yet included navigation though the central area of the campus.
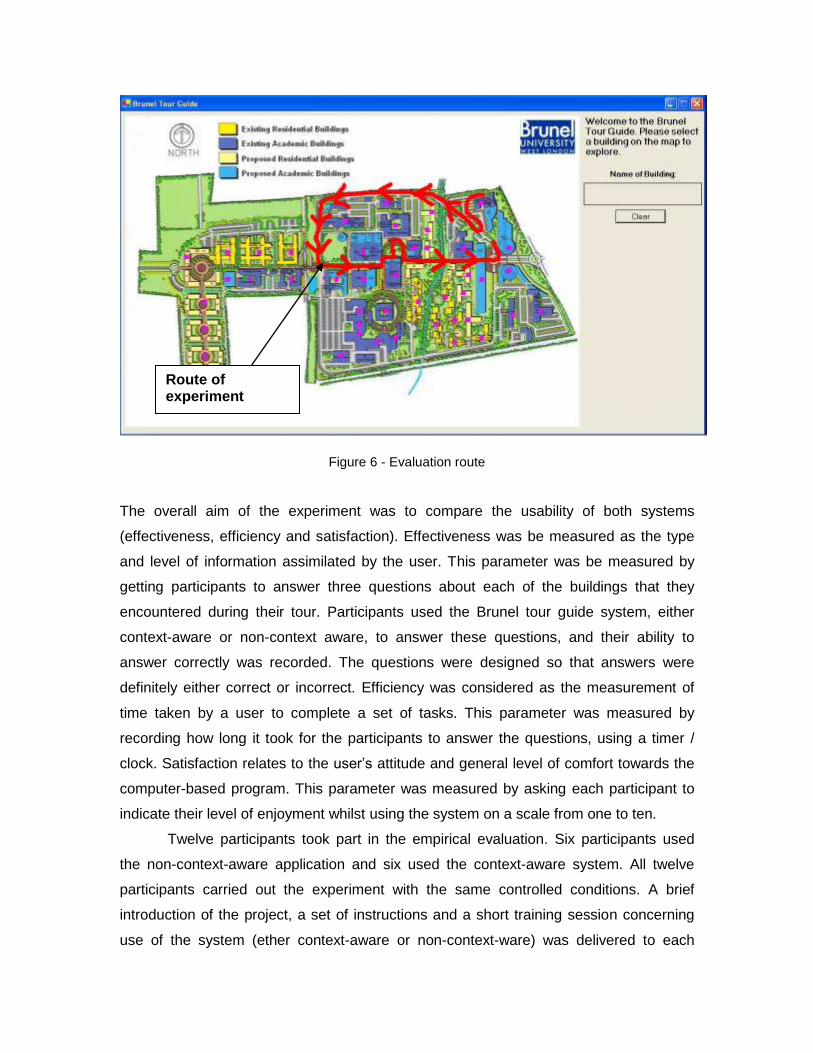
Figure 6 - Evaluation route
The overall aim of the experiment was to compare the usability of both systems
(effectiveness, efficiency and satisfaction). Effectiveness was be measured as the type
and level of information assimilated by the user. This parameter was be measured by
getting participants to answer three questions about each of the buildings that they
encountered during their tour. Participants used the Brunel tour guide system, either
context-aware or non-context aware, to answer these questions, and their ability to
answer correctly was recorded. The questions were designed so that answers were
definitely either correct or incorrect. Efficiency was considered as the measurement of
time taken by a user to complete a set of tasks. This parameter was measured by
recording how long it took for the participants to answer the questions, using a timer /
clock. Satisfaction relates to the user’s attitude and general level of comfort towards the
computer-based program. This parameter was measured by asking each participant to
indicate their level of enjoyment whilst using the system on a scale from one to ten.
Twelve participants took part in the empirical evaluation. Six participants used
the non-context-aware application and six used the context-aware system. All twelve
participants carried out the experiment with the same controlled conditions. A brief
introduction of the project, a set of instructions and a short training session concerning
use of the system (ether context-aware or non-context-ware) was delivered to each
Route of experiment
participant. A paper map of the route was given to each participant. Participants had no
previous knowledge of the topology or the route to be followed, nor the questions that
were asked. Using the onscreen and paper maps, the participants navigated between
certain target buildings. Participants were asked to stop once they arrived at a target
building, as marked on the paper map. Once a participant has arrived at a particular
building, the timer was started and they were asked to answer three relevant questions
about the current building. When participants had identified and provided answers to all
questions, the timer was stopped and, when the participant was ready, asked to move
on to the next location.
4.2 Evaluation Results and Analysis
After all experiments were conducted, the participants’ data was analysed. Score, time
and satisfaction were classed as dependent variables, with time representing efficiency
(the combined average time taken for participants to answer the questions), score
representing effectiveness (the participants combined average number of questions
answered correctly) and satisfaction represented by the participants combined average
level of comfort towards the use of the systems. In order to analyse these usability
measurements, the following analysis questions were addressed in section 4.2.1, 4.2.2
and 4.2.3 respectively for each usability variable:
Is this variable dependent on the building, which is being visited?
Is this variable dependent on the question number?
Is this variable dependent on the participant conducting the experiment?
Is this variable dependent on the incorporation of context-aware functionality?
4.2.1. Efficiency
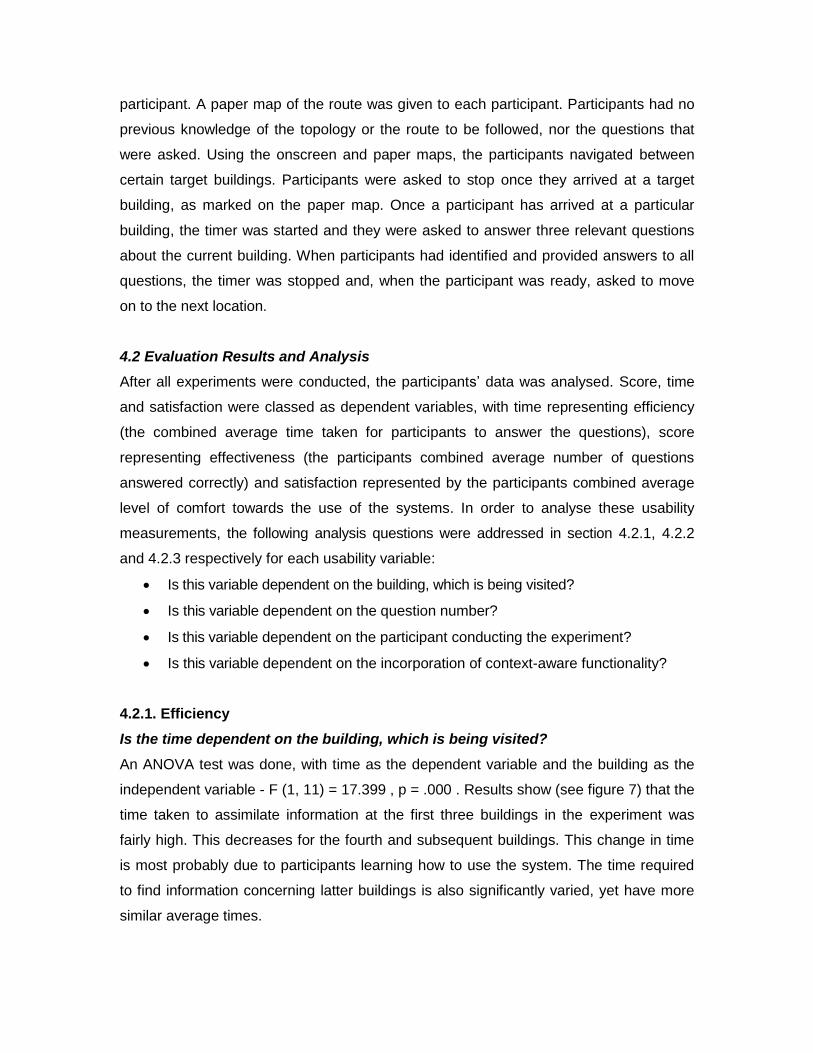
Is the time dependent on the building, which is being visited?
An ANOVA test was done, with time as the dependent variable and the building as the
independent variable - F (1, 11) = 17.399 , p = .000 . Results show (see figure 7) that the
time taken to assimilate information at the first three buildings in the experiment was
fairly high. This decreases for the fourth and subsequent buildings. This change in time
is most probably due to participants learning how to use the system. The time required
to find information concerning latter buildings is also significantly varied, yet have more
similar average times.
122424363636362424121212N =
BUILDING
12.00
11.00
10.00
9.00
8.00
7.00
6.00
5.00
4.00
3.00
2.00
1.00
95
% C
I T
IME
80
70
60
50
40
30
20
10
0
Figure 7 - Error Bar: Time (in seconds) against Building
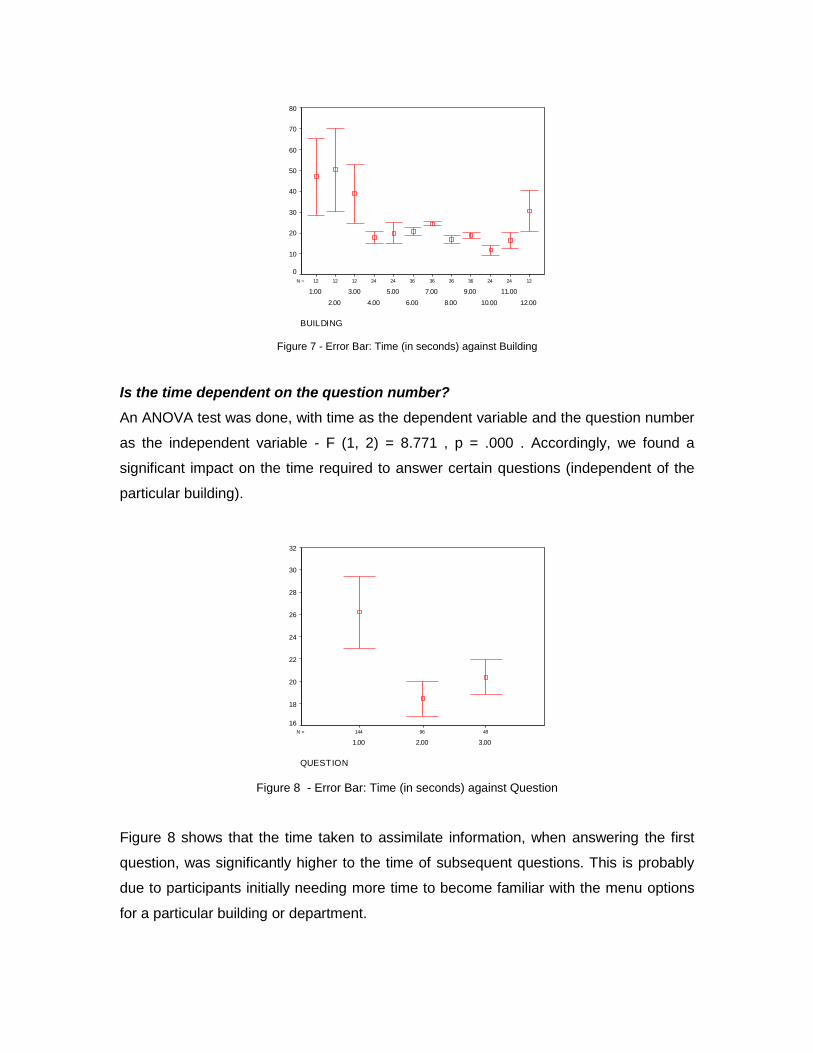
Is the time dependent on the question number?
An ANOVA test was done, with time as the dependent variable and the question number
as the independent variable - F (1, 2) = 8.771 , p = .000 . Accordingly, we found a
significant impact on the time required to answer certain questions (independent of the
particular building).
4896144N =
QUESTION
3.002.001.00
95
% C
I T
IME
32
30
28
26
24
22
20
18
16
Figure 8 - Error Bar: Time (in seconds) against Question
Figure 8 shows that the time taken to assimilate information, when answering the first
question, was significantly higher to the time of subsequent questions. This is probably
due to participants initially needing more time to become familiar with the menu options
for a particular building or department.
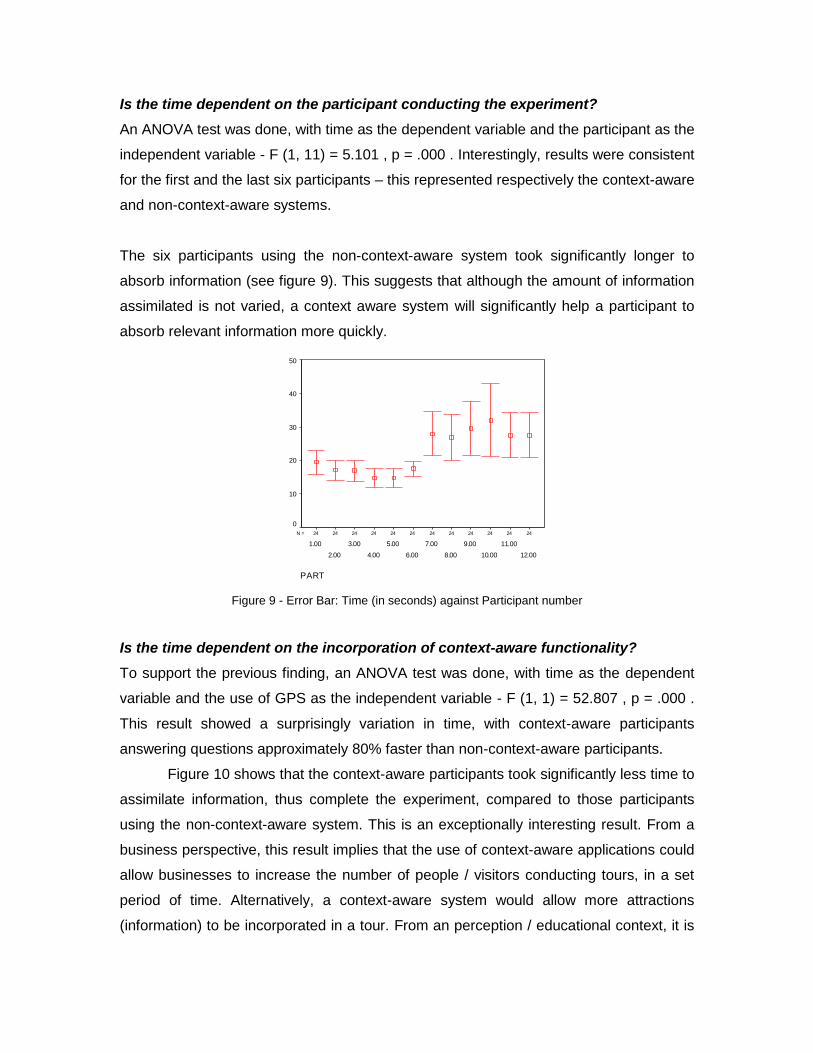
Is the time dependent on the participant conducting the experiment?
An ANOVA test was done, with time as the dependent variable and the participant as the
independent variable - F (1, 11) = 5.101 , p = .000 . Interestingly, results were consistent
for the first and the last six participants – this represented respectively the context-aware
and non-context-aware systems.
The six participants using the non-context-aware system took significantly longer to
absorb information (see figure 9). This suggests that although the amount of information
assimilated is not varied, a context aware system will significantly help a participant to
absorb relevant information more quickly.
242424242424242424242424N =
PART
12.00
11.00
10.00
9.00
8.00
7.00
6.00
5.00
4.00
3.00
2.00
1.00
95
% C
I T
IME
50
40
30
20
10
0
Figure 9 - Error Bar: Time (in seconds) against Participant number
Is the time dependent on the incorporation of context-aware functionality?
To support the previous finding, an ANOVA test was done, with time as the dependent
variable and the use of GPS as the independent variable - F (1, 1) = 52.807 , p = .000 .
This result showed a surprisingly variation in time, with context-aware participants
answering questions approximately 80% faster than non-context-aware participants.
Figure 10 shows that the context-aware participants took significantly less time to
assimilate information, thus complete the experiment, compared to those participants
using the non-context-aware system. This is an exceptionally interesting result. From a
business perspective, this result implies that the use of context-aware applications could
allow businesses to increase the number of people / visitors conducting tours, in a set
period of time. Alternatively, a context-aware system would allow more attractions
(information) to be incorporated in a tour. From an perception / educational context, it is

interesting as it implies that being context aware is critical to the amount of information
that can be assimilated in a definite duration of time. In our study the individuals using
the context-aware system did not assimilate more information from each location, but
they were able to navigate between and engage with each location with a considerably
increase in speed.
144144N =
GPS
1.00.00
95
% C
I T
IME
40
30
20
10
Figure 10 - Error Bar: Time against GPS (.00 denotes non-GPS system, 1.00 denotes Brunel Tour Guide)
4.2.2. Effectiveness
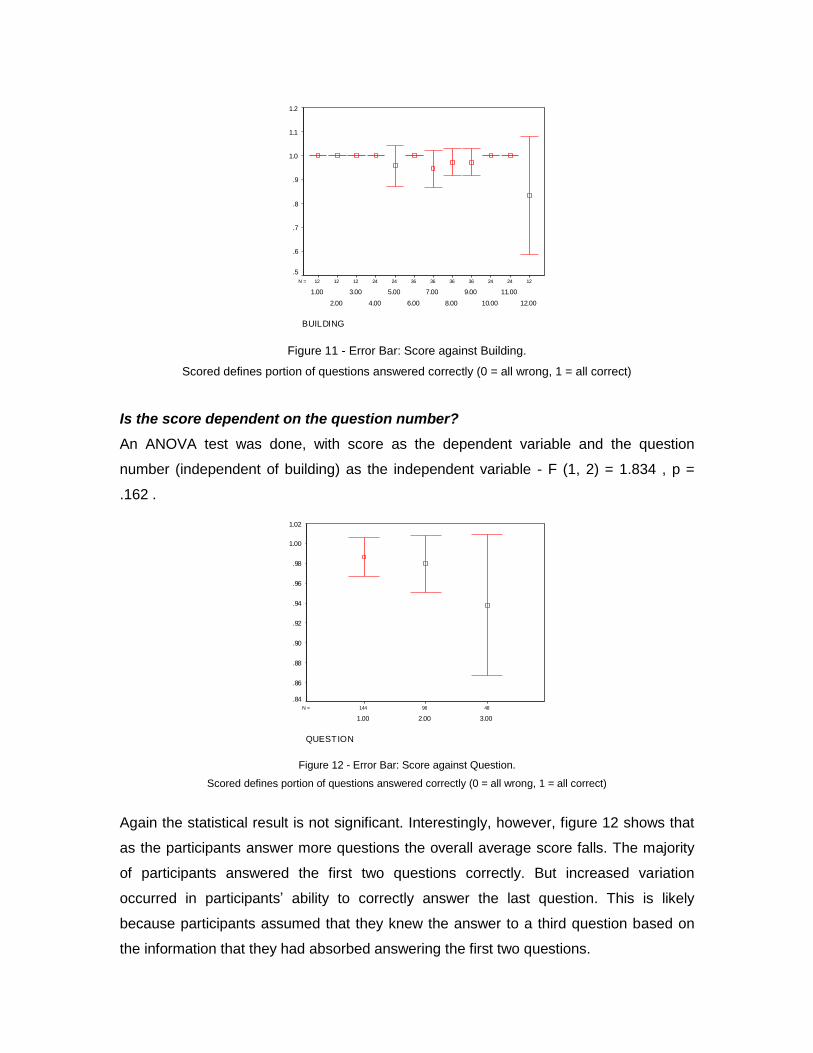
Is the score dependent on the building, which is being visited?
An ANOVA (ANalysis Of VAriance) test was done, with score as the dependent variable
and building number as the independent variable - F(1, 11) = 1.443 , p = .153 . Although
not significant, figure 11 shows variance in participants’ ability to answer questions
correctly. The most extreme variance can be found for building twelve (the last building
on the tour - when participants were more focused on completing the task, than correctly
answering the questions). When visiting this building, there was a significant variation in
the number range of scores. Because we had a high standard deviation in scores for the
last question, the result was not considered as significant. However this represents a
considerable spread, and a large drop in average. This result may be because of limited
participant interest in the specific building, but is more likely due to order effects.
122424363636362424121212N =
BUILDING
12.00
11.00
10.00
9.00
8.00
7.00
6.00
5.00
4.00
3.00
2.00
1.00
95
% C
I S
CO
RE
1.2
1.1
1.0
.9
.8
.7
.6
.5
Figure 11 - Error Bar: Score against Building.
Scored defines portion of questions answered correctly (0 = all wrong, 1 = all correct)
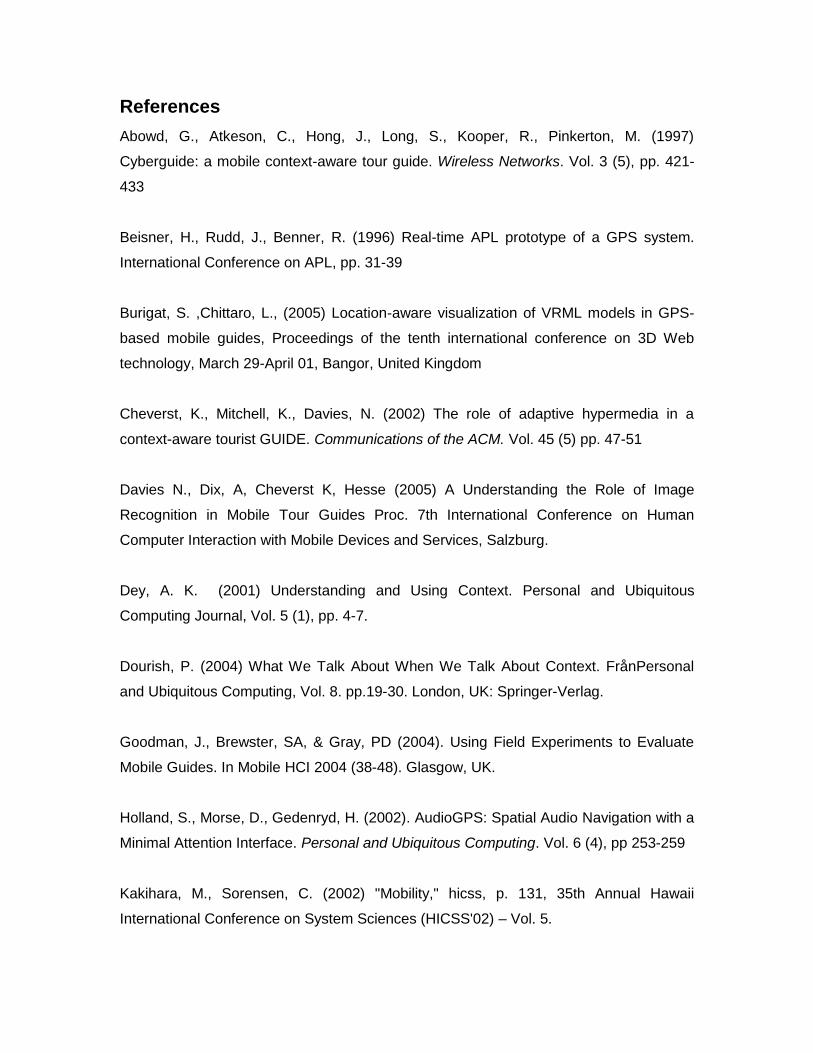
Is the score dependent on the question number?
An ANOVA test was done, with score as the dependent variable and the question
number (independent of building) as the independent variable - F (1, 2) = 1.834 , p =
.162 .
4896144N =
QUESTION
3.002.001.00
95
% C
I S
CO
RE
1.02
1.00
.98
.96
.94
.92
.90
.88
.86
.84
Figure 12 - Error Bar: Score against Question.
Scored defines portion of questions answered correctly (0 = all wrong, 1 = all correct)
Again the statistical result is not significant. Interestingly, however, figure 12 shows that
as the participants answer more questions the overall average score falls. The majority
of participants answered the first two questions correctly. But increased variation
occurred in participants’ ability to correctly answer the last question. This is likely
because participants assumed that they knew the answer to a third question based on
the information that they had absorbed answering the first two questions.

Is the score dependent on the participant conducting the experiment?
An ANOVA test was done, with score as the dependent variable and the participant as
the independent variable - F (1, 11) = 1.105 , p = .357 . Greater consistency in results
was found for the first six participants, who used the context-aware system. However,
this finding was not deemed as being significant.
Is the score dependent on the incorporation of context-aware functionality?
An ANOVA test was done, with score as the dependent variable and the use of GPS as
the independent variable - F (1, 1) = .145 , p = .703 . A slight increase was found on the
combined average score of the participants using the context-aware system, yet this
finding was not deemed as being significant.
4.2.3. Satisfaction
Is the satisfaction dependent on the building, which is being visited?
An ANOVA test was done, with satisfaction as the dependent variable and the building
number as the independent variable - F (1, 11) = .000 , p = 1.000 . This test showed no
preference was made to any particular building.
Is the satisfaction dependent on the question number?
An ANOVA test was done, with satisfaction as the dependent variable and the question
number as the independent variable - F (1, 2) = .000 , p = 1.000 . This test showed no
preference was made to any question number.
Is the satisfaction dependent on the participant conducting the experiment?
An ANOVA test was done, with satisfaction as the dependent variable and the
participant number as the independent variable - F (1, 11) = 5.888 , p = .000 . Not
surprisingly this result showed a significant variation. People always like different things,
so it is rarely a surprise to find significant variation as a result of individual user
preference.
Is the satisfaction dependent on the incorporation of context-aware functionality?
To check whether use of a context-aware system impacted a users’ general satisfaction,
an ANOVA test was done, with satisfaction as the dependent variable and the use of

GPS as the independent variable (independent of a specific participant) - F (1, 1) =
27.902 , p = .000 . This finding was also found to be significant, with users of the context
aware system being, on average, more satisfied when using the system (see Figure 13).
144144N =
GPS
1.00.00
95
% C
I S
AT
62
60
58
56
54
52
50
48
Figure 13 – Error Bar: Satisfaction (%) against GPS
(.00 denotes non-context aware, 1.00 denotes context-aware)
This may have been because it was quicker to navigate around the campus; maybe it
was due to the context-aware system requiring less input contribution in order to operate
the system. Maybe users were simply fascinated by the appearance of the pop-up
windows and the red flashing icon that represented their current real-time location.
5. Conclusion
This paper has presented and analysed a number of existing context-aware tour guide
systems in order to develop and compares two tour guide systems developed for Brunel
University (West London Uxbridge Campus); one with context-aware user feedback and
one without. Each of the systems was assessed considering the three usability
measurements (effectiveness, efficiency and satisfaction). The paper has discussed
compared both applications in order to determine whether the notification of real-time
feedback of user location positively or negatively influences the three usability
measurements.
To add here:
SUMMARY OF THE FINDINGS
IMPLICTION OF CONTEXT_AWARE SYSTEMS - NAVIGATION SYSTEMS
References
Abowd, G., Atkeson, C., Hong, J., Long, S., Kooper, R., Pinkerton, M. (1997)
Cyberguide: a mobile context-aware tour guide. Wireless Networks. Vol. 3 (5), pp. 421-
433
Beisner, H., Rudd, J., Benner, R. (1996) Real-time APL prototype of a GPS system.
International Conference on APL, pp. 31-39
Burigat, S. ,Chittaro, L., (2005) Location-aware visualization of VRML models in GPS-
based mobile guides, Proceedings of the tenth international conference on 3D Web
technology, March 29-April 01, Bangor, United Kingdom
Cheverst, K., Mitchell, K., Davies, N. (2002) The role of adaptive hypermedia in a
context-aware tourist GUIDE. Communications of the ACM. Vol. 45 (5) pp. 47-51
Davies N., Dix, A, Cheverst K, Hesse (2005) A Understanding the Role of Image
Recognition in Mobile Tour Guides Proc. 7th International Conference on Human
Computer Interaction with Mobile Devices and Services, Salzburg.
Dey, A. K. (2001) Understanding and Using Context. Personal and Ubiquitous
Computing Journal, Vol. 5 (1), pp. 4-7.
Dourish, P. (2004) What We Talk About When We Talk About Context. FrånPersonal
and Ubiquitous Computing, Vol. 8. pp.19-30. London, UK: Springer-Verlag.
Goodman, J., Brewster, SA, & Gray, PD (2004). Using Field Experiments to Evaluate
Mobile Guides. In Mobile HCI 2004 (38-48). Glasgow, UK.
Holland, S., Morse, D., Gedenryd, H. (2002). AudioGPS: Spatial Audio Navigation with a
Minimal Attention Interface. Personal and Ubiquitous Computing. Vol. 6 (4), pp 253-259
Kakihara, M., Sorensen, C. (2002) "Mobility," hicss, p. 131, 35th Annual Hawaii
International Conference on System Sciences (HICSS'02) – Vol. 5.
King, C. (2003) Virtual instrumentation-based system in a real-time applications of
GPS/GIS. Recent Advances in Space Technologies, 2003. RAST '03. International
Conference on. Proceedings of 20-22 Nov. 2003, pp 403 - 408
Kray C. (2003) Situated Interaction on Spatial Topics. PhD. thesis, DISKI series Vol.
274, AKA Verlag, Berlin.
Laakso, K., Gjesdal, O., and Sulebak, J. R. (2003). Tourist information and navigation
support by using 3D maps displayed on mobile devices. Workshop on Mobile Guides,
Mobile HCI 2003 Symposium, Udine, Italy.
Oppermann, R. and Specht, M. A (2000) Context-Sensitive Nomadic Information System
as an Exhibition Guide. Handheld & Ubiq. Computing 2nd Int. Symp.
Pospischil G. , Umlauft M. , Michlmayr E. Designing (2002) LoL@, a Mobile Tourist
Guide for UMTS 4th International Symposium on Human Computer Interaction with
Mobile Devices (Mobile HCI '02), Pisa, Italy.
Ryan, N. S., Pascoe, J., and Morse D. R. (1998) Enhanced reality fieldwork: the context-
aware archaeological assistant. In V. Gaffney, M. van Leusen, and S. Exxon, editors,
Computer Applications in Archaeology 1997, British Archaeological Reports, Oxford.
Tempus Reparatum.
Schilit, W. N., Adams, N. I. and Want, R. (1994) Context-aware Computing
Applications, In proceedings of the IEEE Workshop on Mobile Computer Systems and
Applications, Santa Cruz, CA, IEEE Press, New York.
Simcock, T., Hillenbrand, S., Thomas, B. (2003) Developing a location based tourist
guide application. Conference in Research and Practice in Information Technology
Series; Vol. 34 (21), Proceedings of the Australasian information security workshop
conference on ACSW frontiers 2003. Pages: 177-183.

APPENDIX A: EVALUATION MATERIAL
A.1 Participant Instructions Brief introduction of the project
The aim of the project is to develop a GPS-based interactive mobile tourist guide system of the Brunel University Uxbridge campus.
One of the objectives is to compare the usability of the GPS-based system against a non-GPS equivalent application. One of the systems incorporates the use of the GPS and the other does not.
The objective is to investigate whether the incorporation of GPS has a positive or negative impact on 3 usability measurements of:
- Effectiveness: The type and level of information assimilation/absorption for the user.
- Efficiency: The time taken to complete tasks and the resources exploited in achieving them.
- Satisfaction: The level of users comfort, enjoyment and attitudes towards the use of a mobile tourist guide system.
Instructions
For this experiment, we are going to go on a tour of the campus. We are going to take a particular route. In that route, we are going to visit some buildings. We are going to stop at each building and I am going to ask you some questions based on that building. You will use the system to answer these questions. There is no time limit, but a timer will be used for my reference. So, take as long as you want to answer the questions.
The 3 usability measurements stated will be measured in the following way:
- Effectiveness: The total number of questions you correctly answer. - Efficiency: The total time to answer all the questions at a particular building. - Satisfaction: Your subjective opinions on the system via a talk-aloud protocol,
during your tour.
The timer will start on arrival at the target building and it will stop on departure.
The questions will be given to you on arrival at the destination building, once you believe you have found it, using the software. A.1.2 Participant Questions
1. Go to St Johns:
a. In DISC, read out the course description for ‘Information Technology MRes’ under ‘Postgraduate Courses’. Answer: The course aims to provide a detailed insight into IT research and will prepare students either for PhD study or for a career in this profession.
2. Go to New Student Residential Accommodation (Phase V):
a. Read out how many more en suite rooms will be constructed at Uxbridge over the next two years, and read how many rooms this will complement which are already on campus. Answer: More than 1200 en suite rooms will be constructed at Uxbridge over the next two years to complement the 2663 already on campus.
3. Go to Experimental Techniques Centre:
a. Read out the full names of the people to contact for further information. Answer: Dr Robert Bulpett and Dr Alan Reynolds.
4. Go to Science Building:
a. Read out the names of the departments based inside the Science Building. Answer: Biosciences, Sport Sciences, BIB and BEC.
b. For the Institute for Bioengineering (BIB), read out the telephone number to contact for further information. Answer: (44) 01895 271 206.
5. Go to Wilfred Brown Building:
a. Read out the names of the departments based inside the Wilfred Brown Building. Answer: Registry, Estates, Beldam Gallery and Marketing.
b. Read out the name of the department that administers the Beldam Gallery. Answer: Arts Centre
6. Go to Bannerman Centre:
a. Read out the names of the departments based inside the Bannerman Centre. Answer: Brunel University Library, Assistive Technology Centre, Student Centre, Placement and Careers Centre, Café Rococo.
b. Read out the opening hours of the library on a Saturday during term time. Answer: 09:30 – 16:00 (no enquiry service available)
c. Read out the opening times of Café Rococo and the products that the outlet provides. Answer: Mon-Fri 8:00am – 6:00pm, Coffee, Sandwiches, Paninis, Pastries, Cakes, Flapjacks, Muffins.
7. Go to Hamilton Centre:
a. Read out the names of the departments based inside the Hamilton Centre. Answer: Student Union, More Foodhall, The Academy, Locos, The Hub.
b. Read out the name of the President of the Student Union. Answer: Jo Baines
c. Read out what time alcohol is served from, in Locos. Answer: 11am
8. Go to Lecture Centre: a. Read out the names of the departments based inside the Lecture Centre.
Answer: Learning and Teaching Development Unit, Media Services, Disability and Dyslexia Service.

b. In the Disability and Dyslexia Service department, read out the e-mail address to contact for further information. Answer: [email protected]
c. Read out how much money is being invested in updating the buildings teaching infrastructure. Answer: £160m
9. Go to Halsbury Building:
a. Read out the names of the departments based inside the Halsbury Building. Answer: Institute for the Environment, Brunel Graduate School, Wolfson Centre.
b. Read out the names of all the MSc Degrees on offer in the Institute for the Environment. Answer: Ecosystem and Human Health, Environmental Pollution Science, Environmental Science with Legislation and Management.
c. Read out the fax number to contact for further information in the Wolfson Centre. Answer: 0044 (1)895 203376
10. Go to Maths Building:
a. Read out the names of the departments based inside the Maths Building. Answer: Computer Centre, Mathematical Sciences.
b. Read out the facilities that the Mathematical Sciences department provide. Answer: Laboratories, Video Conferencing, MSDN.
11. Go to Sports Centre:
a. Read out the names of the departments based inside the Sports Centre. Answer: Sports Centre, Bar Zest
b. Read out the opening hours of Bar Zest during weekends. Answer: 10.00am – 3.00pm
12. Go to Indoor Athletics Centre:
a. Read out the first three facilities the Indoor Athletics Centre offers. Answer: 132m of indoor sprints & hurdles straight, Movable High Jump bed, Pole Vault