a crackling samvat 2077 in store
TRANSCRIPT

A CRACKLING SAMVAT 2077 IN STORE
Diwali Muhurat Picks November 2020
Diwali Muhurat Picks
November 2020
1
Diwali Muhurat Picks: A CRACKLING SAMVAT 2077 IN STORE!
Samvat 2076 began on a solid note with outperformance seen in small and mid cap stocks. The beginning of Samvat 2076 was marked by lower market volatility but there were concerns on the economy as GDP growth rate was slowing. However, market returns and GDP growth rate in India do not have a very strong correlation and the benchmark Nifty touched an all time high of 12,371 in the early part of the year which is now considered Pre COVID. COVID changed everything for the markets and for the world itself. For a brief period it can be said that COVID even had a humbling effect on people. However, as the old adage goes, the more things change the more they remain same. This is so true in the post COVID era. Even as the world came to a standstill and markets plummeted worldwide with crude even entering a negative zone in one contract closing, a semblance of things are not so bad started to emerge. Markets rallied and as the whole system started developing a coping mechanism for COVID and locked down economies started opening up. The COVID challenge has had many ramifications for the businesses worldwide but it has also brought a lot of opportunities for innovative companies. Samvat 2077 now looks much brighter and this Diwali has brought festive cheers to many, but still there is a long way to go. It seems more likely that growth is likely to come back strongly looking at the high frequency indicators. The Indian banking system has coped well with the pandemic challenges and it is now flushed with liquidity. Interest rates are low and lending is much likely to pick up strongly in the forthcoming quarters. New home registrations are seeing a solid pick up across the metros and housing loans are surging across the banking system. Even looking at the building materials companies results, the demand scenario looks quite encouraging.
Housing and banking will be growth themes for Samvat 2077. Pick up in the real estate sector will bode well for the economy as a whole as capacity utilization across the system will improve significantly. Currently, there are ten good COVID vaccine candidates in phase 3 trials and a vaccination can be expected by early 2021 if not earlier. So, Samvat 2077 will also see the vaccination theme playing out across the sectors. Successful vaccination drive will mean complete opening up of the economy and the most affected sectors like travel and tourism will get a boost. More offices, malls and recreation centres will open up and stocks associated with these themes will pick up steam. Taking all these factors into consideration, our themes for Samvat
2077 are:
The small and midcaps are picking up steam and they should deliver
solid returns in 2021 as economic uncertainties will reduce and
volatility will decline. We believe volatility will decline significantly in
2021 which will lead to a small and mid cap rally.
Housing and banking will be major themes to watch out for in 2021
because of correction in real estate prices and lower interest rate
regime.
Digital and telecommunications will continue to remain major long-
term structural themes.
Vaccination drive and complete opening up of the economy will be
key factors for growth.
Growth is now a more certain theme, but growth at a reasonable
price will be an even bigger theme to invest which will deliver solid
returns over the next one year.
Based on these themes, our Diwali picks are:
ICICI Bank, Canfin Homes, SBI, Bharti Airtel, Tech Mahindra, SIS, Eicher Motors, Dalmia Bharat, Varun Beverages, Dhanuka Agritech and Aarti Industries
Neeraj Chadawar |[email protected] |

Diwali Muhurat Picks
November 2020
2
Housing &
Banking
Housing & Banking
Digital & Telecom
Midcaps & Small
Cap
Themes for SAMVAT 2077
Growth at a resonable
price
Opening up of
economy
Vaccination Drive

Diwali Muhurat Picks
November 2020
3
Axis Securities Diwali Muhurat Picks: A CRACKLING SAMVAT 2077 IN STORE!
Company Name Sector Stock
price
Target
Price
Upside
(%)
12 Month
Fwd PE
12 Month
Fwd P/BV
Dividend
Yield
TR
1M%
TR
3M%
TR
6M%
TR
YTD%
ICICI BANK LTD Financials 443 504 14% 22.4 2.2 N.A 16.3 23.4 29.7 -17.8
STATE BANK OF INDIA Financials 219 261 19% 10.3 0.8 N.A 14.4 14.8 28.1 -34.3
CAN FIN HOMES LTD Financials 472 515 9% 16.3 2.4 0.0 11.7 27.9 60.1 20.7
TECH MAHINDRA LTD Information Technology 851 975 15% 17.7 3.1 1.2 2.3 31.3 72.4 16.2
BHARTI AIRTEL LTD Communication Services 450 676 50% 249.9 3.8 0.4 5.4 -19.0 -17.3 -0.9
SECURITY & INTELLIGENCE Industrials 375 450 20% 22.4 3.5 0.5 -0.2 3.7 -0.5 -22.5
EICHER MOTORS LTD Consumer Discretionary 2139 2400 12% 41.4 5.4 0.0 -2.7 -1.3 54.3 -4.2
DALMIA BHARAT LTD Materials 893 1083 21% 42.8 1.6 0.2 16.1 13.4 73.9 11.8
VARUN BEVERAGES LTD Consumer Staples 694 865 25% 62.5 5.7 0.4 0.6 -11.6 13.1 -1.7
AARTI INDUSTRIES LIMITED Materials 1105 1263 14% 36.0 5.6 0.3 9.0 4.6 0.1 33.5
DHANUKA AGRITECH LTD Materials 733 880 20% 19.6 4.1 1.6 -3.5 -7.0 66.3 85.2
Source: Company, Axis Securities; N.A. – Not available
Diwali Muhurat Picks
November 2020
4
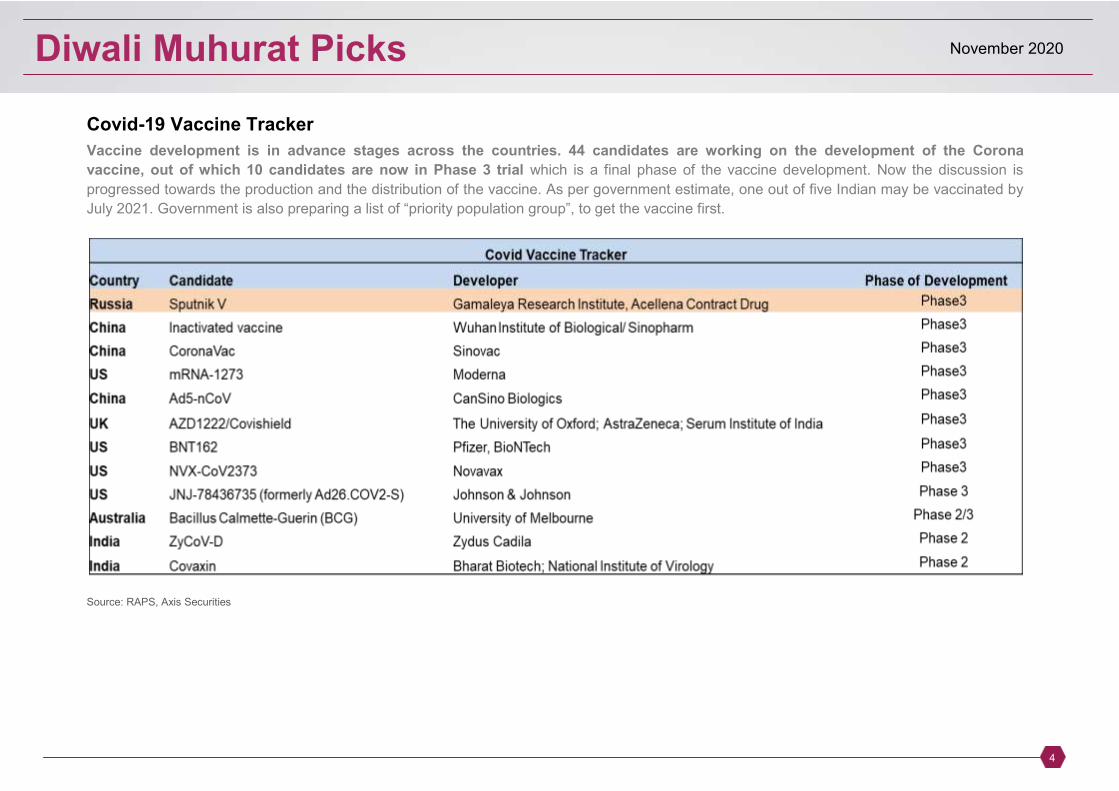
Covid-19 Vaccine Tracker
Vaccine development is in advance stages across the countries. 44 candidates are working on the development of the Corona
vaccine, out of which 10 candidates are now in Phase 3 trial which is a final phase of the vaccine development. Now the discussion is
progressed towards the production and the distribution of the vaccine. As per government estimate, one out of five Indian may be vaccinated by
July 2021. Government is also preparing a list of “priority population group”, to get the vaccine first.
Source: RAPS, Axis Securities

Diwali Muhurat Picks
November 2020
5
High Frequency Indicators: Indicators suggesting upward trend for economic growth
Manufacturing PMI surged to 58.9 in October, continuing its improving trend for third straight month, climbed to highest in over a decade shows
improving operating conditions arise after the lifting of lockdown restrictions which turns into increase in new orders and production. Another sign
of recovery in the economy with October GST collection crossed Rs 1 lakh cr mark after last seen in Feb 2020. Continuously rising GST
collection from last two months indicates the pickup in business activities, also the indication of revival of consumption ahead of festival season.
Festive demand drives Automobile sales higher in October. Passenger vehicle sales up in the month of October for the third straight month,
highlighting buyout demand during Navratri. Similar trend visible in 2-wheelers, however, demand likely to continue for November onset of
upcoming festival Diwali.
Macro Month Nov-19 Dec-19 Jan-20 Feb-20 Mar-20 Apr-20 May-20 Jun-20 Jul-20 Aug-20 Sep-20 Oct-20
Forex reserves ($ Bn) Oct-20 451.1 457.5 471.3 481.5 475.6 479.5 493.5 506.8 534.6 541.4 542.0 560.5
FDI ($ Mn) Aug-20 1720 5065 6742 4533 4075 3402 2535 -72 3988 18482
Exports (YoY%) Sep-20 -0.3% -1.8% -1.7% 2.9% -34.6% -60.3% -36.5% -12.4% -10.2% -12.7% 6.0%
Imports ($ YoY%) Sep-20 -12.7% -8.8% -0.7% 2.5% -28.7% -58.6% -51.0% -47.6% -28.4% -26.0% -19.6%
IIP YoY% Aug-20 2.1% 0.5% 2.2% 5.2% -18.7% -57.3% -33.4% -15.8% -10.8% -8.0%
CPI YoY% Sep-20 5.5% 7.4% 7.6% 6.6% 5.8% 7.2% 6.3% 6.2% 6.7% 6.7% 7.3%
WPI YoY% Sep-20 0.6% 2.8% 3.5% 2.3% 0.4% -1.6% -3.4% -1.8% -0.3% 0.2% 1.3%
PMI Manufacturing Oct-20 51.2 52.7 55.3 54.5 51.8 27.4 30.8 47.2 46 52 56.8 58.9
PMI Services Sep-20 52.7 53.3 55.5 57.5 49.3 5.4 12.6 33.7 34.2 41.8 49.8
Industry
Cement Production yoy% Sep-20 4.4% 5.5% 5.1% 7.8% -25.1% -85.2% -21.4% -6.8% -13.5% -14.5% -3.5%
Steel Production yoy% Sep-20 7.0% 8.7% 1.6% 2.9% -21.9% -82.8% -40.4% -23.3% -8.3% -1.7% 0.9%
Electricity Gen yoy% Sep-20 -4.9% 0.0% 3.2% 11.5% -8.2% -22.9% -14.8% -10.0% -2.5% -1.8% 3.7%
Coal Generation yoy% Sep-20 -3.5% 6.1% 8.0% 11.3% 4.0% -15.5% -14.0% -15.5% -5.7% 3.6% 21.2%
Eight Core Industries yoy% Sep-20 0.7% 3.1% 2.2% 6.4% -8.6% -37.9% -21.4% -12.4% -8.0% -7.4% -0.8%
GST Collection (RsCrores) Oct-20 1,03,491 1,03,184 1,10,818 1,05,366 97,597 32,294 62,009 90,917 87,422 86,449 95,480 1,05,155
Tractor Sales YoY% Sep-20 -12.8% 4.0% 3.3% 19.6% -50.2% -80.1% 0.5% 20.2% 35.9% 64.8% 26.7%
Domestic Air Pass YoY % Sep-20 11.2% 2.6% 2.2% 9.0% -33.1%
-97.7% -83.5% -82.3% -76.0% -65.8%
Passenger Vehicles YoY % Oct-20 -0.8% -1.2% -6.1% -7.8% -51.0% -100.0% -86.0% -53.2% -9.0% 14.2% 26.5% 19.9%*
2 Wheeler's YoY % Oct-20 -14.3% -16.6% -16.0% -19.8% -39.8% -100.0% -83.8% -38.6% -15.2% 3.0% 12.9% 9.2%*
Naukri Job Speak Index YoY% Sep-20 15.2% 10.5% 5.8% 0.0% -17.8% -61.6% -61.2% -44.4% -47.3% -34.7% -23.0%
Source: Bloomberg, RBI, MOSPI, * Provisional numbers, Axis Securities
Diwali Muhurat Picks
November 2020
6
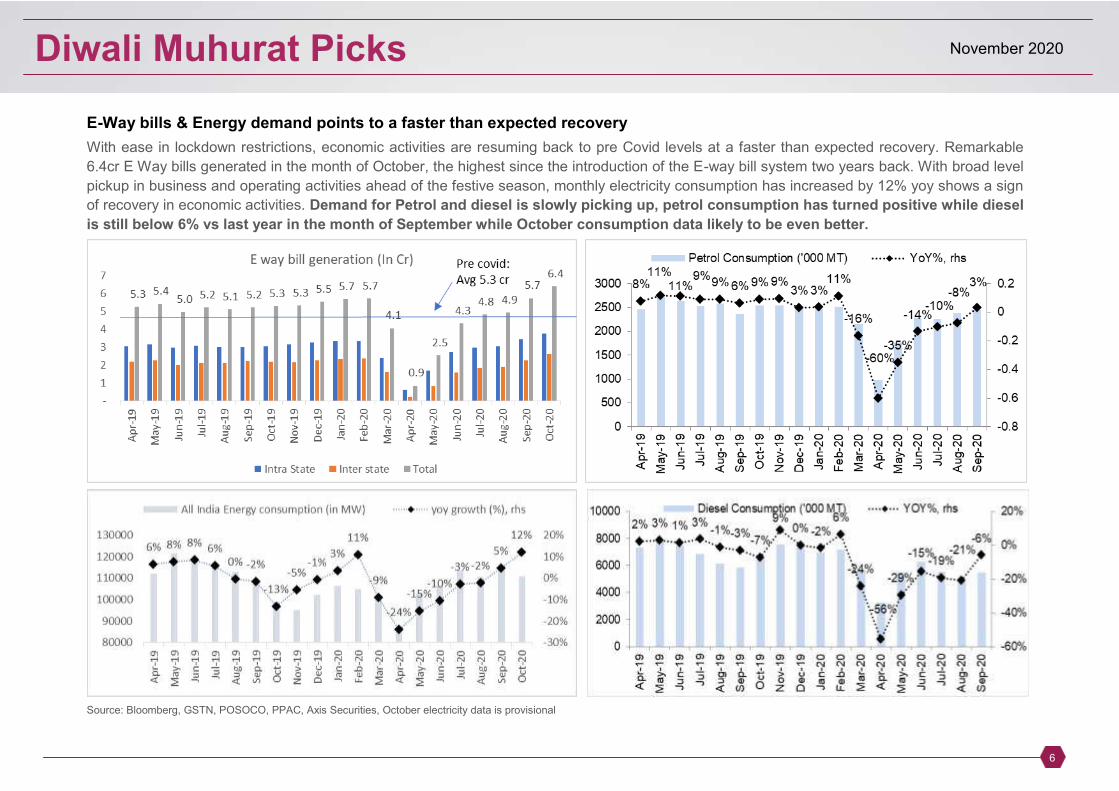
E-Way bills & Energy demand points to a faster than expected recovery
With ease in lockdown restrictions, economic activities are resuming back to pre Covid levels at a faster than expected recovery. Remarkable
6.4cr E Way bills generated in the month of October, the highest since the introduction of the E-way bill system two years back. With broad level
pickup in business and operating activities ahead of the festive season, monthly electricity consumption has increased by 12% yoy shows a sign
of recovery in economic activities. Demand for Petrol and diesel is slowly picking up, petrol consumption has turned positive while diesel
is still below 6% vs last year in the month of September while October consumption data likely to be even better.
Source: Bloomberg, GSTN, POSOCO, PPAC, Axis Securities, October electricity data is provisional

Diwali Muhurat Picks
November 2020
7
Major theme for 2021: Mean reversion in rolling returns, Midcaps and Small caps are chasing large caps
The small and midcaps are picking up steam and they should deliver solid returns in 2021 as economic uncertainties will reduce and volatility will
decline. We believe volatility will decline significantly in 2021 which will lead to a small and mid cap rally.From a valuation perspective, the
Midcaps look attractive vs. large caps. The recent spate of IPOs and their success clearly indicates that the appetite for mid and small cap
stocks. Our case for two year rolling returns indicates that the market has turned in favour of small and mid cap stocks which are more
reasonably valued and offer greater upside potential.
Source: Bloomberg, Axis Securities Note: Data till 30thOct 2020

Diwali Muhurat Picks
November 2020
8
Major theme for 2021: Housing & Banking
Housing and banking will be major themes to watch out for in 2021 because of correction in real estate prices and lower interest rate regime. Defensive: IT, Staples, Pharma, Healthcare, Utilities, Insurance
Cyclical: Oil & gas, Industrials, Metals, Building Materials, Agri& Chemicals, Transport
Sensitive: Banks, NBFC, Discretionary, Auto, Telecom
Source: Bloomberg, NSE, Axis Securities Note: Data till 30th Oct 2020
Diwali Muhurat Picks
November 2020
9
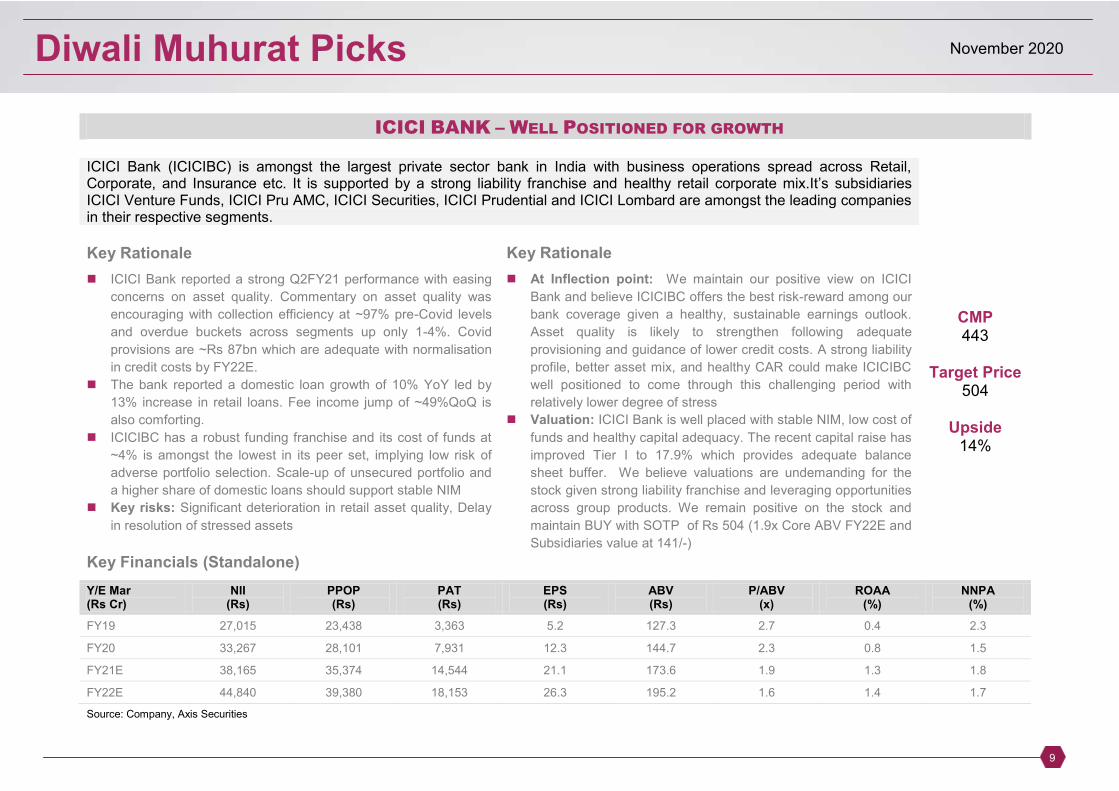
ICICI BANK – WELL POSITIONED FOR GROWTH
ICICI Bank (ICICIBC) is amongst the largest private sector bank in India with business operations spread across Retail, Corporate, and Insurance etc. It is supported by a strong liability franchise and healthy retail corporate mix.It‟s subsidiaries ICICI Venture Funds, ICICI Pru AMC, ICICI Securities, ICICI Prudential and ICICI Lombard are amongst the leading companies in their respective segments.
Key Rationale Key Rationale
ICICI Bank reported a strong Q2FY21 performance with easing
concerns on asset quality. Commentary on asset quality was
encouraging with collection efficiency at ~97% pre-Covid levels
and overdue buckets across segments up only 1-4%. Covid
provisions are ~Rs 87bn which are adequate with normalisation
in credit costs by FY22E.
The bank reported a domestic loan growth of 10% YoY led by
13% increase in retail loans. Fee income jump of ~49%QoQ is
also comforting.
ICICIBC has a robust funding franchise and its cost of funds at
~4% is amongst the lowest in its peer set, implying low risk of
adverse portfolio selection. Scale-up of unsecured portfolio and
a higher share of domestic loans should support stable NIM
Key risks: Significant deterioration in retail asset quality, Delay
in resolution of stressed assets
At Inflection point: We maintain our positive view on ICICI
Bank and believe ICICIBC offers the best risk-reward among our
bank coverage given a healthy, sustainable earnings outlook.
Asset quality is likely to strengthen following adequate
provisioning and guidance of lower credit costs. A strong liability
profile, better asset mix, and healthy CAR could make ICICIBC
well positioned to come through this challenging period with
relatively lower degree of stress
Valuation: ICICI Bank is well placed with stable NIM, low cost of
funds and healthy capital adequacy. The recent capital raise has
improved Tier I to 17.9% which provides adequate balance
sheet buffer. We believe valuations are undemanding for the
stock given strong liability franchise and leveraging opportunities
across group products. We remain positive on the stock and
maintain BUY with SOTP of Rs 504 (1.9x Core ABV FY22E and
Subsidiaries value at 141/-)
CMP 443
Target Price
504
Upside 14%
Key Financials (Standalone)
Y/E Mar (Rs Cr)
NII (Rs)
PPOP (Rs)
PAT (Rs)
EPS (Rs)
ABV (Rs)
P/ABV (x)
ROAA (%)
NNPA (%)
FY19 27,015 23,438 3,363 5.2 127.3 2.7 0.4 2.3
FY20 33,267 28,101 7,931 12.3 144.7 2.3 0.8 1.5
FY21E 38,165 35,374 14,544 21.1 173.6 1.9 1.3 1.8
FY22E 44,840 39,380 18,153 26.3 195.2 1.6 1.4 1.7
Source: Company, Axis Securities
Diwali Muhurat Picks
November 2020
10
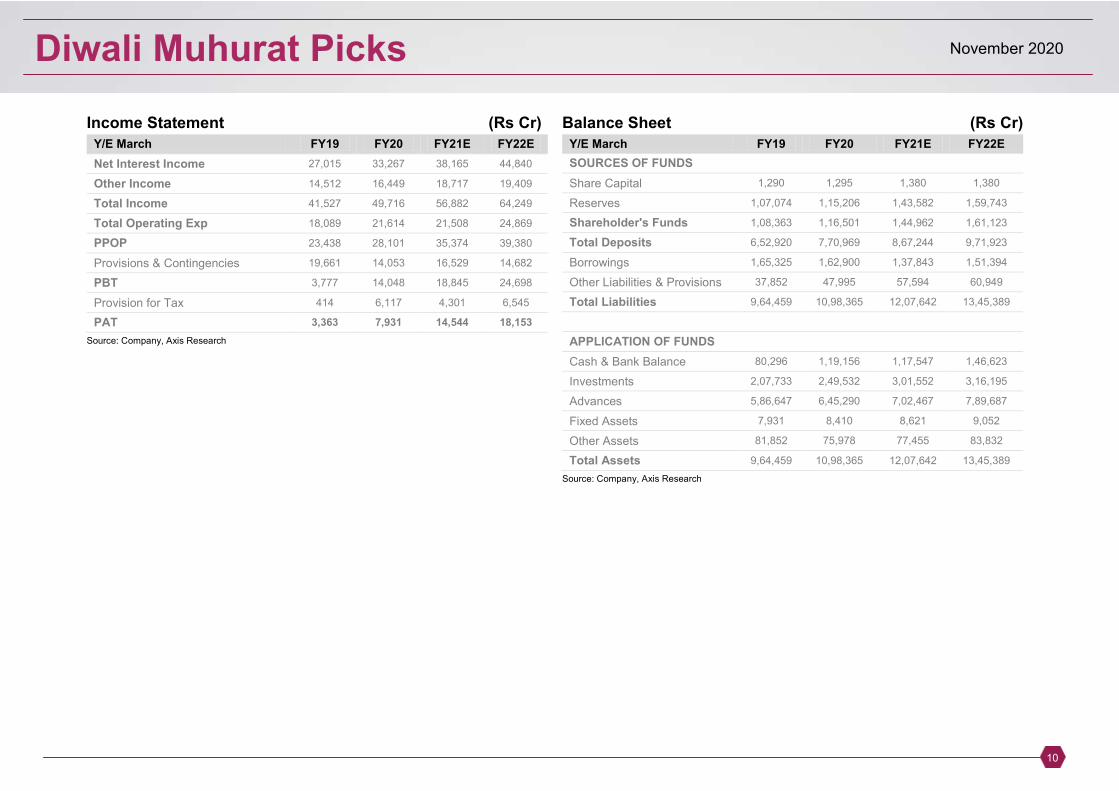
Income Statement (Rs Cr)
Y/E March FY19 FY20 FY21E FY22E
Net Interest Income 27,015 33,267 38,165 44,840
Other Income 14,512 16,449 18,717 19,409
Total Income 41,527 49,716 56,882 64,249
Total Operating Exp 18,089 21,614 21,508 24,869
PPOP 23,438 28,101 35,374 39,380
Provisions & Contingencies 19,661 14,053 16,529 14,682
PBT 3,777 14,048 18,845 24,698
Provision for Tax 414 6,117 4,301 6,545
PAT 3,363 7,931 14,544 18,153
Source: Company, Axis Research
Balance Sheet (Rs Cr)
Y/E March FY19 FY20 FY21E FY22E
SOURCES OF FUNDS
Share Capital 1,290 1,295 1,380 1,380
Reserves 1,07,074 1,15,206 1,43,582 1,59,743
Shareholder's Funds 1,08,363 1,16,501 1,44,962 1,61,123
Total Deposits 6,52,920 7,70,969 8,67,244 9,71,923
Borrowings 1,65,325 1,62,900 1,37,843 1,51,394
Other Liabilities & Provisions 37,852 47,995 57,594 60,949
Total Liabilities 9,64,459 10,98,365 12,07,642 13,45,389
APPLICATION OF FUNDS
Cash & Bank Balance 80,296 1,19,156 1,17,547 1,46,623
Investments 2,07,733 2,49,532 3,01,552 3,16,195
Advances 5,86,647 6,45,290 7,02,467 7,89,687
Fixed Assets 7,931 8,410 8,621 9,052
Other Assets 81,852 75,978 77,455 83,832
Total Assets 9,64,459 10,98,365 12,07,642 13,45,389
Source: Company, Axis Research

Diwali Muhurat Picks
November 2020
11
Valuation ratios (%)
Y/E March FY19 FY20 FY21E FY22E
EPS 5.2 12.3 21.1 26.3
Earnings growth (%) -51% 135% 72% 25%
Adj. BVPS 127.3 144.7 173.6 195.2
ROAA (%) 0.36 0.77 1.26 1.42
ROAE (%) 3.2 7.1 11.1 11.9
Core P/ABV (x)
2.7
2.3
1.9
1.6
Dividend Yield (%) 0.3 0.0 0.5 0.7
PROFITABILITY
Yield on Advances (%) 8.7 9.3 8.7 9.2
Yield on Investment (%) 6.2 6.4 6.2 6.2
Cost of Funds (%) 4.7 4.7 4.3 4.4
Cost of Deposits (%) 4.4 4.6 4.2 4.3
NIM (%) 4.1 4.6 4.4 4.7
OPERATING EFFICIENCY
Cost/Avg. Asset Ratio (%) 2.3 2.4 2.1 2.2
Cost-Income Ratio (%) 43.6 43.5 37.8 38.7
Source: Company, Axis Research
Balance Sheet Structure Ratios (%)
Y/E March FY19 FY20 FY21E FY22E
Loan Growth (%) 14.5 10.0 8.9 12.4
Deposit Growth (%) 16.4 18.1 12.5 12.1
C/D Ratio (%) 89.8 83.7 81.0 81.3
Equity/Assets (%) 11.2 10.6 12.0 12.0
Equity/Advances (%) 18.5 18.1 20.6 20.4
CASA (%) 16.9 16.1 17.6 17.5
Total Capital Adequacy Ratio 15.1 14.7 16.4 16.4
Tier I CAR 14.5 10.0 8.9 12.4
ASSET QUALITY
Gross NPLs 45,676 40,829 48,166 51,148
Net NPLs 13,450 9,923 12,298 13,512
Gross NPLs (%) 7.8 6.3 6.9 6.5
Net NPLs (%) 2.3 1.5 1.8 1.7
Coverage Ratio (%) 70.6 75.7 74.5 73.6
Provision/Avg. Loans (%) 3.1 1.5 2.2 1.9
ROAA TREE
Net Interest Income 2.9% 3.2% 3.3% 3.5%
Non Interest Income 1.6% 1.6% 1.6% 1.5%
Operating Cost 2.0% 2.1% 1.9% 1.9%
Provisions 2.1% 1.4% 1.4% 1.2%
Provisions for NPAs 0.0% 0.6% 0.4% 0.5%
Tax 0.36% 0.77% 1.26% 1.42%
ROAA 8.6 9.2 8.8 8.3
Leverage (x) 8.63 9.17 9.41 9.38
ROAE 3.15% 7.05% 11.14% 12.30%
Source: Company, Axis Research

Diwali Muhurat Picks
November 2020
12
STATE BANK OF INDIA – BEST AMONG PSU BANKS
State Bank of India (SBIN) is the largest public sector bank in terms of assets, deposits, branches, number of customers, and employees having pan-India presence. As of March „20, SBIN has a network of 22,141 branches and 58,555 ATMS. It has a market share of ~22.8/19.7% market share in deposits/ advances.
Key Rationale Key Rationale Asset quality: Pre-Covid, the bank had been witnessing healthy
improvement on the asset quality front. Amidst the Covid crisis and
moratorium close in Aug ‟20, impact on asset quality was keenly
watched. In Q2FY21, bank stated that collection efficiency stands at
~97% which is in-line with large private banks. Also, FY21
estimated slippages (including restructuring) are ~2.5% which is
manageable.
Liability franchise strong and improved NIM: Despite competition
from peers, SBIN‟s CASA franchise is at 45% of deposits, better than that of some large private banking peers. NIMs have improved
to 3.12% in Q2FY21. We expect NIMs to be stable at ~3% over
FY21-23E.
Non banking subsidiaries to boost overall performance: Apart from
core banking, SBI‟s subsidiaries will continue to add further value. It has strong presence in credit cards, insurance (life and general),
asset management, etc. Most of these are generating stable returns
and boosting overall performance.
Outlook: We believe key positive of SBIN which will drive its
performance are i) Being the largest bank in India the bank has
business strengths making it a beneficiary of liquidity with huge
deposit inflow during uncertain times resulting in lower cost of
funds. ii) Asset quality has improved on book clean –up efforts over
the last few years resulting in lower slippages and NPA decline. iii)
PCR has improved to 67%. Provisions for legacy stress is mostly
over iv) Subsidiaries performance has been improving
Valuation: Among PSU banks, SBIN remains the best play on the
gradual recovery in the Indian economy, with a healthy PCR, robust
capitalization, a strong liability franchise and improved core
operating profitability. Subsidiaries‟ performance was also stable in Q2FY21. We maintain Buy on the stock with target price of Rs 261
(SOTP basis core book at 0.6x and subsidiaries at Rs 111)
Key risks: Significant deterioration in asset quality, Delay in
resolution of stressed assets
CMP 219
Target Price
261
Upside 19%
Key Financials (Standalone)
Y/E Mar (Rs Cr)
NII (Rs)
PPOP (Rs)
PAT (Rs)
EPS (Rs)
ABV (Rs)
P/ABV (x)
ROAA (%)
NNPA (%)
2020 98,100 68,100 6,900 7.7 222.4 0.9 0.2 2.2
2021E 1,09,382 74,181 17,578 19.5 192.0 0.9 0.4 2.2
2022E 1,15,944 76,620 24,980 27.8 215.4 0.8 0.7 1.9
2023E 1,27,539 84,071 33,031 36.7 250.1 0.7 0.7 1.8
Source: Company, Axis Securities

Diwali Muhurat Picks
November 2020
13
Income Statement (Rs Cr)
Y/E March FY19 FY20 FY21E FY22E
Net Interest Income 98,100 109,382 115,944 127,539
Other Income 45,200 42,940 44,014 47,975
Total Income 143,300 152,322 159,958 175,514
Total Operating Exp 75,200 78,141 83,338 91,443
Staff expenses 45,700 47,757 49,189 54,108
Other operating expenses 29,500 30,975 33,143 35,795
PPOP 68,100 74,181 76,620 84,071
Provisions & Contingencies 43,100 50,427 42,863 39,434
PBT 25,000 23,754 33,757 44,637
Provision for Tax 18,100 6,176 8,777 11,606
PAT 6,900 17,578 24,980 33,031
Source: Company, Axis Research
Balance Sheet (Rs Cr)
Y/E March FY20 FY21E FY22E FY23E
SOURCES OF FUNDS
Share Capital 900 900 900 900
Reserves 207,400 224,978 249,958 282,989
Shareholder's Funds 208,300 225,878 243,358 276,389
Total Deposits 3,241,600 3,436,096 3,745,345 4,082,426
Borrowings 314,700 285,126 282,821 294,522
Other Liabilities & Provisions
186,800 196,140 211,831 228,778
Total Liabilities 3,951,400 4,143,240 4,483,354 4,882,114
APPLICATION OF FUNDS
Cash & Bank Balance 251,100 242,241 221,458 170,756
Investments 1,047,000 1,151,700 1,220,802 1,294,050
Advances 2,325,300 2,395,059 2,658,515 3,004,123
Fixed Assets & Other Assets
328,000 354,240 382,579 413,186
Total Assets 3,951,400 4,143,240 4,483,354 4,882,114
Source: Company, Axis Research

Diwali Muhurat Picks
November 2020
14
Valuation ratios (%)
Y/E March FY19 FY20E FY21E FY22E
EPS 7.7 19.5 27.8 36.7
Earnings Growth (%) 666.7 154.7 42.1 32.2
DPS 0.0 0.0 3.0 3.0
BVPS 231.4 251.0 270.4 307.1
Adj. BVPS 222.4 192.0 215.4 250.1
ROAA (%) 0.2 0.4 0.7 0.7
ROAE (%) 3.5 7.5 11.9 11.9
P/E (x) 28.6 11.2 7.9 6.0
P/ABV (x) 0.9 0.9 0.8 0.7
Dividend Yield (%) 0.0 0.0 1.4 1.4
PROFITABILITY
NIM (%) 2.9 3.1 3 3
Cost-Income Ratio 52.5 51.3 52.1 52.1
Source: Company, Axis Research
Balance Sheet Structure Ratios (%)
Y/E March FY19 FY20E FY21E FY22E
Loan Growth (%) 6.4 3.0 11.0 13.0
Deposit Growth (%) 11.3 6.0 9.0 9.0
C/D Ratio (%) 71.7 69.7 71.0 73.6
CASA 44 44 43 43
Tier 1 11 10.8 10.8 11.1
CAR 13.1 13.3 13 12.9
ASSET QUALITY
Gross NPLs (%) 6.2 6.5 5.9 5.4
Net NPLs (%) 2.2 2.2 1.9 1.8
Coverage Ratio (%) 65.2 67.8 68.8 67.2
Credit cost 1.8 2.0 1.5 1.4
Source: Company, Axis Research

Diwali Muhurat Picks
November 2020
15
CAN FIN HOMES – STEADY PLAYER
CAN FIN HOMES (CANF) is a 33year old retail focused housing finance company, promoted by Canara Bank (30% stake). It is focused largely in Tier II/III cities with 90% of loan book for housing and rest for non housing. It has 163 branches and 21 Affordable Housing centres across India.
Key Rationale Key Rationale Can Fin Homes (CANF) has been a consistent performer well cushioned
by comfortable liquidity and stable asset quality compared to other HFCs.
Balance sheet remains strongly capitalized with a tier-1 ratio of 22.5%.
In Q2FY21, company‟s performance was marked by peak NIMs (4.1%, though not sustainable as indicated by management) and lower provisions
(at 15cr down 66% QoQ; Prov/PPOP at ~8% vs 26% in Q1).While loan
growth remained moderate at 6% YoY, fresh disbursals picked up to Rs
825cr vs 401cr QoQ. We expect loan growth to pick steadily in the coming
quarters.
Collection efficiency stands at ~93% (excluding prepayments/foreclosures).
Costs control was maintained with C-I at 11.9% vs 15.4/11.2% YoY/QoQ.
Delinquency pool for the company is significantly lower compared to the
industry in both HL and LAP. Asset quality risk emanating from job losses
and salary cuts is low.
Management indicated H2FY21 could see an increase in NPAs but
provisions are adequate given its AUM mix. High proportion of salaried and
low builder loan exposure (0.03% of book) will support asset quality with
lower loan losses.
Outlook: CANF is one of the better positioned players in the housing
finance sector with a strong balance sheet, low NPAs, granular loan
book and sound underwriting standards. It‟s ability to improve NIMs
even in tough environment reflects its entrenched business model, even
as book size is much smaller than peers. Focus of the company
remains on collections in the near-term rather than growth. Given the
low-ticket size segment that CANF operates in, coupled with low cost of
funds the company is positioned well to arrest balance transfers to
some extent.
Valuation. While loan growth moderation is expected along-with slight
asset quality deterioration on account of Covid-19, we expect the
company to recover faster than its peers due to its loan mix and
negligible developer exposure. Lower cost of funds should aid the
company in maintaining NIMs while the loan mix profile skewed towards
salaried segment will help in maintaining asset quality. We expect lower
provisions and built in improved NIM for FY21E. We remain positive on
the stock given its loan book profile, stable liquidity position and robust
CAR (25%) and recommend BUY with target price of Rs 515 (2.3x
FY22ABV)
Key risks: Lack of Demand pick-up
CMP 472
Target Price
515
Upside 9%
Key Financials (Standalone)
Y/E Dec (Rs Cr)
NII (Rs Cr)
PPOP (Rs Cr)
Net Profit (Rs Cr)
EPS (Rs)
ABV (%)
P/ABV (%)
ROAA (%)
NNPA (%)
2019 530 471 297 22.3 127.7 3.5 1.7 0.5
2020 675 579 376 28.3 153.1 2.9 1.9 0.5
2021E 784 675 441 33.1 184.8 2.4 2.0 0.8
2022E 862 738 517 38.8 223.7 2.0 2.2 0.6
Source: Company, Axis Securities; * OOH – Out-of-Home

Diwali Muhurat Picks
November 2020
16
Profit & Loss (Rs Cr)
Y/E DEC FY19 FY20 FY21E FY22E
Net Interest Income 530 675 784 862
Other Income 32 12 8 10
Total Income 562 686 792 872
Total Operating Exp 92 108 117 134
PPOP 471 579 675 738
Provisions & Contingencies 1 60 79 40
PBT 470 518 596 698
Provision for Tax 173 142 155 182
PAT 297 376 441 517
Source: Company, Axis Research
Balance Sheet (Rs Cr)
Y/E DEC FY19 FY20 FY21E FY22E
SOURCES OF FUNDS
Share capital 27 27 27 27
Reserves and surplus 1,756 2,123 2,564 3,056
Shareholders' funds 1,782 2,150 2,591 3,082
Total Borrowings 16,694 18,748 18,785 20,513
Other Liabilities, provisions 303 145 158 150
Total 18,780 21,044 22,295 24,739
APPLICATION OF FUNDS
Cash & Bank Balance 420 392 402 442
Investments 16 24 24 24
Advances 18,285 20,526 21,757 24,151
Fixed Assets & Other Assets 59 101 111 122
Total assets 18,780 21,044 22,295 24,739
Source: Company, Axis Research
Diwali Muhurat Picks
November 2020
17
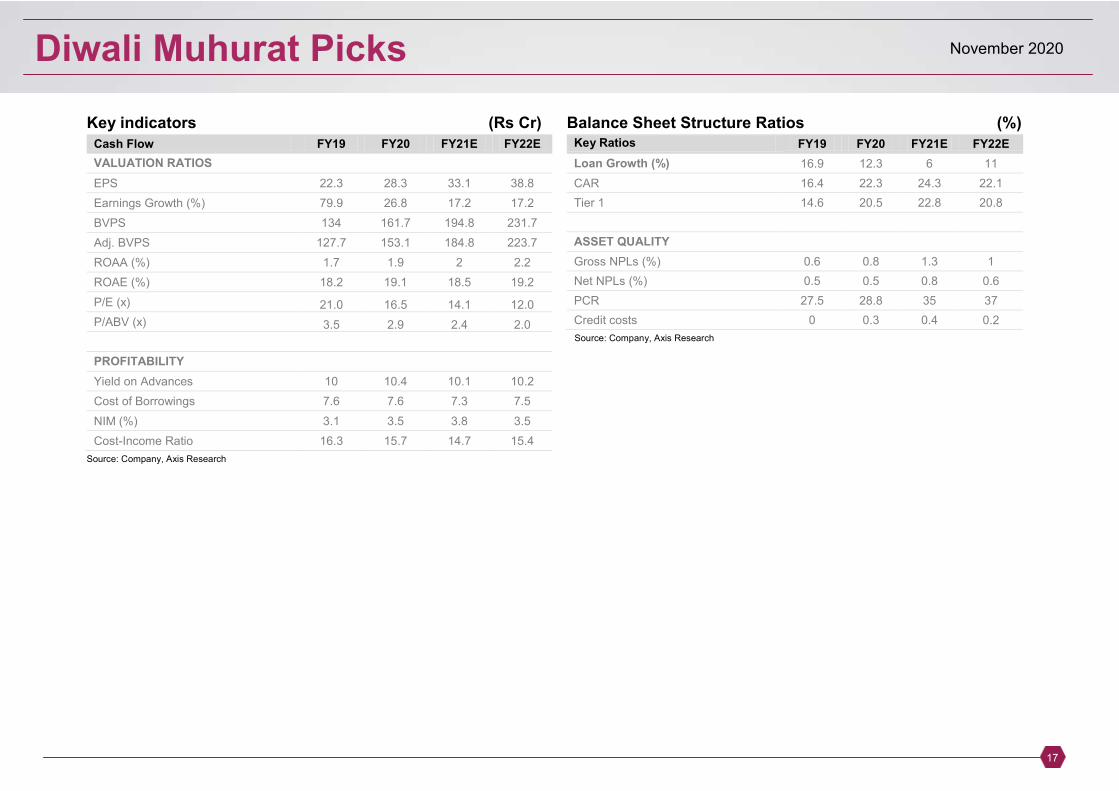
Key indicators (Rs Cr)
Cash Flow FY19 FY20 FY21E FY22E
VALUATION RATIOS
EPS 22.3 28.3 33.1 38.8
Earnings Growth (%) 79.9 26.8 17.2 17.2
BVPS 134 161.7 194.8 231.7
Adj. BVPS 127.7 153.1 184.8 223.7
ROAA (%) 1.7 1.9 2 2.2
ROAE (%) 18.2 19.1 18.5 19.2
P/E (x) 21.0 16.5 14.1 12.0
P/ABV (x) 3.5 2.9 2.4 2.0
PROFITABILITY
Yield on Advances 10 10.4 10.1 10.2
Cost of Borrowings 7.6 7.6 7.3 7.5
NIM (%) 3.1 3.5 3.8 3.5
Cost-Income Ratio 16.3 15.7 14.7 15.4
Source: Company, Axis Research
Balance Sheet Structure Ratios (%) Key Ratios FY19 FY20 FY21E FY22E
Loan Growth (%) 16.9 12.3 6 11
CAR 16.4 22.3 24.3 22.1
Tier 1 14.6 20.5 22.8 20.8
ASSET QUALITY
Gross NPLs (%) 0.6 0.8 1.3 1
Net NPLs (%) 0.5 0.5 0.8 0.6
PCR 27.5 28.8 35 37
Credit costs 0 0.3 0.4 0.2
Source: Company, Axis Research

Diwali Muhurat Picks
November 2020
18
TECH MAHINDRA – STRONG BROAD BASED GROWTH
Tech Mahindra is India‟s leading IT services provider to many business conglomerate. Tech Mahindra is headquartered in Mumbai (India) and has strong presence across geographies like North America, Europe, Middle East, Australia etc. The company provides specialized IT services to its clients across verticals like Communications, Healthcare, and BFSI etc.
Key Rationale Key Rationale Strong Q2 FY21 performance aided by capabilities: Q2 revenue
recovery of 2.9% QoQ cc was equally split between demand traction
and easing of supply-side issues. Management expects demand
momentum led by acceleration in Digital to aid further growth. Growth is
expected to be in both: (i) Communications led by transformation of IT,
network, systems, processes over the next 3-9 months and (ii)
Enterprise led by traction in Digital with near term momentum expected
to be led by Manufacturing, Retail and Utilities; there is a possibility of
increased furloughs in Q3, but management has not witnessed any
indication of it currently.
Strong deal wins and pipeline reflect demand acceleration: Net
new deal wins recovered to $ 421 mn in Q2 (Q1FY21$ 209mn,
Q4FY20:$ 513 mn) and large number of medium sized deals were
closed in Q2. Moreover, deal pipeline is trending at all-time high led by
(i) advanced stage discussions within network and core transformation
within Communications and (ii) Data and Digital within Enterprise.
Reflects demand acceleration.
Tech Mahindra posted robust broad based growth. Its
Telecommunication vertical grew by 3.1% QoQ, Technologies Media &
Entertainment vertical grew by 13.5% QoQ, BFSI vertical grew by 9.7%
QoQ, and Retail Transportations & Entertainment grew by 8.1% QoQ.
Initial traction in 5G; may pick up in FY22: Management sees initial
traction in 5G both on (i) Communications side where traction is visible in
modernization IT, network, process and systems, and (ii) Enterprise side
where it signed 3 Manufacturing 5G solutions in Europe and 1 in US.
While timing of pickup is difficult to predict, management expects 5G
growth to pick up in FY22 or at most in FY23. We expect initial traction
and pipeline build-up to aid network and core modernization for 5G within
Communications in FY22. We see 5G for Enterprise as a longer term
opportunity and expect it to pick up in FY23 and beyond.
Strong and sustainable margin growth: Q2 operating margin
expanded 410 bps to 14.2%. Margin expansion was aided mainly by (i)
stabilization of demand and supply side constraints (+160 bps), (ii)
offshore, utilization and sub-contracting cost (+160 bps) and (iii)
normalization of seasonality in mobility business and absence of visa
costs (+70 bps).
Valuations We believe Tech Mahindra has a resilient business structure
from a long term perspective. We recommend BUY and assign 16x P/E
multiple to its FY23E earnings of Rs. 62.7, which gives a TP of Rs. 975
per share.
CMP 851
Target Price
975
Upside 15%
Key Financials (Consolidated) Y/E Mar (Rs Cr)
Net Sales (Rs)
EBIDTA (Rs)
Net Profit (Rs)
FDEPS (Rs)
Change (%)
PER (x)
RoE (%)
RoCE (%)
Debt/Equity (%)
FY20 36,354 5,832 4,130 48.0 8 13.2 20% 19% 0
FY21E 37,548 6,563 4,230 50.0 4% 14.2 21% 19% 0
FY22E 42,354 7,498 4,852 55.0 10% 12.3 22% 19% 0
FY23E 47,860 10,495 5,531 62.7 14% 10.3 25% 21% 0
Source: Company, Axis Securities

Diwali Muhurat Picks
November 2020
19
Profit & Loss (Rs Cr)
Y/E March FY20 FY21E FY22E FY23E
Net sales 36,354 37,548 42,354 47,860
Growth, % 5% 3% 13% 13%
Other income 1,090 1,232 1,380 1,561
Total income 3,744 3,878 4,373 4,942
Employee expenses 18,718 20,767 22,858 23,099
Other Operating expenses 6,561 7,611 8,307 9,194
EBITDA (Core) 5,832 6,563 7,498 10,495
Growth, % -8% 13% 14% 40%
Margin, % 16% 17% 18% 22%
Depreciation 1,379 1,438 1,273 1,584
EBIT 4,453 5,126 6,225 8,911
Growth, % -14% 15% 21% 43%
Margin, % 12% 14% 15% 19%
Interest paid 185 133 104 95
Pre-tax profit 5,358 6,225 7,501 10,377
Tax provided 1,268 1,666 2,008 3,228
Profit after tax 4,089 4,559 5,494 7,149
Net Profit 4,130 4,230 4,852 5,531
Growth, % -4% 2% 15% 14%
Net Profit (adjusted) 4,130 4,230 4,852 5,531
Source: Company, Axis Research
Balance Sheet (Rs Cr)
Y/E March FY20 FY21E FY22E FY23E
Cash & bank 1,722 3,154 5,518 10,459
Debtors 7,370 8,336 9,225 10,209
Other current assets 6,590 6,590 6,590 6,590
Total current assets 22,065 24,803 28,359 34,007
Net fixed assets 1,971 1,243 431 431
CWIP 276 276 276 276
Other Non current assets 752 752 752 752
Deffered tax assets 609 609 609 609
Total Non Current Assets 361 288 207 207
0 0 0 0
Total assets 33,543 35,964 39,321 44,341
0 0 0 0
Creditors 2,592 2,795 2,971 3,114
Provisions 395 395 395 395
Total current liabilities 9,800 9,763 9,939 10,082
Other liabilities 42 42 42 42
Paid-up capital 433 433 433 433
Reserves & surplus 20,125 22,624 25,847 30,724
Shareholders‟ equity 2,056 2,306 2,628 3,116
Total equity & liabilities 33,543 35,964 39,321 44,341
Source: Company, Axis Research

Diwali Muhurat Picks
November 2020
20
Cash Flow (Rs Cr)
Y/E March FY20 FY21E FY22E FY23E
Pre-tax profit 5,358 6,225 7,501 10,377
Depreciation 1,379 1,438 1,273 1,584
Chg in working capital -820 -1,306 -1,192 -706
Total tax paid 1,268 1,666 2,008 3,228
Cash flow from operating activities
5,812 6,200 7,410 11,238
Capital expenditure 727 710 673 745
Cash flow from investing activities
-727 -710 -673 -745
Free cash flow 5,812 6,200 7,410 11,238
Dividend (incl. tax) 3,846 2,112 2,323 2,323
Cash flow from financing activities
-291 -281 -42 24
Net chg in cash -321 1,432 2,364 4,941
Source: Company, Axis Research
Ratio Analysis (%)
Y/E March FY20 FY21E FY22E FY23E
Per Share data
EPS (INR) 48.0 50.0 55.0 62.7
Growth, % -2% 4% 10% 14%
Book NAV/share (INR) 233.6 262.0 298.6 354.1
FDEPS (INR) 39 42 46 46
CEPS (INR) 62.6 68.7 77.5 99.8
CFPS (INR) 36.5 43.8 42.8 42.8
DPS (INR) 24 21 24 24
Return ratios
Return on assets (%) 12% 13% 14% 16%
Return on equity (%) 20% 21% 22% 25%
Return on capital employed (%)
19% 19% 19% 21%
Turnover ratios
Asset turnover (x) 18.4 32.6 69.8 65.0
Sales/Total assets (x) 18.4 32.6 69.8 65.0
Receivables Days 102.4 102.4 102.4 102.4
Cash conversion cycle 25.5 5.1 5.0 2.4
Liquidity ratios
Current ratio (x) 2.2 2.4 2.7 3.2
Quick Ratio 1.4 1.6 1.9 2.3
Net debt/Equity (%) 0.0 0.0 0.0 0.0
Leverage Ratio 2.0 2.0 1.0 1.0
Valuation
PER (x) 13.2 14.2 12.3 11.3
Price/Book (x) 3.3 2.9 2.6 2.2
EV/Net sales (x) 3.1 2.9 2.8 2.8
EV/EBITDA (x) 7.3 7.3 6.4 6.4
Dividend Yeild 4.4 2.9 4.4 4.4
Source: Company, Axis Research
Diwali Muhurat Picks
November 2020
21
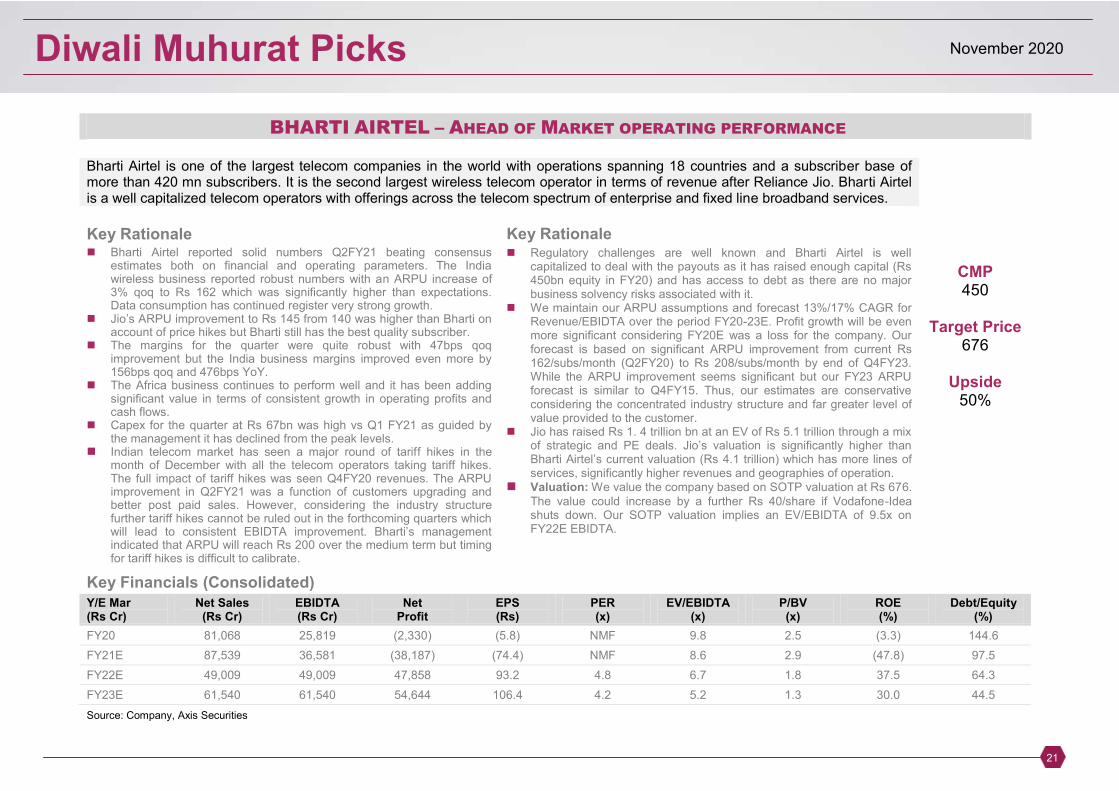
BHARTI AIRTEL – AHEAD OF MARKET OPERATING PERFORMANCE
Bharti Airtel is one of the largest telecom companies in the world with operations spanning 18 countries and a subscriber base of more than 420 mn subscribers. It is the second largest wireless telecom operator in terms of revenue after Reliance Jio. Bharti Airtel is a well capitalized telecom operators with offerings across the telecom spectrum of enterprise and fixed line broadband services.
Key Rationale Key Rationale Bharti Airtel reported solid numbers Q2FY21 beating consensus
estimates both on financial and operating parameters. The India wireless business reported robust numbers with an ARPU increase of 3% qoq to Rs 162 which was significantly higher than expectations. Data consumption has continued register very strong growth.
Jio‟s ARPU improvement to Rs 145 from 140 was higher than Bharti on account of price hikes but Bharti still has the best quality subscriber.
The margins for the quarter were quite robust with 47bps qoq improvement but the India business margins improved even more by 156bps qoq and 476bps YoY.
The Africa business continues to perform well and it has been adding significant value in terms of consistent growth in operating profits and cash flows.
Capex for the quarter at Rs 67bn was high vs Q1 FY21 as guided by the management it has declined from the peak levels.
Indian telecom market has seen a major round of tariff hikes in the month of December with all the telecom operators taking tariff hikes. The full impact of tariff hikes was seen Q4FY20 revenues. The ARPU improvement in Q2FY21 was a function of customers upgrading and better post paid sales. However, considering the industry structure further tariff hikes cannot be ruled out in the forthcoming quarters which will lead to consistent EBIDTA improvement. Bharti‟s management indicated that ARPU will reach Rs 200 over the medium term but timing for tariff hikes is difficult to calibrate.
Regulatory challenges are well known and Bharti Airtel is well capitalized to deal with the payouts as it has raised enough capital (Rs 450bn equity in FY20) and has access to debt as there are no major business solvency risks associated with it.
We maintain our ARPU assumptions and forecast 13%/17% CAGR for Revenue/EBIDTA over the period FY20-23E. Profit growth will be even more significant considering FY20E was a loss for the company. Our forecast is based on significant ARPU improvement from current Rs 162/subs/month (Q2FY20) to Rs 208/subs/month by end of Q4FY23. While the ARPU improvement seems significant but our FY23 ARPU forecast is similar to Q4FY15. Thus, our estimates are conservative considering the concentrated industry structure and far greater level of value provided to the customer.
Jio has raised Rs 1. 4 trillion bn at an EV of Rs 5.1 trillion through a mix of strategic and PE deals. Jio‟s valuation is significantly higher than Bharti Airtel‟s current valuation (Rs 4.1 trillion) which has more lines of services, significantly higher revenues and geographies of operation.
Valuation: We value the company based on SOTP valuation at Rs 676. The value could increase by a further Rs 40/share if Vodafone-Idea shuts down. Our SOTP valuation implies an EV/EBIDTA of 9.5x on FY22E EBIDTA.
CMP 450
Target Price
676
Upside 50%
Key Financials (Consolidated)
Y/E Mar (Rs Cr)
Net Sales (Rs Cr)
EBIDTA (Rs Cr)
Net Profit
EPS (Rs)
PER (x)
EV/EBIDTA (x)
P/BV (x)
ROE (%)
Debt/Equity (%)
FY20 81,068 25,819 (2,330) (5.8) NMF 9.8 2.5 (3.3) 144.6
FY21E 87,539 36,581 (38,187) (74.4) NMF 8.6 2.9 (47.8) 97.5
FY22E 49,009 49,009 47,858 93.2 4.8 6.7 1.8 37.5 64.3
FY23E 61,540 61,540 54,644 106.4 4.2 5.2 1.3 30.0 44.5
Source: Company, Axis Securities

Diwali Muhurat Picks
November 2020
22
Profit & Loss (Rs Cr)
Y/E March FY20 FY21E FY22E FY23E
Net sales 87,539 103,293 118,820 132,428
Growth, % 8 18 15 11
Total income 87,539 103,293 118,820 132,428
Raw material expenses -10,740 -9,281 -7,560 -8,196
Employee expenses -3,807 -4,562 -4,870 -5,266
Other Operating expenses -49,503 -52,899 -56,036 -60,428
EBITDA (Core) 36,581 49,009 61,540 70,654
Growth, % 41.7 34.0 25.6 14.8
Margin, % 41.8 47.4 51.8 53.4
Depreciation -27,690 -29,335 -27,910 -26,110
EBIT 8,892 19,674 33,631 44,544
Growth, % 98.9 121.3 70.9 32.4
Margin, % 10.2 19.0 28.3 33.6
Interest paid -13,205 -13,965 -12,160 -9,863
Other Non-Operating Income 288 1,176 1,046 1,038
Non-recurring Items -40,362 -42 0 0
Pre-tax profit -43,734 7,029 22,595 35,775
Tax provided 7,238 -6,516 -7,908 -12,521
Profit after tax -36,496 514 14,687 23,254
Others (Minorities, Associates) -1,691 47,302 39,957 42,510
Net Profit -38,187 47,816 54,644 65,763
Growth, % 1,539.0 (225.3) 14.2 20.3
Net Profit (adjusted) (38,187) 47,858 54,644 65,763
Unadj. shares (bn) 513.4 513.4 513.4 513.4
Wtd avg shares (bn) 513.4 513.4 513.4 513.4
Source: Company, Axis Research
Balance Sheet (Rs Cr)
Y/E March FY20 FY21E FY22E FY23E
Cash & bank 31,688 26,256 28,347 30,905
Marketable securities at cost 0 0 0 0
Debtors 0 0 0 0
Inventory 0 0 0 0
Loans & advances 0 0 0 0
Other current assets 46,983 39,561 39,781 40,009
Total current assets 78,671 65,817 68,128 70,914
Investments 0 0 0 0
Gross fixed assets 243,219 237,899 236,109 234,457
Less: Depreciation 0 0 0 0
Add: Capital WIP 0 0 0 0
Net fixed assets 243,219 237,899 236,109 234,457
Non-current assets 38,889 36,820 37,373 37,933
Total assets 363,497 384,159 392,190 409,982
Current liabilities 131,488 109,865 108,222 106,979
Provisions 0 0 0 0
Total current liabilities 131,488 109,865 108,222 106,979
Non-current liabilities 127,162 142,389 137,375 133,156
Total liabilities 258,650 252,253 245,597 240,135
Paid-up capital 2,567 2,567 2,567 2,567
Reserves & surplus 77,296 125,112 179,757 245,520
Shareholders‟ equity 104,848 131,906 146,593 169,846
Total equity & liabilities 363,497 384,159 392,190 409,982
Source: Company, Axis Research

Diwali Muhurat Picks
November 2020
23
Cash Flow (Rs Cr)
Y/E March FY20 FY21E FY22E FY23E
Pre-tax profit -43,734 7,029 22,595 35,775
Depreciation 27,690 29,335 27,910 26,110
Chg in working capital -41,068 14,727 1,141 1,405
Total tax paid 7,796 -6,345 -7,508 -12,034
Other operating activities 0 0 0 0
Cash flow from operating activities
-51,997 45,488 44,115 51,232
Capital expenditure -30,201 -24,016 -26,120 -24,457
Chg in investments 0 0 0 0
Chg in marketable securities -26,806 7,422 -220 -228
Other investing activities 28,523 -2,603 -6,560 -12,647
Cash flow from investing activities
-1,026 -26,432 -32,602 -37,048
Free cash flow -53,023 19,056 11,514 14,184
Equity raised/(repaid) 46,628 0 0 0
Debt raised/(repaid) 28,202 9,078 -7,305 -6,877
Dividend (incl. tax) 0 0 0 0
Other financing activities 0 0 0 0
Cash flow from financing activities
84,597 35,622 -7,305 -6,877
Net chg in cash 31,574 54,678 4,209 7,308
Opening cash balance 14,923 31,688 26,256 28,347
Closing cash balance 31,688 26,256 28,347 30,905
Source: Company, Axis Research
Ratio Analysis (%) Y/E March FY20 FY21E FY22E FY23E
Per Share data
EPS (INR) (74.4) 93.2 106.4 128.1
Growth, % 1,176.2 (225.3) 14.2 20.3
Book NAV/share (INR) 155.6 248.7 355.1 483.2
FDEPS (INR) (74.4) 93.2 106.4 128.1
CEPS (INR) (20.4) 150.4 160.8 179.0
CFPS (INR)
39.8 81.6 96.3
DPS (INR) - - - -
Return ratios
Return on assets (%) (9.0) 2.5 6.4 8.4
Return on equity (%) (47.8) 37.5 30.0 26.5
Return on capital employed (%) (13.8) 3.5 7.8 9.8
Turnover ratios
Asset turnover (x) 0.6 0.7 0.8 0.9
Sales/Total assets (x) 0.3 0.3 0.3 0.4
Sales/Net FA (x) 0.4 0.4 0.5 0.6
Working capital/Sales (x) (1.0) (0.7) (0.6) (0.5)
Fixed capital/Sales (x) 2.7 2.2 1.9 1.7
Working capital days (352.3) (248.4) (210.2) (184.6)
Liquidity ratios
Current ratio (x) 0.6 0.6 0.6 0.7
Quick ratio (x) 0.6 0.6 0.6 0.7
Interest cover (x) 0.7 1.4 2.8 4.5
Total debt/Equity (%) 144.6 97.5 64.3 44.5
Net debt/Equity (%) 104.9 77.0 48.7 32.0
Valuation
PER (x) (6.1) 4.8 4.2 3.5
Price/Book (x) 2.9 1.8 1.3 0.9
EV/Net sales (x) 3.6 3.2 2.7 2.3
EV/EBITDA (x) 8.6 6.7 5.2 4.4
EV/EBIT (x) 35.5 16.8 9.5 7.0
Source: Company, Axis Research
Diwali Muhurat Picks
November 2020
24
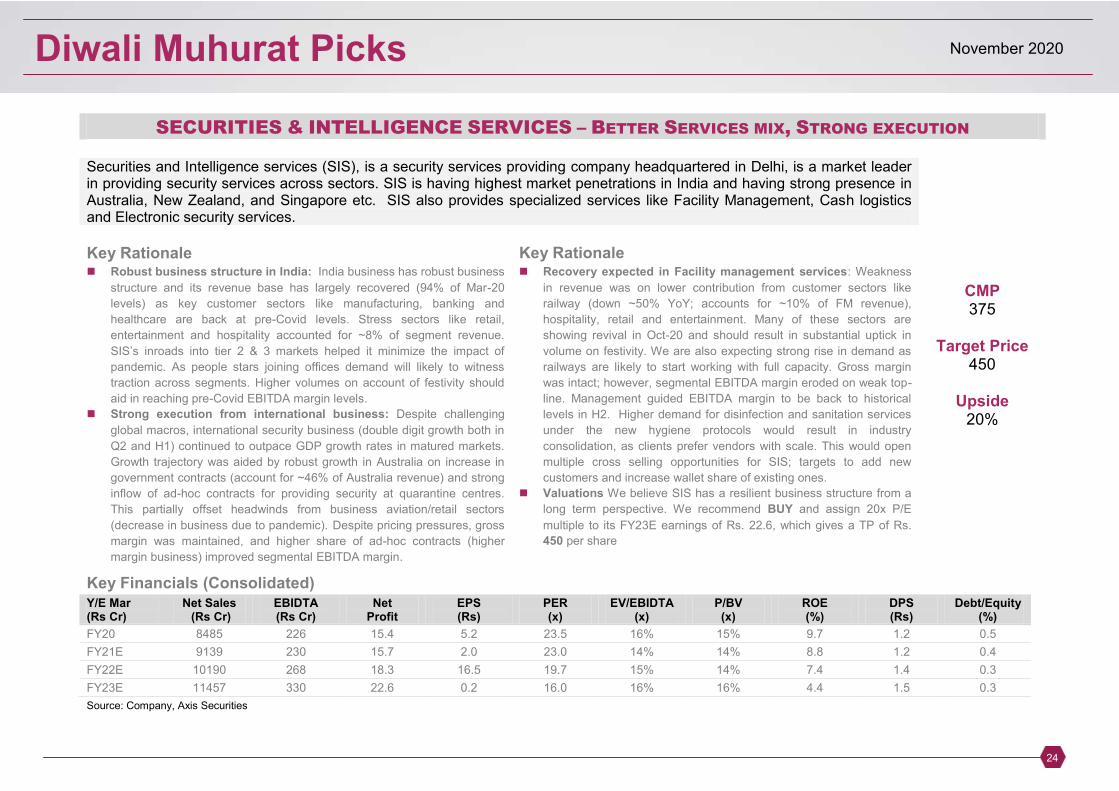
SECURITIES & INTELLIGENCE SERVICES – BETTER SERVICES MIX, STRONG EXECUTION
Securities and Intelligence services (SIS), is a security services providing company headquartered in Delhi, is a market leader in providing security services across sectors. SIS is having highest market penetrations in India and having strong presence in Australia, New Zealand, and Singapore etc. SIS also provides specialized services like Facility Management, Cash logistics and Electronic security services.
Key Rationale Key Rationale Robust business structure in India: India business has robust business
structure and its revenue base has largely recovered (94% of Mar-20
levels) as key customer sectors like manufacturing, banking and
healthcare are back at pre-Covid levels. Stress sectors like retail,
entertainment and hospitality accounted for ~8% of segment revenue.
SIS‟s inroads into tier 2 & 3 markets helped it minimize the impact of pandemic. As people stars joining offices demand will likely to witness
traction across segments. Higher volumes on account of festivity should
aid in reaching pre-Covid EBITDA margin levels.
Strong execution from international business: Despite challenging
global macros, international security business (double digit growth both in
Q2 and H1) continued to outpace GDP growth rates in matured markets.
Growth trajectory was aided by robust growth in Australia on increase in
government contracts (account for ~46% of Australia revenue) and strong
inflow of ad-hoc contracts for providing security at quarantine centres.
This partially offset headwinds from business aviation/retail sectors
(decrease in business due to pandemic). Despite pricing pressures, gross
margin was maintained, and higher share of ad-hoc contracts (higher
margin business) improved segmental EBITDA margin.
Recovery expected in Facility management services: Weakness
in revenue was on lower contribution from customer sectors like
railway (down ~50% YoY; accounts for ~10% of FM revenue),
hospitality, retail and entertainment. Many of these sectors are
showing revival in Oct-20 and should result in substantial uptick in
volume on festivity. We are also expecting strong rise in demand as
railways are likely to start working with full capacity. Gross margin
was intact; however, segmental EBITDA margin eroded on weak top-
line. Management guided EBITDA margin to be back to historical
levels in H2. Higher demand for disinfection and sanitation services
under the new hygiene protocols would result in industry
consolidation, as clients prefer vendors with scale. This would open
multiple cross selling opportunities for SIS; targets to add new
customers and increase wallet share of existing ones.
Valuations We believe SIS has a resilient business structure from a
long term perspective. We recommend BUY and assign 20x P/E
multiple to its FY23E earnings of Rs. 22.6, which gives a TP of Rs.
450 per share
CMP 375
Target Price
450
Upside 20%
Key Financials (Consolidated) Y/E Mar (Rs Cr)
Net Sales (Rs Cr)
EBIDTA (Rs Cr)
Net Profit
EPS (Rs)
PER (x)
EV/EBIDTA (x)
P/BV (x)
ROE (%)
DPS (Rs)
Debt/Equity (%)
FY20 8485 226 15.4 5.2 23.5 16% 15% 9.7 1.2 0.5
FY21E 9139 230 15.7 2.0 23.0 14% 14% 8.8 1.2 0.4
FY22E 10190 268 18.3 16.5 19.7 15% 14% 7.4 1.4 0.3
FY23E 11457 330 22.6 0.2 16.0 16% 16% 4.4 1.5 0.3
Source: Company, Axis Securities

Diwali Muhurat Picks
November 2020
25
Profit & Loss (Rs Cr)
Y/E March FY20 FY21E FY22E FY23E
Net sales 8,485 9,139 10,190 11,457
Other operating income 0 0 0 0
Total income 8,485 9,139 10,190 11,457
Cost of goods sold 6,980 7,457 8,402 9,446
Contribution (%) 17.7% 18.4% 17.6% 17.6%
Advt/Sales/Distrn O/H 985.2 1,122.7 1,141.3 1,283.1
Operating Profit 520 560 647 727
Other income 53 37 20 23
PBIDT 574 597 667 750
Depreciation 128 138 162 162
Interest & Fin Chg. 152 149 147 147
E/o income / (Expense) (4) 0 0 0
Pre-tax profit 289 310 359 442
Tax provision 64 79 90 111
(-) Minority Interests 0 0 0 0
Associates 0 0 0 0
Profit after Tax 226 230 268 330
Other Comprehensive Income 0.0 0.0 0.0 0.0
PAT after Comprehensive Income 226 230 268 330
Source: Company, Axis Research
Balance Sheet (Rs Cr)
Y/E March FY20 FY21E FY22E FY23E
Total assets 3,412 3,567 3,809 4,130
Net Block 285.3 214.8 120.2 25.5
CWIP 0.0 0.0 0.0 0.0
Investments 1,240.8 1,253.2 1,265.7 1,278.4
Wkg. cap. (excl cash) 568 701 902 (244)
Cash / Bank balance 980 1,046 1,199 2,779
Misc. Assets 0.0 0.0 0.0 0.0
Capital employed 3,412 3,567 3,809 4,130
Equity capital 73.3 73.3 73.3 73.3
Reserves 1,475 1,685 1,930 2,260
Minority Interests 4.5 4.6 5.4 0.0
Borrowings 949 893 890 886
Def tax Liabilities 910 910 910 910
Source: Company, Axis Research

Diwali Muhurat Picks
November 2020
26
Cash Flow (Rs Cr)
Y/E March FY20 FY21E FY22E FY23E
Sources 643 275 449 528
Cash profit 506 518 577 639
(-) Dividends 20 20 24 0
Retained earnings 486 497 554 639
Issue of equity 0.0 0.0 0.0 0.0
Change in Oth. Reserves 126.0 (12.9) 50.1 43.9
Borrowings 166 (8) (8) (8)
Others (135) (201) (147) (147)
Applications 643 275 449 528
Capital expenditure 136.9 41.9 104.3 104.4
Investments 0.6 0.0 0.0 0.0
Net current assets 35.4 123.5 190.8 150.0
Change in cash 469.8 109.6 153.3 157.0
Closing cash 890 999 999 999
Source: Company, Axis Research
Ratio Analysis (%)
Y/E March FY20 FY21E FY22E FY23E
Sales growth
19.6 7.7 11.5 12.4
OPM
Oper. profit growth 6.1 6.1 6.4 6.3
COGS / Net sales 42.5 7.6 15.6 12.4
Overheads/Net sales 82.3 81.6 82.5 82.5
Depreciation / G. block 11.6 12.3 11.2 11.2
Effective interest rate (%) (210.9) (195.8) (171.3) (171.3)
17.3 16.7 16.5 16.5
Net wkg.cap / Net sales
Net sales / Gr block (x) 0.06 0.07 0.08 0.03
15.7 15.0 15.1 15.4
RoCE
Debt / equity (x) 0.1 0.1 0.1 0.2
Effective tax rate 0.47 0.38 0.33 0.27
RoE 22.0 25.6 25.2 25.2
Payout ratio (Div/NP) 0.2 0.1 0.1 0.2
7.5 7.5 7.5 0.0
EPS (Rs.)
EPS Growth 15.4 15.7 18.3 22.6
CEPS (Rs.) 5.2 2.0 16.5 23.1
DPS (Rs.) 24.2 25.2 29.4 33.6
Source: Company, Axis Research
Diwali Muhurat Picks
November 2020
27
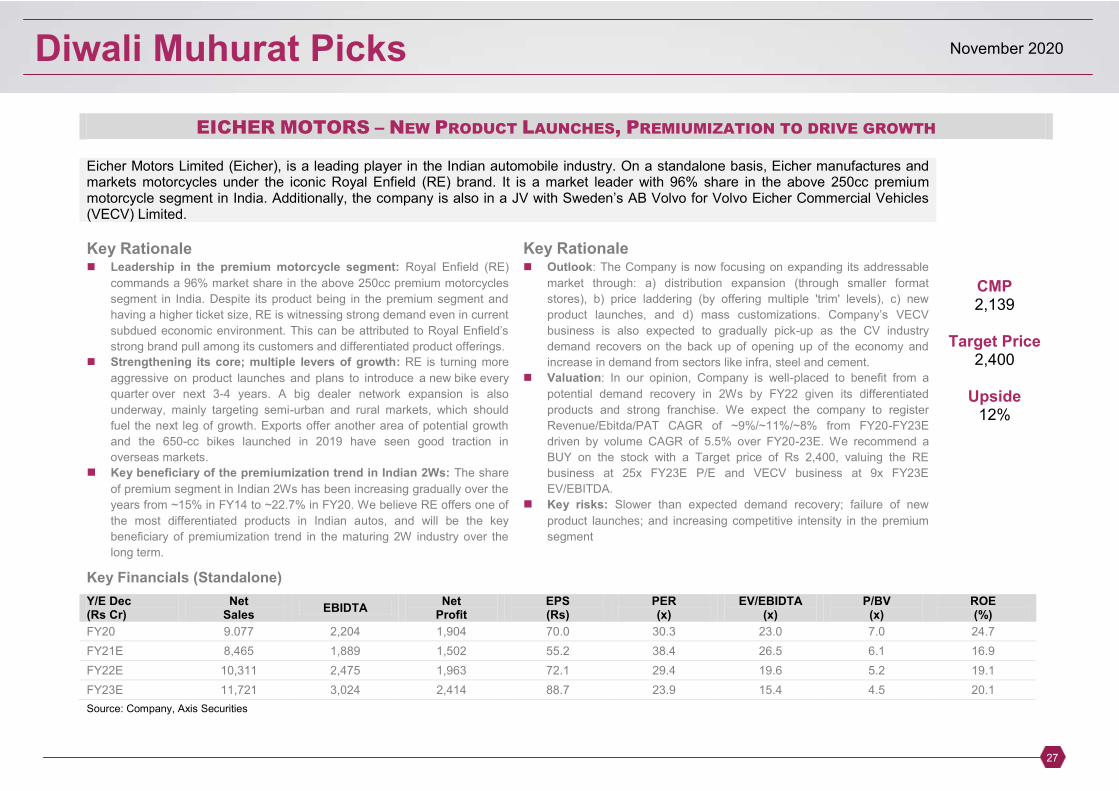
EICHER MOTORS – NEW PRODUCT LAUNCHES, PREMIUMIZATION TO DRIVE GROWTH
Eicher Motors Limited (Eicher), is a leading player in the Indian automobile industry. On a standalone basis, Eicher manufactures and markets motorcycles under the iconic Royal Enfield (RE) brand. It is a market leader with 96% share in the above 250cc premium motorcycle segment in India. Additionally, the company is also in a JV with Sweden‟s AB Volvo for Volvo Eicher Commercial Vehicles (VECV) Limited.
Key Rationale Key Rationale Leadership in the premium motorcycle segment: Royal Enfield (RE)
commands a 96% market share in the above 250cc premium motorcycles
segment in India. Despite its product being in the premium segment and
having a higher ticket size, RE is witnessing strong demand even in current
subdued economic environment. This can be attributed to Royal Enfield‟s strong brand pull among its customers and differentiated product offerings.
Strengthening its core; multiple levers of growth: RE is turning more
aggressive on product launches and plans to introduce a new bike every
quarter over next 3-4 years. A big dealer network expansion is also
underway, mainly targeting semi-urban and rural markets, which should
fuel the next leg of growth. Exports offer another area of potential growth
and the 650-cc bikes launched in 2019 have seen good traction in
overseas markets.
Key beneficiary of the premiumization trend in Indian 2Ws: The share
of premium segment in Indian 2Ws has been increasing gradually over the
years from ~15% in FY14 to ~22.7% in FY20. We believe RE offers one of
the most differentiated products in Indian autos, and will be the key
beneficiary of premiumization trend in the maturing 2W industry over the
long term.
Outlook: The Company is now focusing on expanding its addressable
market through: a) distribution expansion (through smaller format
stores), b) price laddering (by offering multiple 'trim' levels), c) new
product launches, and d) mass customizations. Company‟s VECV business is also expected to gradually pick-up as the CV industry
demand recovers on the back up of opening up of the economy and
increase in demand from sectors like infra, steel and cement.
Valuation: In our opinion, Company is well-placed to benefit from a
potential demand recovery in 2Ws by FY22 given its differentiated
products and strong franchise. We expect the company to register
Revenue/Ebitda/PAT CAGR of ~9%/~11%/~8% from FY20-FY23E
driven by volume CAGR of 5.5% over FY20-23E. We recommend a
BUY on the stock with a Target price of Rs 2,400, valuing the RE
business at 25x FY23E P/E and VECV business at 9x FY23E
EV/EBITDA.
Key risks: Slower than expected demand recovery; failure of new
product launches; and increasing competitive intensity in the premium
segment
CMP 2,139
Target Price
2,400
Upside 12%
Key Financials (Standalone)
Y/E Dec (Rs Cr)
Net Sales
EBIDTA Net
Profit EPS (Rs)
PER (x)
EV/EBIDTA (x)
P/BV (x)
ROE (%)
FY20 9.077 2,204 1,904 70.0 30.3 23.0 7.0 24.7
FY21E 8,465 1,889 1,502 55.2 38.4 26.5 6.1 16.9
FY22E 10,311 2,475 1,963 72.1 29.4 19.6 5.2 19.1
FY23E 11,721 3,024 2,414 88.7 23.9 15.4 4.5 20.1
Source: Company, Axis Securities

Diwali Muhurat Picks
November 2020
28
Profit & Loss (Rs Cr)
Y/E Mar FY20 FY21E FY22E FY23E
Net revenues 9,077 8,465 10,311 11,721
Operating expenses 6,874 6,576 7,836 8,697
EBIDTA 2,204 1,889 2,475 3,024
EBIDTA margin (%) 24.3 22.3 24.0 25.8
Other income 615 563 659 790
Interest 11 11 11 11
Depreciation 378 446 516 597
Profit Before Tax 2,430 1,995 2,606 3,206
Tax 527 492 643 791
Reported Net Profit 1,904 1,502 1,963 2,414
Net Margin (%) 21.0 17.7 19.0 20.6
Adjusted Net Profit 1,904 1,502 1,963 2,414
Source: Company, Axis Research
Balance Sheet (Rs Cr)
Y/E Mar FY20 FY21E FY22E FY23E
Equity capital 27 27 27 27
Reserves & surplus 8,248 9,483 11,051 12,921
Shareholders funds 8,275 9,511 11,078 12,949
Total Loans 101 101 101 101
Deferred tax liability 252 252 252 252
Total Liabilities and Equity 8,628 9,863 11,431 13,301
Gross block 3,684 4,284 4,934 5,734
Depreciation 1,316 1,762 2,278 2,875
Net block 2,369 2,523 2,656 2,859
Capital WIP 312 312 312 312
Investments 3,926 3,920 5,420 7,820
Inventory 518 498 601 677
Debtors 134 125 152 173
Cash & Bank Bal 2,926 3,948 4,117 3,558
Loans & Advances 394 394 394 394
Current Assets 3,973 4,965 5,264 4,802
Sundry Creditors 1,021 970 1,171 1,319
Other Current Liability 930 887 1,052 1,173
Current Liability& Provisions 1,951 1,857 2,222 2,492
Net current assets 2,022 3,108 3,042 2,310
Misc Exp 0 0 0 0
Total Assets 8,628 9,863 11,431 13,301
Source: Company, Axis Research

Diwali Muhurat Picks
November 2020
29
Cash Flow (Rs Cr)
Y/E Mar FY20 FY21E FY22E FY23E
EBIT 1,826 1,443 1,958 2,427
Other Income 615 563 659 790
Depreciation & Amortisation 378 446 516 597
Interest paid(-) 11 11 11 11
Tax paid(-) -628 -492 -643 -791
Extra Ord Income -552 0 0 0
Operating Cash Flow 1,650 1,970 2,501 3,033
Change in Working Capital 92 -65 235 173
Cash flow from Operations 1,742 1,906 2,736 3,206
Capex -555 -600 -650 -800
Strategic Investment 0 0 0 0
Non Strategic Investment -964 5 -1,500 -2,400
Cash flow from Investing -1,519 -595 -2,150 -3,200
Change in borrowing -103 0 0 0
Others 28 0 0 0
Dividends paid(-) -809 -267 -395 -544
Cashflow from Financial Activities -883 -267 -395 -544
Change in Cash -661 1,044 190 -537
Opening cash 691 19 1,041 1,210
Closing cash 19 1,041 1,210 651
Source: Company, Axis Research
Ratio Analysis (%) Key Ratios FY20 FY21E FY22E FY23E
Revenue Growth -7.3 -6.7 21.8 13.7
EBITDA Margin 24.3 22.3 24.0 25.8
Net Profit Margin 21.0 17.7 19.0 20.6
ROCE (%) 23.7 16.3 18.5 19.6
ROE (%) 24.7 16.9 19.1 20.1
EPS( Rs) 70.0 55.2 72.1 88.7
P/E (x) 30.3 38.4 29.4 23.9
P/ BV (x) 7.0 6.1 5.2 4.5
EV/ EBITDA (x) 23.0 26.5 19.6 15.4
Fixed Assets Turnover Ratio (x) 3.4 3.0 3.5 3.7
Debt / Equity (x) 0.0 0.0 0.0 0.0
EV/ Sales (x) 5.6 5.9 4.7 4.0
Source: Company, Axis Research

Diwali Muhurat Picks
November 2020
30
DALMIA BHARAT – STRONG DEMAND REVIVAL & BETTER COST CONTROL
DBL is among the top five cement producers in India having capacity of 26.5 mntpa with strong market position in its key markets of South, East and North East India. The company has overall market share of 5% in the Indian cement industry. Currently the company is in the process of expanding its existing capacity from 26.5 mntpa to 37.3 mntpa which will get operational in phases over FY21 to FY22. Dalmia Cement‟s availability spans across 22 states and union territories, mainly in East, North East and Southern India, with selective presence in Uttar Pradesh and Maharashtra. The company offer a range of cement variants through various brand portfolio of three marquee brands: Dalmia Cement, Dalmia DSP and Konark Cement.
Key Rationale Key Rationale DBL is in the process of expanding its present capacity by 40% (including
acquisition of Murali Industries 3 mntpa awarded under NCLT
proceedings) from 26.5 mntpa to 37.3 mntpa. These capacities will get
operational in phases over next 6 to 18 months time.Since majority of
these expansions are taking place (7.8 mntpa) in the eastern region, the
gain in market share is imminent. The acquistion of Murali Industries will
allow the company to capture western markets where currently the
company has no operating facility
The company reported steller Q2FY21 results driven by volume growth
and effective cost control indicating better operating efficiency. DBLs
integrated operations, better cement to clinker ratio, introduction of
portland composite cement, digitisation of sales channel and effective
utilization of resources makes it one of the efficient cost producer of
cement in India
Key risks: Deterioration in cement demand supply dynamics, fluctuation
in input prices, cyclicality of the cement industry
The company capacity is geographically diversified (45.7% in
southern region, 39.24% in East and balance 15% in North-East
region which will keep company relatively insulated from regional
demand supply fluctuations. Further acquisition of Murali Industries
gives the company opportunity to explore Western market. With the
commissioning of extended capacity the company will further
consolidate its position in its key markets. The market share of the
company in East will increase from current 12% to 19% with the
commissioning of the extended facility.
Outlook &Valuation: The revival in cement demand augurs well for
the company on the back of demand improvement both in the trade
and non trade channel.With capacity expansion, better monitoring of
cost drivers and increased realization,DBL is expected to report
Revenue/Ebitda/APAT CAGR of 14%//15%/22% respectively
between FY21E-FY23E.We value DBL at 6.5x FY22E EV/EBITDA to
arrive at TP of Rs.1083.
CMP 893
Target Price
1083
Upside 21%
Key Financials (Consolidated)
Y/E Mar (Rs Cr)
Net Sales (Rs Cr)
EBIDTA (Rs Cr)
Net Profit
EPS (Rs)
PER (x)
EV/EBIDTA (x)
P/BV (x)
ROE (%)
2020 96740 21060 2380 12.3 39.7 5.8 0.9 2.2
2021E 97195 27716 8976 48.1 18.4 6.8 1.5 8.1
2022E 115626 33445 11706 62.7 14.2 5.3 1.4 9.6
2023E 126514 36034 13406 71.8 12.4 4.4 1.2 10
Source: Company, Axis Securities

Diwali Muhurat Picks
November 2020
31
Profit & Loss (Rs Cr)
Y/E March FY20 FY21E FY22E FY23E
Net sales 96740 97195 115626 126514
Other operating income 0 0 0 0
Total income 96740 97195 115626 126514
Raw Material 17460 16943 20332 22162
Power & Fuel 17380 13866 16639 18136
Freight & Forwarding 18950 18827 22592 24399
Employee benefit expenses 6750 6770 7582 8492
Other Expenses 15140 13075 15036 17291
EBITDA 21060 27716 33445 36034
Other income 2170 2430 2891 3163
PBIDT 23230 30145 36336 39196
Depreciation 15280 12495 14688 15069
Interest & Fin Chg. 4380 3842 3638 3502
E/o income / (Expense) 0 0 0 0
Pre-tax profit 3570 13809 18010 20625
Tax provision 1190 4833 6303 7219
RPAT 2380 8976 11706 13406
Minority Interests -140 -100 -140 -140
Associates 0 0 0 0
APAT after EO item 2240 8876 11566 13266
Source: Company, Axis Research
Balance Sheet (Rs Cr)
Y/E March FY20 FY21E FY22E FY23E
Total assets 206110 208601 218312 230083
Net Block 141270 143355 142561 133838
CWIP 17020 9000 3000 3000
Investments 1180 1180 1180 1180
Wkg. cap. (excl cash) 5420 6125 6969 7626
Cash / Bank balance 4030 1757 2321 6658
Misc. Assets 37190 47184 62281 77782
Capital employed 206110 208601 218312 230083
Equity capital 386 374 374 374
Reserves 105220 110542 121688 134534
Minority Interests 250 250 250 250
Borrowings 54210 56500 53500 51500
Def tax Liabilities 12770 12800 12800 12800
Other Liabilities and Provision 33274 28135 29701 30625
Source: Company, Axis Research

Diwali Muhurat Picks
November 2020
32
Cash Flow (Rs Cr)
Y/E March FY20 FY21E FY22E FY23E
Profit before tax 3570 13809 18010 20625
Depriciation 15280 12495 14688 15069
Interest Expenses 3640 3842 3638 3502
Non operating/ EO item -1190 -2430 -2891 -3163
Change in W/C 2740 -745 -845 -656
Income Tax -660 -4833 -6303 -7219
Operating Cash Flow 23380 21828 26297 28158
Capital Expenditure -13500 -14579 -13895 -6346
Investments 0 -1570 -7531 -14576
Others -4100 1470 1330 1330
Investing Cash Flow -17600 -13579 -18535 -17759
Borrowings 120 -3010 -3000 -2000
Interest Expenses -4680 -3842 -3638 -3502
Dividend paid -930 -374 -560 -560
Others -430 0 0 0
Financing Cash Flow -5920 -7226 -7198 -6062
Change in Cash -140 -2273 564 4337
Opening Cash 2800 2660 387 951
Closing Cash 2660 387 951 5288
Source: Company, Axis Research
Ratio Analysis (%)
Y/E March FY20 FY21E FY22E FY23E
Operational Ratios
Sales growth 2% 0% 19% 9%
OPM 22% 29% 29% 28%
Op. profit growth 8% 32% 21% 8%
COGS / Net sales 56% 51% 52% 51%
Overheads/Net sales 23% 20% 20% 20%
Depreciation / G. block 8.2% 6.0% 6.4% 6.4%
Effective interest rate 7% 7% 7% 7%
Efficiency Ratios
Total Asset turnover (x) 0.47 0.47 0.53 0.55
Sales/Gross block (x) 0.46 0.50 0.54 0.54
Sales/Net block(x) 0.68 0.68 0.81 0.95
Working capital/Sales (x) 0.06 0.08 0.13 0.23
Valuation Ratios
P/BV (x) 0.89 1.18 1.07 0.97
EV/Ebitda (x) 5.84 6.83 5.33 4.36
EV/Sales (x) 1.27 1.95 1.54 1.24
EV/Tonne $ (x) 63 73 65 57
Return Ratios
ROE 2.24 8.27 10.03 10.41
ROCE 5.0 11.1 13.2 14.0
ROIC 6.16 13.71 17.25 20.97
Leverage Ratios
Debt / equity (x) 0.56 0.51 0.44 0.38
Net debt/ Equity (x) 0.27 0.24 0.12 -0.04
Debt service coverage ratio (x) 0.13 0.31 0.40 0.47
Interest Coverage ratio (x) 1.82 4.59 5.95 6.89
Source: Company, Axis Research

Diwali Muhurat Picks
November 2020
33
VARUN BEVERAGES – NORMALCY IN BUSINESS RESTORING
Varun Beverages Ltd (CBL) is the 2nd largest franchisee for PepsiCo in the world (outside USA). Products manufactured by VBL include Carbonated Soft Drinks - Pepsi, Mountain Dew, Seven Up, Mirinda; Non Carbonated Beverages - Tropicana Slice, Tropicana Frutz; and Bottled water – Aquafina. It operates in India and is also the exclusive bottler for PepsiCo in Nepal, Sri Lanka, Morocco, Zambia and Zimbabwe.
Key Rationale Key Rationale Q3CY20 performance was healthy on a YoY basis with in-home
consumption growing 20-25% rate. During September VBL reported a
13% growth in volumes and this trend is likely continuing in October
too. Further, with bunching up of festive season in Q4CY20,
resumption of public transports aiding on-the-go consumption and
continuing in-home consumption trend both in rural, semi-urban (~60%
of Q3CY20 sales) and urban areas bodes well for VBL going forward.
Expect EBITDA Margins to stabilize in 21-22% ranged on the back of
improved mix and cost rationalization initiatives taken during the
pandemic.
Low per capita soft drink consumption in India of 44 bottles as of
2016 as compared to 271 bottles in China, 1,496 bottles in USA and
1,489 bottles in Mexico offers immense scope for growth from deeper
penetration of soft drinks in India is a structural growth opportunity.
Key risks: concerns on second COVID wave in India (50% OOH*
consumption), seasonality, regulatory actions against soft drinks if any.
Outlook: With business growth restoring aided by unlock as
witnessed in Q3CY20, we do expect this momentum to continue.
Trend of in-home consumption has seen an increase and is likley to
continue as consumers get habituated to consuming soft drinks at
home. Rural regions are likely to grow ahead of urban counterparts
on the back of healthy outlook for agriculture. Share gain
opportunities from smaller players could further boost its market
share especially in acquired territories of South and West where
company will look to add dealers ahead of the season in CY21.
Valuation. We expect VBL to register Revenues/Earnings CAGR of
11%/30% resp. over CY19-22E. This growth will be driven by 1)
consolidation in newly acquired territories, 2) distribution led market
share gains, 3) cost efficiencies leading to margin tailwinds to
support EBITDA Margin in CY20E/CY21E. At CMP, stock trades at
an attractive valuation of 9.3x EV/EBITDA on CY22E basis versus
its 3 year mean of 14x EV/EBITDA.
CMP 694
Target Price
865
Upside 25%
Key Financials (Consolidated)
Y/E Dec (Rs Cr)
Net Sales
EBIDTA (Rs C)
Net Profit
EPS (Rs)
PER (x)
EV/EBIDTA (x)
P/BV (x)
ROE (%)
CY19 7,130 1,448 472 16.8 42.1 15.9 6.1 17.6
CY20E 6,390 1,297 376 13.0 51.6 16.7 5.3 10.7
CY21E 8,732 1,851 798 27.6 24.3 11.4 4.4 19.8
CY22E 9,715 2,118 1,038 35.9 18.7 9.3 3.7 21.5
Source: Company, Axis Securities; * OOH – Out-of-Home

Diwali Muhurat Picks
November 2020
34
Profit & Loss (Rs Cr)
Y/E DEC CY19 CY20E CY21E CY22E
Total Net Sales 7,130 6,390 8,732 9,715
Total Raw Material Consumption 3,219 2,767 3,798 4,197
Staff costs 811 805 1,030 1117
Other Expenditure 1,652 1,521 2,052 2,283
Total Expenditure 5,682 5,093 6,881 7,597
EBITDA 1,448 1,297 1,851 2,118
Depreciation 488.6 546 574 603
EBIT 959 751 1,277 1,515
Interest 310 277 216 146
Other Income 43 45 44 68
PBT 696 523 1,108 1441
Tax 224 146 310 404
APAT 472 376 798 1,038
Source: Company, Axis Research
Balance Sheet (Rs Cr)
Y/E DEC CY19 CY20E CY21E CY22E
Share Capital 289 289 289 289
Reserves & Surplus 3,040 3,367 4,054 4,967
Net Worth 3,359 3,687 4,373 5,286
Total Loan funds 2,823 2,523 2,123 1623
Deferred Tax Liability 283 283 283 283
Long Term Provisions 170 146 201 222
Capital Employed 6,635 6,639 6,980 7,414
Net Block 5,893 5,837 5,742 5,619
Investments 45 41 56 62
Sundry Debtors 173 175 239 266
Cash & Bank Bal 171 225 501 1227
Inventory 882 531 957 862
Other Current Assets 440 394 539 599
Total Current Assets 1,672 1,332 2,243 2,961
Current Liabilities& Provisions 1,753 1,442 1,968 2,171
Net Current Assets (81) (110) 275 790
Total Assets 6,635 6,639 6,980 7,414
Source: Company, Axis Research
Diwali Muhurat Picks
November 2020
35
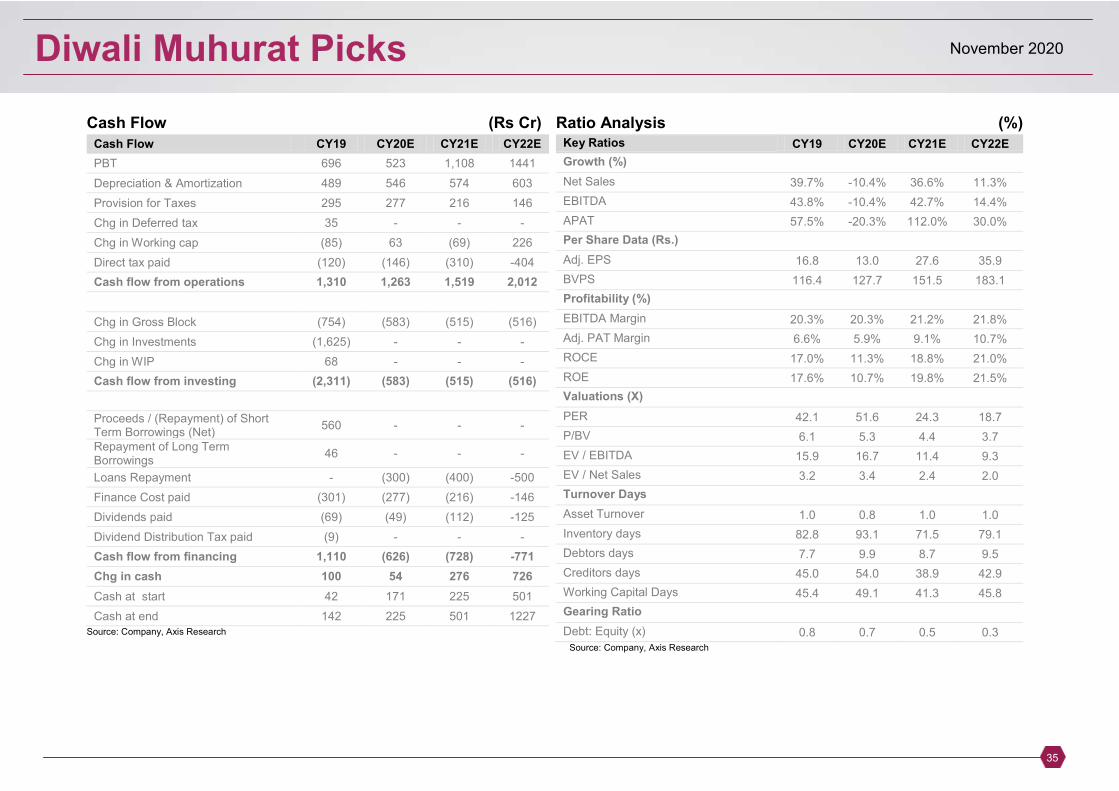
Cash Flow (Rs Cr)
Cash Flow CY19 CY20E CY21E CY22E
PBT 696 523 1,108 1441
Depreciation & Amortization 489 546 574 603
Provision for Taxes 295 277 216 146
Chg in Deferred tax 35 - - -
Chg in Working cap (85) 63 (69) 226
Direct tax paid (120) (146) (310) -404
Cash flow from operations 1,310 1,263 1,519 2,012
Chg in Gross Block (754) (583) (515) (516)
Chg in Investments (1,625) - - -
Chg in WIP 68 - - -
Cash flow from investing (2,311) (583) (515) (516)
Proceeds / (Repayment) of Short Term Borrowings (Net)
560 - - -
Repayment of Long Term Borrowings
46 - - -
Loans Repayment - (300) (400) -500
Finance Cost paid (301) (277) (216) -146
Dividends paid (69) (49) (112) -125
Dividend Distribution Tax paid (9) - - -
Cash flow from financing 1,110 (626) (728) -771
Chg in cash 100 54 276 726
Cash at start 42 171 225 501
Cash at end 142 225 501 1227 Source: Company, Axis Research
Ratio Analysis (%) Key Ratios CY19 CY20E CY21E CY22E
Growth (%)
Net Sales 39.7% -10.4% 36.6% 11.3%
EBITDA 43.8% -10.4% 42.7% 14.4%
APAT 57.5% -20.3% 112.0% 30.0%
Per Share Data (Rs.)
Adj. EPS 16.8 13.0 27.6 35.9
BVPS 116.4 127.7 151.5 183.1
Profitability (%)
EBITDA Margin 20.3% 20.3% 21.2% 21.8%
Adj. PAT Margin 6.6% 5.9% 9.1% 10.7%
ROCE 17.0% 11.3% 18.8% 21.0%
ROE 17.6% 10.7% 19.8% 21.5%
Valuations (X)
PER 42.1 51.6 24.3 18.7
P/BV 6.1 5.3 4.4 3.7
EV / EBITDA 15.9 16.7 11.4 9.3
EV / Net Sales 3.2 3.4 2.4 2.0
Turnover Days
Asset Turnover 1.0 0.8 1.0 1.0
Inventory days 82.8 93.1 71.5 79.1
Debtors days 7.7 9.9 8.7 9.5
Creditors days 45.0 54.0 38.9 42.9
Working Capital Days 45.4 49.1 41.3 45.8
Gearing Ratio
Debt: Equity (x) 0.8 0.7 0.5 0.3 Source: Company, Axis Research
Diwali Muhurat Picks
November 2020
36
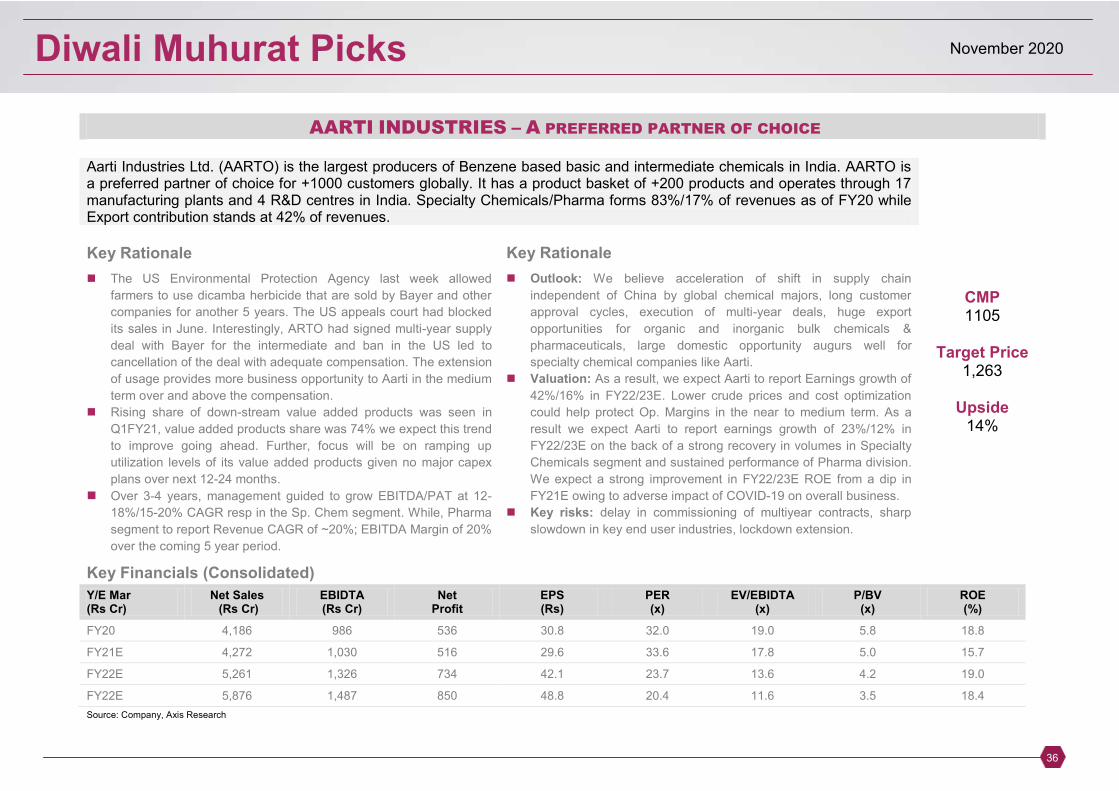
AARTI INDUSTRIES – A PREFERRED PARTNER OF CHOICE
Aarti Industries Ltd. (AARTO) is the largest producers of Benzene based basic and intermediate chemicals in India. AARTO is a preferred partner of choice for +1000 customers globally. It has a product basket of +200 products and operates through 17 manufacturing plants and 4 R&D centres in India. Specialty Chemicals/Pharma forms 83%/17% of revenues as of FY20 while Export contribution stands at 42% of revenues.
Key Rationale Key Rationale
The US Environmental Protection Agency last week allowed
farmers to use dicamba herbicide that are sold by Bayer and other
companies for another 5 years. The US appeals court had blocked
its sales in June. Interestingly, ARTO had signed multi-year supply
deal with Bayer for the intermediate and ban in the US led to
cancellation of the deal with adequate compensation. The extension
of usage provides more business opportunity to Aarti in the medium
term over and above the compensation.
Rising share of down-stream value added products was seen in
Q1FY21, value added products share was 74% we expect this trend
to improve going ahead. Further, focus will be on ramping up
utilization levels of its value added products given no major capex
plans over next 12-24 months.
Over 3-4 years, management guided to grow EBITDA/PAT at 12-
18%/15-20% CAGR resp in the Sp. Chem segment. While, Pharma
segment to report Revenue CAGR of ~20%; EBITDA Margin of 20%
over the coming 5 year period.
Outlook: We believe acceleration of shift in supply chain
independent of China by global chemical majors, long customer
approval cycles, execution of multi-year deals, huge export
opportunities for organic and inorganic bulk chemicals &
pharmaceuticals, large domestic opportunity augurs well for
specialty chemical companies like Aarti.
Valuation: As a result, we expect Aarti to report Earnings growth of
42%/16% in FY22/23E. Lower crude prices and cost optimization
could help protect Op. Margins in the near to medium term. As a
result we expect Aarti to report earnings growth of 23%/12% in
FY22/23E on the back of a strong recovery in volumes in Specialty
Chemicals segment and sustained performance of Pharma division.
We expect a strong improvement in FY22/23E ROE from a dip in
FY21E owing to adverse impact of COVID-19 on overall business.
Key risks: delay in commissioning of multiyear contracts, sharp
slowdown in key end user industries, lockdown extension.
CMP 1105
Target Price
1,263
Upside 14%
Key Financials (Consolidated)
Y/E Mar (Rs Cr)
Net Sales (Rs Cr)
EBIDTA (Rs Cr)
Net Profit
EPS (Rs)
PER (x)
EV/EBIDTA (x)
P/BV (x)
ROE (%)
FY20 4,186 986 536 30.8 32.0 19.0 5.8 18.8
FY21E 4,272 1,030 516 29.6 33.6 17.8 5.0 15.7
FY22E 5,261 1,326 734 42.1 23.7 13.6 4.2 19.0
FY22E 5,876 1,487 850 48.8 20.4 11.6 3.5 18.4
Source: Company, Axis Research
Diwali Muhurat Picks
November 2020
37
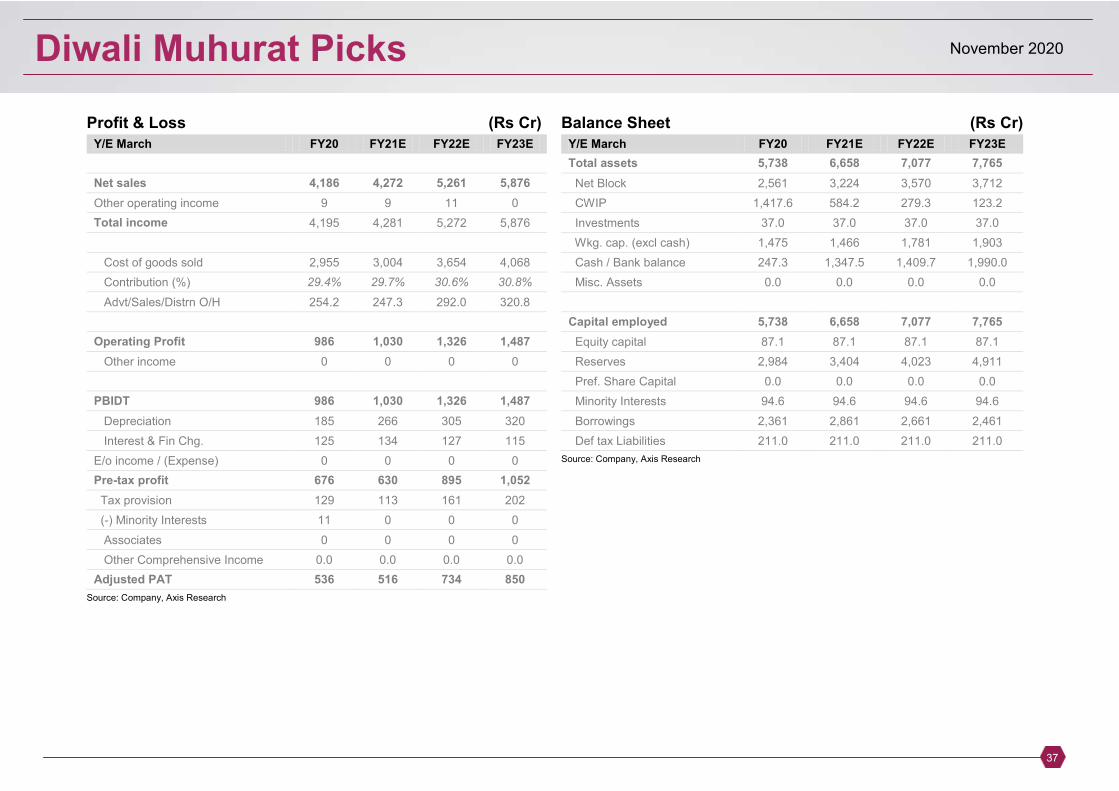
Profit & Loss (Rs Cr)
Y/E March FY20 FY21E FY22E FY23E
Net sales 4,186 4,272 5,261 5,876
Other operating income 9 9 11 0
Total income 4,195 4,281 5,272 5,876
Cost of goods sold 2,955 3,004 3,654 4,068
Contribution (%) 29.4% 29.7% 30.6% 30.8%
Advt/Sales/Distrn O/H 254.2 247.3 292.0 320.8
Operating Profit 986 1,030 1,326 1,487
Other income 0 0 0 0
PBIDT 986 1,030 1,326 1,487
Depreciation 185 266 305 320
Interest & Fin Chg. 125 134 127 115
E/o income / (Expense) 0 0 0 0
Pre-tax profit 676 630 895 1,052
Tax provision 129 113 161 202
(-) Minority Interests 11 0 0 0
Associates 0 0 0 0
Other Comprehensive Income 0.0 0.0 0.0 0.0
Adjusted PAT 536 516 734 850
Source: Company, Axis Research
Balance Sheet (Rs Cr)
Y/E March FY20 FY21E FY22E FY23E
Total assets 5,738 6,658 7,077 7,765
Net Block 2,561 3,224 3,570 3,712
CWIP 1,417.6 584.2 279.3 123.2
Investments 37.0 37.0 37.0 37.0
Wkg. cap. (excl cash) 1,475 1,466 1,781 1,903
Cash / Bank balance 247.3 1,347.5 1,409.7 1,990.0
Misc. Assets 0.0 0.0 0.0 0.0
Capital employed 5,738 6,658 7,077 7,765
Equity capital 87.1 87.1 87.1 87.1
Reserves 2,984 3,404 4,023 4,911
Pref. Share Capital 0.0 0.0 0.0 0.0
Minority Interests 94.6 94.6 94.6 94.6
Borrowings 2,361 2,861 2,661 2,461
Def tax Liabilities 211.0 211.0 211.0 211.0
Source: Company, Axis Research

Diwali Muhurat Picks
November 2020
38
Cash Flow (Rs Cr)
Y/E March FY20 FY21E FY22E FY23E
Sources 768 914 853 975
Cash profit 857 917 1,165 1,284
(-) Dividends 106 96 115 125
Retained earnings 750 820 1,050 1,159
Issue of equity (0.0) 0.0 0.0 0.0
Change in Oth. Reserves 10.8 0.0 0.0 0.0
Borrowings 114 228 -70 -70
Others -107 -134 -127 -115
Applications 768 914 853 975
Capital expenditure 1,757.7 95.6 346.1 142.2
Investments 3.9 0.0 0.0 0.0
Net current assets 0.5 (281.4) 444.9 252.1
Change in cash (993.9) 1,100.2 62.2 580.3
Source: Company, Axis Research
Ratio Analysis (%)
Y/E March FY20 FY21E FY22E FY23E
Sales growth 0.4 2.0 23.2 11.7
OPM 23.5 24.1 25.2 25.3
Oper. profit growth 2.0 4.4 28.8 12.1
COGS / Net sales 70.6 70.3 69.5 69.2
Overheads/Net sales 6.1 5.8 5.6 5.5
Depreciation / G. block 4.2 5.0 5.1 5.1
Effective interest rate 6.4 6.5 5.7 5.7
Net wkg.cap / Net sales (x) 0.26 0.25 0.23 0.24
Net sales / Gr block (x) 1.0 0.8 0.9 0.9
RoCE 14.7 12.4 14.9 15.7
Debt / equity (x) 0.6 0.7 0.5 0.4
Effective tax rate 19.1 18.0 18.0 19.2
RoE 18.8 15.7 19.0 18.4
Payout ratio (Div/NP) 19.8 18.6 15.7 14.7
EPS (Rs.) 30.8 29.6 42.1 48.8
EPS Growth 9.0 (3.7) 42.1 15.8
CEPS (Rs.) 41.4 44.9 59.6 67.1
DPS (Rs.) 6.1 5.0 6.0 6.5
Valuation (x)
P/E 32.0 33.6 23.7 20.4
P/BV 5.8 5.0 4.2 3.5
EV/EBITDA 19.0 17.8 13.6 11.6
Mcap/Sales 4.1 4.1 3.3 3.0
Source: Company, Axis Research

Diwali Muhurat Picks
November 2020
39
DHANUKA AGRITECH – DOMESTIC PLAY A BRIGHT SPOT
Dhanuka Agritech Ltd (DAGRI) is a leading agrochemical company in India catering to domestic crop protection market in collaboration with the world‟s seven leading agrochemical companies from US, Japan and Europe that helps it introduce the latest technology in Indian farmlands. The company offers crop protection products and speciality plant nutrient products & solutions through its strong PAN India distribution network consisting of 7000+ distributors & ~80,000 retailers which reach out to ~10 million Indian farmers.
Key Rationale Key Rationale Strong product portfolio backed by collaboration with global
MNC’s: Dhanuka has a strong collaboration with global MNCs to
market their products in India. The partnership revenues contributed
~45% in FY20. We expect this contribution to grow as the company
targets to launch 10 new products across all segments over the next
2-3 years with focus on margin accretive products in 9(3)
categories. So far in FY21E, DAGRI has launched 4 new products
of which 2 are in the 9(3) category and the pace of launches is
expected to be maintained going forward.
Pan India distribution network: DAGRI has a strong presence in
southern and western regions which contributes ~65% to its
revenues. DAGRI has established an extensive, pan-India
distribution network replicating a typical rural FMCG distribution
model. This is a key competitive advantage the company enjoys
and can be leveraged with MNCs to drive further growth.
Valuation: We expect DAGRI to register Revenue/EBITDA/PAT
CAGR of 16%/21%/20% respectively over FY20-23E given 1)
Strong product portfolio with 4-5 new product launches and one or
two 9(3) molecules annually in the domestic formulation business,
2) Stable revenue given collaboration with global MNCs, 3) PAN
India distribution network of 7000+ dealers and strong marketing
team to penetrate further into newer markets. At CMP, stock trades
at 14x FY23E EPS and is fairly valued in our view. We assign a
target multiple of 17x FY23E EPS.
Key Risks: The business is sensitive to weather conditions,
including extremes such as drought and natural disasters. Results
of operations are significantly affected by weather conditions in the
agricultural regions where agro chemical products are used.
CMP 733
Target Price
880
Upside 20%
Key Financials
Y/E Mar (Rs Cr)
Net Sales
EBIDTA Net
Profit EPS (Rs)
PER (x)
EV/EBIDTA (x)
P/BV (x)
ROE (%)
FY20 1,120 174 142 29.8 12.9 10.1 2.6 21.0
FY21E 1,402 233 181 38.4 19.1 24.1 4.4 24.1
FY22E 1,581 275 216 45.9 16.0 25.1 3.7 25.1
FY23E 1,744 309 243 51.8 14.2 24.0 3.1 24.0
Source: Company, Axis Securities

Diwali Muhurat Picks
November 2020
40
Profit & Loss (Rs Cr)
Y/E Mar FY20 FY21E FY22E FY23E
Total Net Sales 1,120 1,402 1,581 1,744
Total Raw material Consumption 712 876 973 1,069
Staff costs 105 126 150 166
Other Expenditure 129 167 183 201
Total Expenditure 234 293 334 366
EBITDA 174 233 275 309
EBITDA Margin % 19.1 33.8 18.2 12.2
Depreciation 16 19 20 21
EBIT 158 213 255 288
EBIT Margin % 14.1 15.2 16.2 16.5
Interest 2 2 2 2
Other Income 25 30 35 40
PBT 181 241 288 326
Tax 39 61 73 82
APAT 142 181 216 243
Source: Company, Axis Research
Balance Sheet (Rs Cr)
Y/E Mar FY20 FY21E FY22E FY23E
Share Capital 10 10 10 10
Reserves & Surplus 701 778 920 1,090
Net Worth 710 787 929 1,099
Total Borrowings 8 10 10 12
Deferred Tax Liability 5 5 5 5
Long Term Provisions 6 6 6 6
Other Long-Term Liability 16 20 25 30
Capital Employed 745 828 975 1,152
Gross Block 167 179 190 204
Less: Depreciation 51 70 89 110
Net Block 115 109 101 94
Other Non-Current Assets 151 164 178 195
Investments 60 50 90 120
Sundry Debtors 242 307 342 378
Cash & Bank Bal 26 13 68 147
Loans & Advances 33 31 50 60
Inventory 250 319 351 379
Other Current Assets 57 59 73 95
Total Current Assets 668 779 975 1,179
Curr Liab & Prov 189 224 278 315
Net Current Assets 479 555 696 863
Total Assets 745 828 975 1,152
Source: Company, Axis Research

Diwali Muhurat Picks
November 2020
41
Cash Flow (Rs Cr)
Y/E Mar FY20 FY21E FY22E FY23E
PBT 181 241 288 326
Depreciation & Amortization 16 19 20 21
Chg in Working cap 16 -39 -22 -37
Direct tax paid 36 61 73 82
Cash flow from operations 163 133 181 190
Chg in Gross Block -11 -12 -11 -13
Chg in Investments -24 -68 -83 -72
Proceeds on redemption of Fin. Assets
14 30 35 40
Cash flow from investing -44 -50 -59 -45
Proceeds / (Repayment) of Short Term Borrowings (Net)
-14 6 5 7
Proceeds from issue of Equity Instruments of the company
-100
Loans -5
Finance Cost paid -2 -2 -2 -2
Dividends paid -72 -70 -70
Cash flow from financing -93 -96 -67 -65
Chg in cash 25 -13 55 79
Cash at start 1 26 13 68
Cash at end 26 13 68 147
Source: Company, Axis Research
Ratio Analysis (%) Key Ratios FY20 FY21E FY22E FY23E
Growth (%)
Net Sales 11.4 25.2 12.8 10.3
EBITDA 19.1 33.8 18.2 12.2
APAT 26.1 27.2 19.5 12.9
Per Share Data (Rs.)
Adj. EPS 29.8 38.4 45.9 51.8
BVPS 149 168 198 234
DPS
Profitability (%)
EBITDA Margin 15.5 16.6 17.4 17.7
Adj. PAT Margin 12.7 12.9 13.6 14.0
ROCE 22.3 27.4 28.6 27.3
ROE 21.0 24.1 25.1 24.0
ROIC
Valuations (X)
PER 12.9 19.1 16 14.2
P/BV 2.6 4.4 3.7 3.1
EV / EBITDA 10.1 14.6 12.0 10.4
EV / Net Sales 1.6 2.4 2.1 1.8
Turnover Days
Asset Turnover 7.3 8.8 9.2 9.5
Inventory days 81 83 81 79
Debtors days 79 80 79 79
Creditors days 58 55 58 57
Working Capital Days 102 108 102 101
Gearing Ratio
Total Debt:Equity (x)
Source: Company, Axis Research

Diwali Muhurat Picks
November 2020
42
Disclosures:
The following Disclosures are being made in compliance with the SEBI Research Analyst Regulations 2014 (herein after referred to as the Regulations).
1. Axis Securities Ltd. (ASL) is a SEBI Registered Research Analyst having registration no. INH000000297. ASL, the Research Entity (RE) as defined in the Regulations, is engaged in the business of providing Stock broking services, Depository participant services &
distribution of various financial products. ASL is a subsidiary company of Axis Bank Ltd. Axis Bank Ltd. is a listed public company and one of India‟s largest priva te sector bank and has its various subsidiaries engaged in businesses of Asset management, NBFC,
Merchant Banking, Trusteeship, Venture Capital, Stock Broking, the details in respect of which are available on www.axisbank.com.
2. ASL is registered with the Securities & Exchange Board of India (SEBI) for its stock broking & Depository participant business activities and with the Association of Mutual Funds of India (AMFI) for distribution of financial products and also registered with IRDA as a
corporate agent for insurance business activity.
3. ASL has no material adverse disciplinary history as on the date of publication of this report.
4. I/We, authors (Research team) and the name/s subscribed to this report, hereby certify that all of the views expressed in this research report accurately reflect my/our views about the subject issuer(s) or securities. I/We (Research Analyst) also certify that no part of
my/our compensation was, is, or will be directly or indirectly related to the specific recommendation(s) or view(s) in this report. I/we or my/our relative or ASL or its Associate does not have any financial interest in the subject company. Also I/we or my/our relative or
ASL or its Associates may have beneficial ownership of 1% or more in the subject company at the end of the month immediately preceding the date of publication of the Research Report. Since associates of ASL are engaged in various financial service businesses,
they might have financial interests or beneficial ownership in various companies including the subject company/companies mentioned in this report. I/we or my/our relative or ASL or its associate does not have any material conflict of interest. I/we have not served as
director / officer, etc. in the subject company in the last 12-month period.
Sr. No Name Designation E-mail 1 Naveen Kulkarni Chief Investment Officer [email protected] 2 Pankaj Bobade Research Analyst – (Research Head) [email protected] 3 Neeraj Chadawar Quantitative Head [email protected] 4 Suvarna Joshi Research Analyst [email protected] 5 Siji Philip Research Analyst [email protected] 6 Omkar Tanksale Research Analyst [email protected] 7 Uttamkumar Srimal Research Analyst [email protected] 8 Gaurav Uttrani Research Analyst [email protected] 9 Dnyanada Vaidya Research Analyst [email protected] 10 Hiren Trivedi Research Associate [email protected] 11 Darshan Gangar Research Associate [email protected] 12 Tanvi Shetty Research Associate [email protected]
5. ASL or its Associates has not received any compensation from the subject company in the past twelve months. I/We or ASL or its Associate has not been engaged in market making activity for the subject company.
6. In the last 12-month period ending on the last day of the month immediately preceding the date of publication of this research report, ASL or any of its associates may have:
i. Received compensation for investment banking, merchant banking or stock broking services or for any other services from the subject company of this research report and / or;
ii. Managed or co-managed public offering of the securities from the subject company of this research report and / or;
iii. Received compensation for products or services other than investment banking, merchant banking or stock broking services from the subject company of this research report;
7. ASL or any of its associates have not received compensation or other benefits from the subject company of this research report or any other third-party in connection with this report.
Term& Conditions:
This report has been prepared by ASL and is meant for sole use by the recipient and not for circulation. The report and information contained herein is strictly confidential and may not be altered in any way, transmitted to, copied or distributed, in part or in whole, to any
other person or to the media or reproduced in any form, without prior written consent of ASL. The report is based on the facts, figures and information that are considered true, correct, reliable and accurate. The intent of this report is not recommendatory in nature. The
information is obtained from publicly available media or other sources believed to be reliable. Such information has not been independently verified and no guaranty, representation of warranty, express or implied, is made as to its accuracy, completeness or correctness. All
such information and opinions are subject to change without notice. The report is prepared solely for informational purpose and does not constitute an offer document or solicitation of offer to buy or sell or subscribe for securities or other financial instruments for the clients.
Though disseminated to all the customers simultaneously, not all customers may receive this report at the same time. ASL will not treat recipients as customers by virtue of their receiving this report.

Diwali Muhurat Picks
November 2020
43
Disclaimer:
Nothing in this report constitutes investment, legal, accounting and tax advice or a representation that any investment or strategy is suitable or appropriate to the recipient‟s specific circumstances. The securities and
strategies discussed and opinions expressed, if any, in this report may not be suitable for all investors, who must make their own investment decisions, based on their own investment objectives, financial positions and
needs of specific recipient.
This report may not be taken in substitution for the exercise of independent judgment by any recipient. Each recipient of this report should make such investigations as it deems necessary to arrive at an independent
evaluation of an investment in the securities of companies referred to in this report (including the merits and risks involved), and should consult its own advisors to determine the merits and risks of such an investment.
Certain transactions, including those involving futures, options and other derivatives as well as non-investment grade securities involve substantial risk and are not suitable for all investors. ASL, its directors, analysts or
employees do not take any responsibility, financial or otherwise, of the losses or the damages sustained due to the investments made or any action taken on basis of this report, including but not restricted to, fluctuation in
the prices of shares and bonds, changes in the currency rates, diminution in the NAVs, reduction in the dividend or income, etc. Past performance is not necessarily a guide to future performance. Investors are advice
necessarily a guide to future performance. Investors are advised to see Risk Disclosure Document to understand the risks associated before investing in the securities markets. Actual results may differ materially from those
set forth in projections. Forward-looking statements are not predictions and may be subject to change without notice.
ASL and its affiliated companies, their directors and employees may; (a) from time to time, have long or short position(s) in, and buy or sell the securities of the company(ies) mentioned herein or (b) be engaged in any other
transaction involving such securities or earn brokerage or other compensation or act as a market maker in the financial instruments of the company(ies) discussed herein or act as an advisor or investment banker,
lender/borrower to such company(ies) or may have any other potential conflict of interests with respect to any recommendation and other related information and opinions. Each of these entities functions as a separate,
distinct and independent of each other. The recipient should take this into account before interpreting this document.
ASL and / or its affiliates do and seek to do business including investment banking with companies covered in its research reports. As a result, the recipients of this report should be aware that ASL may have a potential
conflict of interest that may affect the objectivity of this report. Compensation of Research Analysts is not based on any specific merchant banking, investment banking or brokerage service transactions. ASL may have
issued other reports that are inconsistent with and reach different conclusion from the information presented in this report. The Research reports are also available & published on AxisDirect website.
Neither this report nor any copy of it may be taken or transmitted into the United State (to U.S. Persons), Canada, or Japan or distributed, directly or indirectly, in the United States or Canada or distributed or redistributed in
Japan or to any resident thereof. If this report is inadvertently sent or has reached any individual in such country, especially, USA, the same may be ignored and brought to the attention of the sender. This report is not
directed or intended for distribution to, or use by, any person or entity who is a citizen or resident of or located in any locality, state, country or other jurisdiction, where such distribution, publication, availability or use would
be contrary to law, regulation or which would subject ASL to any registration or licensing requirement within such jurisdiction. The securities described herein may or may not be eligible for sale in all jurisdictions or to
certain category of investors.
The Disclosures of Interest Statement incorporated in this document is provided solely to enhance the transparency and should not be treated as endorsement of the views expressed in the report. The Company reserves
the right to make modifications and alternations to this document as may be required from time to time without any prior notice. The views expressed are those of the analyst(s) and the Company may or may not subscribe
to all the views expressed therein.
Copyright in this document vests with Axis Securities Limited.
Axis Securities Limited, Corporate office: Unit No. 2, Phoenix Market City, 15, LBS Road, Near Kamani Junction, Kurla (west), Mumbai-400070, Tel No. – 022-40508080/ 022-61480808, Regd. off.- Axis House, 8th Floor,
Wadia International Centre, PandurangBudhkarMarg, Worli, Mumbai – 400 025. Compliance Officer: AnandShaha, Email: [email protected], Tel No: 022-42671582.SEBI-Portfolio Manager Reg. No.
INP000000654