a cross-country study on the relationship between ... · pdf filea cross-country study on the...
TRANSCRIPT

A Cross-Country Study on the Relationship between Financial Development and Earnings Management
Masahiro Enomoto* Kobe University, Kobe, Japan
Fumihiko Kimura† Tohoku University, Sendai, Japan
Tomoyasu Yamaguchi‡ Tohoku Gakuin University, Sendai, Japan
November 2015
Acknowledgments The authors gratefully acknowledge the financial support from The Japan Securities Scholarship Foundation and Ishii Memorial Securities Research Foundation.
* Corresponding author Research Institute for Economics & Business Administration, Kobe University, 2-1 Rokkodaicho, Nada-ku, Kobe 657-8501, JAPAN. E-mail: [email protected]. Tel: +81-78-803-7031; fax: +81-78-803-7031. † Graduate School of Economics and Management, Tohoku University, 2-2-1 Katahira, Aoba-ku, Sendai 980-8576, JAPAN. E-mail: [email protected]. Tel: +81-22-217-6282; fax: +81-22-217-6282. ‡ Faculty of Business Administration, Tohoku Gakuin University, 1-3-1 Tsuchitoi, Aoba-ku, Sendai 980-8511, JAPAN. E-mail: [email protected]. Tel: +81-22-721-3471; fax: +81-22-721-3471.
A cross-country study on the relationship
between financial development and earnings management
Abstract
This paper investigates whether a country’s level of financial development influences its
earnings management in an international setting. It is likely that financial development
heightens the monitoring and scrutiny of accounting figures, because of strengthened laws and
regulations for investor protection and sophisticated market participants. Therefore, we first
hypothesize that both accrual-based and real earnings management decrease with greater
financial development. However, managers tend to apply real earnings management, instead of
accrual-based earnings management, under strict accounting standards, regulations, and close
scrutiny by auditors. Thus, we explore the alternative hypothesis that financial development
decreases accrual-based earnings management but increases real earnings management. We
examine the relationship between financial development and both types of earnings
management by using 54,178 observations in 37 countries from 2009 to 2012. The results show
that both types of earnings management are more restrained under higher levels of financial
development. We interpret these results as showing that (1) higher quality accounting
information is needed in countries with more developed financial systems, (2) financial
development disciplines managers and mitigates their incentives to manage earnings, and (3) a
link between financial development and accounting institutions in each country.
JEL Classification: M41
Keywords: Financial development, Accounting institutions, Accrual-based earnings
management, Real earnings management

1
1. INTRODUCTION
This paper investigates whether a country’s level of financial development influences its
earnings management. Beck and Levine (2002) define financial development as the degree to
which national financial systems assess firms, monitor managers, facilitate risk management,
and mobilize savings. Financial accounting is required to provide investors with useful
information on decision-making under the accounting system of each country and contribute
toward realizing a higher level of financial development.
However, it is not clear whether a high-quality accounting system is realized in countries
with higher levels of financial development. For instance, the United States, which has a highly
developed financial system, suffered the Enron and WorldCom scandal. In response to
accounting scandals such as these, the U.S. Congress established the Sarbanes Oxley Act, which
improved the transparency of firms and enabled stakeholders to obtain high-quality accounting
information. This move indicates how levels of financial development are associated with
advances in financial accounting systems. As such, it is of interest to investigate the relationship
between financial development and the quality of accounting information.
In this study, we focus on earnings management as a proxy for accounting information
quality. Earnings management is a crucial factor affecting accounting quality (see Dechow et al.,
2010), and can be divided into accrual-based earnings management (AEM) and real earnings
management (REM). AEM alters the accrual process to manage earnings. It leads to the reversal
of accruals in subsequent periods, but does not have a direct effect on cash flows. REM reflects
a firm’s real activities and manages earnings by changing the timing and/or structure of an
operating, investment, or financial decision. REM can reduce future cash flows via non-optimal
decisions, such as opportunistic reductions in R&D and advertising costs.
Cross-country research on earnings management has often considered investor protection

2
as one of the primary factors influencing earnings management. For example, Leuz et al. (2003)
show that earnings management is negatively associated with the quality of minority
shareholder rights. They use an anti-director rights index from La Porta et al. (1997) and a legal
enforcement index measured as the average score of three legal variables, as used by La Porta et
al. (1998). Although the legal aspects of investor protection are among the most important
factors in financial development (Beck et al., 2001), they do not capture all factors in financial
development. We adopt the index provided by the World Economic Forum (WEF) to assess the
extent of financial development. The WEF defines financial development as the factors, policies,
and institutions that lead to effective financial intermediation and markets, as well as deep and
broad access to capital and financial services (The World Economic Forum, 2012). The WEF
index consists of 121 comprehensive variables concerning financial development, and covers a
wider aspect of financial development than does prior research. Our financial development
scores consider the evaluation of laws and regulations and the economic impact of banking and
security market systems.
Financial development is likely to heighten the monitoring and scrutiny of accounting
figures because it involves strengthened laws and regulations for investor protection and
increases the number of sophisticated market participants. Here, financial development would
likely act to discipline managers, thereby reducing their involvement in earnings management.
We, therefore, hypothesize that both AEM and REM decrease with greater financial
development. However, managers tend to apply REM instead of AEM when they face stricter
accounting standards and related regulations. We thus hypothesize, alternatively, that while
AEM decreases REM increases in cases of increased financial development.
This paper examines the relationship between two types of earnings management and
financial development by using 54,178 observations in 37 countries from 2009 to 2012. Our

3
results show that managers are restrained from using both AEM and REM in countries with
higher financial development and, therefore, a country’s financial development raises the quality
of reported earnings. Our evidence is robust and involves the decomposition of financial
development scores, the exclusion of observations from the United States and Japan, and the
elimination of firm-years for 2009.
We extend the extant earnings management research by investigating the relationship
between financial development measures and two types of earnings management. Our financial
development score based on WEF as the institutional factor is more comprehensive than that in
other studies (e.g., Leuz et al., 2003 and Degeorge et al., 2013). The score includes economic
dimensions of financial systems as well as the quality of relevant laws and regulations, which is
the focus of La Porta et al. (1997; 1998). Moreover, we added the REM measures to capture
managers’ real activities that vary with the level of financial development at the international
level.
To the best of our knowledge, this is the first study stating that financial development
restrains both AEM and REM. The results indicate that, with higher levels of financial
development, financial reporting processes improve by reducing managerial intervention in the
accounting accrual process, and firm activities become more appropriate owing to a decline in
myopic behavior, such as a reduction in R&D costs.
The remainder of the paper is organized as follows. Section 2 reviews prior literature and
considers the relationship between earnings management and financial development. Section 3
presents the research design of the study. Section 4 describes the results of our econometric
analysis. Section 5 concludes the paper with an extensive discussion of suggestions for future
research.

4
2. PREVIOUS LITERATURE AND HYPOTHESES
2.1 Prior Literature Review
Bushman and Smith (2001, 305) state that there are powerful interactions between
financial accounting regimes and other institutional characteristics, including auditing regimes,
communication infrastructures, analyst followings, financial architectures, legal environments,
and human capital. Within a similar context, Leuz and Wysocki (2009) and Wysocki (2011)
describe “new institutional accounting research” which focuses on the links between accounting
institutions (such as accounting standards, disclosure systems, and audit) and non-accounting
institutions (such as legal systems, corporate governance mechanisms, and the enforcement of
laws governing investor protection). They point out that accounting institutions are key
economic institutions and that a link exists between accounting institutions and non-accounting
institutions.
In new institutional accounting research, cross-country research on earnings management
is one of the most important topics.1 Leuz et al. (2003) present comparative evidence on
corporate earnings management across 31 countries from 1990 to 1999, and show that earnings
management will decrease under strong legal protection. Using a sample of firms in 42
countries from 1994 to 2004, Francis and Wang (2008) found that earnings quality increases for
firms with Big 4 auditors in countries with stronger investor protection, whereas earnings
quality of firms with non-Big 4 auditors are largely unaffected by the levels of investor
protection regimes. Most cross-country research on earnings management has dealt with the
relationship between legal aspects relating to institutional factor and AEM. Degeorge et al.
(2013) shed more light on financial development as an institutional factor, and analyze the
relationship between analyst coverage, earnings management, and financial development in 1 Here, we describe cross-country research on earnings quality and persistence. In addition to the studies described in the body of our paper, cross-country research exists on the informativeness of earnings (Ball et al., 2000) and conservatism (Bushman and Piotroski, 2006).
5
specific countries. For a sample of firms from 21 countries from 1994 to 2002, they found that
increased analyst coverage is associated with less earnings management in countries with high
levels of financial development, while in countries with low levels of financial development,
analyst coverage is not associated with reductions in earnings management.
Meanwhile, Francis et al. (2011) show that REM is encouraged and AEM is discouraged
in countries with stronger legal environments using a sample of 38 countries from 1994 to 2009.
Enomoto et al. (2015) have examined the relationships between two types of earnings
management and investor protection, and found that outside investor rights are negatively
correlated with REM and positively correlated with AEM.
2.2 Hypothesis Development
Financial development is a crucial factor in economic growth and relates to the quality of
accounting information. However, except for a study by Degeorge et al. (2013), there are few
studies that discuss the relationship between financial development and earnings management.
We develop our hypothesis from the views of stakeholders, such as regulatory authorities,
auditors, and investors.
First, financial development generates a greater variety and number of stakeholders. To
balance the interests among them, regulatory authorities create relevant laws and regulations
that require the sophisticated accounting system. As a result, financial development enhances
the importance of the accounting system through pertaining law and regulation and improves
stakeholders’ general ability to process accounting information. Leuz et al. (2003, 506) explain
that “strong and well-enforced outsider rights limit insiders’ acquisition of private control
benefits and, consequently, mitigate insiders’ incentives to manage accounting earnings because
they have little to conceal from outsiders.” The mitigation of managers’ opportunistic incentives
may reduce overall managerial discretionary behaviors (AEM and REM). Following the
6
arguments and findings of Leuz et al. (2003), the strengthening of various kinds of laws and
regulations that result from the development of financial systems discipline managers and thus
mitigate managers’ incentives to engage in earnings management.2
Auditors play a key function in arranging financial development environments, and are
concerned with improving earnings quality. For example, Becker et al. (1998) and Francis et al.
(1999) have found that the degree of AEM among firms with Big 6 auditors tends to be lower
than among those with non-Big 6 auditors.
Moreover, in order to foster financial development, firms should provide investors and
debt holders with high-quality accounting information that allows them to make rational
decisions concerning investments. They are also likely to be concerned with a firm’s earnings
management. For example, Lambert et al. (2007) have demonstrated that accounting
information quality can affect the cost of capital. Investors tend to regard earnings management
as an undesirable behavior, and therefore, investors seek to detect earnings management, which
is reflected in the pricing. Francis et al. (2004) indicate that firms with low accruals quality have
higher equity cost, compared to firms with high accruals quality. In addition, Francis et al.
(2005) found that lower accruals quality is associated with larger costs of debt.
Meanwhile, sophisticated investors have both the incentive and ability to constrain a
manger’s REM, in order to avoid decreases in future cash flow.3 They can consider a firm’s
AEM and REM in making varied decisions pertaining to pricing of securities. Wongsunwai
(2013) and Kim and Sohn (2013) indicate that in the United States, sophisticated market
participants monitor managers’ value-destroying behaviors and effectively restrain managers
from engaging in REM and AEM. In more financially developed countries such as the United
States, stakeholders are typically more sophisticated than those in less developed countries, and
2 The financial development scores in this paper include many institutional factors (see sections 1 and 3.2). 3 Corporate governance mechanisms may also influence REM (see Cheng et al., 2012).

7
require higher-quality earnings from managers. As such, managers face stricter monitoring and
scrutiny in these countries,4 and are likely to be prevented from carrying out value-destroying
behaviors involving REM and AEM.
While the above explanation indicates that financial development suppresses managers’
incentives to manage earnings, owing to heightened monitoring and scrutiny abilities of
stakeholders, financial development also has a curbing effect on earnings management via
accounting standards and audit standards. For instance, new accounting standards that narrow a
manager’s discretion in achieving a target income can result in greater constraints on the
manipulation of accruals (i.e., AEM). It is thus more likely that countries with high levels of
financial development will have higher quality, and likely tighter, standards resulting from
stakeholder demands. Managers, therefore, face more difficulty in implementing AEM in
countries with greater financial development.5
Based on the above discussion, we hypothesize that earnings management, including both
AEM and REM, reduces with higher levels of financial development because managers tend to
be disciplined in such cases. Given this, we propose the following hypothesis:
Ha. Both AEM and REM decrease with higher levels of financial development.
Since the growing use of accounting information that results from financial development
produces greater private benefits for managers engaging in earnings management, managers
may continue to have sufficient incentives to carry out earnings management. We assume that
financial development heightens the monitoring and scrutiny of accounting figures and that
AEM is less (more) prevalent under conditions of high (low) financial development. This is why
4 To put it another way, financial development heightens the costs imposed on managers through the detection of earnings management, depending on the level of sophistication of stakeholders. 5 If managers’ incentives to manage earnings do not change, a substitution effect may occur between AEM and REM (see. Ewert and Wagenhofer, 2005). However, because the revision of accounting standards may influence real activities (e.g., stricter revenue recognition reduces sales manipulation), and we assume that incentives are reduced with financial development, the effect of changes in accounting institutions on REM is unclear. The substitution effect is discussed in more detail in section 2.2.3.
8
AEM becomes more costly than REM when it is revealed. When the incentives to manage
earnings are not weakened and only AEM is restrained, managers are more likely to engage in
REM.
Many studies deal with this substitution between AEM and REM. Some have found that
when stricter accounting standards and other regulations become effective, managers tend to
apply REM instead of AEM (Ewert and Wagenhofer, 2005; Cohen et al., 2008), and that
higher-quality audit conditions lead to similar results (Chi et al., 2011). Compared to investors,
it is more difficult for regulatory authorities and auditors to interfere in a firm’s real activities
because they are independent of the firm. Many studies have pointed out that managers tend to
employ REM rather than AEM to achieve target income, since AEM is more likely to face the
scrutiny of auditors, regulators, and other parties (Graham et al., 2005). Kothari et al. (2012)
state that REM is easier to camouflage as a normal activity when compared to AEM. Further,
they argue that discretion relating to operating and investment activities is inherently provided
to managers by shareholders. Based on interviews with executives, Graham et al. (2005) have
presented evidence that suggests that managers prefer REM to AEM because they fear
overzealous regulators. Prior research argues that managers may also prefer REM because they
hope to avoid the scrutiny and oversight of stakeholders, in spite of the higher future costs that
their firms may incur.
Therefore, if the substitution effect between the two types of earnings management occurs
and has a dominant effect on REM, despite monitoring constraints and scrutiny in countries
with high levels of financial development, AEM (REM) will be less (more) prevalent in
countries with higher levels of financial development. As such, we propose the following
hypothesis:
Hb. AEM decreases, but REM increases with higher levels of financial development.

9
3. RESEARCH DESIGN
3.1 Earnings Management Measures
3.1.1 Accrual-Based Earnings Management Measure
Following previous research (e.g., Warfield et al., 1995; Becker et al., 1998; Cohen et al.,
2008), we use the absolute value of abnormal accruals as an AEM measure in order to capture
both the effects of income-increasing and income-decreasing AEM. To measure abnormal
accruals, we use the cross-sectional modified Jones (1991) model (see Dechow et al., 1995).
Specifically, we estimate the following regression model for each industry-year combination in
each country, where industry is identified by a two-digit SIC code.
ACCijt / Aijt-1 = β0 + β1 (1 / Aijt-1) + β1 ((ΔSijt - ΔARijt) / Aijt -1) + β3 (PPEijt / Aijt -1) + εijt (1)
ACC is accruals that are calculated by net income minus operating cash flow reported in
the statement of cash flow; A is total assets; ΔS is the change in net sales; ΔAR is the change in
accounts receivable; PPE is net property, plant, and equipment; the subscripts refer to firm i,
country j, and time t. Abnormal accruals are calculated as the estimated residuals from equation
(1), and its absolute value is our proxy for AEM (|A_ACC|).
3.1.2 Real Earnings Management Measures
Following Roychowdhury (2006), Cohen et al. (2008), and Cohen and Zarowin (2010), we
developed a proxy for three methods of REM: (1) sales manipulation, (2) reduction of
discretionary expenses, and (3) overproduction.According to Roychowdhury (2006), sales
manipulation and overproduction lead to abnormally high production costs relative to sales, and
abnormally low cash flow from operating activities relative to sales, while the reduction of
10
discretionary expenditures leads to abnormally low discretionary expenses.6
To measure an abnormal level of CFO (A_CFO), discretionary expenses (A_DE), and
production costs (A_PD), we estimate the following regression models. Similar to equation (1),
the regression models are estimated for each industry-year combination in each country, where
industry is identified by a two-digit SIC code.
CFOijt / Aijt-1 = β0 + β1 (1 / Aijt-1) + β2 (Sijt / Aijt-1) + β3 (ΔSijt / Aijt-1) + εijt (2)
DEijt / Aijt-1 = β0 + β1 (1 / Aijt-1) + β2 (Sijt-1 / Aijt-1) + εijt (3)
PDijt / Aijt-1 = β0 + β1 (1 / Aijt-1) + β2 (Sijt / Aijt-1) + β3 (ΔSijt / Aijt-1) + β4 (ΔSijt-1 / Aijt-1) + εijt (4)
CFO represents the operating cash flow reported in the statement of cash flow; DE
represents the selling, general, and administrative expenses; PD represents production costs and
is calculated as the cost of goods sold plus change in inventory; and S represents net sales.7
A_CFO, A_DE, and A_PD are calculated as the estimated residuals from equations (2), (3), and
(4), respectively.
Since three types of REM described above might be implemented to decrease earnings,
consistent with Francis et al. (2011) and Kim and Sohn (2013), we convert A_CFO, A_DE, and
A_PD to absolute values and use them as our REM proxies (|A_CFO|, |A_DE|, and |A_PD|,
respectively).8 In addition, we combine these three measures to capture the total effect of REM.
Consistent with Cohen and Zarowin (2010), we multiply A_CFO and A_DE by negative one,
and add them to A_PD in order that higher values indicate greater income-increasing earnings 6 If the firm paid for discretionary expenses in cash, reduction of discretionary expenses could also lead to abnormally high cash flow (Roychowdhury, 2006; Cohen and Zarowin, 2008). 7 Following Bartov and Cohen (2009) and Gunny (2010), we use selling, general, and administrative expenses as discretionary expenses because they frequently include discretionary expenses such as R&D and advertising costs. 8 For example, Francis et al. (2011) point out the possibility of income-decreasing real earnings management from an income-smoothing perspective. When a firm’s performance is good in the current period, managers may choose to spend more on R&D, advertising, employee training, etc. These activities have an income-decreasing effect for the current year but an income-increasing effect for future periods (Francis et al., 2011, 9).

11
management. Again, considering the possibility of income-decreasing REM, we convert the
aggregated REM measure to absolute values and use it as our fourth REM proxy (|REM|).
3.2 Financial Development Measures
We adopted the financial development score used by the World Economic Forum. The reason
for this is that it takes a comprehensive view when assessing the factors that contribute to the
long-term development of financial systems (The World Economic Forum, 2012, xiii). It also
various factors that are used in prior cross-country research on financial accounting, such as
corporate governance, legal and regulatory issues, and contract enforcement. The World Economic
Forum has provided a score and rank for the breadth, depth, and efficiency of 62 of the world’s
financial systems and capital markets since 2008. The index analyzes drivers of financial system
development that support economic growth, and compares overall competitiveness of financial
systems (The World Economic Forum, 2012, xiii).
The World Economic Forum (2012, xiii) defines seven pillars as follows. (1) Institutional
environment, (2) Business environment, (3) Financial stability, (4) Banking financial services, (5)
Non-banking financial services, (6) Financial markets, and (7) Financial access.
Each pillar is scored from one to seven. The financial development score is the average of
the scores for all seven pillars. Since not all of the pillars are associated with financial
accounting (and resulting earnings management), we extracted scores from four of the seven
pillars (Institutional environment, Banking financial services, Non-banking financial services,
and Financial markets) as factors most closely related to financial accounting. In our study,
these four pillars include much broader factors than institutional factors in prior research.
First, Institutional environment not only involves the index of minority shareholders’
interests, legal enforcement, and corporate governance, which is measured in La Porta et al.

12
(1998) and Leuz et al. (2003), but also financial sector liberalization, regulation of securities
exchanges, and the ethical behavior of firms. Financial accounting is essential for all of these to
work efficiently. Next, Banking financial services reflect efficiency and financial information
disclosure as well as the extent of banking services, such as the ratio of the sum of bank debt of
the private sector and outstanding nonfinancial bonds to GNP (La Porta et al., 1997) and the
ratio of GDP to claims from the banking sector on the private sector (Beck and Levine, 2002).
Non-banking financial services consist of the extent of M&A activities and the size of initial
public offerings (e.g. La Porta et al. (1997 and 1998) employ the ratio of equity issued by
newly-listed firms to population or GDP). Lastly, Financial market pillar includes the level of
bond market development in addition to the size of the stock market, which is represented by
the ratio of domestic firms listed in a given country to its population (La Porta et al., 1997), the
value of listed shares divided by GDP, and the value of stock transactions as a share of national
output (Beck and Levine, 2002).
It is evident that these four pillars can be used to assess accounting information and
smooth transactions among firms and stakeholders. A large number of studies have looked at
earnings management in these areas, we therefore focus on the four pillars in the main analysis
that follows, and our financial development score (FD) is the average of these.9 Unlike the four
pillars, (2) Business environment, (3) Financial stability, and (7) Financial access can be
considered to have an indirect link to financial accounting. It is, therefore, eliminated from our
financial development score.
3.3 Models for Hypothesis Tests
To examine the relationship between financial development and earnings management,
9 In the robustness checks in section 4.3, we test using original financial development scores.

13
we estimate the following regression model.
EMijt = β0 + β1 FDjt + β2 Leverageijt-1 + β3 Sizeijt-1 + β4 MTBijt-1 + β5 ROAijt + β6 NOAijt-1
+ Σ β Year_Fixed_Effect + Σ β Firm_Fixed_Effect + εijt (5)
EM represents earnings management proxies, that are, either |A_ACC|, |A_CFO|, |A_DE|,
|A_PD| or |REM|; FD is the mean value of the four pillars (Institutional environment, Banking
financial Services, Non-banking financial services, and Financial markets) in the financial
development report of the World Economic Forum; Leverage is total debt divided by total
assets; Size is the natural logarithm of the market value of equity; MTB is the market to book
ratio; ROA is net income divided by lagged total assets; NOA is net operating assets divided by
sales.10
When the dependent variable is the proxy for AEM (i.e., |A_ACC|), we predict that the
coefficient of FD will have a negative sign. On the other hand, when the dependent variable is
the proxy for REM (i.e., |A_CFO|, |A_DE|, |A_PD|, or |REM|), the sign of the coefficient of FD
should be negative (positive) if REM decreases (increases) in countries with higher levels of
financial development. In addition to FD, other variables are included to control for other
factors that are likely to affect earnings management proxies. Leverage is included because
previous research finds that it is related to earnings management measures (e.g., DeFond and
Jiambalvo, 1994; Becker et al., 1998; Roychowdhury, 2006). Following Roychowdhury (2006)
and Gunny (2010), we include SIZE, MTB, and ROA. SIZE and MTB are included to control for
size effects and growth opportunity, respectively. ROA is added to control for firm performance.
Following Barton and Simko (2002) and Zang (2012), we include NOA as a proxy for the extent
of AEM in previous periods. Due to limited flexibility within GAAP and the reversal of accruals,
AEM in previous periods affects managers’ ability to manipulate accruals, with a consequent
impact on REM (Zang, 2012). Finally, in accordance with approaches taken by Degeorge et al. 10 Following Roychowdhury (2006), we use the values at the beginning of the year for Size and MTB, and use the values at the end of the year for ROA.
14
(2013), Year_Fixed_Effect and Firm_Fixed_Effect are also included in our regression to control
for industry effects and year effects.
3.4 Sample Selection
Financial development and relevant data, from 2009 to 2012, are obtained from Global
Note.11 The sample period is chosen because the Financial Development Score (FD), by the
World Economic Forum, is available in Global Note from 2009. The countries in this paper are
based on the 49 in La Porta et al. (1998). Ecuador, New Zealand, Taiwan, Uruguay, Sri Lanka,
and Zimbabwe are dropped, as their FD scores are not included in the report of the World
Economic Forum. Zimbabwe is also eliminated due to hyperinflation in the sample period.12
The sample comprises data from Capital IQ, from which we obtained 81,317 pieces of
firm-years data, covering sales and total assets of over 1 million dollars. Next, the data for
financial services firms (2,108 firm-years) are eliminated. To calculate earnings management
measures, we require at least six firm-year observations for each industry-year combination in
each country (13,825 firm-years are excluded). To provide the condition and availability of the
relevant measures that we need, Austria, Colombia, Egypt, Kenya, Portugal, and Venezuela
(8,326 firm-years) are not included in our sample. Using this sample selection process, we
obtained 54,178 observations from 37 countries.
4. EMPIRICAL RESULTS
4.1 Descriptive Statistics
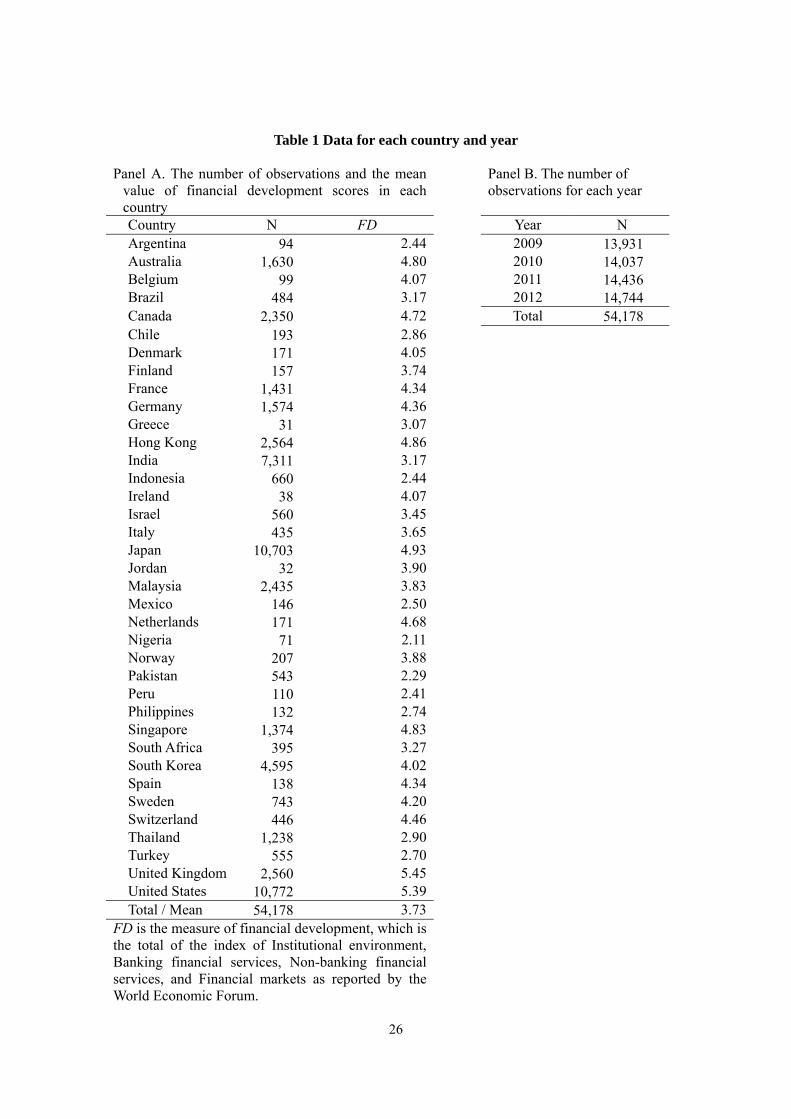
Panel A of Table 1 shows the number of firm-years in 37 countries and the mean value
of FD. The country with the highest number of firm-years is the United States (10,772
observations, 19.8%) while Japan is a close second. Observations for the United States and
11 Global Note is a website that collects and provides various kinds of international statistics such as Gross Domestic Product. URL: http://www.globalnote.jp/ (in Japanese). 12 We define hyperinflation as over 100% per year.

15
Japan occupy approximately 40% of total observations. The country with the lowest number of
firm-years is Greece (31 observations). The third column of Panel A reports the mean values of
the financial development scores (FD). FD is the mean value of the four pillars (Institutional
environment, Banking financial services, Non-banking financial services, and Financial
markets). The United Kingdom has the highest score, at 5.45, of the 37 countries, while the
United States has the second highest (5.39). The lowest score is 2.11, for Nigeria. Only the
United Kingdom and the United States have scores exceeding five.13 These ranking results are
similar to those of Beck and Levine (2002) and Degeorge et al. (2013). Panel B presents the
number of firm-years in the sample period.
[Insert Table 1 here]
Table 2 shows the descriptive statistics for the dependent and independent variables in
equation (5). The mean values of |A_ACC|, |A_CFO|, |A_DE|, |A_PD|, and |REM| are 6.95%,
7.58%, 9.81%, 11.83%, and 22.74%, respectively. These values are slightly larger than Francis,
et al. (2011) and smaller than Kim and Sohn (2013).14
[Insert Table 2 here]
Table 3 is the correlation matrix. Since a high correlation coefficient is not observed, the
results in the regressions from this section will not be influenced by multicollinearity. FD
negatively associates with |A_ACC|, but positively correlates with |A_CFO|, |A_DE|, |A_PD|,
and |REM|.
[Insert Table 3 here]
13 Original financial development scores range from the lowest value of 2.51 for Nigeria to the highest value of 5.17 for the United States, and show the same trends as our financial development score (FD). 14 These studies used the absolute value of abnormal accrual and three REM measures. The former uses international data and the latter uses the United States data.

16
4.2 Regression Results
Table 4 reveals evidence of the influence of financial development on managerial
behavior.15 Five types of dependent variables are provided in the analyses. Column (1) in Table
4 displays the regression results of |A_ACC|. The coefficient of FD is significantly negative.
This supports our prediction that AEM is restrained in countries with high financial
development. When regarding financial development as an institutional factor, this result is
consistent with Leuz et al. (2003). Financial development serves as an institutional factor that
inclines managers to avoid accrual-based discretionary behaviors to manage earnings.16
[Insert Table 4 here]
In the regression where the dependent variable is |A_CFO| (column (2) of Table 4), FD
also has a significant negative coefficient. When the dependent variables are |A_DE|, |A_PD|,
and |REM| (columns (3), (4), and (5) respectively), the coefficients of FD are also significantly
negative. There results indicate that financial development leads to REM falling to similar levels
as those of AEM. In economies that are relatively more financially developed, managers reduce
noise in earnings and avoid decreases in future revenues caused by earnings management,
fearing that stakeholders would detect these behaviors.
Taken together, the results suggest that because financial development leads stakeholders
to focus on accounting numbers, managers are likely to be able to avoid the costs resulting from
earnings management. These include the scrutiny of auditors and regulators, litigation, declines
in future sales, and increasing costs of capital. The evidence from this study supports our
hypothesis (Ha) that both types of earnings management are restrained during higher levels of
financial development (Wongsunwai, 2013). This is not consistent with prior research that
15 We winsorize all dependent and independent variables at the 1st and 99th percentiles. 16 Another reason for the small |abACC| of financially developed countries is that it is possible that financial development affects accounting institutions. For example, stakeholders pursuing high accounting quality require tighter accounting standards in these countries.

17
shows that substitution occurs between AEM and REM (e.g., Francis et al., 2011). Financial
development disciplines managers and limits their incentives to engage in earnings
management.
4.3 Additional Tests
FD is designed to capture financial development that affects accounting information.
Therefore, FD is composed of Institutional environment, Banking financial Services,
Non-banking financial services, and Financial markets that are extracted as factors closely
relating to earnings quality in the original financial development score. However, the original
financial development score has a further three components, in addition to the four mentioned
above. These are Business environment, Financial stability, and Financial access. Hence, we
provide two additional tests.
One is the replacement of FD and the other is the decomposition of it. First, FD is
extended to include the three components. We replace FD with the original financial
development score, Original_FD, and re-estimate equation (5). The coefficient of Original_FD
in all regressions are significantly negative (not tabulated) and support the results of Table 4.
Next, FD is the simple mean value of four components selected from the seven indicators
of the financial development score. We are concerned with whether FD faithfully represents true
financial development by adding the four separate components equally.17 Hence, FD is divided
into four components, namely, Institutional_Environment, Banking_Financial_Services,
Non-banking_ Financial_Services, and Financial_Markets. The decomposition of FD makes it
possible to evaluate the effect of each component on earnings management independently.
Equation (6) includes each component of FD in the place of FD in equation (5).
17 Original financial development score by the World Economic Forum is also the simple mean value of seven components.

18
EMijt = β0 + β1 Institutional_Environmentjt + β2 Banking_Financial_Servicesjt
+ β3 Non-banking_Financial_Servicesjt + β4 Financial_Marketsjt + β5 Leverageijt-1
+ β6 Sizeijt-1 + β7 MTBijt-1 + β8 ROAijt + β9 NOAijt-1 + Σ β Year_Fixed_Effect
+ Σ β Firm_Fixed_Effect + εijt (6)
In column (1) of Table 5, we provide evidence of the effect of each financial development
component. Among them, Non-banking_Financial_Services are negatively associated with the
level of |A_ACC| and the absolute value of the coefficient is the largest. By comparison,
Financial_ Markets has a significant positive value, but does not have a large effect on |A_ACC|.
For the dependent variables of REM, we find that Institutional_Environment and
Financial_Markets negatively affect the REM variable. In particular, the significant negative
value of the coefficients of Institutional Environment are not consistent with Francis et al.
(2011).18
[Insert Table 5 here]
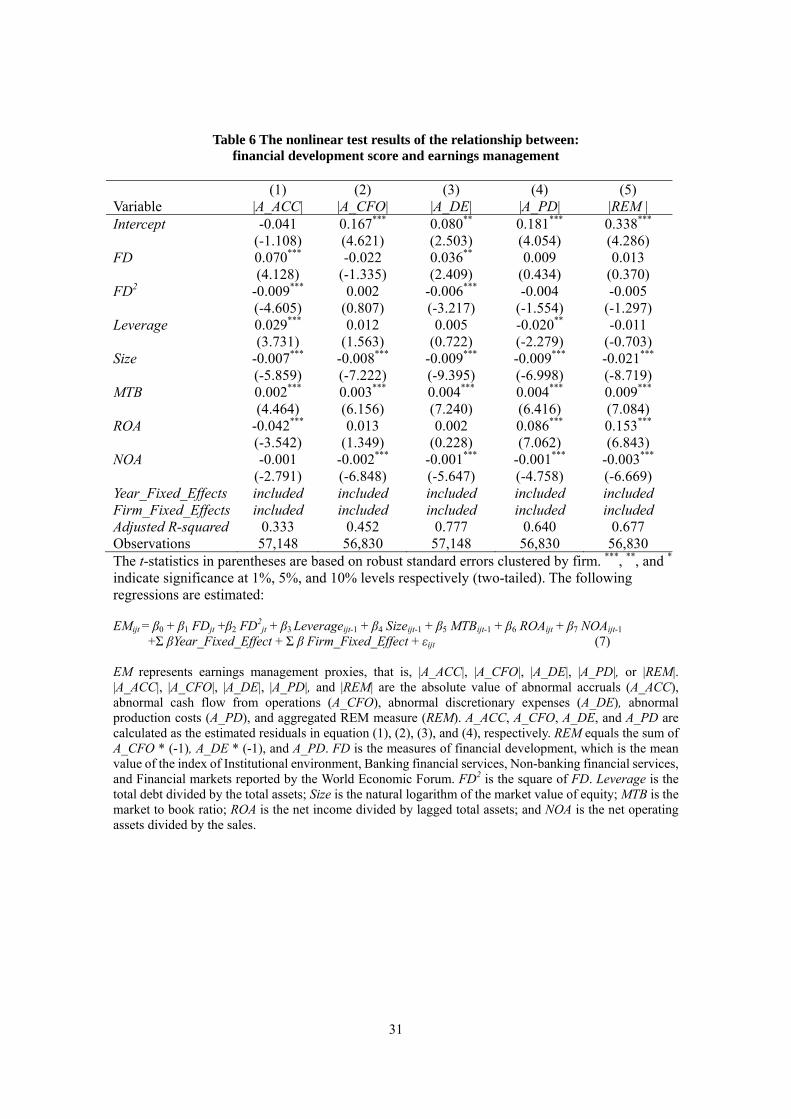
Next, we consider the nonlinear relationship between financial development and earnings
management. The growing use of accounting information in the developing stages of financial
development may precede the preparation of relevant regulations. In this case, the ability to
monitor and scrutinize by a stakeholder is relatively immature. Then, the incentives from
earnings management dominate the constraint. This constraint will dominate incentives in the
developed stage of financial development. To test this relationship, equation (7) adds FD2 in
equation (5). FD2 is the square of FD.
EMijt = β0 + β1 FDjt + β2 FD2jt
+ β3 Leverageijt-1 + β4 Sizeijt-1 + β5 MTBijt-1 + β6 ROAijt + β9 NOAijt-1 +
Σ β Year_Fixed_Effect + Σ β Firm_Fixed_Effect + εijt (7)
In table 6, all coefficients of FD are positive, and those of FD2 are negative. However, for
18 As described before, Institutional_Environment includes legal enforcement.
19
only |A_ACC| and |A_DE|, coefficients of FD and FD2 are significant with the inflection points
3.94 and 3.23, respectively. These results show that AEM is more prevalent until the FD score
reaches the average point of our sample (see table 1) and become less prevalent after that.
Results from REM tests are less conclusive.
[Insert Table 6 here]
4.4 Robustness Checks
For the first robustness test, we re-computed abnormal accruals using the cross-sectional
Jones (1991) model. The coefficient of FD in the regression of |A_ACC| is similar to that
observed before (not tabulated).
Next, we employ country-, industry-, and year-fixed effects in place of firm-fixed effects in
equation (5).
EMijt = β0 + β1 FDjt + β2 Leverageijt-1 + β3 Sizeijt-1
+ β4 MTBijt-1 + β5 ROAijt + β6 NOAijt-1+ Σ β Year_Fixed_Effect
+ Σ β Country_Fixed_Effect + Σ β Industry_Fixed_Effect + εijt (8)
While it is suitable that firm-fixed effects' terms are used to control time invariant factors,
some research includes country-, industry- and year-fixed effects. As shown in Table 7, the
coefficients of FD in all regressions remain significantly negative, which is consistent with
those of Table 4.
[Insert Table 7 here]
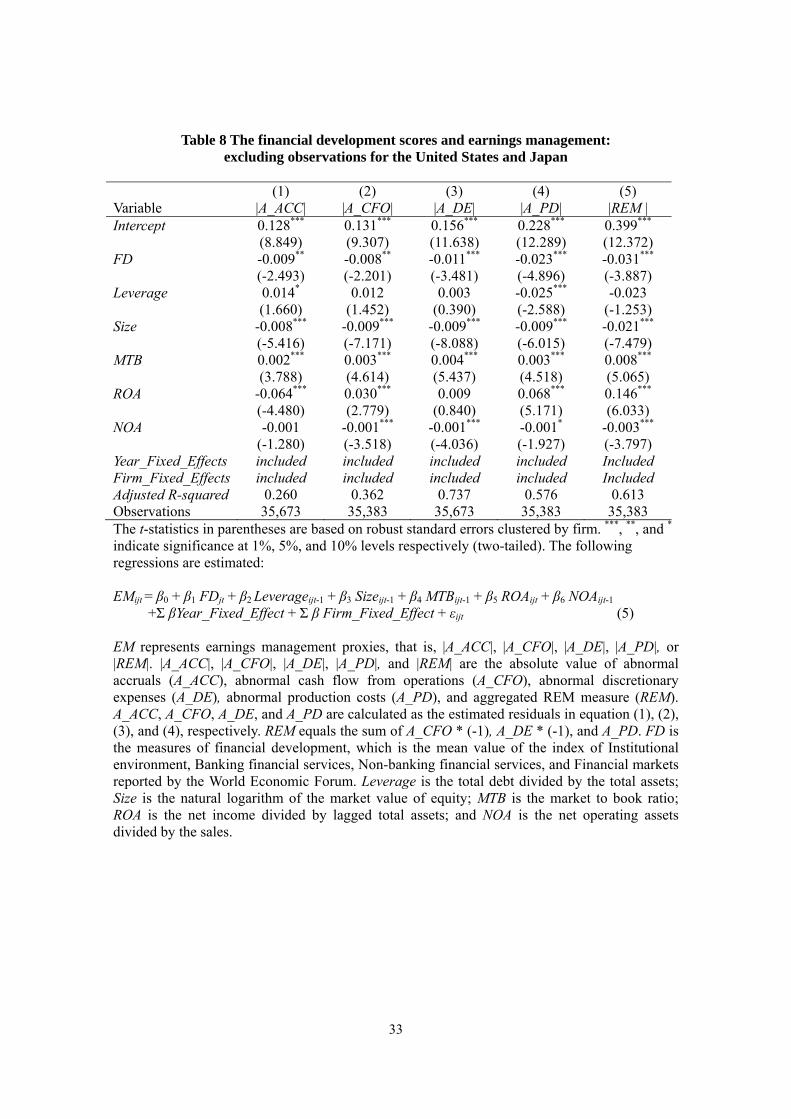
In addition, to test the robustness of our findings, we repeat the regressions in the samples,
excluding particular country and year. First, we delete all of the firm-years for the United States
and Japan and re-estimate the models in Table 4. Total observations for the United States and

20
Japan number 21,475 or 39.6 percent of our sample (see Table 1). It is, therefore, of concern that
the evidence in Table 3 is driven mainly by the data for these two countries. Table 8 displays the
estimated coefficients from the sample, excluding observations for the United States and Japan.
All of the coefficients of FD are negative and significant, and consistent with those of Table 4.
In addition, the results are robust even when we eliminate observations for either of these
countries.
[Insert Table 8 here]
Second, we deleted all 2009 data in the sample and re-estimated equation (5). This is
because our sample periods include data from periods of financial crisis around the world. The
results are shown in Table 9. The coefficient of FD for |A_ACC| remains significantly negative.
For REM, the coefficients of two of the three dependent variables, |A_DE| and |A_PD|, are
similar to Table 4. Thus, our findings are not heavily influenced by financial crises.
[Insert Table 9 here]
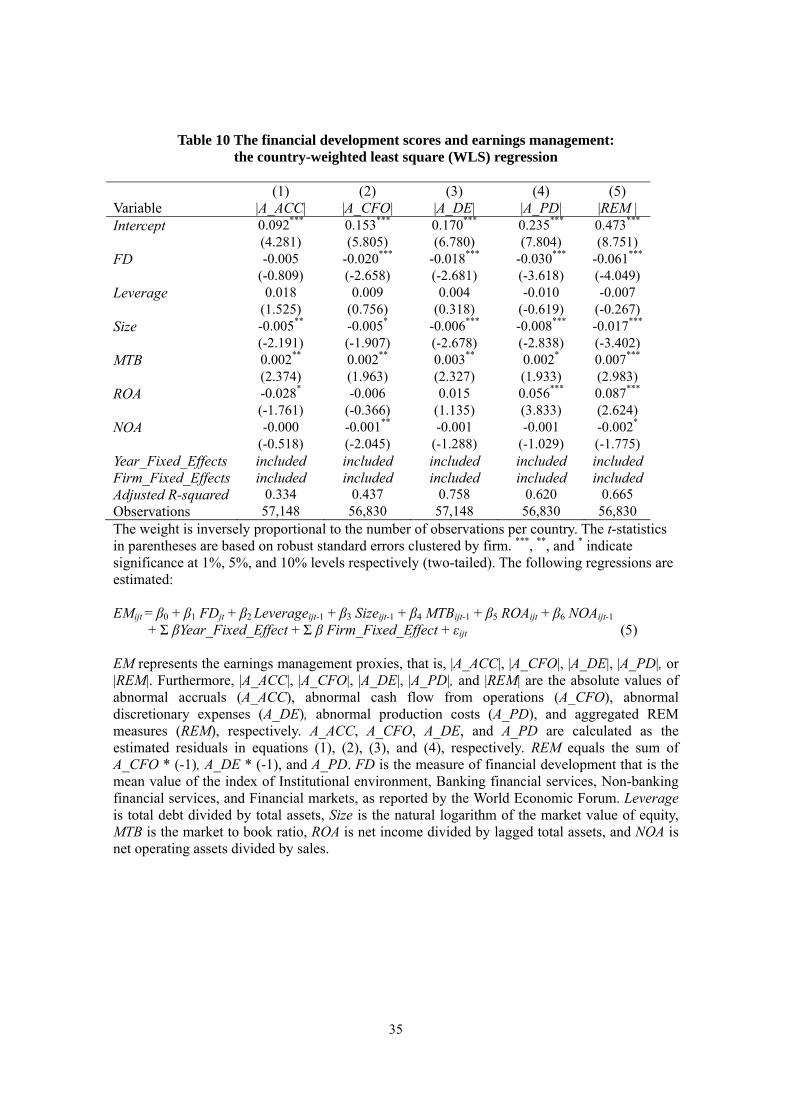
We conduct a country-weighted least square (WLS) regression as a robustness test to
address countries with a low number of observations. The weight of each observation is
inversely proportional to the number of observations per country. Using WLS ensures that
uneven country representation in the sample will not bias the results towards countries that are
more heavily represented (Hope et al. 2009, 191). As shown in Table 10, while the coefficient of
|A_ACC| is negative, but insignificant, the coefficients of four REM measures remain
significantly negative. Thus, the primary results of REM are robust to change, while the results
of AEM are influenced, to an extent, by the countries with a number of firm-years.
[Insert Table 10 here]
Finally, we conduct regressions in changes to control a factor that is related to financial
development as well as earnings management, but changes over time, and is therefore not

21
captured by the firm-fixed effects. The dependent and independent variables are the differences
from last year’s value in the regressions. From the regression, we can observe whether the
changes in FD are reducing the levels of earnings management. Table 11 shows that the
coefficient of |A_ACC| is negative, but insignificant, and the coefficients of four REM measures
remain significantly negative. Our results of AEM may, to some extent, suffer from unobserved
heterogeneity.
[Insert Table 11 here]
5. CONCLUSION
This paper has investigated whether levels of financial development in specific countries
affect managers’ earnings management, based on 54,178 observations from 37 countries over
the period from 2009 to 2012. With regard to earnings management methods, we focused on
both AEM and REM. We found that a negative relationship exists between countries’ levels of
financial development and both types of earnings management. Our results indicate that both
AEM and REM are constrained in countries with high levels of financial development. We
interpret these results as showing that (1) higher-quality accounting information is required in
countries with more developed financial systems, (2) financial development disciplines
managers and mitigates their incentives to engage in earnings management, and (3) there is a
link between financial development and accounting institutions in each of the countries.
Previous papers show that AEM is restrained in countries with high levels of investor
protection (Leuz et al., 2003), and that AEM and REM are used as substitutes for each other
according to the level of the legal system (Francis et al., 2011) and the level of outside investor
rights (Enomoto et al., 2015). Our paper contributes to earnings management literature by
showing that, at the international level, both AEM and REM are restrained in high levels of
financial development.
Given that AEM and REM are proxies for earnings quality, our results show that a
country’s financial development raises the quality of earnings of each firm in that country. In

22
other words, with higher levels of financial development, financial reporting processes improve
through the reduction of managerial intervention in the accounting accrual process, and
managers engage in more appropriate activities by avoiding myopic behaviors such as reduction
of R&D costs. Therefore, financial development enables investors and managers to make
efficient decisions, and leads to more efficient resource allocation.
We believe that future study is needed in the following areas. First, due to issues with data
availability, our sample period covers only four years, from 2009 to 2012. To secure more
reliable evidence, a test with a longer sample period is required. Second, in this study, we
estimated the test models for AEM and REM separately, even though previous research shows
that substitution of AEM and REM occurs. We recognize the desirability of a simultaneous
equation system approach for the two types of earnings management, and this remains an option
for future research. Third, we did not clarify the process of linkage between financial
development and accounting institutions. Wysocki (2011, 312) notes the “chicken and the egg”
problem of endogeneity and complementarily between accounting institutions and
non-accounting institutions and this problem may apply to the relationship between financial
development and accounting institutions. It is difficult to determine which of these comes first,
but it would be an interesting issue for further research.
REFERENCES
Ball, R., S. P. Kothari, and A. Robin (2000), ‘The effect of international institutional factors on properties of accounting earnings’, Journal of Accounting and Economics, Vol. 29, No. 1 (February), pp. 1-52.
Barton, J. and P. J. Simko (2002), ‘The balance sheet as an earnings management constraint’, The Accounting Review, Vol. 77, (Supplement), pp. 1-27.
Bartov, E. and D. A. Cohen (2009), ‘The “numbers game” in the pre-and post-Sarbanes-Oxley eras’, Journal of Accounting, Auditing and Finance, Vol. 24, No. 4 (October), pp. 505-534.
Beck, T., A. Demirgüç-Kunt, and R. Levine (2001), ‘Legal theories of financial development’, Oxford Review of Economic Policy, Vol. 17, No. 4 (Winter), pp. 483-501.
Beck, T. and R. Levine (2002), ‘Industry growth and capital allocation: Does having a market-

23
or bank-based system matter’, Journal of Financial Economics, Vol. 64, No. 2 (May), pp. 147-180.
Becker, C. L., M. L. DeFond., J. Jiambalvo, and K. R. Subramanyam (1998), ‘The effect of audit quality on earnings management’, Contemporary Accounting Research, Vol. 15, No. 1 (Spring), pp. 1-24.
Bushman, R. M. and A. J. Smith (2001), ‘Financial Accounting Information and Corporate Governance’, Journal of Accounting and Economics, Vol. 32, Nos. 1-3 (December), pp. 237-333.
Cheng, Q., J. Lee, and T. J. Shevlin. (2012), ‘Internal Governance and Real Earnings Management’, Singapore Management University School of Accountancy Research Paper, No. 5, Available at SSRN: http://ssrn.com/abstract=2162277.
Chi, W., L. L. Lisic, and M. Pevzner (2011), ‘Is Enhanced Audit Quality Associated with Greater Real Earnings Management?’, Accounting Horizons, Vol. 25, No. 2 (June), pp. 315-335.
Cohen, D. A., A. Dey, and T. Z. Lys (2008), ‘Real and Accrual-Based Earnings Management in the Pre-And Post-Sarbanes-Oxley Periods’, The Accounting Review, Vol. 83, No. 3 (May), pp. 757-787.
Cohen, D. A. and P. Zarowin (2010), ‘Accrual-Based and Real Earnings Management Activities around Seasoned Equity Offerings’, Journal of Accounting and Economics, Vol. 50, No. 1 (May), pp. 2-19.
Dechow, P. M., W. Ge, and C. Schrand (2010), ‘Understanding Earnings Quality: A Review of the Proxies, Their Determinants and their Consequences’, Journal of Accounting and Economics, Vol. 50, No. 2-3 (December), pp. 344-401.
Dechow, P. M., R. G. Sloan, and A. P. Sweeney (1995), ‘Detecting Earnings Management’, The Accounting Review, Vol. 70, No. 2 (April), pp. 193-225.
DeFond, M. L. and J. Jiambalvo (1994), ‘Debt Covenant Violation and Manipulation of Accruals’, Journal of Accounting and Economics, Vol. 17, No. 1-2 (January), pp. 145-176.
Degeorge F., Y. Ding, T. Jeanjean, and H. Stolowy (2013), ‘Analyst Coverage, Earnings Management and Financial Development: An International Study’, Journal of Accounting and Public Policy, Vol. 32, No. 1 (January/February), pp. 1-25.
Enomoto, M., F. Kimura, and T. Yamaguchi (2015) ‘Accrual Based and Real Earnings Management: An International Comparison for Investor Protection’, Journal of Contemporary Accounting and Economics, Vol. 11, No. 3 (December), In Progress.
Ewert, R. and A. Wagenhofer (2005), ‘Economic Effects of Tightening Accounting Standards to Restrict Earnings Management’, The Accounting Review, Vol. 80, No. 4 (October), pp.
24
1101-1124. Francis, B., I. Hasan, and L. Li (2011), A Cross-Country Study of Legal Environment and Real
Earnings Management. CAAA Annual Conference 2011, Available at SSRN: http://ssrn.com/abstract= 1740036.
Francis, J., R. LaFond, P. Olsson, and K. Schipper (2004), ‘Costs of Equity and Earnings Attributes’, The Accounting Review, Vol. 79, No. 4 (October), pp. 967-1010.
Francis, J., R. LaFond, P. Olsson, and K. Schipper (2005), ‘The Market Pricing of Accruals Quality’, Journal of Accounting and Economics, Vol. 39, No. 2 (June), pp. 295-327.
Francis, J. R., E. L. Maydew, and H. C. Sparks (1999), ‘The Role of Big 6 Auditors in the Credible Reporting of Accruals’, AUDITING: A Journal of Practice & Theory, Vol. 18, No. 2 (September), pp.17-34.
Francis, J. R. and D. Wang (2008), ‘The Joint Effect of Investor Protection and Big-4 Audits on Earnings Quality around the World’, Contemporary Accounting Research, Vol. 25, No. 1 (Spring), pp. 157-191.
Graham, J. R., C. R. Harvey, and S. Rajgopal (2005), ‘The Economic Implications of Corporate Financial Reporting', Journal of Accounting and Economics, Vol. 40, No. 1-3 (December), pp. 3-73.
Gunny, K. (2010), ‘The Relation Between Earnings Management Using Real Activities Manipulation and Future Performance: Evidence from Meeting Earnings Benchmarks’, Contemporary Accounting Research, Vol. 27, No. 3 (September), pp. 855-888.
Hope, Ole-Kristian, T. Kang, W. B. Thomas, and Y. K. Yoo (2009) ‘Impact of Excess Auditor Remuneration on the Cost of Equity Capital around the World’, Journal of Accounting, Auditing & Finance, Vol. 24, No. 2 (April), pp. 177-210.
Jones, J. (1991), ‘Earnings Management during Import Relief Investigations’, Journal of Accounting Research, Vol. 29, No. 2 (Autumn), pp. 193-228.
Kim, J. B. and B. C. Sohn (2013), ‘Real Earnings Management and Cost of Capital’, Journal of Accounting and Public Policy, Vol. 32, No. 6 (November/December), pp. 518-543.
Lambert, R., C. Leuz, C., and R. E. Verrecchia (2007), ‘Accounting Information, Disclosure, and the Cost of Capital’, Journal of Accounting Research, Vol. 45, No. 2 (May), pp. 385-420.
Kothari, S.P., N. Mizik, and S. Roychowdhury (2012), ‘Managing for the Moment: The Role of Real Activity versus Accruals Earnings Management in SEO Valuation’, Working paper, Available at SSRN: http://ssrn.com/abstract=1982826.
La Porta, R., F. Lopez-de-Silanes, A. Shleifer, and R. Vishny (1997), ‘Legal Determinants of External Finance’, Journal of Finance, Vol. 52, No. 3 (July), pp. 1131-1150.
La Porta, R., F. Lopez-de-Silanes, A. Shleifer, and R. Vishny (1998), ‘Law and Finance’,
25
Journal of Political Economy, Vol. 106, No. 6 (December), pp. 1113-1155. Leuz, C., D. Nanda, and P. Wysocki (2003), ‘Earnings Management and Investor Protection: an
International Comparison’, Journal of Financial Economics, Vol. 69, No. 3 (September), pp. 505–527.
Leuz, C. and P. Wysocki (2009), ‘Economic Consequences of Financial Reporting and Disclosure Regulation: a Review and Suggestions for Future Research’, Working Paper (University of Chicago and MIT Sloan School of Management), Available at SSRN: http://www.ssrn.com/abstract=105398.
Roychowdhury, S. (2006), ‘Earnings Management through Real Activities Manipulation’, Journal of Accounting and Economics, Vol. 42, No. 3 (December), pp. 335-370.
Warfield, T. D., J. J. Wild, and K. L. Wild (1995), ‘Managerial Ownership, Accounting Choices, and Informativeness of Earnings’, Journal of Accounting and Economics, Vol. 20, No. 1 (July), pp. 61-91.
Wongsunwai, W. (2013), ‘The Effect of External Monitoring on Accrual-based and Real Earnings Management: Evidence from Venture-backed Initial Public Offerings’, Contemporary Accounting Research, Vol. 30, No. 1 (March), pp. 242-268.
World Economic Forum (2012), The Financial Development Report 2012, Available at the World Economic Forum Website: http://www.weforum.org/reports/financial-development-report-2012.
Wysocki, P. (2011), ‘New Institutional Accounting and IFRS’, Accounting and Business Research, Vol. 41, No. 3 (July), pp. 309-328.
Zang, A. (2012), ‘Evidence on the Trade-Off between Real Activities Manipulation and Accrual-Based Earnings Management’, The Accounting Review, Vol. 87, No. 2 (March), pp. 675-703.
26
Table 1 Data for each country and year
Panel A. The number of observations and the mean value of financial development scores in each country
Panel B. The number of observations for each year
Country N FD Year N Argentina 94 2.44 2009 13,931 Australia 1,630 4.80 2010 14,037 Belgium 99 4.07 2011 14,436 Brazil 484 3.17 2012 14,744 Canada 2,350 4.72 Total 54,178 Chile 193 2.86 Denmark 171 4.05 Finland 157 3.74 France 1,431 4.34 Germany 1,574 4.36 Greece 31 3.07 Hong Kong 2,564 4.86 India 7,311 3.17 Indonesia 660 2.44 Ireland 38 4.07 Israel 560 3.45 Italy 435 3.65 Japan 10,703 4.93 Jordan 32 3.90 Malaysia 2,435 3.83 Mexico 146 2.50 Netherlands 171 4.68 Nigeria 71 2.11 Norway 207 3.88 Pakistan 543 2.29 Peru 110 2.41 Philippines 132 2.74 Singapore 1,374 4.83 South Africa 395 3.27 South Korea 4,595 4.02 Spain 138 4.34 Sweden 743 4.20 Switzerland 446 4.46 Thailand 1,238 2.90 Turkey 555 2.70 United Kingdom 2,560 5.45 United States 10,772 5.39 Total / Mean 54,178 3.73 FD is the measure of financial development, which is the total of the index of Institutional environment, Banking financial services, Non-banking financial services, and Financial markets as reported by the World Economic Forum.

27
Table 2 Descriptive statistics of dependent and independent variables
Variables Mean Q1 Median Q3 SD |A_ACC| 0.070 0.019 0.043 0.085 0.142 |A_CFO| 0.076 0.021 0.049 0.096 0.109 |A_DE| 0.098 0.024 0.058 0.122 0.137 |A_PD| 0.118 0.032 0.077 0.152 0.180 |REM | 0.227 0.065 0.150 0.294 0.295 FD 4.418 3.697 4.793 5.075 0.887 Leverage 0.308 0.172 0.283 0.417 0.174 Size 4.656 3.065 4.393 6.084 2.198 MTB 4.083 0.618 1.073 1.965 358.077 ROA 0.040 0.002 0.046 0.102 0.188 NOA 2.458 0.764 1.141 1.833 19.626 |A_ACC|, |A_CFO|, |A_DE|, |A_PD|, and |REM| are the absolute value of abnormal accruals (A_ACC), abnormal cash flow from operations (A_CFO), abnormal discretionary expenses (A_DE), abnormal production costs (A_PD), and aggregated REM measure (REM), respectively. A_ACC, A_CFO, A_DE, and A_PD are calculated as the estimated residuals in equations (1), (2), (3), and (4), respectively. REM equals the sum of A_CFO * (-1), A_DE * (-1), and A_PD. FD is the measure of financial development, which is the mean value of the index of Institutional environment, Banking financial services, Non-banking financial services, and Financial markets reported by the World Economic Forum. Leverage is total debt divided by total assets; Size is the natural logarithm of the market value of equity; MTB is the market to book ratio; ROA is net income divided by lagged total assets; and NOA is net operating assets divided by the sales.

28
Table 3 Correlation matrix of dependent variables and independent variables
|A_ACC| |A_CFO| |A_DE| |A_PD| |REM | FD Leverage Size MTB ROA |A_CFO| 0.454
|A_DE| 0.160 0.226 |A_PD| 0.195 0.305 0.588 |REM | 0.226 0.402 0.702 0.883
FD -0.031 0.028 0.164 0.109 0.101 Leverage 0.069 0.033 0.110 0.108 0.117 -0.136
Size -0.177 -0.127 -0.101 -0.076 -0.089 0.263 -0.226 MTB 0.163 0.251 0.198 0.193 0.204 0.091 0.112 0.245 ROA -0.153 -0.146 -0.037 0.047 0.037 -0.102 -0.075 0.248 -0.020 NOA 0.026 0.020 -0.134 -0.112 -0.107 0.009 -0.271 0.081 0.017 -0.169
|A_ACC|, |A_CFO|, |A_DE|, |A_PD| and |REM| is the absolute value of abnormal accruals (A_ACC), abnormal cash flow from operations (A_CFO), abnormal discretionary expenses (A_DE), abnormal production costs (A_PD), and aggregated REM measure (REM). A_ACC, A_CFO, A_DE, and A_PD are calculated as the estimated residuals in equation (1), (2), (3), and (4), respectively. REM equals the sum of A_CFO * (-1), A_DE * (-1), and A_PD. FD are the measures of financial development, which is the mean value of the index of Institutional environment, Banking financial services, Non-banking financial services, and Financial markets reported by the World Economic Forum. Leverage is the total debt divided by the total assets; Size is the natural logarithm of the market value of equity; MTB is the market to book ratio; ROA is net income divided by lagged total assets; NOA is net operating assets divided by the sales.

29
Table 4 Financial development scores and earnings management
(1) (2) (3) (4) (5) Variable |A_ACC| |A_CFO| |A_DE| |A_PD| |REM | Intercept 0.121*** 0.140*** 0.181*** 0.248*** 0.434*** (7.743) (9.207) (12.488) (12.302) (12.477) FD -0.008** -0.009*** -0.013*** -0.023*** -0.033*** (-2.272) (-2.648) (-4.029) (-5.106) (-4.249) Leverage 0.029*** 0.011 0.005 -0.019** -0.011 (3.835) (1.545) (0.801) (-2.239) (-0.673) Size -0.007*** -0.008*** -0.009*** -0.009*** -0.021*** (-5.601) (-7.330) (-9.257) (-6.924) (-8.687) MTB 0.002*** 0.003*** 0.004*** 0.004*** 0.008*** (4.416) (6.165) (7.213) (6.401) (7.074) ROA -0.043*** 0.014 0.002 0.085*** 0.152*** (-3.625) (1.366) (0.165) (7.037) (6.824) NOA -0.001 -0.002*** -0.001*** -0.001*** -0.003*** (-1.561) (-4.326) (-3.381) (-3.031) (-4.420) Year_Fixed_Effects included included included included included Firm_Fixed_Effects included included included included included Adjusted R-squared 0.333 0.452 0.777 0.640 0.677 Observations 57,148 56,830 57,148 56,830 56,830 The t-statistics in parentheses are based on robust standard errors clustered by firm. ***, **, and * indicate significance at 1%, 5%, and 10% levels respectively (two-tailed). The following regressions are estimated: EMijt = β0 + β1 FDjt + β2 Leverageijt-1 + β3 Sizeijt-1 + β4 MTBijt-1 + β5 ROAijt + β6 NOAijt-1
+ Σ βYear_Fixed_Effect + Σ β Firm_Fixed_Effect + εijt (5) EM represents the earnings management proxies, that is, |A_ACC|, |A_CFO|, |A_DE|, |A_PD|, or |REM|. Furthermore, |A_ACC|, |A_CFO|, |A_DE|, |A_PD|, and |REM| are the absolute values of abnormal accruals (A_ACC), abnormal cash flow from operations (A_CFO), abnormal discretionary expenses (A_DE), abnormal production costs (A_PD), and aggregated REM measures (REM), respectively. A_ACC, A_CFO, A_DE, and A_PD are calculated as the estimated residuals in equations (1), (2), (3), and (4), respectively. REM equals the sum of A_CFO * (-1), A_DE * (-1), and A_PD. FD is the measure of financial development that is the mean value of the index of Institutional environment, Banking financial services, Non-banking financial services, and Financial markets, as reported by the World Economic Forum. Leverage is total debt divided by total assets, Size is the natural logarithm of the market value of equity, MTB is the market to book ratio, ROA is net income divided by lagged total assets, and NOA is net operating assets divided by sales.

30
Table 5 The components of financial development scores and earnings management
(1) (2) (3) (4) (5) Variable |A_ACC| |A_CFO| |A_DE| |A_PD| |REM | Intercept 0.126*** 0.168*** 0.214*** 0.252*** 0.511*** (4.386) (5.980) (8.219) (7.353) (8.321) Institutional_ Environment
0.002 -0.012** -0.014*** -0.015** -0.042*** (0.390) (-2.141) (-2.697) (-2.213) (-3.451)
Banking_Financial_Services
-0.001 0.002 -0.001 0.004 0.011* (-0.179) (0.823) (-0.228) (1.220) (1.773)
Non-banking_ Financial_Service
-0.014*** -0.002 0.001 -0.005 -0.002 (-5.808) (-0.770) (0.492) (-1.569) (-0.345)
Financial_Market 0.003** -0.003*** -0.005*** -0.008*** -0.014*** (2.147) (-2.587) (-4.576) (-4.890) (-4.931)
Leverage 0.028*** 0.011 0.006 -0.018** -0.009 (3.673) (1.554) (0.842) (-2.132) (-0.580) Size -0.006*** -0.008*** -0.009*** -0.009*** -0.020*** (-5.524) (-7.125) (-9.065) (-6.605) (-8.352) MTB 0.003*** 0.003*** 0.004*** 0.004*** 0.008*** (4.542) (6.156) (7.193) (6.329) (7.022) ROA -0.043*** 0.013 0.001 0.084*** 0.150*** (-3.589) (1.330) (0.131) (6.947) (6.737) NOA -0.001 -0.002*** -0.001*** -0.001*** -0.003*** (-1.620) (-4.303) (-3.320) (-3.029) (-4.383) Year_Fixed_Effects included included included included included Firm_Fixed_Effects included included included included included Adjusted R-squared 0.334 0.452 0.777 0.640 0.677 Observations 57,148 56,830 57,148 56,830 56,830 The t-statistics in parentheses are based on robust standard errors clustered by firm. ***, **, and * indicate significance at 1%, 5%, and 10% levels respectively (two-tailed). The following regressions are estimated: EMijt = β0 + β1 Institutional_Environmentjt + β2 Banking_Financial_Servicesjt
+ β3 Non-banking_Financial_Servicejt + β4 Financial_Marketjt + β5 Leverageijt-1 + β6 Sizeijt-1+ β7 MTBijt-1 + β8 ROAijt + β9 NOAijt-1 + Σ β Year_Fixed_Effects + Σ β Firm_Fixed_Effect + εijt (6)
EM represents the earnings management proxies, that is, |A_ACC|, |A_CFO|, |A_DE|, |A_PD|, or |REM|. |A_ACC|, |A_CFO|, |A_DE|, |A_PD|, and |REM| are the absolute value of abnormal accruals (A_ACC), abnormal cash flow from operations (A_CFO), abnormal discretionary expenses (A_DE), abnormal production costs (A_PD), and aggregated REM measure (REM). A_ACC, A_CFO, A_DE, and A_PD are calculated as the estimated residuals in equations (1), (2), (3), and (4), respectively. REM equals the sum of A_CFO * (-1), A_DE * (-1), and A_PD. Institutional_Environment, Banking_Financial_Services, Non-banking_Financial_Services, and Financial_Markets are the scores for Institutional environment, Banking financial services, Non-banking financial services, and Financial markets, respectively, reported by the World Economic Forum. Leverage is total debt divided by total assets; Size is the natural logarithm of the market value of equity; MTB is the market to book ratio; ROA is the net income divided by lagged total assets; NOA is the net operating assets divided by sales.
31
Table 6 The nonlinear test results of the relationship between: financial development score and earnings management
(1) (2) (3) (4) (5)
Variable |A_ACC| |A_CFO| |A_DE| |A_PD| |REM | Intercept -0.041 0.167*** 0.080** 0.181*** 0.338*** (-1.108) (4.621) (2.503) (4.054) (4.286) FD 0.070*** -0.022 0.036** 0.009 0.013 (4.128) (-1.335) (2.409) (0.434) (0.370) FD2 -0.009*** 0.002 -0.006*** -0.004 -0.005 (-4.605) (0.807) (-3.217) (-1.554) (-1.297) Leverage 0.029*** 0.012 0.005 -0.020** -0.011 (3.731) (1.563) (0.722) (-2.279) (-0.703) Size -0.007*** -0.008*** -0.009*** -0.009*** -0.021*** (-5.859) (-7.222) (-9.395) (-6.998) (-8.719) MTB 0.002*** 0.003*** 0.004*** 0.004*** 0.009*** (4.464) (6.156) (7.240) (6.416) (7.084) ROA -0.042*** 0.013 0.002 0.086*** 0.153*** (-3.542) (1.349) (0.228) (7.062) (6.843) NOA -0.001 -0.002*** -0.001*** -0.001*** -0.003*** (-2.791) (-6.848) (-5.647) (-4.758) (-6.669) Year_Fixed_Effects included included included included included Firm_Fixed_Effects included included included included included Adjusted R-squared 0.333 0.452 0.777 0.640 0.677 Observations 57,148 56,830 57,148 56,830 56,830 The t-statistics in parentheses are based on robust standard errors clustered by firm. ***, **, and * indicate significance at 1%, 5%, and 10% levels respectively (two-tailed). The following regressions are estimated: EMijt = β0 + β1 FDjt +β2 FD2
jt + β3 Leverageijt-1 + β4 Sizeijt-1 + β5 MTBijt-1 + β6 ROAijt + β7 NOAijt-1 +Σ βYear_Fixed_Effect + Σ β Firm_Fixed_Effect + εijt (7)
EM represents earnings management proxies, that is, |A_ACC|, |A_CFO|, |A_DE|, |A_PD|, or |REM|. |A_ACC|, |A_CFO|, |A_DE|, |A_PD|, and |REM| are the absolute value of abnormal accruals (A_ACC), abnormal cash flow from operations (A_CFO), abnormal discretionary expenses (A_DE), abnormal production costs (A_PD), and aggregated REM measure (REM). A_ACC, A_CFO, A_DE, and A_PD are calculated as the estimated residuals in equation (1), (2), (3), and (4), respectively. REM equals the sum of A_CFO * (-1), A_DE * (-1), and A_PD. FD is the measures of financial development, which is the mean value of the index of Institutional environment, Banking financial services, Non-banking financial services, and Financial markets reported by the World Economic Forum. FD2 is the square of FD. Leverage is the total debt divided by the total assets; Size is the natural logarithm of the market value of equity; MTB is the market to book ratio; ROA is the net income divided by lagged total assets; and NOA is the net operating assets divided by the sales.

32
Table 7 Financial development and earnings management: Including country- and industry-fixed effects instead of firm-fixed effect
(1) (2) (3) (4) (5)
Variable |A_ACC| |A_CFO| |A_DE| |A_PD| |REM | Intercept 0.080*** 0.075*** 0.088*** 0.078*** 0.153*** (7.573) (6.430) (6.117) (5.234) (5.157) FD -0.010*** -0.014*** -0.012*** -0.025*** -0.037*** (-3.560) (-4.966) (-4.116) (-6.643) (-5.479) Leverage 0.012*** -0.004 0.039*** 0.052*** 0.103*** (4.444) (-1.402) (8.738) (10.593) (11.036) Size -0.006*** -0.006*** -0.009*** -0.008*** -0.016*** (-25.016) (-22.400) (-20.217) (-18.457) (-19.711) MTB 0.005*** 0.008*** 0.008*** 0.008*** 0.017*** (18.320) (24.860) (16.420) (16.745) (18.164) ROA -0.052*** -0.047*** 0.008 0.080*** 0.137*** (-9.252) (-6.710) (0.954) (9.793) (8.951) NOA 0.000 0.000 -0.003*** -0.002*** -0.004*** (0.128) (0.063) (-15.651) (-10.029) (-9.136) Year_Fixed_Effects included included included included included Country Fixed Effects included included included included included Industry Fixed Effects included included included included included Adjusted R-squared 0.140 0.170 0.213 0.174 0.178 Observations 57,148 56,830 57,148 56,830 56,830 The t-statistics in parentheses are based on robust standard errors clustered by firm. ***, **, and * indicate significance at 1%, 5%, and 10% levels, respectively (two-tailed). The following regressions are estimated: EMijt = β0 + β1 FDjt + β2 Leverageijt-1 + β3 Sizeijt-1 + β4 MTBijt-1 + β5 ROAijt + β6 NOAijt-1
+ Σ β Year_Fixed_Effect + Σ β Country_Fixed_Effect + Σ β Industry_Fixed_Effect + εijt (8) EM is earnings management proxies, that is, |A_ACC|, |A_CFO|, |A_DE|, |A_PD| or |REM|. |A_ACC|,|A_CFO|, |A_DE|, |A_PD| and |REM| is the absolute value of abnormal accruals (A_ACC), abnormal cash flow from operations (A_CFO), abnormal discretionary expenses (A_DE), abnormal production costs (A_PD), and aggregated REM measure (REM). A_ACC, A_CFO, A_DE, and A_PD are calculated as the estimated residuals in equation (1), (2), (3), and (4), respectively. REM equals the sum of A_CFO * (-1), A_DE * (-1), and A_PD. FD is the measures of financial development, which is the mean value of the index of Institutional environment, Banking financial services, Non-banking financial services, and Financial markets reported by the World Economic Forum. Leverage is the total debt divided by the total assets; Size is the natural logarithm of the market value of equity; MTB is the market to book ratio; ROA is the net income divided by lagged total assets; NOA is the net operating assets divided by the sales.
33
Table 8 The financial development scores and earnings management: excluding observations for the United States and Japan
(1) (2) (3) (4) (5)
Variable |A_ACC| |A_CFO| |A_DE| |A_PD| |REM | Intercept 0.128*** 0.131*** 0.156*** 0.228*** 0.399*** (8.849) (9.307) (11.638) (12.289) (12.372) FD -0.009** -0.008** -0.011*** -0.023*** -0.031*** (-2.493) (-2.201) (-3.481) (-4.896) (-3.887) Leverage 0.014* 0.012 0.003 -0.025*** -0.023 (1.660) (1.452) (0.390) (-2.588) (-1.253) Size -0.008*** -0.009*** -0.009*** -0.009*** -0.021*** (-5.416) (-7.171) (-8.088) (-6.015) (-7.479) MTB 0.002*** 0.003*** 0.004*** 0.003*** 0.008*** (3.788) (4.614) (5.437) (4.518) (5.065) ROA -0.064*** 0.030*** 0.009 0.068*** 0.146*** (-4.480) (2.779) (0.840) (5.171) (6.033) NOA -0.001 -0.001*** -0.001*** -0.001* -0.003*** (-1.280) (-3.518) (-4.036) (-1.927) (-3.797) Year_Fixed_Effects included included included included Included Firm_Fixed_Effects included included included included Included Adjusted R-squared 0.260 0.362 0.737 0.576 0.613 Observations 35,673 35,383 35,673 35,383 35,383 The t-statistics in parentheses are based on robust standard errors clustered by firm. ***, **, and * indicate significance at 1%, 5%, and 10% levels respectively (two-tailed). The following regressions are estimated: EMijt = β0 + β1 FDjt + β2 Leverageijt-1 + β3 Sizeijt-1 + β4 MTBijt-1 + β5 ROAijt + β6 NOAijt-1
+Σ βYear_Fixed_Effect + Σ β Firm_Fixed_Effect + εijt (5) EM represents earnings management proxies, that is, |A_ACC|, |A_CFO|, |A_DE|, |A_PD|, or |REM|. |A_ACC|, |A_CFO|, |A_DE|, |A_PD|, and |REM| are the absolute value of abnormal accruals (A_ACC), abnormal cash flow from operations (A_CFO), abnormal discretionary expenses (A_DE), abnormal production costs (A_PD), and aggregated REM measure (REM). A_ACC, A_CFO, A_DE, and A_PD are calculated as the estimated residuals in equation (1), (2), (3), and (4), respectively. REM equals the sum of A_CFO * (-1), A_DE * (-1), and A_PD. FD is the measures of financial development, which is the mean value of the index of Institutional environment, Banking financial services, Non-banking financial services, and Financial markets reported by the World Economic Forum. Leverage is the total debt divided by the total assets; Size is the natural logarithm of the market value of equity; MTB is the market to book ratio; ROA is the net income divided by lagged total assets; and NOA is the net operating assets divided by the sales.

34
Table 9 The financial development scores and earnings management: excluding observations for 2009
(1) (2) (3) (4) (5)
Variable |A_ACC| |A_CFO| |A_DE| |A_PD| |REM | Intercept 0.160*** 0.110*** 0.185*** 0.242*** 0.377*** (5.931) (4.558) (8.130) (7.601) (6.898) FD -0.013** 0.002 -0.010** -0.015** -0.008 (-2.174) (0.347) (-2.137) (-2.130) (-0.644) Leverage 0.015 0.001 -0.008 -0.041*** -0.036* (1.367) (0.092) (-0.878) (-3.383) (-1.658) Size -0.009*** -0.010*** -0.010*** -0.012*** -0.026*** (-4.759) (-6.165) (-6.810) (-6.098) (-7.240) MTB 0.003*** 0.004*** 0.004*** 0.004*** 0.009*** (4.257) (5.593) (6.114) (4.831) (5.866) ROA -0.040** 0.015 0.010 0.087*** 0.166*** (-2.480) (1.144) (0.825) (5.291) (5.547) NOA -0.001 -0.002*** -0.002*** -0.002*** -0.005*** (-1.452) (-3.835) (-3.567) (-2.680) (-4.057) Year_Fixed_Effects included included included included included Firm_Fixed_Effects included included included included included Adjusted R-squared 0.354 0.467 0.801 0.669 0.703 Observations 43,217 43,023 43,217 43,023 43,023 The t-statistics in parentheses are based on robust standard errors clustered by firm. ***, **, and * indicate significance at 1%, 5%, and 10% levels respectively (two-tailed). The following regressions are estimated: EMijt = β0 + β1 FDjt + β2 Leverageijt-1 + β3 Sizeijt-1 + β4 MTBijt-1 + β5 ROAijt + β6 NOAijt-1
+ Σ β Year_Fixed_Effect + Σ β Firm_Fixed_Effect + εijt (5) EM represents earnings management proxies, that is, |A_ACC|, |A_CFO|, |A_DE|, |A_PD|, or |REM|. |A_ACC|, |A_CFO|, |A_DE|, |A_PD|, and |REM| are the absolute value of abnormal accruals (A_ACC), abnormal cash flow from operations (A_CFO), abnormal discretionary expenses (A_DE), abnormal production costs (A_PD), and aggregated REM measure (REM), respectively. A_ACC, A_CFO, A_DE, and A_PD are calculated as the estimated residuals in equation (1), (2), (3), and (4), respectively. REM equals the sum of A_CFO * (-1), A_DE * (-1), and A_PD. FD is the measure of financial development, which is the mean value of the index of Institutional environment, Banking financial services, Non-banking financial services, and Financial markets reported by the World Economic Forum. Leverage is the total debt divided by the total assets; Size is the natural logarithm of the market value of equity; MTB is the market to book ratio; ROA is the net income divided by lagged total assets; and NOA is the net operating assets divided by the sales.
35
Table 10 The financial development scores and earnings management: the country-weighted least square (WLS) regression
(1) (2) (3) (4) (5)
Variable |A_ACC| |A_CFO| |A_DE| |A_PD| |REM | Intercept 0.092*** 0.153*** 0.170*** 0.235*** 0.473*** (4.281) (5.805) (6.780) (7.804) (8.751) FD -0.005 -0.020*** -0.018*** -0.030*** -0.061*** (-0.809) (-2.658) (-2.681) (-3.618) (-4.049) Leverage 0.018 0.009 0.004 -0.010 -0.007 (1.525) (0.756) (0.318) (-0.619) (-0.267) Size -0.005** -0.005* -0.006*** -0.008*** -0.017*** (-2.191) (-1.907) (-2.678) (-2.838) (-3.402) MTB 0.002** 0.002** 0.003** 0.002* 0.007*** (2.374) (1.963) (2.327) (1.933) (2.983) ROA -0.028* -0.006 0.015 0.056*** 0.087*** (-1.761) (-0.366) (1.135) (3.833) (2.624) NOA -0.000 -0.001** -0.001 -0.001 -0.002* (-0.518) (-2.045) (-1.288) (-1.029) (-1.775) Year_Fixed_Effects included included included included included Firm_Fixed_Effects included included included included included Adjusted R-squared 0.334 0.437 0.758 0.620 0.665 Observations 57,148 56,830 57,148 56,830 56,830 The weight is inversely proportional to the number of observations per country. The t-statistics in parentheses are based on robust standard errors clustered by firm. ***, **, and * indicate significance at 1%, 5%, and 10% levels respectively (two-tailed). The following regressions are estimated: EMijt = β0 + β1 FDjt + β2 Leverageijt-1 + β3 Sizeijt-1 + β4 MTBijt-1 + β5 ROAijt + β6 NOAijt-1
+ Σ βYear_Fixed_Effect + Σ β Firm_Fixed_Effect + εijt (5) EM represents the earnings management proxies, that is, |A_ACC|, |A_CFO|, |A_DE|, |A_PD|, or |REM|. Furthermore, |A_ACC|, |A_CFO|, |A_DE|, |A_PD|, and |REM| are the absolute values of abnormal accruals (A_ACC), abnormal cash flow from operations (A_CFO), abnormal discretionary expenses (A_DE), abnormal production costs (A_PD), and aggregated REM measures (REM), respectively. A_ACC, A_CFO, A_DE, and A_PD are calculated as the estimated residuals in equations (1), (2), (3), and (4), respectively. REM equals the sum of A_CFO * (-1), A_DE * (-1), and A_PD. FD is the measure of financial development that is the mean value of the index of Institutional environment, Banking financial services, Non-banking financial services, and Financial markets, as reported by the World Economic Forum. Leverage is total debt divided by total assets, Size is the natural logarithm of the market value of equity, MTB is the market to book ratio, ROA is net income divided by lagged total assets, and NOA is net operating assets divided by sales.
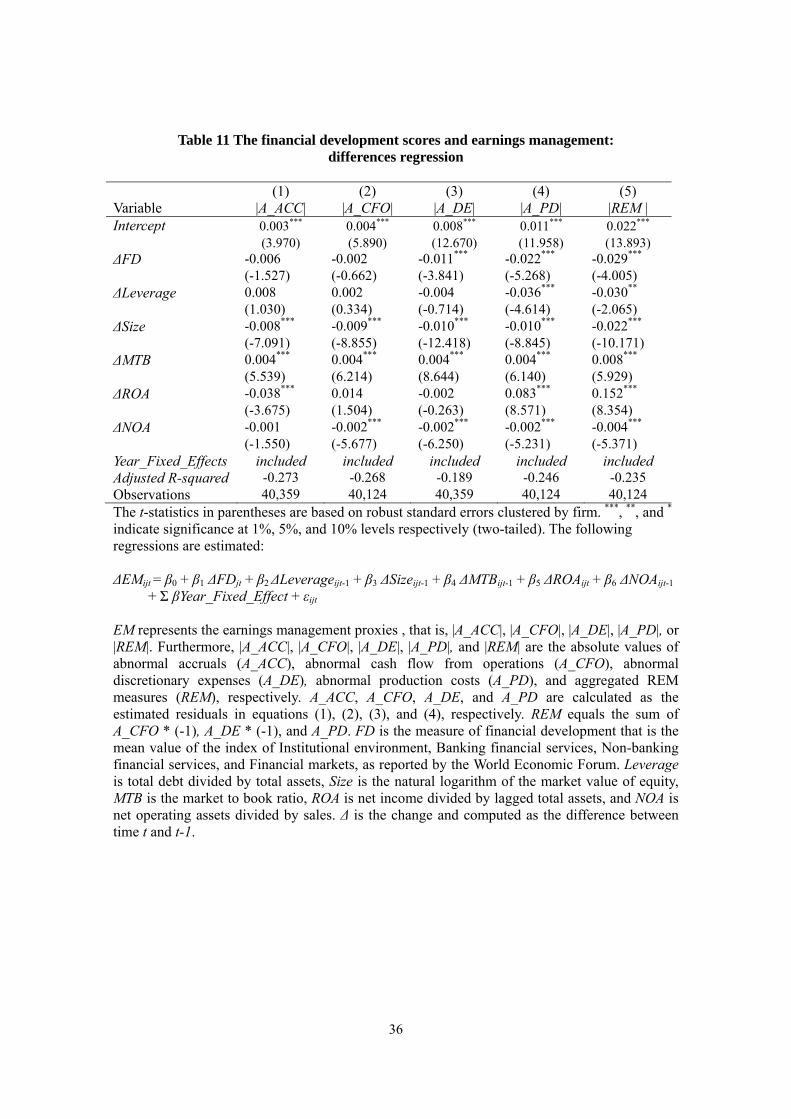
36
Table 11 The financial development scores and earnings management: differences regression
(1) (2) (3) (4) (5)
Variable |A_ACC| |A_CFO| |A_DE| |A_PD| |REM | Intercept 0.003*** 0.004*** 0.008*** 0.011*** 0.022*** (3.970) (5.890) (12.670) (11.958) (13.893) ΔFD -0.006 -0.002 -0.011*** -0.022*** -0.029*** (-1.527) (-0.662) (-3.841) (-5.268) (-4.005) ΔLeverage 0.008 0.002 -0.004 -0.036*** -0.030** (1.030) (0.334) (-0.714) (-4.614) (-2.065) ΔSize -0.008*** -0.009*** -0.010*** -0.010*** -0.022*** (-7.091) (-8.855) (-12.418) (-8.845) (-10.171) ΔMTB 0.004*** 0.004*** 0.004*** 0.004*** 0.008*** (5.539) (6.214) (8.644) (6.140) (5.929) ΔROA -0.038*** 0.014 -0.002 0.083*** 0.152*** (-3.675) (1.504) (-0.263) (8.571) (8.354) ΔNOA -0.001 -0.002*** -0.002*** -0.002*** -0.004*** (-1.550) (-5.677) (-6.250) (-5.231) (-5.371) Year_Fixed_Effects included included included included included Adjusted R-squared -0.273 -0.268 -0.189 -0.246 -0.235 Observations 40,359 40,124 40,359 40,124 40,124 The t-statistics in parentheses are based on robust standard errors clustered by firm. ***, **, and * indicate significance at 1%, 5%, and 10% levels respectively (two-tailed). The following regressions are estimated: ΔEMijt = β0 + β1 ΔFDjt + β2 ΔLeverageijt-1 + β3 ΔSizeijt-1 + β4 ΔMTBijt-1 + β5 ΔROAijt + β6 ΔNOAijt-1
+ Σ βYear_Fixed_Effect + εijt EM represents the earnings management proxies , that is, |A_ACC|, |A_CFO|, |A_DE|, |A_PD|, or |REM|. Furthermore, |A_ACC|, |A_CFO|, |A_DE|, |A_PD|, and |REM| are the absolute values of abnormal accruals (A_ACC), abnormal cash flow from operations (A_CFO), abnormal discretionary expenses (A_DE), abnormal production costs (A_PD), and aggregated REM measures (REM), respectively. A_ACC, A_CFO, A_DE, and A_PD are calculated as the estimated residuals in equations (1), (2), (3), and (4), respectively. REM equals the sum of A_CFO * (-1), A_DE * (-1), and A_PD. FD is the measure of financial development that is the mean value of the index of Institutional environment, Banking financial services, Non-banking financial services, and Financial markets, as reported by the World Economic Forum. Leverage is total debt divided by total assets, Size is the natural logarithm of the market value of equity, MTB is the market to book ratio, ROA is net income divided by lagged total assets, and NOA is net operating assets divided by sales. Δ is the change and computed as the difference between time t and t-1.