a cross-cultural user evaluation of product recommender...
TRANSCRIPT
A Cross-Cultural User Evaluation of Product Recommender Interfaces
Li Chen and Pearl Pu Human Computer Interaction Group, School of Computer and Communication Sciences
Swiss Federal Institute of Technology in Lausanne (EPFL) CH-1015, Lausanne, Switzerland
{li.chen, pearl.pu}@epfl.ch
ABSTRACT We present a cross-cultural user evaluation of an organization-based product recommender interface, by comparing it with the traditional list view. The results show that it performed significantly better, for all study participants, in improving on their competence perceptions, including perceived recommendation quality, perceived ease of use and perceived usefulness, and positively impacting users’ behavioral intentions such as intention to save effort in the next visit. Additionally, oriental users were observed reacting more significantly strongly to the organization interface regarding some subjective aspects, compared to western subjects. Through this user study, we also identified the dominating role of the recommender system’s decision-aiding competence in stimulating both oriental and western users’ return intention to an e-commerce website where the system is applied.
Categories and Subject Descriptors H.5.2 [Information interfaces and presentation]: User Interfaces – evaluation/methodology, graphical user interfaces (GUI), user-centered design.
General Terms Design, Experimentation, Human Factors.
Keywords Product recommender systems, organization interface, list view, cross-cultural user study.
1. INTRODUCTION Online systems that help users select the most preferential item from a large electronic catalog are known as product search and recommender systems. In recent years, much research work has emphasized on developing and improving the underlying algorithms, whereas many of the user issues such as acceptance of recommendations and trust building received little attention. Trust is seen as a long-term relationship between a user and the organization that the online technology represents. It is critical to
study especially for e-commerce environments where the traditional salesperson, and subsequent relationship, is replaced by a virtual vendor or a more intelligent product recommender agent. Studies show that customer trust is positively associated with customers’ intentions to transact, purchase a product, and return to the website [9]. However, these results have mainly been derived from online shops’ ability to ensure security, privacy, and reputation (i.e., the integrity and benevolence aspects of trust formation) [8], and less from the website’s competence such as its decision agent’s ability in providing good recommendations and explaining its results. We have always been engaged in investigating the effective recommender design factors that may positively impact the promotion of users’ trust and furthermore their behavioral intentions. Previously, we have conceptualized a competence-based trust model for recommender systems [4]. We have primarily studied trust-building by the different design dimensions of explanation interfaces, given explanations’ potential benefits to improve users’ confidence about recommendations and their acceptance of the system [10,18]. The traditional strategy of displaying and explaining recommendations, as popularly adopted in most of case-based reasoning recommender systems [15] and commercial websites (www.activedecisions.com), is to display the recommendation content in a rank ordered list and use a “why” component along with each item to explain the computational reasoning behind it. In order to accelerate users’ decision process by saving their information-searching effort in reviewing all recommended items, we have proposed a so called preference-based organization technique. The main idea is that, rather than explaining each item one by one, a group of products can be explained together by a category title, provided that they have shared tradeoff characteristics compared to a reference product (e.g., the top candidate) [17]. In the following, we first summarize previous studies on the organization method and then give the contribution of our current work.
1.1 Summary of Previous Studies A carefully conducted user survey (53 subjects) first showed some interesting observations regarding the influence of explanations on trust building and the effectiveness of the organization-based recommender interface [4]. That is, most of surveyed users strongly agreed that they shall trust more in a system with the explanation of how it computed the recommended items. Moreover, the organized view of recommendations was largely favored than the traditional “why”-based list view, since it was perceived to more likely accelerate the process of product comparison and choice making.
Permission to make digital or hard copies of all or part of this work for personal or classroom use is granted without fee provided that copies are not made or distributed for profit or commercial advantage and that copies bear this notice and the full citation on the first page. To copy otherwise, or republish, to post on servers or to redistribute to lists, requires prior specific permission and/or a fee. RecSys’08, October 23–25, 2008, Lausanne, Switzerland. Copyright 2008 ACM 978-1-60558-093-7/08/10...$5.00.
75
A follow-up user study asked 72 participants to evaluate the two types of recommender interfaces in a within-subject procedure [17]. The user task was to find a product s/he most preferred among a set of most popular products recommended in either an organized view or a list view with “why” components. Results show that while both interfaces enabled trust-building, the organized view was significantly more effective in increasing users’ task efficiency, saving their cognitive effort and prompting them to intend to return to the interface for future use.
1.2 Contribution of Our Current Work The previous two experiments pointed out promising benefits of the organization interface regarding its trust-inspiring ability. They motivated us to further evaluate the interface’s practical performance in a more realistic and interactive system where it serves as the computation and explanation of personalized recommendations according to users’ preferences (rather than based on products’ general popularity). In such system, preference specification/revision tools are provided for users to input and refine their preferences, and the recommender interface is returned whenever the user’s preferences are revised. In addition, we were interested in identifying whether people from different categories of cultural backgrounds (i.e., oriental and western cultures) would all react actively to the organization-based system. Thus, a relatively larger scale cross-cultural experiment was set up, and a comparative user study was additionally involved to compare the organization interface with the “why”-based list view which was implemented in a similar interactive system setting. An extended evaluation framework based on previous measurements was also established to assess the system’s actual benefits in respect of three design aspects: recommendation quality, transparency, and user-control. As for upper-level competence perceptions, perceived ease of use and perceived usefulness, the two primary determining elements of convincing users to accept a technology [6], were included, besides decision confidence, perceived effort and satisfaction. Three trust-induced behavioral intentions were also contained, which are intention to purchase, intention to return and intention to save effort in the next visit. This paper is hence organized as follows: section 2 and 3 describes the organization-based interface and its function in an implemented prototype system; section 4 introduces the cross-cultural user evaluation’s design and experimental procedure; section 5 presents results from the study; and section 6 concludes the paper’s work.
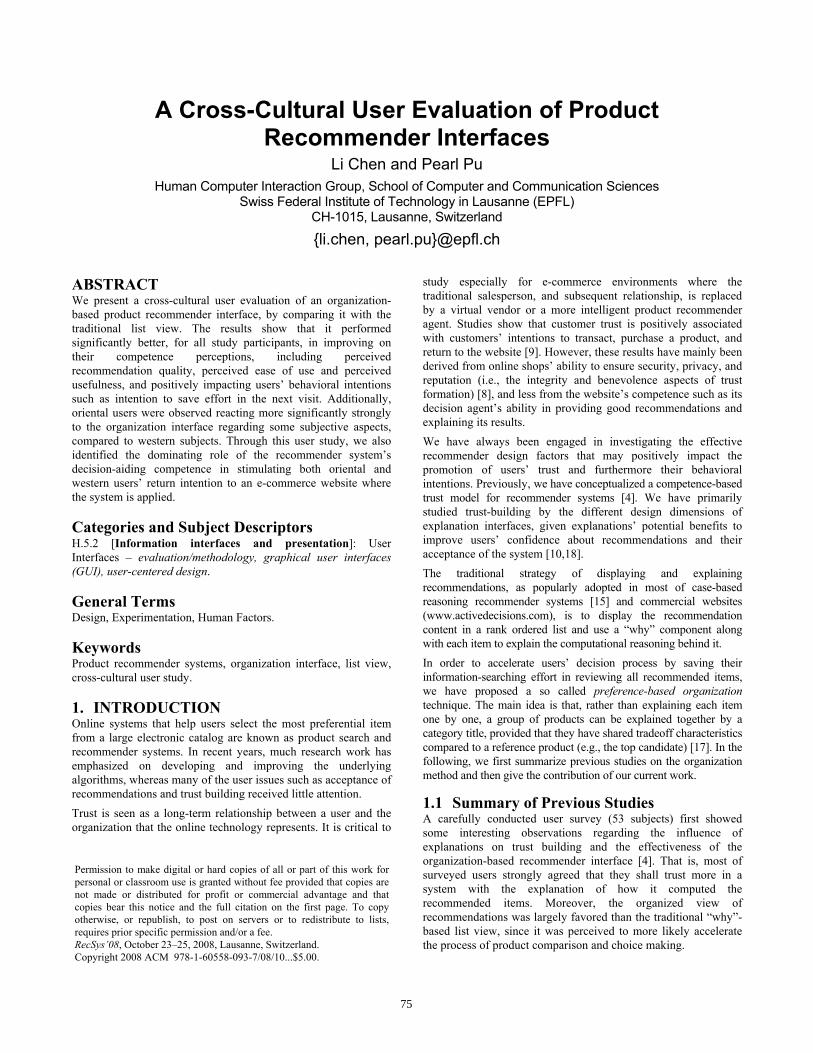
2. ORGANIZATION-BASED RECOMMENDER INTERFACE The organization interface has been developed to compute and categorize recommended products, and use the category title (e.g. “these products have cheaper price and longer battery life, but slower processor speed and heavier weight”) as the explanation of multiple products (see Figure 1). Each presented title essentially details the representative tradeoff properties shared by a set of recommended products by comparing them with the top candidate (the best matching product according to the user’s current preferences). It exposes the recommendation opportunities and indicates the reason of why these products are recommended, by
revealing their superior values on some important attributes, and compromises on less important ones. To derive effective principles for this interface design, we tested 13 paper prototypes by means of pilot studies and user interviews, and finally concluded five design principles. The principles include: proposing improvements and compromises in the category title using the conversational language, keeping the number of tradeoff attributes in the category title under five, including a few of actual products within each category, and diversifying the proposed category titles as well as associated products (see details in [17]). We accordingly proposed an algorithm to generate such organization interfaces [5]. Briefly speaking, the algorithm contains three main steps: Step 1: the user preferences over all products are represented as a weighted additive form of value functions according to the multi-attribute utility theory (MAUT) [11]. Based on this compensatory preference model, we can resolve conflicting values explicitly by considering tradeoffs between different attributes; Step 2: all alternatives are ranked by their weighted utilities calculated according to the MAUT model. Then, each of them, except the ranked first one (i.e., the top candidate), is converted into a tradeoff vector. Each tradeoff vector is a set of (attribute, tradeoff) pairs, where tradeoff indicates the improved (denoted as ↑) or compromised (↓) property of the product’s attribute value compared to the same attribute of the top candidate. For the attributes without explicitly stated preferences, default properties are suggested (e.g., the cheaper, the better). For example, a tradeoff vector is {(price, ↑), (processor speed, ↓), (memory, ↓), (hard drive size, ↑), …}, meaning that the corresponding laptop has lower price, slower processor speed, less memory, more hard drive size, etc, in comparison with the top recommended laptop; Step 3: all of the tradeoff vectors are then organized into different categories by utilizing an association rule mining tool [1] to discover the recurring subsets of (attribute, tradeoff) pairs among them. Each subset hence represents a category of products with the same tradeoff properties. Since a large amount of category candidates would be produced by the mining algorithm, they are further ranked and diversified. We select ones with higher tradeoff utilities (i.e., gains against losses relative to the top candidate and user preferences) in consideration of both category titles and their associated products. Therefore, the presented category titles can in nature stimulate users to consider hidden needs and even guide them to conduct tradeoff navigations for a better choice. For instance, after the user saw the products that “have faster processor speed and longer battery life, although they are slightly more expensive”, she may likely change to that direction from the top candidate, if she realized that the processor speed is more important than the price to her, or she likes “longer battery life” although she did not state any preference on this attribute before. The support for this kind of tradeoff navigation process has been demonstrated to have significant effect on increasing users’ decision accuracy and preference certainty [16]. We have previously compared our organization algorithm with other typical tradeoff supporting approaches (such as the data-driven dynamic critiquing system [14]), and found that it achieved significantly higher accuracy in predicting tradeoff criteria and targeted products that users actually made, mainly owing to its preference-focused clustering and selection strategies [5].
76
Figure 1. Screenshot of the organization-based recommender interface.
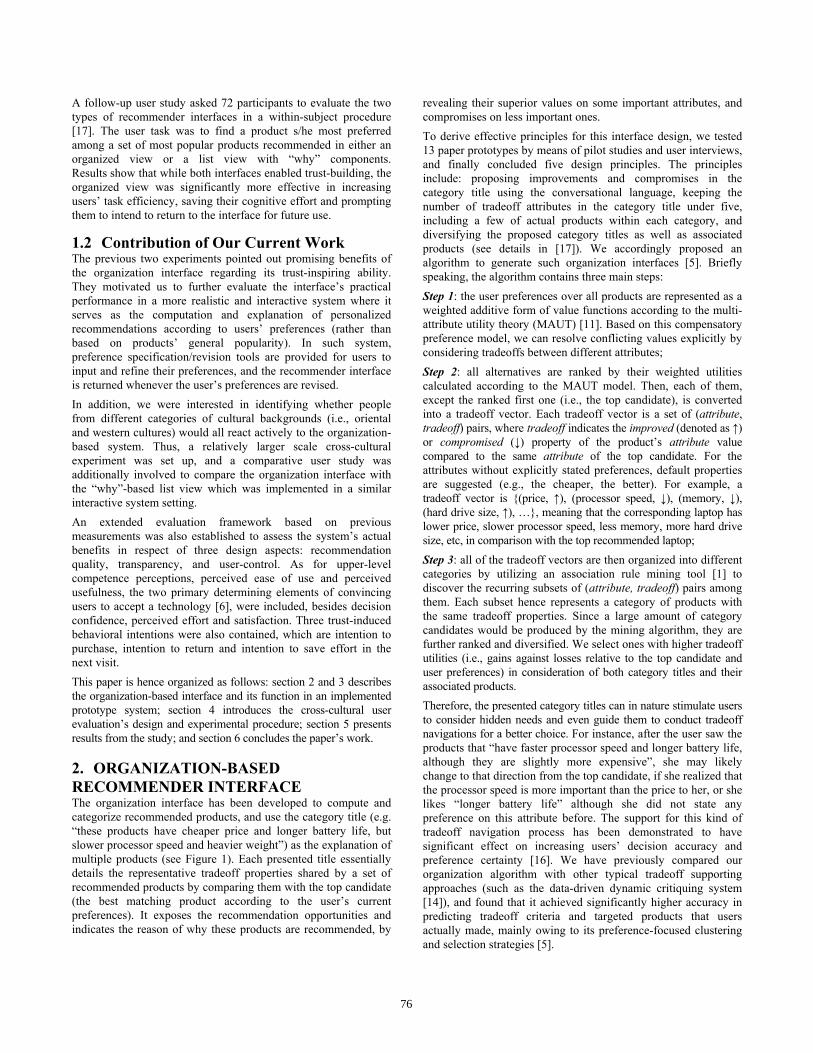
Figure 2. Screenshot of the list view of recommendations.
77

3. PROTOTYPE SYSTEM We implemented the organization interface in a product recommender system, which is in particular to assist users in searing for high-involvement products (e.g., notebooks, digital cameras, and cars) for which people will be willing to spend considerable effort in locating a desired choice, in order to avoid any financial damage or emotional burden. A typical interaction procedure with the system can be as follows. A user initially starts her search by specifying any number of preferences in a query area. Each preference is composed of one acceptable attribute value and its relative weight from 1 “least important” to 5 “most important”. A preference structure is hence a set of (attribute value, weight) pairs of all participating attributes, as required by the MAUT model. After a user states her initial preferences, the best matching product will be computed and returned at the top, followed by k categories of other recommended products as outcomes of the organization algorithm (k = 4 in our prototype, see Figure 1). If the user is interested in one of the suggested categories, she can click “Show All” to see more products (up to 6) belonging to it. Among these products, the user can either choose one as her final choice, or select a near-target and click “Better Features” to view recommended products with some better values than the selected one. In the latter case, the user’s preference model will be automatically refined to respect her current needs. Specifically, the weight of improved attribute(s) that appears in the examined category title will be increased and the weight of compromised one(s) be decreased. All attributes’ acceptable values will be also updated according to the selected new reference product. On the other hand, the user can revise preferences on her own through clicking the button “Specify your own criteria for ‘Better Features’”. A critiquing page will be then activated that provides her with options for making self-specified tradeoff criteria to a near-target. For example, the user could choose to optimize any attributes’ values (e.g., $100 cheaper) and accept compromise(s) on one or more less important attributes, which revisions will be directly reflected in her preference model. A small set of tradeoff alternatives that best satisfy the stated tradeoff criteria will be then returned, among which she either makes the final choice or proceeds to conduct any further tradeoff navigations in either the organization interface or by her self-initiated way. Moreover, the system allows the user to view the product's detailed specifications via a “detail” link, and to record all of her interesting products in a consideration set to facilitate comparing them before checking out.
4. CROSS-CULTURAL EVALUATION 4.1 Cultural Difference It is commonly recognized that elements of a user interface appropriate for one culture may not be appropriate for another. For example, Barber and Badre [2] claimed that Americans prefer websites with a white background, while Japanese dislike the white and Chinese favor the red background. People are deeply influenced by the cultural values and norms they hold. Many researchers have classified cultures around the world in various categories. The most typical classification is Oriental vs. Western cultures. The Oriental culture, influenced by the ancient Chinese culture, focuses on holistic thought,
continuity, and interrelationships of objects. On the contrary, the Western culture, influenced by the ancient Greek culture, puts greater emphasis on analytical thought, detachment, and attributes of objects [13]. In online user-experience researches, one primary reason identified for consumer behavior differences has been based on the belief that western countries generally have individualism and a low context culture, whereas eastern countries generally have collectivism and a high context culture [3]. Thus, we were interested in recruiting people from the two different cultural backgrounds to see whether the culture difference would influence their actual behavior and subjective perceptions with our product recommender system, while they use it to make a purchase decision. In our experiment, the participants were mainly coming from two nations respectively representing the two different cultures: China (oriental culture) and Switzerland (western culture).
4.2 Participants and Materials In total, 120 participants volunteered to take part in the experiment. In collaboration with the HCI lab at Tsinghua University in China, we recruited 60 native Chinese. Most of them are students in the university pursuing Bachelor, Master or PhD degrees, and a few of them work as engineers in domains of software development, architecture, etc. Another 60 subjects are mainly students in our university, and 41 of them are Swiss and the others are from European countries nearby like France, Italy and Germany. Table 1 lists demographical profiles of study subjects from the two cultural backgrounds.
Table 1. Demographical profiles of study subjects from two cultures (the number of users is in the bracket)
Oriental Culture (60) Western Culture (60)
Nation China (60) Switzerland (41); Other European countries (19)
Gender Female (23); Male (37) Female (15); Male (45)
Average age 21~30 (57); >30 (3) <21 (14); 21~30 (44); >30 (2)
Major/ job domain
Computer, mathematics, environment, electronics, architecture, etc.
Computer, education, mechanics, electronics,, architecture, etc.
Computer knowledge
4.34 (advanced) 4.08 (advanced)
Internet usage
4.83 (almost daily) 4.98 (almost daily)
e-commerce site visits
3.69 (1-3 times a month) 3.36 (a few times every 3 months)
e-shopping experiences
3.25 (a few times every 3 months)
2.92 (a few times every 3 months)
Two systems were prepared for this user study. One is the prototype system with the organization-based recommender interface, as described in Section 3. Another system differs from it only in respect of the recommendation display. That is, it does not show an organized view of recommendations, but a traditional ranked list with a “why” component to explain each recommended product. More specifically, in the list view, k products (e.g., k = 25 in our implementation) that are with the
78
highest weighted utilities according to the user’s current preferences are listed, and the “why” gives the reason of why the corresponding product is presented (i.e., its pros and cons compared to the top candidate) (see Figure 2). In this system, users can also freely specify and revise preferences, examine products’ detailed specifications, and in-depth compare near-targets in a consideration set. Henceforth, the two compared systems are respectively abbreviated as ORG and LIST. They were both developed with two product catalogs: 64 digital cameras each constrained by 8 main attributes (manufacturer, price, resolution, optical zoom, etc), and 55 tablet PCs by 10 main attributes (manufacturer, price, processor speed, weight, etc). All products were extracted from a real e-commerce website.
4.3 Evaluation Criteria In this experiment, the measured variables used in previous user studies (e.g., perceived effort, return intention) [17] were extended to include more subjective aspects, which are essentially related to the competence-based trust model we have established for recommender systems [4]. The model consists of three main constructs: system-design features, competence-inspired trust, and trust-induced behavioral intentions. As for system-design features that may directly contribute to the promotion of overall competence perceptions, we included three dimensions: recommendation quality, transparency, and user-control. The overall competence is composed of two crucial variables: perceived ease of use and perceived usefulness, which have been determined as the primary factors of persuading users to accept and use a technology [6]. Besides, we included questions about decision confidence, cognitive effort, and satisfaction. Trusting intentions are behavioral attitudes expected from users once their trust has been built. In addition to commonly addressed purchase and return intentions, we were interested in the intention to save effort, because it examines whether users will potentially reduce their decision-making effort in repeated visits upon establishing a certain trust level with the recommender system. Table 2 lists all of the questions as measurements of these subjective variables. Most of them came from existing literatures where they have been repeatedly shown to exhibit strong content validity [12]. Each question was required to respond on a 5-point Likert scale from “strongly disagree” to “strongly agree”. Except for these subjective criteria, we also measured participants’ objective decision accuracy and effort. The objective accuracy was defined as the percentage of users who stood by their choice found using the assigned recommender system, when they have the chance to review all alternatives in the database. The objective effort was quantitatively measured in terms of both task completion time and interaction cycles.
4.4 Experiment Design and Procedure A 22 full-factorial between-group experiment design was used. The manipulated factors are: (oriental culture, western culture) and (ORG, LIST). Participants were evenly distributed into the four conditions, resulting in a sample size of 30 for each condition cell. Each participant was further randomly assigned one product catalog (digital camera or tablet PC) to search. An online procedure containing instructions, evaluated interfaces and questionnaires was implemented, so that participants could
easily follow and we could record all of their actions in a log file. At the beginning, the participant was required to fill in a pre-questionnaire about her/his personal information and subjective opinions on the priority order of different factors in influencing her/his general trust formation in an e-commerce website. Then s/he was asked to use the assigned system to locate a product that s/he most preferred and would purchase if given the opportunity. After the choice was made, the participant was asked to answer post-study questions related to all of the measured subjective variables. Then the interface’s decision accuracy was assessed by revealing all of products to the participant to determine whether s/he prefers another product in the catalog or sticks with the choice just made using the recommender system.
Table 2. Questions to measure subjective variables
Measured variable
Question responded on a 5-point Likert scale from “strongly disagree” to “strongly agree”
Subjective perceptions of system-design features Recommendation quality
This interface gave me some really good recommendations.
Transparency I understand why the products were returned through the explanations in the interface.
User control I felt in control of specifying and changing my preferences in this interface.
Overall competence perceptions Perceived ease of use I find this interface easy to use.
This interface is competent to help me effectively find products I really like. I find this interface is useful to improve my “shopping” performance.
Perceived usefulness
Cronbach’s alpha = 0.69 Decision confidence
I am confident that the product I just “purchased” is really the best choice for me. I easily found the information I was looking for. Looking for a product using this interface required too much effort (reverse scale). Perceived effort
Cronbach’s alpha = 0.54 Satisfaction My overall satisfaction with the interface is high. Trusting intentions Intention to purchase
I would purchase the product I just chose if given the opportunity. If I had to search for a product online in the future and an interface like this was available, I would be very likely to use it. I don't like this interface, so I would not use it again (reverse scale).
Intention to return
Cronbach’s alpha = 0.80 Intention to save effort in next visit
If I had a chance to use this interface again, I would likely make my choice more quickly.
Note: The Cronbach’s alpha value represents how well the two items are related and unified to one construct.
4.5 Hypotheses Regarding the culture difference, we postulated that it would not have significant influence on users’ decision behavior in either ORG or LIST. That is, people would react similarly to the system no matter which cultural background s/he is from. The ORG system was further hypothesized to outperform LIST, especially in terms of subjective constructs related to user trust, owing to the replacement of the list view of recommendations with the organized view.
79
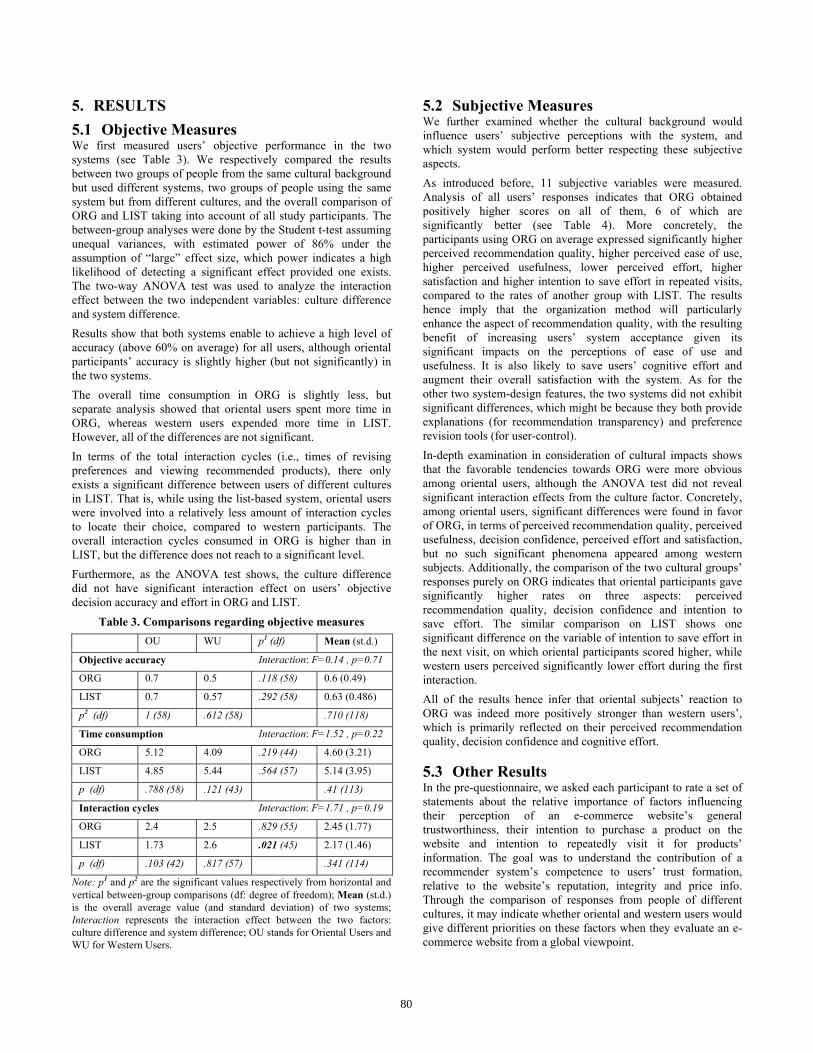
5. RESULTS 5.1 Objective Measures We first measured users’ objective performance in the two systems (see Table 3). We respectively compared the results between two groups of people from the same cultural background but used different systems, two groups of people using the same system but from different cultures, and the overall comparison of ORG and LIST taking into account of all study participants. The between-group analyses were done by the Student t-test assuming unequal variances, with estimated power of 86% under the assumption of “large” effect size, which power indicates a high likelihood of detecting a significant effect provided one exists. The two-way ANOVA test was used to analyze the interaction effect between the two independent variables: culture difference and system difference. Results show that both systems enable to achieve a high level of accuracy (above 60% on average) for all users, although oriental participants’ accuracy is slightly higher (but not significantly) in the two systems. The overall time consumption in ORG is slightly less, but separate analysis showed that oriental users spent more time in ORG, whereas western users expended more time in LIST. However, all of the differences are not significant. In terms of the total interaction cycles (i.e., times of revising preferences and viewing recommended products), there only exists a significant difference between users of different cultures in LIST. That is, while using the list-based system, oriental users were involved into a relatively less amount of interaction cycles to locate their choice, compared to western participants. The overall interaction cycles consumed in ORG is higher than in LIST, but the difference does not reach to a significant level. Furthermore, as the ANOVA test shows, the culture difference did not have significant interaction effect on users’ objective decision accuracy and effort in ORG and LIST.
Table 3. Comparisons regarding objective measures OU WU p1 (df) Mean (st.d.)
Objective accuracy Interaction: F=0.14 , p=0.71
ORG 0.7 0.5 .118 (58) 0.6 (0.49)
LIST 0.7 0.57 .292 (58) 0.63 (0.486)
p2 (df) 1 (58) .612 (58) .710 (118)
Time consumption Interaction: F=1.52 , p=0.22
ORG 5.12 4.09 .219 (44) 4.60 (3.21)
LIST 4.85 5.44 .564 (57) 5.14 (3.95)
p (df) .788 (58) .121 (43) .41 (113)
Interaction cycles Interaction: F=1.71 , p=0.19
ORG 2.4 2.5 .829 (55) 2.45 (1.77)
LIST 1.73 2.6 .021 (45) 2.17 (1.46)
p (df) .103 (42) .817 (57) .341 (114)
Note: p1 and p2 are the significant values respectively from horizontal and vertical between-group comparisons (df: degree of freedom); Mean (st.d.) is the overall average value (and standard deviation) of two systems; Interaction represents the interaction effect between the two factors: culture difference and system difference; OU stands for Oriental Users and WU for Western Users.
5.2 Subjective Measures We further examined whether the cultural background would influence users’ subjective perceptions with the system, and which system would perform better respecting these subjective aspects. As introduced before, 11 subjective variables were measured. Analysis of all users’ responses indicates that ORG obtained positively higher scores on all of them, 6 of which are significantly better (see Table 4). More concretely, the participants using ORG on average expressed significantly higher perceived recommendation quality, higher perceived ease of use, higher perceived usefulness, lower perceived effort, higher satisfaction and higher intention to save effort in repeated visits, compared to the rates of another group with LIST. The results hence imply that the organization method will particularly enhance the aspect of recommendation quality, with the resulting benefit of increasing users’ system acceptance given its significant impacts on the perceptions of ease of use and usefulness. It is also likely to save users’ cognitive effort and augment their overall satisfaction with the system. As for the other two system-design features, the two systems did not exhibit significant differences, which might be because they both provide explanations (for recommendation transparency) and preference revision tools (for user-control). In-depth examination in consideration of cultural impacts shows that the favorable tendencies towards ORG were more obvious among oriental users, although the ANOVA test did not reveal significant interaction effects from the culture factor. Concretely, among oriental users, significant differences were found in favor of ORG, in terms of perceived recommendation quality, perceived usefulness, decision confidence, perceived effort and satisfaction, but no such significant phenomena appeared among western subjects. Additionally, the comparison of the two cultural groups’ responses purely on ORG indicates that oriental participants gave significantly higher rates on three aspects: perceived recommendation quality, decision confidence and intention to save effort. The similar comparison on LIST shows one significant difference on the variable of intention to save effort in the next visit, on which oriental participants scored higher, while western users perceived significantly lower effort during the first interaction. All of the results hence infer that oriental subjects’ reaction to ORG was indeed more positively stronger than western users’, which is primarily reflected on their perceived recommendation quality, decision confidence and cognitive effort.
5.3 Other Results In the pre-questionnaire, we asked each participant to rate a set of statements about the relative importance of factors influencing their perception of an e-commerce website’s general trustworthiness, their intention to purchase a product on the website and intention to repeatedly visit it for products’ information. The goal was to understand the contribution of a recommender system’s competence to users’ trust formation, relative to the website’s reputation, integrity and price info. Through the comparison of responses from people of different cultures, it may indicate whether oriental and western users would give different priorities on these factors when they evaluate an e-commerce website from a global viewpoint.
80

Table 4. Comparisons regarding subjective perceptions OU WU p value (df) Mean (st.d.)
Perceived recommendation quality Interaction: F=0.93 , p=0.34
ORG 3.93 3.47 .018 (42) 3.7 (0.77)
LIST 3.43 3.27 .503 (58) 3.35 (0.95)
p value (df) .014 (41) .414 (58) .029 (113)
Perceived transparency Interaction: F=0.52 , p=0.47
ORG 3.87 3.93 0.685 (58) 3.9 (0.63)
LIST 3.57 3.83 0.238 (56) 3.7 (0.87)
p value (df) .151 (51) .593 (56) .152 (108)
Perceived control Interaction: F<0.01 , p=1
ORG 3.63 3.77 .574 (58) 3.7 (0.96)
LIST 3.37 3.5 .596 (54) 3.43 (0.91)
p value (df) .314 (56) .234 (58) .121 (118)
Perceived ease of use Interaction: F=0.01 , p=0.92
ORG 3.87 4.13 .245 (58) 4 (0.88)
LIST 3.6 3.83 .359 (58) 3.72 (0.98)
p value (df) .254 (58) .232 (57) .098 (117)
Perceived usefulness Interaction: F=0.22, p =0.64
ORG 3.72 3.57 .439 (52) 3.64 (0.74)
LIST 3.37 3.35 .937 (55) 3.36 (0.81)
p value (df) .047 (57) .344 .048 (117)
Decision confidence Interaction: F=1.64 , p=0.20
ORG 3.87 3.57 .093 (53) 3.72 (0.69)
LIST 3.57 3.63 .769 (55) 3.6 (0.87)
p value (df) .093 (53) .769 (55) .417 (112)
Perceived effort Interaction: F=1.39 , p=0.24
ORG 2.38 2.18 .302 (58) 2.28 (0.74)
LIST 2.82 2.28 .013 (58) 2.55 (0.84)
p value (df) .033 (58) .623 (57) .069 (116)
Satisfaction Interaction: F=0.80 , p=0.37
ORG 3.73 3.5 .160 (58) 3.62 (0.64)
LIST 3.33 3.37 .894 (58) 3.35 (0.95)
p value (df) .056 (52) .539 (49) .075 (103)
Intention to purchase Interaction: F=0.04 , p=0.85
ORG 3.43 3.27 .458 (56) 3.35 (0.86)
LIST 3.27 3.03 .389 (58) 3.15 (1.04)
p value (df) .487 (53) .365 (58) .253 (114)
Intention to return Interaction: F=0.98 , p=0.33
ORG 3.7 3.63 .769 (52) 3.67 (0.87)
LIST 3.42 3.67 .277 (58) 3.54 (0.88)
p value (df) .168 (56) .894 (57) .436 (118)
Intention to save effort in next visit Interaction: F=0.16 , p=0.69
ORG 3.8 3.27 .032 (47) 3.53 (0.96)
LIST 3.53 2.87 .005 (50) 3.2 (0.94)
p value (df) .130 (58) .162 (58) .057 (118)
Table 5 shows the priority order of these factors for each question from both oriental and western subjects. All average scores are beyond the medium level (“moderately important”). The factors were ranked by their average scores and the top one is the most important for most users. For the trustworthiness perception, the priority order of the five factors is the same between two groups of users: the website’s integrity (e.g., product quality, security, delivery service, etc) is the most important, followed by its reputation, price info, and competences in helping users find ideal products and providing good recommendations. However, when users were deciding whether to purchase a product on the website, for western users, the most important is the product’s price, while for oriental users, it is the integrity that most matters and the price quality is the third important following the website’s reputation.
Table 5. Average rates of five considered factors and their priority order for each question (the rate was given on a 5-
point Likert scale from “unimportant” to “very important”) Prio-rity order
Trustworthiness of an e-commerce website
Purchase intention in an e-commerce website
Return intention in an e-commerce website
OU WU OU WU OU WU
1 IN (4.69)
IN (4.36)
IN (4.61)
PR (4.19)
CO1 (4.38)
CO1 (3.88)
2 RE (4.69)
RE (4.17)
RE (4.61)
IN (4.07)
RE (4.07)
IN (3.864)
3 PR (4.07)
PR (3.71)
PR (4.34)
RE (3.83)
CO2 (3.88)
PR (3.862)
4 CO1 (3.78)
CO1 (3.36)
CO1 (4)
CO1 (3.56)
PR (3.81)
CO2 (3.69)
5 CO2 (3.31)
CO2 (3.14)
CO2 (3.37)
CO2 (3.05)
IN (3.72)
RE (3.63)
Integrity (IN) The website can keep promises they make in terms of product quality, security, delivery service, and privacy policy.
Reputation (RE) The website has a good reputation.
Price (PR) The website provides good prices on the products.
Competence 1 (CO1)
The website is capable of helping me effectively find a product I really like.
Competence 2 (CO2)
The website gives me some really good recommendations.
Note: the average score is in the bracket.
Although two competence aspects were ordered the least important than the others for general trustworthiness perception and purchase intention by both oriental and western participants, they went up to higher ranks when the question about return intention was asked. As a matter of fact, the most important factor leading to users’ return intention is that the website can help them effectively find a product they really like. Therefore, the five considered factors were found all important in building a trustworthy and beneficial e-commerce website. Furthermore, the website’s integrity, reputation and price quality will more likely positively impact users’ trustworthiness perception and conversion potential from visitors to buyers. On the other hand, its competence in providing intelligent decision aids to effectively help users make accurate choice will
81
particularly contribute to stimulating users’ intention to return to the website for repeated uses.
6. CONCLUSION We presented a user study that evaluated the organization-based recommender system in a cross-cultural experiment setup. It shows that people from both oriental and western cultures basically acted similarly in this system, in terms of their objective decision accuracy, interaction effort, and most of subjective measures. In particular, compared to the list view of recommendations, the organized view performed significantly more effectively in improving on users’ perception of recommendation quality and increasing their system-acceptance levels (i.e., perceived ease of use and perceived usefulness) and overall satisfaction. In-depth analysis concerning cultural impacts further shows that some of these significant phenomena were observably stronger among oriental participants, implying that oriental users will likely be more actively reacting to the organization interface once it replaces the traditional list view. Incorporating the outcomes of our study for general recommender system designs, we suggest two practical implications. One is that, combining our previous and current findings, we can conclude that the organization view of recommendation display should provide more substantial benefits to users against the list view, even to people from different cultural backgrounds. Its advantages shall be mainly applicable and scalable for the condition of large recommendation sets (such as the result page in some typical recommender websites like www.movielens.org), but also feasible for a small set if the amount of items is beyond a certain number. For the future work, it must be of interest to investigate what the threshold should be and how to accordingly customize the optimal “number” of categories. Another implication is for the user evaluation of recommender systems. To our knowledge, there are few studies about potential effects from the cultural influence on recommender interface designs. We did this cross-cultural user study not only with the purpose of verifying our technology’s universal effectiveness, but also aiming at establishing an evaluation framework involving all crucial objective and subjective criteria for assessing a recommender system’s true benefits. We believe that other researchers will profit from our evaluation methods when they conduct similar types of experiments.
7. ACKNOWLEDGMENTS We thank Prof. Yuanchun Shi and Yue Suo at Tsinghua University in China for their help of recruiting Chinese subjects. We are grateful to all participants for their time and patience.
8. REFERENCES [1] Agrawal, R., Imielinski, T. and Swami, A. 1993. Mining
association rules between sets of items in large databases. In Proc. ACM SIGMOD, 207–216.
[2] Barber, W. and Badre, A. 1998. Culturability: the merging of culture and usability. In Proc. Fourth Human Factors and the Web Conference.
[3] Chau, P. Y. K., Cole, M., Massey, A. P., Montoya-Weiss, M. and O'Keefe, R. M. 2002. Cultural differences in the online behavior of consumers. Communications of the ACM 45 (10), 138-143.
[4] Chen, L. and Pu, P. 2005. Trust building in recommender agents. In Proc. the Workshop at 2nd Inter. Conf. on E-Business and Telecommunication Networks (ICETE’02), 135-145.
[5] Chen, L. and Pu, P. 2007. Preference-based organization interfaces: aiding user critiques in recommender systems. In Proc. Inter. Conf. on User Modeling (UM’07), 77-86.
[6] Davis, F. D. 1989. Perceived usefulness, perceived ease of use and user acceptance of information technology. MIS Quarterly 13 (3), 319-340.
[7] Falk, R. F. and Miller, N. B. 1992. A Primer for Soft Modeling. The University of Akron Press.
[8] Gefen, D. 2000. E-commerce: the role of familiarity and trust. Inter. J. of Management Science 28, 725-737.
[9] Grabner-Kräuter, S. and Kaluscha, E.A. 2003. Empirical research in on-line trust: a review and critical assessment. Inter. J. of Human-Computer Studies 58, 783-812.
[10] Herlocker, J. L., Konstan, J.A. and Riedl, J. 2000. Explaining collaborative filtering recommendations. In ACM Conf. on Computer Supported Cooperative Work, 241-250.
[11] Keeney, R. and Raiffa, H. 1976. Decisions with Multiple Objectives: Preferences and Value Tradeoffs. Cambridge University Press.
[12] Koufaris, M., Kambil, A. and LaBarbera, P. A. 2001. Consumer behavior in web-based commerce: an empirical study. Inter. J. of Electronic Commerce 5 (2), 115-138.
[13] Lee, K., Joshi, K. and McIvor, R. 2007. Understanding multicultural differences in online satisfaction. In Proc. of ACM SIGMIS Conf. Computer Personnel Doctoral Consortium and Research (SIGMIS-CPR’07), 209-212.
[14] McCarthy, K., Reilly, J., McGinty, L. and Smyth, B. 2005. Experiments in dynamic critiquing. In Proc. Inter. Conf. on Intelligent User Interfaces (IUI’05), 175-182.
[15] McSherry, D. 2004. Explanation in recommender systems. In Workshop Proc. European Conf. on Case-Based Reasoning (ECCBR’04), 125-134.
[16] Pu, P. and Chen, L. 2005. Integrating tradeoff support in product search tools for e-commerce sites. In Proc. ACM Conf. on Electronic Commerce (EC’05), 269-278.
[17] Pu, P. and Chen, L. 2006. Trust building with explanation interfaces. In Proc. Inter. Conf. on Intelligent User Interfaces (IUI’06), 93-100.
[18] Sinha, R. and Swearingen, K. 2002. The role of transparency in recommender systems. In Extended Abstracts of Conference on Human Factors in Computing Systems (CHI’02), 830-831.
82