a cross-sectional study comparing torque teno virus
TRANSCRIPT
i
v
A Cross-Sectional Study Comparing Torque Teno Virus Infection and Bushmeat Exposure Among Pneumonia Patients: Sarawak,
Malaysia
by
Hudson Taylor Berkhouse
Duke Kunshan and Duke University Global Health Program
Date:_______________________ Approved:
___________________________
Gregory Gray, Supervisor
___________________________ Henry Lynn, Committee Member
___________________________ Qian Long, Committee Member
___________________________ Shenglan Tang, Committee Member
Thesis submitted in partial fulfillment of the requirements for the degree of
Master of Science in the Duke Global Health Institute in the Graduate School of Duke University
2017
ABSTRACT
[A Cross-Sectional Study Comparing Torque Teno Virus Infection and Bushmeat Exposure Among Pneumonia Patients: Sarawak, Malaysia]
by
Hudson Taylor Berkhouse
Duke Kunshan and Duke University Global Health Program
Date:_______________________ Approved:
___________________________
Gregory Gray, Supervisor
___________________________ Henry Lynn, Committee Member
___________________________ Qian Long, Committee Member
___________________________
Shenglan Tang, Committee Member
An abstract of a thesis submitted in partial fulfillment of the requirements for the degree
of Master of Science in the Duke Global Health Institute in the Graduate School of Duke University
2017

Copyright by Hudson Taylor Berkhouse
2017
iv
Abstract
Background: Torque Teno Virus (TTV) is ubiquitous, possibly zoonotic, and has
potential for clinical and global health research application. The goals of the current
study were to determine prevalence of TTV among pneumonia patients in two Malaysian
hospitals, compare results from qPCR and conventional PCR detection methods, and to
compare TTV infection against self-reported exposure to bushmeat products.
Methods: Medical officers obtained plasma, PBMC, and NP swab samples, along with
bushmeat exposure information from 34 pneumonia patients in Sibu and Kapit hospitals.
Samples were tested for TTV using qPCR. Results were corroborated using
conventional PCR. Cornfield’s and McNemar’s exact methods were used to analyze
infection by exposure, and agreement between PCR results respectively. Diagnostic
abilities of the qPCR test were analyzed using conventional PCR as the gold standard.
Results: Conventional PCR reported 17.65% TTV prevalence, while qPCR reported
91.18%. Household size (OR=0.00, 95% CI=0.00, 0.96) and gender (OR=infinity, 95%
CI=1.39, infinity) had statistically significant impacts on odds of infection. The qPCR
method showed 100% sensitivity, but 7.69% specificity.
Conclusions: Results suggest low prevalence of TTV within the study population, and
reaffirm findings by other researchers that smaller household size and being female are
associated with decreased odds of TTV infection. Though statistically insignificant,
indications that exposure to bushmeat in general increases odds of TTV infection should
be investigated further. Researchers must be aware of differences in diagnostic
capabilities between PCR methods for TTV detection when designing their own
diagnostic studies or conducting TTV related literature reviews.

v
Dedication
I would like to dedicate this manuscript to my Mother and Father, Rachel and Greg
Berkhouse. My Father’s profound analytical ability and unyielding pursuit of the truth
have always encouraged me to think deeply and objectively. My Mother’s incredible
capacity for compassion and deep emotional intelligence continue to teach me how to
understand those around me and collaborate with them. As is the case with all
accomplishments in my life, the current manuscript is the culmination of a process during
which I relied heavily on those abilities. I am blessed, proud, and tremendously thankful
to be Rachel and Greg Berkhouse’s son.
vi
Contents
Abstract .......................................................................................................................... iv List of Tables ................................................................................................................. vii Acknowledgements ...................................................................................................... viii 1. Introduction ................................................................................................................. 1
1.1 Torque Teno Virus: Evidence and Understanding ...................................................... 1
2. Methods ..................................................................................................................... 5
2.1 Setting ................................................................................................................................ 5
2.2 Participants ....................................................................................................................... 6
2.3 Patient Involvement ......................................................................................................... 8
2.4 Demographic, Medical, and Animal Exposure Survey ............................................... 9
2.8 Laboratory Assays and Result Corroboration ............................................................ 11
2.10 Data Input, Variable Definitions, and Analysis ........................................................ 13 3. Results ......................................................................................................................16
3.1 Demographic Characteristics ....................................................................................... 16
3.2 Prevalence of TTV Among Tissue Sample Types .................................................... 18
3.3 Comparison of TTV Results Between Molecular Assays ........................................ 21
3.4 Diagnostic Characteristics of the qPCR Test ............................................................ 21
3.5 Exposures Versus Infection With TTV ........................................................................ 24 4. Discussion .................................................................................................................26
4.1 Summary of Main Findings ........................................................................................... 26
4.2 Demographic Characteristics ....................................................................................... 26
4.3 Differences Between Results from the Two PCR Tests .......................................... 28
4.4 Exposures Versus Infection With TTV ........................................................................ 29
4.5 Implications for further research .................................................................................. 33
4.6 Study strengths and limitations .................................................................................... 35 5. Conclusion .................................................................................................................36 Appendix A: Enrolment Survey for the Combined Overall and Current Study ................38 References ....................................................................................................................42

vii
List of Tables
Table 1: Study population characteristics ......................................................................16
Table 2: TTV prevalence in plasma, PBMC, and NP swab samples according to qPCR results............................................................................................................................17
Table 3: TTV prevalence in plasma, PBMC, and NP swab samples according to conventional PCR results ..............................................................................................18
Table 4: Prevalence between sample types according to qPCR ....................................19
Table 5: Prevalence between sample types according to conventional PCR .................19
Table 6: Agreement between PCR tests ........................................................................20
Table 7: Diagnostic analysis of the qPCR method .........................................................21
Table 8: Plasma based infection with TTV and associations with various exposures, according to conventional PCR......................................................................................22
Table 9: Nasal cavity based infection with TTV and associations with various exposures, according to real-time PCR ............................................................................................23
Table 10: Frequency of bushmeat exposure and infection with TTV ..............................25
Table 11: Results from other TTV prevalence studies ...................................................31

viii
Acknowledgements
I would like to thank my advisor Dr. Gregory Gray, who encouraged me to attend Duke
Kunshan University in the first place and has been supporting and challenging me ever
since the start of my master’s studies. I am humbled by the hard work and dauntless
attitudes exhibited by the medical specialists and medical officers at both Sibu and Kapit
hospitals who simultaneously took care of their own responsibilities while helping my
team and I carry out our research. The same is true of the Hospital Sibu CRC staff, who
were always willing to help us with even the smallest logistic challenges. I am thankful to
the Duke One Health Team, both those who were with me in the field and at Duke
University, for their support and willingness to share their knowledge and experience
with me. Especially, I would like to thank Sarah Philo who worked extensively on
validation of results, and Dr. Ben Anderson who helped me refine this manuscript. I
would like to thank the other members of my thesis defense committee, Professor
Shenglan Tang, Professor Long Qian, and Professor Suiheng Lin for their support and
guidance. I would like to thank Dr. Wang Zhan who continued to provide our cohort with
statistical support even after leaving DKU. The entire faculty and staff at DKU have been
integral throughout the process of preparing this thesis and I am so thankful to them for
the time they spent working with me to refine the current study and manuscript. Thank
you my dear friend Sunah “Ruth” Park for your continuous support, encouragement, and
advice. Finally, I would like to thank my brothers and sisters, friends, and my dear
classmates at DKU for the encouragement and guidance they so generously gave. This
thesis is the work of many hands.

1
1. Introduction
1.1 Torque Teno Virus: Evidence and Understanding
Torque Teno Virus (TTV) is little understood, ubiquitous world-wide [1], possibly
zoonotic [2, 3], and has great potential for mutation toward pathogenicity [4, 5]. From a
global health perspective, understanding TTV’s virologic characteristics, associations
with other viruses, and how it spreads between animals can help to improve
epidemiological surveillance techniques [2, 6]. In light of these facts, the current study
was undertaken.
In 1997, scientists discovered the existence of a single-stranded DNA virus in the blood
sera of a Japanese posttransfusion-hepatitis patient [7, 8]. This virus was first called
Transfusion Transmitted Virus (TTV) because scientists believed it primarily infected
transfusion patients [9]. While the initials TTV have remained the same, they now stand
for Torque Teno Virus, a name based on the virus’s circular shape [8]. In the years
following TTV’s discovery, two additional TTV-like groups of virus strains were
discovered and named TT Mini Virus (TTMV) and TT Midi Virus (TTMDV). These groups
were provisionally classified together with TTV into the genus Anellovirus [10]. Within
these groups, there is a great deal of genetic diversity which researchers are continuing
to discover and clarify [11].
Even though they have been the focus of many studies since their discovery, very little
is known about the pathogenicity and etiology of these viruses. Duration of TTV viremia
is not clear, but there is evidence of both temporary and chronic infection in humans [7,
12, 13]. While researchers continue to find associations between TTV infection, TTV
viral load, and various medical conditions such as bronchopneumonia [14] and hepatitis

2
B and C [1, 9], these associations are not well understood. Nishiyama et al. (2014)
explains that the reason these associations and other aspects of TTV virology have yet
to be clarified is partially due to the fact that TTV is still very difficult to culture [15].
Despite this difficulty, the results of several studies suggest that TTV has the potential
to be used in epidemiological surveillance techniques, with ramifications for global health
in both medicine and research. Manzin et al. (2015) explain that, “It was recently
suggested that the dynamics of replication of human TTVs can correlate with immune
competence of the host, and that the viral load can be considered as a possible
biomarker of immune responsiveness [2].” In other words, TTV has the potential to be
used as an indicator of immune-system competence in immuno-compromised
individuals [16].
There is mixed evidence regarding TTV prevalence around the world. It is unclear how
much of the variability in prevalence study results is due to actual differences in
prevalence between populations, or to differences in the diagnostic abilities of the tests
used to detect TTV. Studies have been conducted in various parts of the world which
seek to estimate TTV prevalence in the plasma of different populations, but no clear
conclusion has been reached. For example, one study conducted in Brazil found plasma
TTV prevalence of 5% and 31% between sub-populations within the same community
[17], while other studies conducted in Pakistan, Japan and Russia all reported
prevalence greater than 90% [18-20]. Global trends in prevalence are not clear, but it is
understood that TTV is ubiquitous among human populations on a global scale [1].
Some researchers have even suggested that TTV could be used as an indicator of
anthropogenic pollution [16]. While much research must still be done, the current
consensus is that the majority of humans are infected with TTV [1].

3
Anelloviruses have also been discovered in several tissue types besides plasma,
including: peripheral blood mononuclear cells (PBMC) [21], nasal secretions [14] and
others [1]. Outside the body, TTV DNA has been detected in other locations including
but not limited to table tops and air samples [22], processed meat [23], and pork
sausage [24].
Active infection with TTV is not unique to humans. Several recent studies discovered
new strains of these viruses in domesticated animals such as cats, dogs, and pigs [10],
and in wild animals such as rodents [15] and bats [25]. Some studies have even shown
evidence of infection with very similar TTV strains among humans and several kinds of
farm animals [3]. Infection in humans and animals with such similar viruses has led
researchers to question if some TTV strains are zoonotic in nature [2, 3, 26, 27]. This is
especially disconcerting given that zoonotic viral events provide tremendous potential for
genomic mutations, and for non-pathogenic viruses to become virulent [4, 5]. Given the
great of diversity that already exists between strains of TTV and TTV like viruses,
researchers are concerned that transmission of these viruses between humans and
animals could easily lead to genomic mutations with pathogenic consequences.
TTV infection among animals also has potential for application in health research.
Manzin et al. (2015) explain that, “[TTV] could be used as a model to evaluate the
dynamics and the effects of global trade on viral heterogeneity, and to understand how
live animal movement affects viral evolution [2].” A better understanding of TTV infection
among animals could help epidemiologists predict and combat emerging zoonotic
diseases [6].
Because TTV is globally ubiquitous, potentially zoonotic, could possibly become
pathogenic, and has great potential for clinical and global health research application,

4
more studies must be done to clarify its epidemiology and etiology. Firstly, prevalence
studies should be conducted in previously unmeasured communities to complete the
patchy map of worldwide prevalence which is currently available [1, 28]. Secondly,
current diagnostic tests must continue to be validated and refined so that measuring
error is limited, and accurate prevalence can be reported [19, 28]. Thirdly, further
research must also be conducted regarding the three-way interaction between humans,
animals, and TTV [2, 3]. While some recent studies have been looking for molecular
evidence of infection with similar strains of TTV between humans and animals [29, 30],
few studies have been conducted which compare prevalence of infection within a
population to that population’s contact with various types of animals as exposure data.
This is especially true for wild animal species. Information of this kind could verify
conjecture regarding TTV’s zoonotic nature, and suggest ways that zoonotic
transmission might occur.
To further the three goals described above, the current study was designed with three
primary objectives in mind. The first objective was to determine the prevalence of TTV
infection within the study sample by running two types of commonly used tests. The
most commonly used method for diagnosing TTV is polymerase chain reaction (PCR).
This method takes target DNA which has been extracted from samples and amplifies it
for detection purposes. The two types of PCR used in the current study were real-time
(qPCR) and conventional PCR. This study’s second objective was to statistically
compare qPCR and conventional PCR test results to better understand their diagnostic
abilities relative to one another. The third was to compare the prevalence of TTV
infection in the study population with self-reported past exposure to various types of wild
animal species and their meat products in search of associations.

5
2. Methods
2.1 Setting
The current study was conducted in two hospitals in two cities in the state of Sarawak,
on the portion of Borneo Island which belongs to Malaysia. These hospitals were chosen
because of research relationships between the medical specialists there and the
administrators of Duke University’s One Health Laboratory. Because these locations
were chosen for convenience rather than geographic or epidemiological factors, it is not
reasonable to assume that the results of this study can be generalized to other parts of
Malaysia. However, while a few TTV studies have been conducted in Indonesia [31, 32],
little to no published TTV research has been done in any area of Malaysia. Therefore,
the value of conducting TTV research in the two cities chosen is derived from producing
prevalence data in a country where none previously existed, rather than producing data
which can be nationally generalized.
The two hospitals involved in data collection are located in two cities in the state of
Sarawak. Sibu Hospital, the primary field site where most laboratory work was
conducted, is in Sibu city in Southwestern Sarawak on the Rajang river. The nearly
250,000 residents living in Sibu are 10% ethnically Malay, 47% Chinese, 28% Iban and
15% other minorities [33]. Sibu Hospital is a government run institution with 750 beds
which also houses a Clinical Research Center and serves as a satellite campus for
medical students attending Segi University.
The Duke University One Health Team together with Sibu Hospital’s Clinical Research
Center staff and the staff of Segi University co-founded a level 2 biohazard lab on the
Segi University satellite campus premises which are adjacent to Sibu Hospital. Most lab
work done for the current study was conducted in that laboratory. However, because
6
certain pieces of equipment did not arrive until after the study began, specimen storage
and all procedures requiring a biosafety cabinet were initially conducted in other areas of
Sibu Hospital.
The second hospital involved in this study was Kapit Hospital, in Kapit city. Kapit is
located three hours inland by boat from Sibu on the Rajang river. Kapit is a smaller, rural
town with a population of just over 56,000 residents who are 4% ethnically Malay, 7%
Chinese, 82% Iban, and 7% other minorities [33]. Kapit Hospital contains 134 beds.
Critically ill patients who cannot be treated at Kapit Hospital are often escorted by boat
or helicopter to Sibu Hospital where they receive further treatment.
2.2 Participants
Participants enrolled in the current 2-month study (N=34) were a subset of patients
enrolled in a larger 12-month study (N=138) seeking to determine the viral etiology of
pneumonia in patients admitted to both Sibu and Kapit hospitals. For that reason, all
patients included in this study were clinically diagnosed pneumonia patients. The
specific inclusion and exclusion criteria as well as the definition of clinical pneumonia
used in this study were based upon previous research studies done at Sibu Hospital,
and the requirements set forth by our Malaysian collaborators.
Because enrollment in the current study involved obtaining a blood sample, the
Malaysian Ministry of Health stipulated that children under five years of age were not
eligible for inclusion. However, this restriction did not apply to the broader study which
only involved the taking of a nasopharyngeal (NP) swab sample from enrolled patients
without taking blood. Hence, any patients under the age of five (N=95) or who declined
to permit phlebotomy (N=9) were enrolled into the broader study and excluded from the

7
current study. Because of constraints on shared laboratory resources, testing was not
conducted on NP swabs which belonged to patients that did not provide blood samples.
Inclusion criteria:
Children 5-17 years of age were eligible for recruitment if all of the following were true:
• They were admitted to Sibu or Kapit hospital;
• Had evidence of acute infection, defined as reported fever or chills, documented fever or hypothermia, or leukocytosis or leukopenia;
• Had evidence of an acute respiratory illness, defined as new cough or sputum production, chest pain, dyspnea, tachypnea, abnormal lung examination, or respiratory failure;
• A parent or legal guardian provided written informed consent. In addition to parental consent, a signed assent document was sought from children 7 to 17 years of age.
• The evidence of illness was consistent with pneumonia as assessed by means of chest radiography within 72 hours before or after admission if possible.
Adults 18 years of age or more were eligible for recruitment if all of the following were true:
• They were admitted to Sibu or Kapit hospital on the basis of a clinical assessment by the treating clinician;
• Had evidence of acute infection, defined as reported fever or chills, documented fever or hypothermia, leukocytosis or leukopenia, or new altered mental status;
• Had evidence of an acute respiratory illness, defined as new cough or sputum production, chest pain, dyspnea, tachypnea, abnormal lung examination, or respiratory failure;
• Had evidence consistent with pneumonia as assessed by means of chest radiography by the clinical team within 48 hours before or after admission if possible.
Exclusion criteria:
Children 5-17 years of age were ineligible for recruitment if any of the following were true:
• If they had been hospitalized recently (<7 days for immunocompetent children and <90 days for immunosuppressed children)
• If they had already been enrolled in this study within the previous 28 days
• If they resided in an extended-care facility
• If they had an alternative diagnosis of a respiratory disorder
• If they had a tracheostomy tube
• If they had cystic fibrosis

8
• If they had cancer with neutropenia
• If they had received a solid-organ or hematopoietic stem-cell transplant within the previous 90 days
• If they had active graft-versus-host disease or bronchiolitis obliterans
• If they had human immunodeficiency virus infection with a CD4 cell count of less than 200 per cubic millimeter (or a percentage of CD4 cells <14%).
Adults 18 years of age or more were ineligible for recruitment if any of the following were true:
• If they had been hospitalized recently (<28 days for immunocompetent patients and <90 days for immunosuppressed patients),
• If they had already been enrolled in this study within the previous 28 days
• If they were functionally dependent nursing home residents,
• If they had a clear alternative diagnosis
• If they had undergone tracheotomy
• If they had a percutaneous endoscopic gastrostomy tube
• If they had cystic fibrosis
• If they had cancer with neutropenia,
• If they had received a solid-organ or hematopoietic stem-cell transplant within the previous 90 days,
• If they had active graft-versus-host disease
• If they had bronchiolitis obliterans
• If they had human immunodeficiency virus infection with a CD4 cell count of less than 200 per cubic millimeter.
2.3 Patient Involvement
When doctors in either hospital identified patients who were eligible for recruitment, one
of the twelve medical officers collaborating in this study was notified. The medical officer
would then approach the patient, briefly describe the study, and ask if the patient might
be interested in participating. If the patient agreed to hear more, the medical officer
would then provide them with an informed consent document in a language of their
choosing and answer any questions they had. Study materials were available in English,
Mandarin, and Malay. For patients who were unable to read, the medical officer would
read all study materials aloud. Two alternate versions of the patient information sheet
written in increasingly simplified language were available for 13-17 year olds and 7-12

9
year olds. For patients 5-17 years of age, consent was also requested from either a
parent or legal guardian. Only patients that agreed to participate and signed the patient
information sheet, provided verbal assent, or were given permission by a parent or
guardian as appropriate were enrolled in the study. If eligible patients gave assent, the
medical officer would then administer a questionnaire, and collect NP swab and blood
samples.
The patient’s active participation in the study included enrollment, completion of a
questionnaire, and permitting the collection of an NP swab and a blood sample.
Enrollment took approximately 45 minutes. This study was approved by the institutional
review boards of Duke University and the Malaysian Ministry of Health’s National
Medical Research Register.
2.4 Demographic, Medical, and Animal Exposure Survey
A 16-question survey was completed by each patient enrolled in the current study
[Appendix A]. This survey was used by both the broader study and the current study and
included questions over demographic information, medical history and treatment, various
types of animal exposure, and two perception questions. The animal exposure section
included one question regarding occupational exposure to domestic animals.
The remaining six animal exposure questions involved the patient’s exposure to wild
animals and their meat. The information gathered from those six questions are
henceforth collectively referred to as “bushmeat exposure data”. The subject matter of
these questions was primarily adapted from Kilonzo et al. (2013) [34]. Kilonzo et al.
classified exposure to bushmeat into three categories and ranked them according to the
risk of zoonotic disease contraction that each exposure poses: butchering (high risk),
hunting (medium risk), and consumption (low risk). This rank order is further supported

10
by Lebreton et al. (2012) who explained that the level of risk an exposure poses is
primarily a function of how much contact with wild animal blood that exposure involves
[5]. The bushmeat exposure data collected in this study’s questionnaire is also organized
according to these three risk levels. One set of questions asked how many days or times
the patient engaged in one of the three exposures during their lifetime, and a second set
of questions asked to which animals or their meat were the patients exposed. The list of
animals used in the survey was generated by searching online to see which animals
inhabit Sarawak, as well as asking local collaborators about local hunting, butchering,
and eating habits.
2.5 Nasopharyngeal Swab Sampling
Once the patient completed filling out the questionnaire, the medical officer then
collected an NP swab sample. This was accomplished by tilting the patient’s head back
45˚, inserting a VWR flexible mini-tip flocked swab (VWR, Radnor, PA) until the tip
reached approximately halfway between the patient’s nostril and ear, rotating the swab
slowly, and removing it. After the NP swab was collected, it was placed in 3ml of viral
transport media and stored in a hospital ward refrigerator (for no more than 24 hours)
until it could be transported to a -80˚ freezer and stored there.
2.6 Blood Sampling
After the medical officer obtained the NP swab, he or she collected a blood specimen.
In accordance with the regulations stipulated by the Malaysian Ministry of Health, 2ml of
blood were obtained from children 5-12 years of age while 5ml of blood were obtained
from patients 13 years of age and older. Blood was collected in BD Vacutainer® CPT™
Mononuclear Cell Preparation Tubes (VWR, Radnor, PA) that permitted the separation

11
of PBMCs and plasma through centrifugation. For each specimen collected, the plasma
was pipetted into two equal aliquots in 2ml cryovials. Similarly, the PMBC sample was
aliquoted into a separate 2ml cryovial. All three vials were labeled with their
corresponding Case ID numbers, their respective sample type designators (PNA PL1,
PNA PL2, PNA PBMC) and preserved at -800C until thawed for molecular study.
2.8 Laboratory Assays and Result Corroboration
Currently, the most effective way to determine if a specimen is infected or
contaminated with TTV is to first perform polymerase chain reaction (PCR). This process
multiplies copies of target DNA or RNA which are present in the sample, making them
easier to detect. Samples collected during the current study were analyzed with two
types of PCR: real-time PCR (qPCR), and conventional PCR.
When samples were initially collected in Malaysia, they were first tested by qPCR
because that was the platform available for use in the lab there. The primary advantage
of qPCR is that it is fast and can detect relatively few copies of target DNA and RNA.
This means that it is a highly sensitive test. However, qPCR also has its draw backs. To
detect the presence of a virus, it relies on probes which emit florescence when they bind
to target strands of DNA or RNA. It is possible for these probes to bind to non-target
materials, which is known as “non-specific binding”. This can result in a false-positive
diagnosis, meaning that qPCR is not as specific as some other types of PCR.
In order to prevent the reporting of false-positive results, all samples collected during
the current study were corroborated at Duke University’s One Health Lab using
conventional PCR. When conventional PCR is used to multiply nucleic acid targets, its
products must be analyzed using gel-electrophoresis. This process is less likely to result
in false-positives, meaning that conventional PCR is more specific than qPCR. However,

12
conventional PCR requires higher concentrations of nucleic acid targets to report a
positive result, making it a relatively less sensitive test. In summary, we are confident
that negative qPCR results are truly negative, and that positive conventional PCR results
are truly positive.
Once a PCR platform has been decided on, researchers must then choose which set of
primers and probes to utilize. TTV related primers and probes can be classified into two
groups based on the part of the TTV genome from which they are derived: those derived
from the open reading frame (ORF), and those derived from the highly conserved
untranslated region (UTR) [13]. Studies which rely on ORF derived primers and probes
are only able to detect a restricted number of TTV strains [28]. On the other hand, UTR
derived primers and probes are regarded as having the ability to detect all known TTV
and TTV-like viral strains [13]. Hence, studies which employ UTR derived primers and
probes usually report much higher prevalence. Both sets of TTV primers and probes
used in the current study were UTR derived.
From the 34 patients enrolled, 34 plasma, 33 PBMC, and 34 NP swab samples were
collected. One less PBMC specimen was collected and tested because it could not be
separated from the patient’s erythrocytes. This was due to poor post-collection mixing of
that patient’s blood with the anti-coagulation solution present in the blood collection tube.
After samples were collected, joint DNA/RNA extractions were performed on thawed
plasma (n=34), PBMC (n=33), and NP swab (n=34) samples using the QIAamp cador
Pathogen Mini Kit (Qiagen, Valencia, CA) according to the operating procedures
provided by the manufacturer. DNA extractions from all three types of samples were
assessed by qPCR for the presence of TTV DNA through the use of the SsoAdvanced
Universal Probes Supermix Real-Time PCR Kit (Bio-Rad, Kidlington, UK) [35],

13
performed on a Bio-Rad CFX96 TouchTM Real-Time Detection System with a C1000
thermal cycler (Bio-Rad, Kidlington, UK). The TTV primers and probe used were those
described by Tokita et al. (2002): Forward primer-5’-TGG CCC GCA GTA TTC TGA TT -
3’, Backward primer-5’-CAG CTG GGA CAG CAG TTG AG-3’, and Probe-FAM-5’ AGT
CAA GGG GCA ATT CGG GCT CGG GA-3’-IABQ [36].
At the end of the 2-month collection period in Malaysia, aliquots of original plasma
(n=34), PBMC (n=33), and NP swab (n=34) samples were supplemented with PBS to a
total volume of 1ml and shipped to Duke University for assay result corroboration. The
cold chain was preserved during transit. Extractions were performed on the samples
using the QIAmp DNA Blood Mini Kit (Qiagen, Valencia, CA) according to the standard
operating procedures provided by the manufacturer.
Conventional PCR was then used to determine if TTV or TTV-like viral DNA was
present in each sample. This was accomplished using the Invitrogen Platinum Taq DNA
Polymerase Kit (Fisher Scientific, Pittsburgh, PA) on a Biorad C1000 Touch™ thermal
cycler (Bio-Rad Laboratories, Hercules, CA). The primers used were those described by
Ninomiya et al. (2008) for the universal detection of TTV and TTV-like viral DNA: Sense-
ACW KMC GAA TGG CTG AGT TT, Sense-RGT GRC GAA TGG YWG AGT TT,
Antisense-CCC KWG CCC GAR TTG CCC CT, and Antisense-AYC TWG CCC GAA
TTG CCC CT [19]. Products were detected using gel electrophoresis.
2.10 Data Input, Variable Definitions, and Analysis
Survey information and PCR assay results were entered into REDCap (Research
Electronic Data Capture) [37]. This online research tool, with access granted by Duke
University, was used to manage all data collected in the field. REDCap was also used to
export data collected during this study to StataSE 15 for statistical analysis [38].

14
Following are the definitions of some of the variables used for statistical analysis in the
current study which require explanation:
Bushmeat exposure: This variable is defined by any self-reported, lifetime exposure
to either hunting or butchering. Any individuals that reported ever having hunted or
butchered an animal listed in the survey were included in the exposed group.
TTV status: Status of infection with TTV was based on conventional PCR test results
for plasma samples. Plasma was chosen over the other two sample types for four
reasons: more TTV prevalence studies investigate plasma than PBMC or NP swab
samples; more plasma samples than PBMC samples were collected; all positive PBMC
samples belonged to individuals who were also plasma positive; and the complete lack
of positive NP swab results.
Exposed to mammal bushmeat: Any individuals that reported ever having hunted or
butchered any of the mammals listed in the survey were included in the exposed
category of this variable. Inclusion in the exposed group does not mean that an
individual was exclusively exposed to mammal bushmeat. The two variables “Exposed
to reptile bushmeat” and “Exposed to amphibian bushmeat” were similarly constructed.
Has a pulmonary disease: This variable was created by grouping together individuals
with a self-reported history of either asthma, chronic obstructive airway disease (COAD),
or both. Individuals that reported having neither condition were grouped into the “no”
category.
Difference in mean age between exposure groups was analyzed using bootstrapping
methods to calculate bias-adjusted 95% confidence intervals (95% CI) around point
estimates of difference [Tables 1 and 9]. Associations between binomial variables were
analyzed using Cornfield’s exact method for small sample sizes to generate unadjusted

15
odds ratios (OR) and their 95% CIs [Tables 1 and 9]. Because exact 95% CIs could not
be calculated for variables containing sub-groups with zero observations, CIs for those
variables were approximated with Cornfield’s method for normally-distributed data.
McNemar’s Exact Test for paired data was used to analyze agreement between qPCR
and conventional PCR results and to measure agreement between the three sample
types tested by calculating differences in marginal frequencies [Tables 4-6]. Using
conventional PCR as the gold standard, a two-by-two table was constructed to calculate
the sensitivity and specificity of the qPCR method utilized in this study [Table 7].
16
3. Results
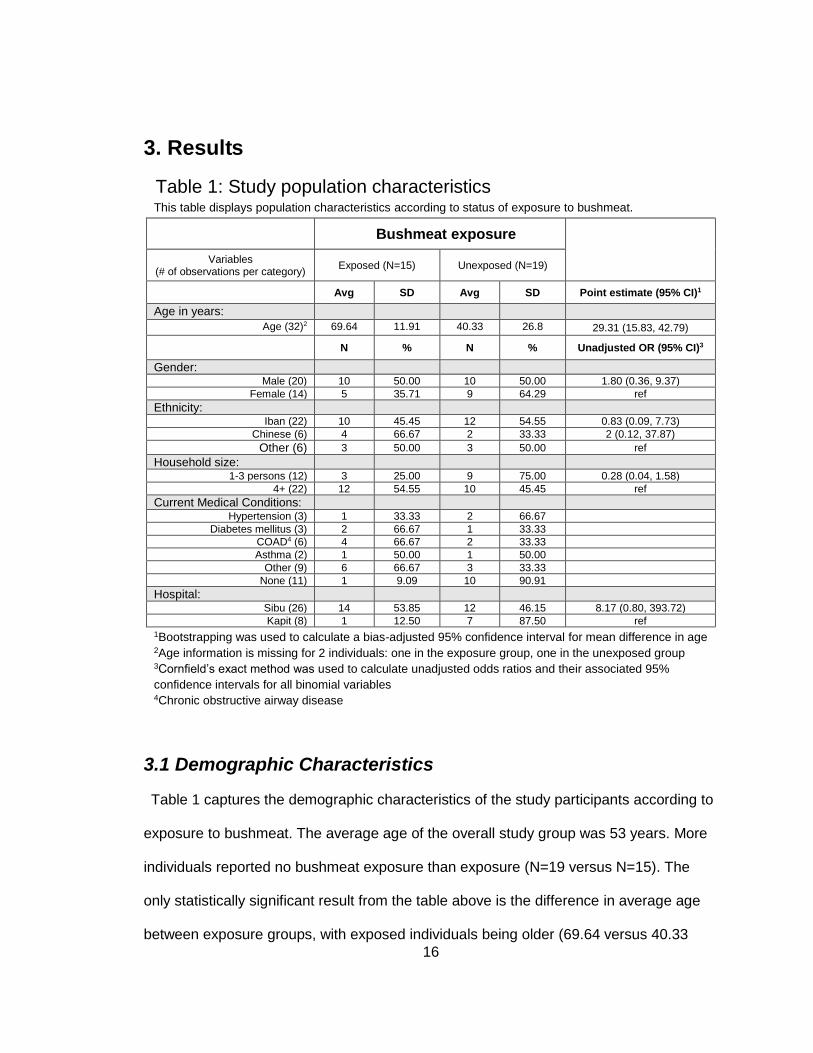
Table 1: Study population characteristics This table displays population characteristics according to status of exposure to bushmeat.
Bushmeat exposure
Variables (# of observations per category)
Exposed (N=15) Unexposed (N=19)
Avg SD Avg SD Point estimate (95% CI)1
Age in years:
Age (32)2 69.64 11.91 40.33 26.8 29.31 (15.83, 42.79)
N % N % Unadjusted OR (95% CI)3
Gender:
Male (20) 10 50.00 10 50.00 1.80 (0.36, 9.37)
Female (14) 5 35.71 9 64.29 ref
Ethnicity:
Iban (22) 10 45.45 12 54.55 0.83 (0.09, 7.73)
Chinese (6) 4 66.67 2 33.33 2 (0.12, 37.87)
Other (6) 3 50.00 3 50.00 ref
Household size:
1-3 persons (12) 3 25.00 9 75.00 0.28 (0.04, 1.58)
4+ (22) 12 54.55 10 45.45 ref
Current Medical Conditions:
Hypertension (3) 1 33.33 2 66.67
Diabetes mellitus (3) 2 66.67 1 33.33
COAD4 (6) 4 66.67 2 33.33
Asthma (2) 1 50.00 1 50.00
Other (9) 6 66.67 3 33.33
None (11) 1 9.09 10 90.91
Hospital:
Sibu (26) 14 53.85 12 46.15 8.17 (0.80, 393.72)
Kapit (8) 1 12.50 7 87.50 ref
1Bootstrapping was used to calculate a bias-adjusted 95% confidence interval for mean difference in age 2Age information is missing for 2 individuals: one in the exposure group, one in the unexposed group 3Cornfield’s exact method was used to calculate unadjusted odds ratios and their associated 95%
confidence intervals for all binomial variables 4Chronic obstructive airway disease
3.1 Demographic Characteristics
Table 1 captures the demographic characteristics of the study participants according to
exposure to bushmeat. The average age of the overall study group was 53 years. More
individuals reported no bushmeat exposure than exposure (N=19 versus N=15). The
only statistically significant result from the table above is the difference in average age
between exposure groups, with exposed individuals being older (69.64 versus 40.33

17
years of age; 95% CI=15.83, 42.79). Most study participants were either Iban (64.71%)
or Chinese (17.65%), and lived with four or more people (64.71%). A greater proportion
of men than women reported bushmeat exposure (50% versus 35.71%, OR=1.8; 95%
CI=0.36, 9.37). Those patients enrolled at Sibu Hospital (76.47%) had much higher odds
of having been exposed to bushmeat (OR=8.17; 95% CI=0.80, 393.72). A little less than
50% of ethnically Iban participants reported exposure to bushmeat (OR=0.83, 95% CI=
0.09, 7.73), while more than 60% of Chinese individuals reported exposure (OR=2, 95%
CI=0.12, 37.87).
While not shown in the table above, bushmeat exposure was also measured among
participants in the broader-study who were excluded from the current study. Out 104
participants, 90 reported no exposure, 4 reported being exposed, and exposure data
was missing for 10. Because 90% of excluded participants were five or younger, it
stands to reason that the prevalence of hunting and butchering bushmeat would be low
within this group.
Table 2: TTV prevalence in plasma, PBMC, and NP swab samples according to qPCR results
Results Plasma
n=34 (%) PBMC
n=33 (%) NP Swabs n=34 (%)
Positive 31 (91.18) 30 (88.24) 23 (67.65)
Negative 2 (5.88) 2 (5.88) 7 (20.59)
Suspect positive 1 (2.94) 1 (2.94) 4 (11.76)
Not tested (0) (1=2.94%) (0)
Presence of TTV was determined by running qPCR on each sample. Sample positivity was classified according to if and when probe fluorescence peaked during the PCR Run, known as the critical threshold (CT) value: CT<37=positive; CT from 37-40=suspect positive; CT>40=negative.

18
Table 3: TTV prevalence in plasma, PBMC, and NP swab samples according to conventional PCR results
Results Plasma
n=34 (%) PBMC
n=33 (%) NP Swabs n=34 (%)
Positive 6 (17.65) 4 (12.12) 0 (0)
Negative 28 (82.35) 29 (87.88) 34 (100)
Not Tested (0) (1=2.94%) (0)
Presence of TTV was determined by running conventional PCR on each sample. Nucleic acid products were then detected using gel electrophoresis.
3.2 TTV prevalence and agreement between sample types
According to the qPCR test results [Table 2], the majority of study participants were
positive for infection with TTV across all three biological sample types. Out of 34 plasma
samples tested, 31 (91.18%) were positive, 2 (5.88%) were negative, and 1 (2.94%) was
suspect positive. Of the 33 PBMC samples tested, 30 (88.24%) were positive, 2 (5.88%)
were negative, and 1 (2.94%) was suspect positive. Results for NP swabs were different
in that, out of 34 samples tested, only 23 (67.65%) were positive, while 7 (20.59%) were
negative, and 4 (11.76%) were suspect.
The conventional PCR assays run at Duke to corroborate the tests run in Malaysia
produced very different results [Table 3]. For the same numbers of samples tested,
plasma yielded 6 (17.65%), PBMCs 4 (12.12%), and NP swabs 0 positive results.
Because conventional PCR products were analyzed using gel electrophoresis rather
than florescence and cycle thresholds, no suspect-positive values were produced. All
four of the positive PBMC samples came from individuals who were also plasma
positive.

19
Table 4: Prevalence between sample types according to qPCR
This table shows the level of agreement between the three different sample types tested according to real-time PCR results.
Plasma
Positive (%) Negative (%) Total Difference in marginal frequencies (95% CI)1
PBMC
Positive 28 (90.32) 1 (3.22) 29
-0.032 (-0.173, 0.109) Negative 2 (6.45) 0 2
Total 30 1 312
Plasma
NP Swabs
Positive 21 (72.41) 1 (3.44) 22
-0.172 (-0.374, 0.029) Negative 6 (20.69) 1 (3.44) 7
Total 27 2 292
PBMC
NP Swabs
Positive 22 (78.57) 1 (3.57) 23
0.107 (-0.080, 0.294) Negative 4 (14.29) 1 (3.57) 5
Total 26 2 282
1McNemar’s exact test for paired data was used to calculate differences in marginal frequencies (marginal difference) between results for different specimens from the same individual 2Samples which produced suspect-positive qPCR results were treated as missing and not included in analysis: plasma (1), PBMC (1), NP swabs (4)
Table 5: Prevalence between sample types according to conventional PCR This table shows the level of agreement between the three different sample types tested according to conventional PCR results.
Plasma
Positive (%) Negative (%) Total Difference in marginal frequencies (95% CI)1
PBMC
Positive 4 (12.12) 2 (6.06) 6
0.061 (-0.051, 0.172) Negative 0 27 (81.81) 27
Total 4 29 332
Plasma
NP Swabs
Positive 0 0 0
-0.176 (-0.334, -0.019) Negative 6 (17.64) 28 (82.35) 34
Total 6 28 34
PBMC
NP Swabs
Positive 0 0 0
-0.121 (-0.263, 0.020) Negative 4 (12.12) 29 (87.88) 33
Total 4 29 33
1McNemar’s exact test for paired data was used to calculate differences in marginal frequencies (marginal difference) between results for different specimens from the same individual

20
Tables 2 and 3 suggest a high-to-low prevalence gradient across plasma, PBMC, and
NP swab samples respectively, as reported by both real-time and conventional PCR.
However, statistical analysis of agreement between results for different sample types
produced by the same PCR method [Tables 4 and 5] suggests that this gradient is not
statistically significant. The only statistically significant difference in prevalence between
sample types is that between plasma and NP swab samples as reported by conventional
PCR (marginal difference=-0.176, 95% CI=-0.334, -0.019).
Table 6: Agreement between PCR tests
This table shows level of agreement between results from the qPCR and conventional PCR tests for each of the three sample types tested.
qPCR Conventional PCR Total Difference in marginal frequencies (95% CI)1
Plasma Samples
Positive (%) Negative (%) Total
0.788 (0.618, 0.958) Positive 5 (15.15) 26 (78.78) 31
Negative 0 (0) 2 (6.06) 2
Total 5 28 332
PBMC Samples
Positive (%) Negative (%) Total
0.813 (0.646, 0.979) Positive 4 (12.5) 26 (81.25) 30
Negative 0 (0) 2 (6.25) 2
Total 4 28 322
NP Swab Samples
Positive (%) Negative (%) Total
0.767 (0.506, 6.066) Positive 0 (0) 23 (76.67) 23
Negative 0 (0) 7 (23.34) 7
Total 0 30 302
1McNemar’s exact test for paired data was used to calculate differences in marginal frequencies (marginal difference) between conventional PCR and qPCR test results for all three sample types 2Samples which produced suspect-positive qPCR results were treated as missing and not included in analysis: plasma (1), PBMC (1), NP swabs (4)
21
3.3 Comparison of TTV Results Between Molecular Assays
Table 6 shows that the proportion of identical classification between qPCR and
conventional PCR was <0.25 for all three types of samples. PBMC results produced the
greatest disagreement between PCR tests (marginal difference=0.813; 95% CI=0.646,
0.979). The difference between plasma results was second largest (marginal
difference=0.788; 95% CI=0.618, 0.958). Disagreement in PCR results for NP swab
samples was similar to that for plasma samples, but with a much wider accompanying
95% confidence interval (marginal difference=0.767, 95% CI=0.506, 6.066).
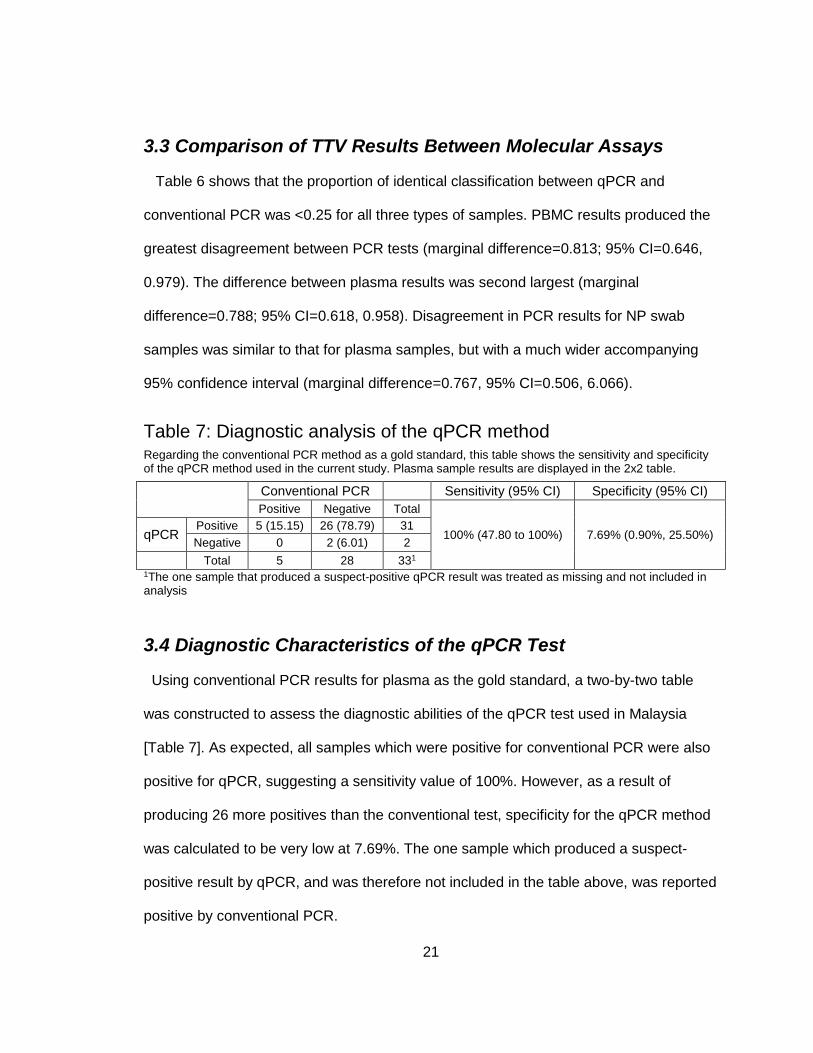
Table 7: Diagnostic analysis of the qPCR method Regarding the conventional PCR method as a gold standard, this table shows the sensitivity and specificity of the qPCR method used in the current study. Plasma sample results are displayed in the 2x2 table.
Conventional PCR Sensitivity (95% CI) Specificity (95% CI)
Positive Negative Total
100% (47.80 to 100%) 7.69% (0.90%, 25.50%) qPCR Positive 5 (15.15) 26 (78.79) 31
Negative 0 2 (6.01) 2
Total 5 28 331
1The one sample that produced a suspect-positive qPCR result was treated as missing and not included in analysis
3.4 Diagnostic Characteristics of the qPCR Test
Using conventional PCR results for plasma as the gold standard, a two-by-two table
was constructed to assess the diagnostic abilities of the qPCR test used in Malaysia
[Table 7]. As expected, all samples which were positive for conventional PCR were also
positive for qPCR, suggesting a sensitivity value of 100%. However, as a result of
producing 26 more positives than the conventional test, specificity for the qPCR method
was calculated to be very low at 7.69%. The one sample which produced a suspect-
positive result by qPCR, and was therefore not included in the table above, was reported
positive by conventional PCR.

22
Table 8: Plasma based infection with TTV and associations with various exposures, according to conventional PCR
This table displays prevalence of TTV analyzed according to different exposure variables. An individual was considered to be TTV "positive" if their plasma was found to be positive for TTV by conventional PCR testing.
TTV status
Variables (# of observations) Positive (N=6) Negative (N=28)
Avg SD Avg SD Point estimate (95% CI)1
Age in years:
Age (322) 56.33 26.1 52.42 26.33 3.91 (-17.91, 25.73)
N % N % Unadjusted OR (95% CI)3
Exposed to any bushmeat:
Yes (15) 4 26.67 11 73.33 3.09 (0.35, 38.38)
No (19) 2 10.53 17 89.47 ref
Exposed to mammal bushmeat:
Yes (14) 3 21.43 11 78.57 1.55 (0.17, 13.58)
No (20) 3 15.00 17 85 ref
Exposed to reptile bushmeat:
Yes (11) 4 36.36 7 63.64 6.00 (0.65, 75.19)
No (23) 2 8.70 21 91.30 ref
Exposed to amphibian bushmeat:
Yes (9) 1 11.11 8 88.89 0.50 (0.01, 5.72)
No (25) 5 20.00 20 80.00 ref
Exposure to butchering:
20+ days (10) 1 10.00 9 90.00 0.63 (0.01, 9.38)
1-19 days (4) 2 50.00 2 50.00 5.67 (0.28, 99.66)
0 days (20) 3 15.00 17 85.00 ref
Exposure to hunting:
20+ days (8) 2 25.00 6 75.00 2.22 (0.15, 23.92)
1-19 days (3) 1 33.33 2 66.67 3.33 (0.04, 80.80)
0 days (23) 3 13.04 20 86.96 ref
Gender:
Male (20) 6 30.00 14 70.00 ∞ (1.39, ∞)
Female (14) 0 0.00 14 100.00 ref
Ethnicity:
Iban (22) 2 9.09 20 90.90 0.2 (0.01, 3.78)
Chinese (6) 2 33.33 4 66.67 1 (0.05, 20.82)
Other (6) 2 33.33 4 66.67 ref
Household size:
1-3 (12) 0 0.00 12 100.00 0.00 (0.00, 0.96)
4+ (22) 6 27.27 16 72.73 ref
Has a pulmonary disease:
yes (8) 2 25.00 6 75.00 1.83 (0.13, 16.65)
no (26) 4 15.38 22 84.62 ref
Currently no chronic diseases:
yes (11) 0 0.00 11 100.00 0.00 (0.00, 1.12)
no (23) 6 26.09 17 73.91 ref
Hospital:
Sibu (26) 6 23.08 20 76.92 ∞ (0.55, ∞)
Kapit (8) 0 0.00 8 100.00 ref 1Bootstrapping was used to calculate a bias-corrected 95% confidence interval for mean difference in age 2Age information is missing for 2 individuals, both tested negative for TTV 3For all binomial variables containing no “0” values, Cornfield’s exact method was used to calculate
unadjusted odds ratios and their associated 95% confidence intervals. For variables which did contain “0”
values, 95% CIs were approximated using Cornfield’s method for parametric data.

23
Table 9: Nasal cavity based infection with TTV and associations with various exposures, according to real-time PCR This table displays prevalence of TTV analyzed according to different exposure variables. An individual was considered to be TTV "positive" if their NP swab was found to be positive for TTV by real-time PCR testing.
TTV status
Variables (# of observations) Positive (N=23) Negative (N=7)
Avg SD Avg SD Point estimate (95% CI)1
Age in years:
Age (322) 54.41 27.07 37 20.89 -17.41 (-37.50, 2.68)
N % N % Unadjusted OR (95% CI)3
Exposed to any bushmeat:
Yes (13) 11 84.62 2 15.38 2.29 (0.29, 28.03)
No (17) 12 52.17 5 71.43 ref
Exposed to mammal bushmeat:
Yes (12) 10 83.33 2 16.67 1.92 (0.24, 23.72)
No (18) 13 72.22 5 27.78 ref
Exposed to reptile bushmeat:
Yes (11) 9 81.82 2 18.18 1.61 (0.20, 20.04)
No (19) 14 73.68 5 26.32 ref
Exposed to amphibian bushmeat:
Yes (9) 8 88.89 1 11.11 3.20 (0.29, 165.28)
No (21) 15 71.43 6 28.57 ref
Exposure to butchering:
20+ days (8) 6 75.00 2 25.00 1.15 (0.13, 15.37)
1-19 days (4) 4 100 0 0.00 ∞ (0.32, ∞)
0 days (18) 13 72.22 5 27.78 ref
Exposure to hunting:
20+ days (7) 5 71.43 2 28.57 0.83 (0.09, 11.46)
1-19 days (3) 3 100 0 0.00 ∞ (0.24, ∞)
0 days (20) 15 75.00 5 25.00 ref
Gender:
Male (18) 14 77.78 4 22.22 1.17 (0.14, 8.78)
Female (12) 9 75.00 3 25.00 ref
Ethnicity:
Iban (20) 16 80.00 4 20.00 1 (0.02, 14.99)
Chinese (5) 3 60.00 2 40.00 0.38 (0.01, 11.80)
Other (5) 4 80.00 1 20.00 ref
Household size:
1-3 (10) 6 60.00 4 40.00 0.26 (0.03, 2.17)
4+ (20) 17 85.00 3 15.00 ref
Has a pulmonary disease:
yes (7) 6 85.71 1 14.29 2.12 (0.18, 113.39)
no (23) 17 73.91 6 26.09 ref
Currently no chronic diseases:
yes (11) 5 45.45 6 54.55 0.05 (0.001, 0.58)
no (19) 18 94.74 1 5.26 ref
Hospital:
Sibu (22) 16 72.73 6 27.27 0.38 (0.01, 4.31)
Kapit (8) 7 87.50 1 12.50 ref 1Bootstrapping was used to calculate a bias-corrected 95% confidence interval for mean
difference in age 2Age information is missing for 2 individuals, one tested positive and one negative for TTV 3Cornfield’s exact method was used to calculate unadjusted odds ratios and their associated 95%
confidence intervals for all binomial variables.

24
3.5 Exposures Versus Infection With TTV
As data were sparse, demographic covariate categories were often collapsed to
increase the number of outcomes in each cell (e.g. ethnicity was reduced from 5
categories to 3 categories). These variables were then analyzed by TTV infection status
as measured by conventional PCR assays of plasma samples [Table 8], and real-time
assays of NP swabs [Table 9]. Conventional results for NP swabs and PBMCs were not
analyzed in this way because of zero positives and close agreement with plasma-based
results respectively. Real-time results for plasma and PBMC samples were also not
analyzed in this way because they each only reported two negative specimens.
The primary exposure variable of interest, exposure to bushmeat, was the same as that
used in Table 1. Out of the 34 participants included in the study, 6 (17.65%) were
positive for TTV. The difference in average age between infected and non-infected
groups was not statistically significant. Exposure to amphibian bushmeat, being
ethnically Iban, having a small household size, and having no chronic disease produced
decreased odds of TTV infection. Of these however, only the effect of smaller household
size was statistically significant (OR=0.00; 95% CI=0.00, 0.96). Gender (OR=infinity;
95% CI=1.39, infinity) also had a statistically significant impact on odds of infection.
Exposure to bushmeat in general (OR=3.09; 95% CI=0.35, 38.38) and especially that of
reptiles (OR=6.00; 95% CI=0.65, 75.19) produced relatively large increases in odds of
infection, but these results were statistically insignificant.
Table 9 shows that analysis of real-time results for NP swabs produced ORs which
were similar to Table 8 for exposure to bushmeat (OR=2.29, 95% CI=0.29, 28.03),
gender (OR=1.17, 95% CI=0.14, 8.78), and household (OR=0.26, 95% CI=0.03, 2.17),
but none of these results were statistically significant. The only statistically significant

25
result captured in Table 9 was produced by the chronic disease variable, suggesting that
individuals with no chronic diseases had lower odds of being infected with TTV
(OR=0.05, 95% CI=0.001, 0.58). Compared with conventional PCR plasma results, real-
time PCR analysis of the NP swabs produced opposite results for being Iban (OR=1,
95% CI=0.02, 14.99), being Chinese (OR=0.38, 95% CI=0.01, 11.80), and hospital of
enrollment (OR=0.38, 95% CI=0.01, 4.31), none of which were significant.
Table 10: Frequency of bushmeat exposure and infection with TTV This table shows lifetime, self-reported exposure to hunting and butchering bushmeat among the study population along with the number of TTV positive individuals (according to conventional PCR plasma results) in each cell. All individuals other than the 19 in cell “0,0” are included in the bushmeat “exposed” category.
Butchering (# of TTV positives)
0 times 1-4 times 5-9 times 10-19 times 20+ times Total
Hunting
0 times 19 (2) 1 (1) 0 0 3 23 (3)
1-4 times 0 0 1 0 0 1
5-9 times 0 0 0 0 0 0
10-19 times 1 (1) 0 0 1 0 2 (1)
20+ times 0 1 (1) 0 0 7 (1) 8 (2)
Total 20 (3) 2 (2) 1 1 10 (1) 34 (6)
Table 10 further explores the associations between hunting, butchering, and plasma
based infection with TTV. Of the 14 individuals that reported butchering bushmeat, 3
(21.43%) were infected with TTV. Similarly, 3 out of 11 individuals (27.27%) who
reported ever having hunted were positive for TTV. There is no clear relationship
between frequency of exposure to bushmeat and infection with TTV. This means that
individuals who were exposed to bushmeat at higher frequencies did not have higher
odds of infection. Most cells in the frequency table contain few or no observations
however, which makes it difficult to infer the existence or non-existence of any

26
associations. Furthermore, only one individual reported exclusive exposure to hunting
bushmeat, which means that the specific impacts of hunting and butchering bushmeat
cannot be separately analyzed.
4. Discussion
4.1 Summary of Main Findings
As reported by the conventional PCR plasma test, prevalence of TTV was low among
study participants with only 6 out of 34 participants (17.65%) testing positive. Increase in
odds of infection was statistically significant for males, and individuals from larger
households. Bushmeat exposure did not have a statistically significant impact on odds of
infection, but those who reported exposure to bushmeat in general and specifically
reptile bushmeat, had 3 to 6 times higher odds of being infection than those who
reported no exposure. Aside from a high-to-low prevalence gradient across plasma,
PBMC, and NP swab samples respectively reported by both tests, qPCR and
conventional PCR test results showed poor agreement. Under the assumption that
conventional PCR results for study samples were correct, a comparison of the two PCR
methods used showed that qPCR had a strong ability to identify positive samples with a
sensitivity of 100%, but also produced a large proportion of false-positives with a
specificity of only 7.69%.
4.2 Demographic Characteristics
The demographic table shows us that the ethnic proportions of the study sample do not
reflect those of the state of Sarawak. Inhabitants of Sarawak are roughly 23% Malay,
29% Iban, 23% Chinese, and 25% other [33], compared to the current study’s sample

27
composed primarily of Iban (64.71%) and Chinese (17.65%) participants. There are a
few likely reasons for this. Firstly, like many rural towns in Sarawak, Kapit is primarily
composed of Iban residents. Secondly, the number of ethnic Chinese living in Sibu is
disproportionately large compared to other cities in Sarawak. Finally, the majority of
patients admitted to both Sibu and Kapit hospitals are ethnically Iban.
It is interesting that patients enrolled in Sibu had greater odds of exposure to bushmeat
than those enrolled in Kapit, given that Sibu is much larger and more urbanized. This
may be due to the fact that Sibu Hospital is well away from the city center, and easily
accessible by the well-developed Sibu road system. As such, it may service individuals
living beyond city limits who have greater access to jungle resources. On the other hand,
Kapit hospital is just off the main street in Kapit, but cannot easily be traveled to from
communities which are far away and perhaps more likely to rely on bushmeat products
than Kapit locals. However, given that only eight participants were enrolled from Kapit, it
is highly possible that the difference in odds of bushmeat exposure between hospital
groups is due to chance.
Though the relationship between gender and exposure to bushmeat reported in this
study was not statistically significant, it is supported by findings from other studies. For
example, Kilonzo et al. (2013) report that within their sample population, men hunted
bushmeat more often than had been expected, and that women butchered it more often
than expected [34]. In contrast, more men than women from the current study reported
exposure to both hunting (45% versus 14%) and butchering (45% versus 35.71%)
bushmeat.
28
4.3 Agreement between PCR methods
It is most likely that the poor agreement between test results is primarily due to
differences in the diagnostic abilities of the qPCR and conventional PCR method
employed. Table 7 shows that, as expected, the qPCR test had high sensitivity but very
poor specificity. This means that its reported prevalence of 90% within plasma samples,
while not out of the ordinary when compared to other TTV prevalence studies [18-20], is
worthy of skepticism. While it is most likely that true prevalence is somewhere between
the proportions reported by both tests, it is more conservative to report the conventional
PCR prevalence of only 17%. This is to assume that the differences between test results
are primarily due to false-positives from the qPCR test, rather than small concentrations
of initial target DNA leading to false-negatives from the conventional PCR test.
This assumption is supported by consideration of the CT values reported along with the
qPCR positive results. A high CT value means that there was initially a low concentration
of target DNA within the sample tested. If all five of the samples which were positive for
both tests peaked at low CT values relative to those samples which were positive only
for qPCR, then one might assume the discrepancy between results was due to low
sensitivity of the conventional PCR method. However, no such pattern is present.
Samples reported positive by both tests peaked at CT values ranging from 25-31, while
several other samples reported negative by conventional PCR test peaked at CT values
around 30. Furthermore, the one sample which produced a suspect positive result by
qPCR (CT=37.51) was reported as positive by conventional PCR. In light of these
considerations, it is reasonable to report the conventional PCR rather than qPCR results.
While human error is another possible reason for discrepancy between test results,
there are several reasons to believe it is not primarily responsible. For example, PCR
29
tests are run with positive and negative controls to check for incorrect mixing of assays
and cross-contamination of specimens respectively. If either control reports an incorrect
value, the test is rerun. Furthermore, given the agreement between plasma and PBMC
samples for four out of six individuals with positive conventional PCR results, it is
unlikely that differences in test results are due to improper preparation or handling of the
specimens shipped to Duke.
The prevalence results reported in the current study, specifically the discrepancy
between conventional and qPCR results, illuminate two important matters which TTV
researchers must keep in mind when evaluating the current literature and designing their
own studies. The first is that the primer and probe sets used to test for TTV infection and
the platform on which they are run will have a very significant impact on the prevalence
which is ultimately reported. The diagnostic abilities of the primer and probe sets used
by different studies are not always clearly described in the text. Furthermore, there is
some disagreement about how comprehensively various sets of primers and probes can
detect known strains of TTV [39]. Secondly, researchers must understand the strengths
and weaknesses of PCR platforms before deciding which type to use, or interpreting test
results. For instance, because the qPCR method used in the current study is highly
sensitive, it could be used as a first-round test to rule out negative samples and produce
positive results which could be corroborated with conventional PCR. Any researchers
that include TTV within the scope of their studies must be well informed on these topics
so that their results can be as accurate and uniform as possible.
4.4 Comparison of results between sample types
The apparent high-to-low prevalence gradient across plasma, PBMC, and NP swab
samples respectively proved to be statistically insignificant and is not supported by

30
results from other relevant studies [summarized in Table 11]. For example, Maggi et al.
(2003) found perfect agreement between the plasma and NP swabs they tested and
reported 75% prevalence [14]. It is important to note that their sample was almost 80%
male. Similarly, TeKippe et al. (2017) reported TTV prevalence among NP swabs to be
only slightly lower than that among plasma samples [40]. In agreement with the current
study’s findings, Kakkola et al. (2004) reported only slightly higher prevalence among
plasma samples compared to PBMC specimens [41]. This relationship was reversed in
Chan et al.’s study (2001) which reported 98% and 92% TTV prevalence among plasma
and PBMC samples respectively.
Maggi et al. (2003) also reported on six children who initially provided negative plasma
and positive nasal samples. Two of the patients were followed up and eventually
became plasma positive as well [14]. Maggie et al. suggest that these patients initially
had respiratory TTV infections which later became systemic and presented in the
patients’ blood. More prospective-cohort studies of this nature should be done to answer
questions such as: do individuals tend to obtain blood or respiratory TTV infections first;
and how long does it take respiratory TTV infections to become systemic. With this kind
of information it might be possible to more accurately judge how long an individual has
had TTV, with potential for application in viral surveillance and immune-system
monitoring.
Most of the studies included in Table 11 report much higher prevalence of TTV among
their participants than was found in the current study’s population by conventional CPR.
One factor that might contribute heavily to this disparity is the type of patients included in
each study. At least 4 out of 8 of the studies included were conducted among
participants that had diseases which are associated with higher TTV prevalence (42, 43,

31
44, 45). Other possible explanations include other confounding demographic
characteristics such as age or household size, different diagnostic abilities of the primer
and probe sets used, and regional variation in TTV prevalence.
Table 11: Results from other TTV prevalence studies Only studies which explicitly stated that they used UTR derived primers and probes were included in this table.
Sample type
Population size
Prevalence PCR type Gender Age Location Characteristics Study
Plasma
55 80% qPCR 52.8% (male)
54 years (median)
- Hematological cancer patients
Albert et al., 2017
[42]
219 total 70% cases;
56% controls conventional -
2-36 months
United States
Febrile vs. afebrile patients
TeKippe et al.,
2012 [40]
250 cases; 250 controls
57% cases; 20% controls
conventional - - Iran Thalassemic patients vs.
controls
Zandieh et al.,
2005 [43]
31 93.5% conventional 42%
(male) 59 years (mean)
Finland Hospital patients Kakkola et al.,
2004 [41]
50 92% conventional 52%
(male) 11.5
(mean) -
Transfusion-dependent
thalassemia patients
Chan et al., 2001
[44]
24 75% conventional 79.16% (male)
1-24 months
Italy Acute respiratory disease patients
Maggi et al., 2003
[14]
PBMC
240 92% conventional - - Iran Hepatitis C
patients
Koohi et al., 2012
[45]
31 90% conventional 42%
(male) 58.8
(mean) Finland Hospital patients
Kakkola et al.,
2004 [41]
50 98% conventional 52%
(male) 11.5
(mean) -
Transfusion-dependent
thalassemia patients
Chan et al., 2001
[44]
NP swabs
247 total 66% cases;
50% controls conventional -
2-36 months
United States
Afebrile vs. febrile patients
TeKippe et al.,
2012 [40]
24 75% conventional 79.16% (male)
1-24 months
Italy Acute respiratory disease patients
Maggi et al., 2003
[14]
59 93% qPCR 86.44% (male)
11.5 years
(mean) Italy
Children with asthma
Pifferi et al., 2005
[46]

32
4.5 Exposures Versus Infection With TTV
Of the four bushmeat variables analyzed, none produced statistically significant results.
Grouping together all individuals who reported exposure to reptile bushmeat produced
the most extreme odds of infection (OR=6.00). However, only one of the eleven
individuals in the group exposed to reptile bushmeat reported no exposure to either
mammals or amphibians. This means that the high odds of infection in that group cannot
be attributed to contact with reptile bushmeat products alone. The relatively high odds of
infection within the group who reported exposure to any kind of bushmeat (OR=3.09),
while statistically insignificant, are still scientifically interesting and should be further
investigated in a more statistically powerful way.
The significant association between gender and TTV infection, as reported by the
current study, is not unanimously supported across the relevant literature. However, it is
supported by some studies which looked specifically at TTV infection and titer load by
age and gender. These studies report that infection proportions and titer loads were
lowest among young women, and suggest that gender and age may both play a role in
the immune system’s ability to control TTV within the body [47, 48].
Other studies have also reported statistical associations between household size and
infection with TTV, even after controlling for likely confounders such as age. For
instance, Stark et al. (2000) suggest that there is an obvious relationship between risk of
interpersonal transmission of TTV, and living with a greater number of people [49].
Though no significant association was reported between hospital of enrollment and
odds of infection, it is very interesting that all six of the positive participants were enrolled
at Sibu Hospital. Further analysis showed that participants from Sibu were
predominantly male (65.38% vs. 37.5% from Sibu) and from larger households (69.23%

33
vs. 50% from Sibu). It is possible that these factors acted as confounders among the
current study’s population. These results cannot imply that infection proportions are
actually different between the cities of Sibu and Kapit, but they beg to be substantiated
by further research.
While this data is informative, it must be understood in its own context and in the
greater context of the existing body of literature. The measures of association reported
by the current study could be an accurate representation of reality, but they were also
influenced by the design of the survey utilized, method of analysis, and sparse data. The
bushmeat exposure variables used in this study are based on self-reported, lifetime
data. And while the original survey questions from which these data were obtained were
separated by exposure and animal type, due to small sample size, these variables were
combined to improve analytical ability to uncover associations, if any were present.
While these methods could be improved in future studies by increasing sample size,
designing more extensive questionnaires, and conducting multi-variate analysis, survey
based exposure data must also be combined with more direct kinds of information like
prevalence and type of TTV infection within the bushmeat species of interest. More
studies which combine both kinds of information must be conducted in light of the
growing body of evidence showing human and animal infection with closely related
strains of TTV and TTV-like viruses.
4.6 Implications for further research
TTV related research is still in its adolescence, and there is much work left to be done.
One problem that must be addressed is the collation of existing evidence and
knowledge. Because new studies are being published all the time, existing reviews are
becoming more and more outdated. For instance, to the author’s knowledge, some of

34
the most up-to-date reviews of TTV research base their estimates of worldwide and
regional prevalence on the results of just a few studies, rather than a systematic look at
the whole body of available evidence. Furthermore, as illustrated by the differences in
PCR results reported by the current study, comprehensive studies must be conducted
which collate information on existing sets of TTV related primers and probes, along with
their diagnostic abilities with different sample types. These kinds of publications would
provide researchers with the knowledge of what questions remain to be answered, and
equip them with standardized techniques to do so.
With regard to bushmeat and the possible zoonotic nature of TTV, researchers must
continue to investigate new animal species in search of possible reservoirs and evidence
of zoonotic events. Most efforts of this nature are currently being focused on farm
animals, but there is a need for more undomesticated species to be investigated. This
need presents an excellent opportunity for researchers from different backgrounds, like
animal science, biology, global health, etc., to collaborate and publish well rounded
studies.
Concerning implications for Malaysia and its policy makers, perhaps the primary
importance of TTV related research lies in its potential to aid our understanding of
infectious dynamics of emerging zoonotic diseases. The memory of the 1998 Nipah virus
related encephalitis outbreak among pigs and pig workers [50-52] is still fresh on the
minds of Malaysian health professionals. There is a need to better understand how
viruses travel between animal populations and different species in order to prevent or
halt future viral outbreaks. If TTV can truly be used to model such events [2], local
prevalence and risk factors for TTV infection are the first step to realizing that potential.

35
At the local level, there are several doctors and staff members at both Sibu and Kapit
hospitals that were interested in conducting their own research. The lack of any TTV
related information from their communities, beyond the current study, provides an
excellent opportunity for them to fill gaps in the literature. For example, is prevalence
really different between Sibu and Kapit? If so, what are the possible reasons? Are the
same diseases associated with higher TTV prevalence and titer loads among Sibu and
Kapit hospital patients as have been reported by other studies? As evidenced by their
strong support of and involvement with the current study, the medical officers and staff at
both hospitals have the capacity to form the kinds of collaborative relationships
necessary to explore these questions.
4.7 Study strengths and limitations
The primary strength of this study is the variety of data collected and analysis carried
out regarding prevalence of TTV infection within the study sample. Three different
sample types were collected from each patient, and analyzed with two different PCR
tests. This process not only produced data concerning prevalence of TTV within the
study sample for which that information did not previously exist, but also enabled the
author to provide feedback on the diagnostic characteristics of a commonly used TTV
diagnostic test. In these ways, the current study provides new information in answer to
questions asked by previous researchers, and provides direction for more studies to be
done in the future.
The primary limitations of this study were its small sample size, and the non-
randomized process by which subjects were recruited. Larger study samples are more
likely to give results which reflect the true characteristics of the study population. Small
sample sizes also make it difficult to draw clear conclusions about the strength and
36
significance of associations between study variables. Furthermore, the fact that all
participants were pneumonia patients from two specific hospitals, along with the
difference in ethnic proportions between study participants and the population from
which they were sampled, limit the generalizability of this study’s results. It was originally
designed to be a case-control study which could compare prevalence of TTV among
pneumonia patients and controls, along with their exposure to bushmeat. However,
when it became impossible to enroll cases during the international review board (IRB)
process, pneumonia as a prerequisite for inclusion in the study became a constraint
rather than grounds for comparison. Finally, the questionnaire used was also not
previously validated, relied on self-reported lifetime exposure questions, and did not
collect information on some characteristics which may be linked with bushmeat exposure
or infection with TTV, such as occupation.
5. Conclusion
This study suggests a low prevalence of TTV within pneumonia patients from two
Malaysian hospitals. Its results also augment those from previous studies by reaffirming
evidence of associations between gender, household size, and TTV infection.
Furthermore, though not statistically significant, the increased odds of infection among
individuals exposed to bushmeat, especially from reptiles, are relevant to discussions of
TTV’s zoonotic potential and should be further analyzed. The differences in results
between the qPCR and conventional PCR methods employed by the current study serve
as a caution to other TTV researchers that should be kept in mind when choosing
diagnostic methods and reviewing TTV related literature. These and other aspects of

37
TTV’s etiology and epidemiology must continue to be explored in order to exploit TTV’s
potential for use in global medicine and health research.
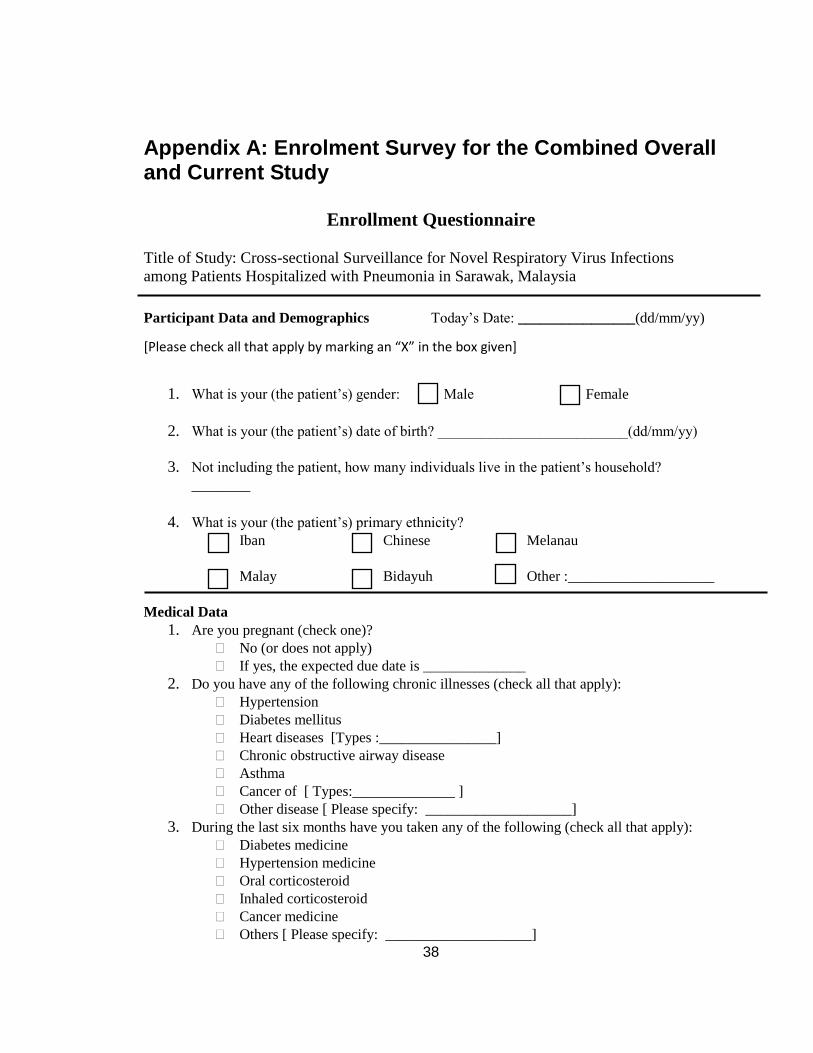
38
Appendix A: Enrolment Survey for the Combined Overall and Current Study
Enrollment Questionnaire
Title of Study: Cross-sectional Surveillance for Novel Respiratory Virus Infections
among Patients Hospitalized with Pneumonia in Sarawak, Malaysia
Participant Data and Demographics Today’s Date: ________________(dd/mm/yy)
[Please check all that apply by marking an “X” in the box given]
1. What is your (the patient’s) gender: Male Female
2. What is your (the patient’s) date of birth? __________________________(dd/mm/yy)
3. Not including the patient, how many individuals live in the patient’s household?
________
4. What is your (the patient’s) primary ethnicity?
Iban Chinese Melanau
Malay Bidayuh Other :____________________
Medical Data
1. Are you pregnant (check one)?
No (or does not apply)
If yes, the expected due date is ______________
2. Do you have any of the following chronic illnesses (check all that apply):
Hypertension
Diabetes mellitus
Heart diseases [Types :________________]
Chronic obstructive airway disease
Asthma
Cancer of [ Types:______________ ]
Other disease [ Please specify: ____________________]
3. During the last six months have you taken any of the following (check all that apply):
Diabetes medicine
Hypertension medicine
Oral corticosteroid
Inhaled corticosteroid
Cancer medicine
Others [ Please specify: ____________________]

39
Occupation and Animal Exposure
1. During the last 30 days, has the patient come in close contact (touching or within 1 meter)
with any of the following live animals? Please check [X] all that apply:
Pigs? Chickens? Ducks?
Other
poultry
(e.g. geese
quail)?
Horses? Cows? Goats?
Others?
Specify:
_________
Bushmeat exposure: The term “bushmeat” refers to the meat of any animal that is not
domesticated. This series of questions is trying to determine how much you have been exposed to
bushmeat through hunting, butchering, and eating.
2. In your lifetime, how many days would you estimate you have spent hunting wild
animals?
0 days 1-4 days 5-9 days 10-19 days 20 or more days
(If you checked “0 days” please check the “none” box for question 3)
3. Which animals did you touch while hunting? Please circle either “D” or “A” to indicate if
the animal was dead or alive when you first touched it. If you touched any animals not
listed here please list them in the “others” space. [“D” = dead animal ; “A” = alive]
Check the gray “none” box if applicable.
4. In your lifetime, on how many different days have you spent at least some time
butchering wild animals?
0 days 1-4 days 5-9 days 10-19 days 20 or more days
(If you checked “0 days” please check the “none” box for question 5)
wild
boar python
monitor
lizard
long-tailed
macaque
pig-tailed
macaque flying fox civet
mouse
deer weasel
D | A D | A D | A D | A D | A D | A D | A D | A D | A
leaf
monkey cobra
king
cobra barking deer samba deer crocodile squirrel frog None
D | A D | A D | A D | A D | A D | A D | A D | A
Others:
________________________________________________________________________________

40
5. Which animals did you touch while butchering in the past 12 months? Please circle either
“D” or “A” to indicate if the animal was dead or alive when you first touched it. If you
touched any animals not listed here please list them in the “others” space. [“D” = dead
animal ; “A” = alive] Check the gray “none” box if applicable.
6. In your lifetime, how many times would you estimate that you have eaten the meat of any
animals listed in question 7?
0 times 1-4 times 5-9 times 10-19 times 20 or more days
(If you checked “0 days” please check the “none” box for question 7)
7. Which types of meat did you eat? Please check all applicable gray boxes. If you ate any
types of meat not listed here please list them in the “others” space. Check the gray “none”
box if applicable.
wild
boar python
monitor
lizard
longtailed
macaque
pig-tailed
macaque flying fox civet
mouse
deer weasel
leaf
monkey cobra
king
cobra barking deer samba deer crocodile squirrel frog None
Others:
____________________________________________________________________________________
wild
boar python
monitor
lizard
long-tailed
macaque
pig-tailed
macaque flying fox civet
mouse
deer weasel
D | A D | A D | A D | A D | A D | A D | A D | A D | A
leaf
monkey cobra
king
cobra barking deer samba deer crocodile squirrel frog None
D | A D | A D | A D | A D | A D | A D | A D | A
Others:
________________________________________________________________________________

41
Very
Unlikely Unlikely Neutral Likely Very Likely
8. How likely do you think it is
for people in Malaysia to
become infected with germs
from pigs or poultry? (Please
choose 1)
9. How likely do you think it is
for people in Sarawak to become
infected with germs from pigs or
poultry? (Please choose 1)
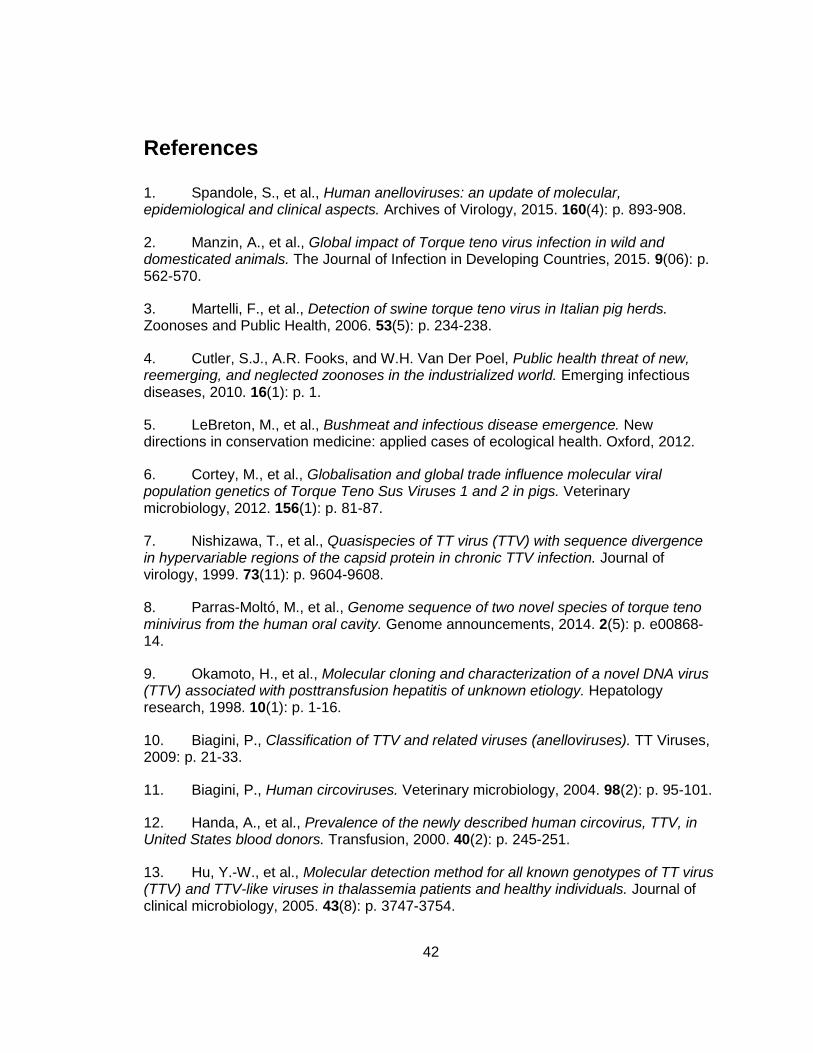
42
References
1. Spandole, S., et al., Human anelloviruses: an update of molecular, epidemiological and clinical aspects. Archives of Virology, 2015. 160(4): p. 893-908.
2. Manzin, A., et al., Global impact of Torque teno virus infection in wild and domesticated animals. The Journal of Infection in Developing Countries, 2015. 9(06): p. 562-570.
3. Martelli, F., et al., Detection of swine torque teno virus in Italian pig herds. Zoonoses and Public Health, 2006. 53(5): p. 234-238.
4. Cutler, S.J., A.R. Fooks, and W.H. Van Der Poel, Public health threat of new, reemerging, and neglected zoonoses in the industrialized world. Emerging infectious diseases, 2010. 16(1): p. 1.
5. LeBreton, M., et al., Bushmeat and infectious disease emergence. New directions in conservation medicine: applied cases of ecological health. Oxford, 2012.
6. Cortey, M., et al., Globalisation and global trade influence molecular viral population genetics of Torque Teno Sus Viruses 1 and 2 in pigs. Veterinary microbiology, 2012. 156(1): p. 81-87.
7. Nishizawa, T., et al., Quasispecies of TT virus (TTV) with sequence divergence in hypervariable regions of the capsid protein in chronic TTV infection. Journal of virology, 1999. 73(11): p. 9604-9608.
8. Parras-Moltó, M., et al., Genome sequence of two novel species of torque teno minivirus from the human oral cavity. Genome announcements, 2014. 2(5): p. e00868-14.
9. Okamoto, H., et al., Molecular cloning and characterization of a novel DNA virus (TTV) associated with posttransfusion hepatitis of unknown etiology. Hepatology research, 1998. 10(1): p. 1-16.
10. Biagini, P., Classification of TTV and related viruses (anelloviruses). TT Viruses, 2009: p. 21-33.
11. Biagini, P., Human circoviruses. Veterinary microbiology, 2004. 98(2): p. 95-101.
12. Handa, A., et al., Prevalence of the newly described human circovirus, TTV, in United States blood donors. Transfusion, 2000. 40(2): p. 245-251.
13. Hu, Y.-W., et al., Molecular detection method for all known genotypes of TT virus (TTV) and TTV-like viruses in thalassemia patients and healthy individuals. Journal of clinical microbiology, 2005. 43(8): p. 3747-3754.

43
14. Maggi, F., et al., TT virus in the nasal secretions of children with acute respiratory diseases: relations to viremia and disease severity. Journal of virology, 2003. 77(4): p. 2418-2425.
15. Nishiyama, S., et al., Identification of novel anelloviruses with broad diversity in UK rodents. Journal of General Virology, 2014. 95(7): p. 1544-1553.
16. Focosi, D., et al., Torquetenovirus: the human virome from bench to bedside. Clinical Microbiology and Infection, 2016. 22(7): p. 589-593.
17. de Oliveira, J.C., et al., Detection of TTV in peripheral blood cells from patients with altered ALT and AST levels. MICROBIOLOGICA-BOLOGNA-, 2008. 31(2): p. 195.
18. Hussain, T., et al., Phylogenetic analysis of torque teno virus genome from Pakistani isolate and incidence of co-infection among HBV/HCV infected patients. Virology journal, 2012. 9(1): p. 320.
19. Ninomiya, M., et al., Development of PCR assays with nested primers specific for differential detection of three human anelloviruses and early acquisition of dual or triple infection during infancy. Journal of clinical microbiology, 2008. 46(2): p. 507-514.
20. Vasilyev, E.V., et al., Torque Teno Virus (TTV) distribution in healthy Russian population. Virology journal, 2009. 6(1): p. 134.
21. Yu, Q., et al., TT virus: preferential distribution in CD19+ peripheral blood mononuclear cells and lack of viral integration. Journal of medical virology, 2002. 66(2): p. 276-284.
22. Verani, M., R. Bigazzi, and A. Carducci, Viral contamination of aerosol and surfaces through toilet use in health care and other settings. American journal of infection control, 2014. 42(7): p. 758-762.
23. Sonia Spandole, A.T., Lavinia Mariana Berca, Marian Adascalului, Oana Mihaela Niculae, Danut Cimponeriu, Grigore Mihaescu, Torque teno viruses DNA found in meat products. Current Opinion in Biotechnology, 2013. 24(European Biotechnology Congress 2013): p. Pages S94-S95.
24. Monini, M., et al., Detection of Torque Teno Sus Virus in Pork Bile and Liver Sausages. Food and environmental virology, 2016. 8(4): p. 283-288.
25. Cibulski, S.P., et al., A Novel Anelloviridae Species Detected in Tadarida brasiliensis Bats: First Sequence of a Chiropteran Anellovirus. Genome Announcements, 2014. 2(5).
26. Verschoor, E.J., S. Langenhuijzen, and J.L. Heeney, TT viruses (TTV) of non-human primates and their relationship to the human TTV genotypes. Journal of General Virology, 1999. 80(9): p. 2491-2499.

44
27. Barnett, O.E., et al., Detection of TT virus among chimpanzees in the wild using a noninvasive technique. Journal of wildlife diseases, 2004. 40(2): p. 230-237.
28. Ergünay, K., et al., Detection of TT virus (TTV) by three frequently-used PCR methods targeting different regions of viral genome in children with cryptogenic hepatitis, chronic B hepatitis and HBs carriers. The Turkish journal of pediatrics, 2008. 50(5): p. 432.
29. Pujol, F., et al., Infection with transfusion-transmitted virus (TTV) in humans and other primates in Venezuela. Annals of Tropical Medicine & Parasitology, 2005. 99(2): p. 173-180.
30. Romeo, R., et al., High prevalence of TT virus (TTV) in naive chimpanzees and in hepatitis C virus-infected humans: frequent mixed infections and identification of new TTV genotypes in chimpanzees. Journal of General Virology, 2000. 81(4): p. 1001-1007.
31. Muljono, D., et al., Molecular epidemiology of TT virus (TTV) and characterization of two novel TTV genotypes in Indonesia. Archives of virology, 2001. 146(7): p. 1249-1266.
32. Hijikata, M., et al., TT virus (TTV) genotypes in native and non-native prostitutes of Irian Jaya, Indonesia: implication for non-occupational transmission. Archives of virology, 2000. 145(1): p. 63-72.
33. Sarawak, Facts and Figures, C.M.s.D. State Planning Unit, Editor. 2011: Kuching, Sarawak.
34. Kilonzo, C., T.J. Stopka, and B. Chomel, Illegal animal and (bush) meat trade associated risk of spread of viral infections. Viral infections and global change, 2013: p. 179-194.
35. Haramoto, E., et al., Real-time PCR detection of adenoviruses, polyomaviruses, and torque teno viruses in river water in Japan. Water Research, 2010. 44(6): p. 1747-1752.
36. Tokita, H., et al., High TT virus load as an independent factor associated with the
occurrence of hepatocellular carcinoma among patients with hepatitis C virus‐related
chronic liver disease. Journal of medical virology, 2002. 67(4): p. 501-509.
37. Paul A. Harris, R.T., Robert Thielke, Jonathon Payne, Nathaniel Gonzalez, Jose G. Conde, Research electronic data capture (REDCap) - A metadata-driven methodology and workflow process for providing translational research informatics support. J Biomed Inform, 2009. 42(2): p. 377-81.
38. StataCorp, Stata Statistical Software: Release 15. 2015, StataCorp LP: College Station, TX.

45
39. Okamoto, H., et al., Marked genomic heterogeneity and frequent mixed infection of TT virus demonstrated by PCR with primers from coding and noncoding regions. Virology, 1999. 259(2): p. 428-436.
40. TeKippe, E.M., et al., Increased prevalence of anellovirus in pediatric patients with fever. PLoS One, 2012. 7(11): p. e50937.
41. Kakkola, L., et al., Genoprevalence in human tissues of TT-virus genotype 6. Archives of virology, 2004. 149(6): p. 1095-1106.
42. Albert, E., et al., Dynamics of Torque Teno virus plasma DNAemia in allogeneic stem cell transplant recipients. Journal of Clinical Virology, 2017. 94: p. 22-28.
43. Zandieh, T., et al., Transfusion transmitted virus (TTV) infection in thalassemic patients. Iranian Journal of Public Health, 2005. 34(4): p. 24-29.
44. Chan, P., et al., Prevalence and genotype distribution of TT virus in various specimen types from thalassaemic patients. Journal of viral hepatitis, 2001. 8(4): p. 304-309.
45. Koohi, A.K., et al., Phylogenetic analysis of torque teno virus in hepatitis C virus infected patients in shiraz. Hepatitis monthly, 2012. 12(7): p. 437.
46. Pifferi, M., et al., Associations between nasal torquetenovirus load and spirometric indices in children with asthma. The Journal of infectious diseases, 2005. 192(7): p. 1141-1148.
47. Brassard, J., et al., Association of age and gender with Torque teno virus detection in stools from diarrheic and non-diarrheic people. Journal of Clinical Virology, 2015. 72: p. 55-59.
48. Haloschan, M., et al., TTV DNA plasma load and its association with age, gender, and HCMV IgG serostatus in healthy adults. Age, 2014. 36(5): p. 9716.
49. Stark, K., et al., Seroepidemiology of TT virus, GBC‐C/HGV, and hepatitis
viruses B, C, and E among women in a rural area of Tanzania. Journal of medical virology, 2000. 62(4): p. 524-530.
50. Chua, K.B., et al., Fatal encephalitis due to Nipah virus among pig-farmers in Malaysia. The Lancet, 1999. 354(9186): p. 1257-1259.
51. Chua, K.B., Nipah virus outbreak in Malaysia. Journal of Clinical Virology, 2003. 26(3): p. 265-275.
52. Goh, K.J., et al., Clinical features of Nipah virus encephalitis among pig farmers in Malaysia. New England Journal of Medicine, 2000. 342(17): p. 1229-1235.