a feasibility study of agricultural production of brussel ... · profits during the months of...
TRANSCRIPT
1
A FEASIBILITY STUDY OF AGRICULTURAL PRODUCTION OF BRUSSELS SPROUTS,
CABBAGE, AND KALE FOR SAN YSIDRO FARMS
Presented to the
Faculty of the Agribusiness Department
California Polytechnic State University
In Partial Fulfillment
of the Requirements for the Degree
Bachelor of Science
By
Roy Orion Killgore
May 2013

2
TABLE OF CONTENTS
Chapter Page
I. INTRODUCTION………………………………………………………….3
Hypothesis…………………………..…………………………………7
Objectives of the Study………………………………………………...7
Significance of the Study….…………………………………………...7
II. REVIEW OF THE LITERATURE…….………………………………….9
Business Plan
Development…………………………………………………………...9
Managerial Accounting………………………………………….........11
Farm Management.…….………………………………………….…..18
Brassica Family…………………….……………………………..…..21
III. METHODOLOGY……………………………………..…………………26
Procedures for Data Collection…………………………..…………...26
Procedures for Data Analysis…………………………………………31
Assumptions and Limitations………………………………….……..33
IV. DEVELOPMENT OF THE STUDY…………………………………….35
Data Collection Problems......................................................................35
Analysis..................................................................................................36
V. SUMMARY, CONCLUSIONS, AND RECOMMENDATIONS………..44
Summary.................................................................................................44
Conclusions.............................................................................................44
Recommendations...................................................................................45
VI. REFERENCES CITED…………………………………………………..47

3
CHAPTER I
INTRODUCTION
Farming has played a crucial role to the development of a global society, as well as the
American economy. The agricultural sector has been one of the few industries that has been able
to prosper within the United States during its economic downturn. In 2008 the agricultural sector
single-handedly generated $87 billion in revenue (Wilde, 2010), and in 2011 California alone
generated a total of $43.5 billion in sales (USDA, 2012). Other agricultural states such as Iowa,
Texas, Nebraska, and Illinois generated about half of California’s revenue during this time
(USDA, 2012). Despite the general trend of economic growth, the American farmer faces an
increasing hostile business environment that cut into profit margins and force strategic changes
to company business models. During the past couple of years farmers have been faced with
issues of governmental regulations and soil-borne pathogens that both have an effect on the
financial outcome of a company.
4
Over time, production has been restricted and imposed with laws created by state
legislature aimed towards controlling aspects of production that impact society in a negative
manner. One aspect of production that both state and federal legislature is trying to control is the
regulations placed on immigration.
Local concerns of immigration reform require farmers to adjust business models to
sustain profitability. Government regulations such as E-verification introduce furthers strains to
the American farmer only allowing those who are U.S. citizens to work in the United States (U.S
Department of Homeland Security, 2012). Regulations such as this require farmers to find
adequate sources of labor that comply with this regulation. Many local farmers hire third party
organizations for food safety testing and allocate part time management to maintain company
records and manuals (Killgore, 2013). Unfortunately, a majority of the labor in agricultural
production is foreign, meaning this regulation poses threat to increasing the costs of labor during
production (U.S. Department of Labor, 2010). These constant government regulations make it
difficult for farms to keep up with the costs of production. Regulations set minimum quality
standards in management and farm practices for the company to follow.
Broccoli production in the Santa Maria Valley runs from late May through early October.
Although the production of broccoli is possible in other months, the potential for optimum costs
and yields occur only during this six month window. About 65% to 70% of all broccoli
production occur between May and October and only 35% to 30% in the remaining months. The
production window illustrates two concepts. First, the general nature of production is cyclical
meaning crops can be grown in certain times of the year and not others (Killgore, 2013). Second,
production spikes within the cycle to meet the market demands fluctuate on a weekly basis. For
example, market prices for broccoli are generally higher the week before national holidays and
5
slightly depressed the week of a national holiday. Combined with the labor intensity of vegetable
production, a farmer’s challenge to sustain profitability is compounded.
The majority of labor in vegetable production, about 75%, is directly from Mexico (U.S.
Department of Labor, 2010). This labor pool represents a substantial cost to production,
specifically during harvest period. A broccoli crop produced in the Santa Maria Valley will take
70 to 100 days to mature and 10 to 24 days to harvest, depending on the time of year the crop is
planted (Killgore, 2013). During this time, 20% of production costs and 84% of harvest costs per
acre are associated with labor. These values range from $800 to $1000 per acre from production
and $1000 to $1200 per acre from harvest. The cyclical nature of production and labor intensity
of the crop create specific labor demands during peak production seasons. Farmers look to secure
a long-term labor force by providing work for baseline crews during off-peak seasons and hiring
practices during peak seasons. However, immigration policies and proposed legislature, such as
E-verification, compound the labor problem.
Generally, agricultural labor returns to Mexico during the U.S. winter months and return
in early spring in time for harvests (Killgore, 2013). Today, increased border protection along
with governmental regulations has restricted the flow of immigrants returning to the U.S. for
cyclical work (U.S. Department of Labor, 2010). For those who have remained in the U.S. for
work, E verification introduces the threat of deportation for Hispanic workers that have lived in
the country for over 20 years. The deportation of labor causes an increase in labor demands in
production. As a result, growers are unable to meet production demands of consumers with a
lack of labor for harvest (Killgore, 2013).
The third concept to address is soil-borne pathogens, specifically Pin Rot. Pin Rot is a
soil-borne disease, developing from a plant pathogen known as Alternaria Brassicola, that results
6
in the gradual decomposition of a broccoli floret rendering the plant unmarketable (Laemmlen,
2005). The pathogen activates under cold, moist, and windy condition during the final weeks of
broccoli growth and can be characterized by fuzzy black growth over the broccoli floret
(Laemmlen, 2005). As most soils in the Santa Maria Valley contain the pathogen, the outbreak
will occur generally during the winter months when the conditions are optimal for infection
(Killgore, 2013). Pin Rot begins on a single broccoli floret and will continue to spread to
surrounding florets causing much of the head to turn black with underlying and surround floral
tissues turning yellow (Laemmlen, 2005). This is a problem due to the fact that one black floret
on a head renders the head unmarketable.
San Ysidro Farms is a Central Coast local farm company located in Nipomo, California.
The main crops that the farm specializes in growing are Broccoli, Cauliflower, Celery, Lettuce,
and Strawberries. For the past couple of years, San Ysidro Farms has not been able to make any
profits during the months of January, February, and occasionally March. Crops being harvested
during these months have resulted in low yields with poor quality for consumers.
Within the past couple of years, San Ysidro has faced issues particularly in their broccoli
crop, specifically pin rot and club root. As mentioned previously, pin rot is a soil-borne disease
that causes the floret of the broccoli to decay and decompose. Club root, is one that results in the
swelling of the plants roots. This disease cuts off the plants source to food and water causing the
plant to eventually wither off and die. Too much of this disease in a grower’s crop can result in
low yields and poor quality. The second primary commodity during this time period is
Cauliflower and is affected by these diseases. Low quality, reduced yield, and higher production
costs ultimately result in financial losses for the months January through March. Agricultural

7
operations that focus on the production of only a few commodities rather than various different
crops bear greater risks than those who diverse their company (Killgore, 2013).
San Ysidro recognizes this potential fallout to farming and is looking to minimize their
risk in the industry by further diversifying their farm. The company is interested in expanding
into the markets of kale, cabbage, and Brussels sprouts by substituting acreage used for growing
broccoli, to grow these experimental commodities. Diversifying the company’s crops into these
three different markets will help minimize the company’s risk in the competing markets, help to
generate greater profits from higher yields of these crops, as well as allow the company to
determine and analyze the costs and benefits of production associated with these crops.
Hypothesis
San Ysidro will be able to generate 10% greater profits during production through further
diversification into brussels sprouts, cabbage, and kale.
Objectives
The goals of this study are as follows:
1) Calculate the costs associated with production of these crops.
2) Calculate the revenue generated from sales based on harvest yields and USDA market
prices.
3) Calculate profitability indicators and ratios to determine whether diversifying will
generate greater profits .
Justification

8
This feasibility study will provide most beneficial to those living in the central coast of
California, farmers specifically. Since the study was performed on the central coast, those living
in the area itself and other similar surrounding areas will be able to directly relate to the study.
As well as those living in surrounding areas, those also living in areas of similar climate as the
Central Coast will find this study to be most beneficial.
Those interested in the business aspect of a farm, but have no background knowledge,
will be able to learn the basic costs derived from production as well as how revenue is generated.
Along with the basic costs and revenue of production, those unfamiliar with the subject will be
able to learn basic, but necessary, profitability ratios and indicators that help determine the
financial strength of a company. Though the study is more beneficial for those interested in the
business side of farming, this study also provides important relevant managerial accounting
principles and steps to developing a business plan that are necessary for the success of any
business.
Central Coast farmers have the greatest potential to learn from this study. The general
farming industry will find relevance in this study with information regarding fundamental farm
management techniques such as planning and the implementation of strategies that aim to help
improve the company. Other agricultural farmers in the surrounding area that face similar
problems of low profits in the Winter time would find an alternative to production to help
increase profits with this study. Farmers that specialize in broccoli production and face similar
diseases as San Ysidro does or even looking to expand crop production, will have a possible
alternative to production to help increase profits.
9
CHAPTER 2
LITERATURE REVIEW
Business Plan Development
Behind every successful business lies a successful business plan (Lesonsky, 2010).
Without a plan a company has no sense of direction, guidance, or even purpose in an industry
(Von Wirén-Lehr, 2001). Business plans create the opportunity for companies to assess current
strengths and weaknesses within the company, as well as opportunities and possible threats that
remain out of the company’s control. This assessment of a business is known as a SWOT
Analysis, and allows a company to review the traits or qualities of the company that could be
seen as beneficial or detrimental (Dyson, 2004).
In starting a business plan, a company must decide what it looks to accomplish as a
whole (Von Wirén-Lehr, 2001). The company must decide the type of organization it chooses to
be, as well as what the company looks to contribute to its particular industry (Von Wirén-Lehr,

10
2001). Goals are developed and integrated into the business plan to assist in monitoring a
company’s progression towards reaching its accomplishments during production. A company
generally has a final or end goal that the it is constantly working towards, as well as many other
smaller goals that contribute to progressing towards that final goal. Once a company has
developed its goals, it is important to determine how these goals are going to be accomplished.
The next step in developing a business plan involves integrating methods and strategies
that will help a company to accomplish its goals (Von Wirén-Lehr, 2001). Company owners will
meet with General Managers to express company goals and discuss possible methods in
accomplishing these goals. At this stage the company starts to develop its SWOT analysis and
begins to analyze company strengths and weaknesses, as well as opportunities and threats outside
that exist outside of the company (Dyson, 2004). This is also an opportunity for the general
managers to communicate any obstacles or discrepancies between plans (Von Wirén-Lehr,
2001). Consulting with others throughout the company allows for owners to receive the input of
others and generate new possible ideas within the business. After consultation, the business is
ready to begin implementing the plan into effective practice.
Implementing a strategy effectively into a business is often the most difficult step in the
business plan development process (Von Wirén-Lehr, 2001). Here the company attempts to carry
out the business plan with the theoretical framework applied to the company specific practices.
At this stage the company is able to analyze the practical outcomes of their plan. The company is
able to tangibly view the positive and negative aspects of the plan through performance
indicators, and can begin to make recommendations to correct any problems or unintended
consequences.

11
Finally in finishing a business plan there are the final recommendations (Von Wirén-
Lehr, 2001). In this step, owners and managers meet to discuss the productivity of the plan and
any problems that they have run into, if any. From here the company continues to carry the plan
and addresses any problems as they occur.
Managerial Accounting
Managerial accounting is meant to provide companies and business managers with
information, generally in regards to financials, that is relevant to the company and aids in the
decision making process (Hayes, 1977). Fundamental knowledge in managerial accounting
principles can possibly dictate a company’s financial success.
General knowledge and understanding of balance sheets, income statements, and of
retained earnings statements are essential to the success of any business. Balance sheets are used
to visually represent the layout of a company’s total assets, what they own, in accordance with
the total liabilities and equity of the company at a single point in time. (Barry, 2012) The assets
of the company are what the company owns and uses to operate (Investopedia, 2013). The
liabilities are what the company owes to others and the equity of the company represents the
company’s overall net worth. There are a series of different assets and liabilities within the
balance sheet and it is important to know and understand the difference in each.
In accounting there are two types of assets, current and non-current assets (Investopedia,
2013). Current Assets represent everything the company owns that has a life-span of a year or
less or can be converted into cash within a year. Non-current assets represent what we own that
will take more than a year to be converted into cash.

12
Just like assets, there also exist current and non-current liabilities. Current liabilities
represent everything that is owed by the company that can be paid off within a year, where as
non-current liabilities take a longer than a year to pay off. (Investopedia, 2013)
Income Statement
Income statements represent the total revenue and expenses of a company over time.
(Barry, 2012) The scope of an income statement, from an Agricultural business perspective, is to
cover the revenues, expenses, nonfarm adjustments such as income tax expenses, and lastly the
income taxes of a business.
The first area covered in an income statement is revenue generated by the farm. Revenue
is generated primarily through the sales of a company’s crops to farm cooling distribution centers
or through sales contracts (Barry, 2012).
Expenses of the farm covers all variable and fixed costs that are generated during
production such as fertilizer and pesticide application, as well as repairs to field equipment and
rent (Barry, 2012). Variable costs include all costs and inputs that vary based on the amount of
units used or purchased during production such as herbicides and fertilizer applications. Fixed
costs are those that stay the same and do not change on a monthly basis such as cost of rent and
depreciation of machinery.
Financial Strength Ratios
Financial Strength Ratios measure the financial strength of a business as well as indicate
the profitability of a business for a specific time period. Financial ratios serve as profitability
indicators revealing the current financial status of a business (Sander and Haley, 2008). The
13
ratios help influence the decisions of management for the company, specifically limited financial
capital. Profitability indicators help management better communicate to lenders and business
partners an array of relevant information such as the financial well-being and profitability of a
company, as well as the overall net worth of a company (Giampietro, 1997). A list of important
financial ratios and formulas that help measure the overall performance and profitability of a
business include: net income, net profit ratio, gross profit, gross profit ratio (Accounting For
Management, Financial Statement Analysis, 2012), current assets, hard assets, and the
company’s rate of return on farm assets as well as the return on assets (Barry, 2012).
Before the financial ratios of the company are calculated, the company must calculate the
components that compose these financial ratios such as the company’s net income, gross profit,
as well as its total revenue and expenses.
Net Income, or net profit, is the total revenue of a company subtracted by the total costs
of production as well as any other depreciation, taxes, or expenses (Investopedia, 2013). Net
income measures the total profitability of a company during different accounting periods (Barry,
2012). Accounting periods in which revenues are greater than costs results in a net profit for the
company, and periods in which costs are greater results in a net loss in the company (Barry,
2012). Though net income helps to measure profitability of a company, it is important companies
use other financial formulas to measure the profitability of the actions of a company. Companies
are able to calculate the net profit ratio by calculating net profit (Investopedia, 2013).
The net profit ratio helps measure the amount of money a company is able to generate for
profit from its sales (Accounting for Management, Financial Statement Analysis, 2012). This
value indicates a company’s ability to withstand adversities within the market such as low
demand for products or even sudden drops in market prices (Financial Statement Analysis,

14
2012). The higher the net profit ratio is for a company indicates the company’s ability of taking a
substantial loss during production. Along with both the net profit and net profit ratio, gross profit
also serves as an important profitability measure.
Gross profit is calculated by taking the total net sales of a company and subtracted by the
cost of goods sold as well as any other costs to purchases during the account period or any other
incurred costs during the possession of inventory or product. (Barry, 2012) It is the money that is
leftover from sales after the cost of company goods from production have been subtracted
(Wesley, 2010) The gross profit of a company serves as a production indicator in measuring the
efficiency of a company’s use of resources (Investopedia, 2013). Gross profit helps to measure
the profitability of a company and is used to calculate profit margins (Kent and Demand Media,
2013). Once the gross profit has been calculated, then this value can be used to calculate the
gross profit ratio (Accounting For Management, Financial Statement Analysis, 2012).
The gross profit ratio helps measure a company’s profitability by measuring a company’s
gross profit, total revenue generated from sales minus the costs of production, all over the net
sales for the accounting period multiplied by 100 (Financial Statement Analysis, 2012). This
ratio helps measure a business’s ability to cover its expenses and still generate a profit, generally
the higher the ratio the better off that business is financially (Financial Statement Analysis,
2012). Other important useful information that can be used to measure financial performance is a
company’s return on farm assets as well as their return on assets.
There are two important measures of profitability in measuring the performance of a
company’s assets (Barry, 2012). Those two profitability measures are a company’s return on
assets and a company’s rate of return on assets. The return on assets, or ROA, of a company
helps to measure the profit returns on assets before any interest is paid to lenders or any

15
withdrawals paid out to firm owners. The ROA is calculated by taking a company’s net income
divided by the total cost of its assets (Investopedia, 2013). This formula measures the return a
company is making on its investments. The ROA of a company indicates how efficient a
company is in generating returns on its investments. A company’s rate-of-return of farm assets,
or ROFA, represents the rate of return on a company’s average investment in assets during
production for the accounting period (Barry, 2012). To calculate this ratio a company must first
calculate its Income from operations and add any farm interest expenses and any other income
from assets, as well as subtract any costs unpaid for operating labor. This value is then divided
by the average total assets for the accounting period to calculate the company’s rate of return.
Along with this profitability ratio, it is important to also understand the different types of assets
such as current and hard assets (Investopedia, 2013).
In a typical balance sheet there exist several different types of assets. There are current
assets, non-current assets, and hard assets. Current assets represents everything within that
balance sheets that the company owns and is capable of turning into cash within a year or less in
time, while everything else taking longer than a year to convert to cash represents a company’s
non-current assets (Investopedia, 2013). The current assets of a company help in funding the
daily performances of a company. Examples of such current assets include cash and other
accounts receivables, inventory, prepaid expenses and other belongings capable of being turned
to cash. Hard assets differ from current and non-currents assets being that hard assets represent
physical tangible objects with monetary worth such as equipment buildings or farming
equipment.
Two other ratios relevant to measuring the financial performance of a company include a
company’s rate of return on equity, ROFE, and a company’s return on equity, ROE (Barry,

16
2012). The return on equity represents the returns of a company after all borrowed funding for
the company has been accounted for. The ROE of a company is calculated by dividing the net
income by the total equity of all shareholders within the company (Investopedia, 2013).
Shareholders equity is the total assets of a company subtracted by the total liabilities of a
company (Ready Ratios, 2013). Equity is the total net worth of a company represented by the
invested cash from investors, as well as the retained earnings of a company (Kennon,
Shareholders Equity, 2013). The retained earnings are all profits from others investments and are
generally paid out in dividends by a company. Using this to calculate the ROE of a company will
indicate the efficiency of the company in generating profits from outside investors and
shareholders (Kennon, Return on Equity, 2013). The higher the return on equity, the better the
company is at generating cash within itself. Using the ROE, a company can then calculate its rate
of return on equity or ROFE for short.
The ROFE of a company measures the rate of return of equity back to the shareholders
(Barry, 2012). It measures the capital equity that is employed within the farming operation
(Morgan Community College and Agribusiness Department, 1997). The ROFE of a company is
calculated by taking the net income from production and subtracting any unpaid labor or
management and dividing this value by the average total equity of the company. The higher the
value of the company’s ROFE, the more profitable that business is. After calculating these
different ratios, managers are better able to assess company performance and begin to outline
plans and actions for future production.
The last and most important ratio to calculate for a company is a company’s internal rate
of return. This ratio indicates the profitability of production of a company by measuring the
profits generated from company investments (Barry, 2012). The higher the internal rate of return
17
the more profitable a company is. Banks and similar Farm credit lenders prefer to loan money to
companies with high internal rates of return because it is an indication that a company will be
able to pay back the creditor back on any loans to fund the business. The internal rate of return of
a company is calculated by dividing the yields from production by one plus the interest rate or
desired rate of return from production. This number is then subtracted by the initial investment
(Barry, 2012).
Farm Management
Today farm managers are faced with greater obstacles in the decision making process
with society more concerned about food safety, environment, and health regulations. Over recent
years society has began to value more sustainable farming systems due to their natural
preservation of the environment (Pacini, 2003). As stated earlier the key to a successful business
is a successful business plan, however proper management is also necessary for the success of
any business. Management of an agricultural business is different than an Industrial business
being that the operations farming systems rely largely upon a various number of external factors
such as weather, as well as results of production may vary depending on these factors and so
management decisions may vary accordingly (Cowell and Clift, 1996). The Fourth Edition of
Principles of Agribusiness Management describes the management process as first deciding the
overall goal of the company, then determine and analyze possible alternatives to accomplish
company goals, decide on an alternative and implement this decision, and finally ending by

18
following up with the decision (Beierlein, 1986). General common objectives of farmers are to
sustain yields, as well as income during production (Guvenc and Yildirim, 2006). Due to the UN
Conference on Environment and Development, implementation of sustainability practices has
reached the highest concern among society within the past couple of decades (UNCED, 1992).
Similar to developing the business plan, the farm needs to decide in the direction of the
business by establishing goals and implementing decisions that reflect and help the company
move towards accomplishing those goals. (Kay, 1994) As society makes further advancements in
technology and sustainable technique in agriculture, management decisions or constantly being
affected with managers having to make decisions regarding commodities to produce; inputs to be
used; and how much of each input to use. Regardless of situational circumstances, there are a set
of skills that any well-equipped manager should have including the ability to plan, implement
strategies, monitor the results of performance, and adjust to any problems or incidents that may
occur.
Planning: As mentioned earlier, a key component of management is the ability to carefully develop
a plan based on personal goals or interests of the manager(s). (Kay, 1994) It is beneficial for
companies to develop goals is so a company knows the general direction it is headed. Often
managers must assess the current situation of the company and come to senses as to what
resources are available to the company. In the case of too few resources being available to the
company, then the manager must figure a plan as to how to obtain the resources needed for
production. Managers must consider the resources that are available to the company. Today,

19
regulations today prohibit farmers from using workers that are not current U.S. citizens (U.S
Department of Homeland Security, 2012). This regulation creates a demand in labor as well as
decreases the amount of labor available during harvest. This lack of labor forces the grower to
reassess the farms available resources, and in some cases growers will hire third party labor
contractors in the event a lack of labor is available (Kay, 1994).
In creating a plan for an agricultural business, a manager must decide whether it would
like to run the operation under a strategic or tactical type of management (Kay, 1994). Strategic
management is the careful planning of business actions/production long-term, while tactical
management is centered on more short-term actions to run the business.
Strategic management is a continuous process that involves the company to identify the
company’s particular needs in running the business (Kay, 1994). This strategic process requires
the manager to assess the overall mission, goals, resources, surroundings, and strategies of the
business.
The overall mission of the business is a description of what the company/organization
ultimately looks to accomplish in the coming years of business (Kay, 1994). This statement
generally is carried out and embeds the goals of the company and the reason as to why the
business exists. Once a plan has been thought through carefully and thoroughly, a manager
begins to implement the strategy into practice (Kay, 1994).
Implementation: Implementing a strategy requires a manager’s ability to put a plan into action. These
actions include gathering the correct amount of resources for production, coordinating operations
of the company, as well as the overall overseeing of production (Kay, 1994).
20
The implementation stage involves the “tactical” management of the business and is
concerned with the short-term day-to-day activities of the business.
Control
The control aspect of management is a reference to the monitoring and input of data from
production. Data from production include information such as costs of harvest, production
yields, and even dates of when certain actions, like fumigation, were performed (Kay, 1994).
Greater control within a company allows for a manager to accurately and correctly monitor
whether the company is heading in a direction in coalescence of the final goals of the business
(Kay, 1994). However, often managers are unable to predict every likely occurrence in the
scheme of their plan. Because of this managers may find it beneficial to possess skills in
adapting.
Adjustments are often necessary due to a manager’s inability to meet objectives that are
expressed in the production plan (Kay, 1994).
The Brassica Family
The Brassica, Brassicaceae, family is commonly identified and associated with the
mustard family of plants (Bidlack, Shelley, and Kingsley, 2011). Crops from this particular
family of vegetables are commonly known as cole crops (Delahaut and Newenhouse, 1997). The
origin of this family of vegetables started in Europe (Delahaut, 1997), as well as countries near
the Middle-East such as Turkey, Pakistan and Iran (Bidlack and Shelley, 2011). According to
Stern’s Plant Biology, the origin of many of today’s commonly cultivated crops such as cabbage
and broccoli were derived from these various areas. The most frequently grown crops from this
21
family include broccoli, brussels sprouts, regular and Chinese cabbage, cauliflower, horseradish,
kohlrabi, radish, and turnip.
Broccoli is one of the many cole crops that comes from the Brassica family (Bidlack
2011). The plant is best grown during the fall and spring time, though it has been known to have
been grown during the summer the summer time. Growers do not prefer to grow during the
summer however, due to the crops natural attraction of pests such as cabbage aphids,
diamondback moths, as well as cabbage loopers (Sanders, Broccoli Production, 2013).
Generally broccoli plants are grown in hotbeds within a plant nursery, and transplanted
over to the field when the plant is mature for production. A hotbed is a growing technique which
involves an enclosed bed of that is heated through manure fermentation that helps to promote
plant growth (Merriam-Webster, 2013). Plants are then transplanted into the field of production
once they have reached a stage of adequate maturity (Sanders, Broccoli Production, 2013).
Generally growers want the leaves of the plant to develop a waxy layer, known as suberin that
protects the plant from burn damage in the application of sprays (Bidlack, 2011). The toughness
of the leaves of a plant is directly correlated with the decomposition rate of a plant, as well as the
natural defense mechanisms of the plant against fungal colonization (Cornelissen and Thompson,
1997).
In a typical two row per bed growing operation, grower’s average anywhere from around
28,000 to 43,000 plants per acre. Though fertilizer applications and inputs may vary depending
the operation, general nutrients that are recommended to promote better plant growth and yields
include 85-120lb of Nitrogen, 170-240 lbs. of Phosphorus pentoxide (Johll, 2007), as well as
170-240 lbs. of Dipotassium pentoxide (Broccoli Production, 2013). Application of these inputs
helps to promote better growth of the plant as well as promotes to better yields and prevent
22
diseases during production. Under proper management average yields per acre of broccoli on
average range between 400 to 500 twenty-lb. cartons an acre. Yields in contribution with market
prices help growers to make a profit in competitive markets.
Over the past couple of years the price of broccoli has been above an average price of
$15. Currently broccoli markets, according to USDA, show a steady fluctuation between the
average prices of $17 to $18 markets (United States Department of Agriculture, 2013). Within
the past couple of months the broccoli market has had several spikes within the average market
price, some minor and some major. Earlier in January a spike resulted in an average market price
of about $33 for a 20 lb. carton.
Brussels sprouts are another cole crop that belongs to the Brassica family (Sanders,
Brussel Sprouts, 2013). This crop attracts Aphids, moths, as well as flies and other common
pests. (Rijn, 2008) Similar to broccoli, brussel sprouts may be grown by means of direct seed or
through transplanting (Sanders, Brussel Sprouts, 2013). The crop grows best in cool, humid,
Mediterranean climates especially those specifically on the coast-line of California. Commonly
brussels sprouts are grown in rows that around 3 to 3.5 ft. wide and average between 6,700 to
around 12,500 plants an acre. Pests that are attracted to this cole crop are similar to those of
broccoli, but also include more Harlequin bugs, cutworms, thrips, as well as cabbage maggots
and aphids (Brussel Sprouts, 2013). Best method of management for pests and weeds in brussel
sprouts is through chemical application. Other applications that help promoted better growth for
brussel sprouts include fertilizers such as “8-8-8” with an application of 700 to 1000 lbs., as well
as 10 lbs. of Boron and 30 lbs. of Nitrogen. The numbers within the 8-8-8 fertilizer represent the
quality of the fertilizer (Brady and Weil, 2010). The first number represents the percentage of
total nitrogen within the fertilizer, the second is the available phosphate, and the third number

23
represents the amount of soluble potash within the fertilizer. The use of these chemical
applications overall promotes a healthier overall growth of the plant. Under proper care and
management, growers are able to obtain good quality yields of around 7,000 lbs. per acre
(Sanders, Brussel Sprouts, 2013).
USDA prices show an overall increasing trend in the average price in the markets of
Brussels sprouts (United States Department of Agriculture, 2013). The average price in markets
for Brussels sprouts has remained above an average of $20 since 2005. In 2011, there was a
major fluctuation in price, in which average price of that year was $38.35. And in 2012, brussels
Sprout prices returned to an average price of $28.17 and currently are at an average market price
of $26.40.
Another common cole crop similar to broccoli and brussel sprouts are cabbage (Bidlack,
2011). The crop is commonly grown for commercial production in the state of North Carolina,
with average cabbage acreage between 10,000 to 12,000 acres (Sanders, Cabbage Production,
2013). Good average yields of this crop range from 400 to 500 crates or 10 to 12 tons. The most
common problems within this crop that prevent good yields are issues involving pests and weed
management, as well as the application of fertilizers within the soil. Pests that impose problems
to cabbage growers include cabbage worms, loopers, and maggots, aphids, flea beetles, and
diamond back moths. The best method for pest and weed management with cabbage crops
include chemical control, however, natural cultivation is an adequate measure in weed
management for cabbage. Cabbage crops are best suited in soils that are slightly acidic with pH
values between 6.0 and 6.4. Along with this preference of soil acidity, cabbage crops also call for
an application of 800 lbs. an acre of 10-10-10 fertilizer containing 10 to 20 lbs. of borax per ton.
It is important that growers also involved with the production of green peas be weary of this

24
application. Low levels of boron within green pea crops can be toxic and cause burning within
the roots of the plant. Another application to be noted within cabbage production is the frequent
applications of nitrogen. Due to the large necessity of nitrogen required by cabbage, crops
require that farmer’s side dress between 25 to 30 lbs. an acre two weeks after transplanting. Side-
dressing is a technique used to describe the process of mixing fertilizer within the soil
(Dictionary.com, 2013). Again, under proper management yields generally range between 400 to
500 crates or around 10 to 12 tons. Average prices of cabbage in the U.S market have fluctuated
between $14 and $18 markets the past couple of years (United States Department of Agriculture,
2013). In 2012, the average price of the cabbage market $21.66, and currently the average price
of cabbage is at $19.01 per crate.
Kale is another cole crop and is the considered one of the hardiest of commonly
cultivated cole crops (Delahaut, 1997). Kale is able to withstand both high and low temperatures
and is suitable to grow during any season for production. Though the crop is able to be growing
in hot temperatures, it is best to grow the crop in cool summer seasons or during the fall or
winter seasons of production (Oregon State University, 2002). General fertilizer applications per
acre that are necessary to ensure healthy plant growth include 60-100 lbs. Nitrogen, 80-120 lbs.
of Phosphorus pentoxide, 60-120 lbs. of Potassium, 30-50 lbs. of Sulfur, and 0-4 lbs. of Boron as
well as any other necessary nutrients. Common pests of Kale that affect yields are those similar
to cabbage and other cole crops such as aphids, flea beetles, caterpillars, and whiteflies (Carroll,
2013).
Kale yields average to about 3,200 an acre of 1-lb. dozen bunches (Oregon State
University, 2002). Three primary means for harvesting Kale include whole plant harvest,
bunched heads, or whole plants with stripped leaves. Overall, U.S. markets show that the average
25
price for Kale shows an increasing trend in price (USDA Agricultural Marketing Service). With
the exceptions of 2008 and 2009, the overall average price of Kale in the market according to
USDA prices shows a steady increase from $13.78 in 2006 to a price of $20.13 in 2012.
Currently the average price of Kale is at an average of $19.59.
CHAPTER 3 METHODOLOGY
Procedures for Data Collection
By incorporating brussels sprouts, cabbage, and kale production within San Ysidro’s
farming operation, the company will increase its current profitability during January through
March. Revenue will be calculated based on yields of the company and current prices within the
industry markets. Revenue will also be incurred through various contracts established with local
distribution centers and food chain networks such as Beachside Produce, and Apio Fresh. Along
with the revenue generated from sales of production, there are also the costs associated with the
production of brussels sprouts, cabbage, and kale. Once total costs have been gathered along
with the total revenue from sales, then San Ysidro is able to determine its net profit for the
production period.
Prior to transplanting crops, all fields must be prepared and undergo ground preparation.
Ground preparation has changed over recent years from conventional tillage to minimum tillage.

26
The primary difference between the two styles of ground preparation is the use or no use of a
plow. Conventional tillage uses a plow to deep till the soil to an approximate depth of 1 to 1.5
feet. Minimum tillage uses and Arizona disc which only works the top 6 to 8 inches of soil. The
title Arizona is based upon the minimum tillage program originating from Sundance Farms in
Coolidge, Arizona. San Ysidro Farms uses many styles of the Arizona minimum tillage program
to expedite ground preparation periods (Sun Dance Farms).
There are seven different ground preparation jobs performed on each field before it is
ready to be transplanted. The process starts with a chop of the previously harvested crop
followed by a lift and retrieval of the drip tape in the field, and then again re-chopped again to
reduce stubble in the ground. Once the previous crop has been chopped down, it is chopped up
even further and mixed into the soil with an Arizona Disc. The disc of the equipment chops the
stubble from the previous crop, while at the same time penetrating the root zone and mixing up
the soil. The Arizona also brings soil beneath the root zone to the surface and tills it up with the
soil already at the top of the root zone. This helps to mix up nutrients within the soil and is better
for the crop. The next piece of equipment used in the field is unique to only San Ysidro Farms
known as the “AK”. The “AK”, short for Arizona Koenig, mixes up the soil even further with
two shoes digging in between the beds and knives mixing the soil of the bed in between the
rows. The soil is then finely mixed with a rototiller that is attached at the end of the equipment.
Before mixing up the soil even further running the Arizona a second time, a piece of equipment
known as the “Arizona Fertilizer” (AF) is run through the field to mix fertilizer into the soil.
After this the Arizona is ran through again, the field is then mulched or shaped and compacted
into beds. The beds, or rows, of the field are shaped into wide-beds. Wide-beds are rows that

27
allow for more than two rows of the same crop to be planted at once. Once the field has been
mulched then it is ready to be sprayed, transplanted, irrigated, and eventually harvested.
Costs incurred during these various tillage activities are from the maintenance of
equipment. Tractors need to be serviced roughly every 2,000 miles as well as the blades, shoes,
and discs of the various pieces of tillage equipment. These supplies are purchased from a local
hardware store, in which San Ysidro is billed the costs of supplies purchased at the end of every
month. When tractors and other various pieces of equipment such as the company mulcher are
not being used for production, due to the necessity of service, then the company is not optimizing
production. Servicing only incurs costs and produces no revenue for the company.
Along with ground preparation costs, there are also the costs of inputs applied during
production. Such applications include the use of insect or pesticides to rid of bugs/pests,
herbicides for the purpose of killing invasive weeds, and the application of fertilizers to stimulate
plant growth. A crop will undergo three different sprays during production. The first spray is
directly after ground preparation and is meant as a fumigation treatment of existing pests within
the field. The second spray is an application of AN-20 Band with Goaltender and Trifluralin.
This second application of spray helps to rid of weeds and burns any weed the spray comes in
contact with. The third and final spray comes when the plant starts to develop even more and
starts showing signs of pest pressure. This third spray is done through an “over-air” application
and helps to rid of natural pests. Other input applications include the use of fertilizer to stimulate
plant growth and this is combined in the ground preparation stage to mix necessary
macronutrients deep within the soil for the growth of the plant. These macronutrients are
released when mixed with water, which requires the proper amount of irrigation so that water is
released down past the level of root growth in the crop.
28
Costs incurred from the use of pest and herbicide material is based on the amount used.
San Ysidro will purchase a bulk supply of basic sprays and fertilizers used in the early stages of
production of all its crops such as the AN-20 band, Goaltender, and Trifluralin in which the
chemicals are kept on site of the company. These chemicals are purchased from a third party pest
and herbicide company and stored in a safe plastic cylindrical barrel. San Ysidro is billed at the
end of each month for the materials purchased. Along with the costs of chemicals used on a
regular basis, there are the costs of other chemical applications from third party organizations
such as Crop Production Services. These costs are based on the amount of materials applied
during overnight sprays and other jobs. These costs are also billed to San Ysidro at the end of the
month.
Irrigation is required throughout the entire growth process of a crop. It can help loosen up
hard rocky soil in areas where the soil is too firm to be broken up. Water is also needed to help
the plant sustain growth from the moment it is transplanted to the period in which it is harvested.
Irrigation is done one of two ways during the growing process, which are through the use of an
irrigation piping system or through the use of drip system irrigation. The pipe used in San
Ysidro’s operation are standard 3-inch by 30 ft. aluminum pipe with 17-inch risers 7/64-inch
nozzle diameters. In a traditional piping irrigation system, pipes are connected and placed every
six beds in the wide-bed production system. Several main lines are connected to valves at the end
of the field and are connected to the pipe laid in the field. The main line pipe is connected to a
booster pump that starts the pumping of water and releases it into the irrigation system within the
field. The other technique used to irrigate was drip irrigation. In drip irrigation, a mainline tape is
placed at one end that connects three smaller lines of tape designed to run across the entire bed of
the crop. One line is placed in the middle of the bed and one on each end of the bed. At the end
29
of the row is a ditch meant to direct and manage any type of minimal runoff water. Irrigation
scheduling is situational, and is based on the field and that field’s soil type. Some fields have soil
with more clay and others more sand, which is going to have an effect on the necessary amount
of irrigation (Brady and Weil, 2010). The quality and make-up of the soil is going to determine
the level of permeability or the rate in which water will pass through the soil, as well as the
amount of water the soil is capable of retaining. For this reason solely, it is imperative to have
good ground prep practices. With the proper amount of irrigation, the plant is able to sustain
living and is eventually ready to be harvested.
General water costs for the cost of irrigation during production for the accounting period
are based on a company irrigation matrix. This company irrigation keeps track of the various
different fields of production for San Ysidro farms, as well as the acreage of those fields.
Harvesting is the last operation of the farm that affects cost and generates revenue.
Harvesting is performed through a third-party labor contracting company. Labor costs are
variable depending on the amount of time it takes the crew to finish harvesting a field. A
foreman is in charge of the harvest crew and keeps track of the quality and quantity that is
harvested in a field. These amounts are reported during San Ysidro Farms morning meetings.
Once the field is done being harvested, the process is repeated in preparation for the next
upcoming crop. A trailer with the field’s harvested product is transported to Beachside, a local
produce cooling and distribution center, where the product is then stored and eventually sold on
the market.
The costs of labor and transportation of the yields from harvest are billed directly to San
Ysidro at the end of each month, just like the other costs of production from the various third
party organizations. San Ysidro will receive two separate bills during these stages of production.

30
One bill will be from the third party labor contractor for the costs of labor based on an hourly
wage to complete the harvest job. The second bill that San Ysidro will receive will be from the
cooling company that the crop yields are being sent to. This bill will layout and describe any
costs involved with the cost of transportation as well as the cost of storage of San Ysidro’s crops
within the cooler.
All records that are addressed in every morning meeting are recorded for review and
financial analysis. Along with the information recorded during these daily meetings, there are
also the spreadsheets and overall accounting records generated by the main office of San Ysidro.
These accounting records are based off of billing statements from third party labor contractors,
as well as other companies San Ysidro does business with. Revenue on these accounting records
are based cash receipts the company receives from their produce. Eventually this information is
entered into FAMOUS Software for further breakdown and analysis.
Procedures for Data Analysis
Once all of the data is collected and entered into San Ysidro’s system, it is used to
generate the financial statements of the company and compared with financial statements of the
past or secondary data of the farm. The most important financial statement in the analysis of the
secondary data collected is the income statement. The income statement will allow San Ysidro to
view a detailed account of the revenue as well as costs generated during production (Barry,
2012).
The income statement will allow San Ysidro to identify which variables costs are the
greatest, as well as which crops or products are generating the most revenue during production.
San Ysidro creates a financial statement similar to an income statement and balance sheet in
31
which they call a Field Summary Sheet. This sheet displays all variable and fixed costs for each
field that is harvested. At the end of each of these sheets there is the total acreage for the planted
field. Total costs are divided by the total acreage to determine the cost per acre for the field. This
process is done for each individual crop for every field. This process is also done for the net
revenue for the field to determine the net gain or loss for the period. These numbers are then
recorded into San Ysidro’s working excel sheets for further analysis.
Each field is recorded and grouped by the different commodities grown within the
company. Information such as the yield for the given field, gross value of the sale, harvest costs,
variable, and fixed costs, and the total net value from these fields. The averages of the same
information is also recorded to give a better look at the impact of some of these fields in
production. Total income for the crops is recorded on a monthly basis based on receipts from
sales. The income on a monthly basis for each crop is calculated by dividing the total revenue of
the crop by the crops total number days of growth. The same is done for the various different
costs of production. This calculated value represents the cost and net gain or loss from
production on a per day basis. The value is then multiplied by the number of days per month,
which will vary depending on the month of production. This provides the company with a visual
representation of where are accumulating in production, as well as indicates the period in which
the company can expect an income from the crop. These values need to be calculated for all
crops. Once the monthly costs and revenues of each crop have been recorded, these numbers are
then added together to determine the net loss or gain for the entire month. This is done for each
month and from here, production over the previous years can be compared with the current 2013
production season. Greater net profits for each month, specifically in the months of January,
February, and March, will indicate if production is doing better with the growth of these new
32
crops. Calculating whether net profits are greater or not is determined by taking the current
productions years net profits and subtracting them from the year being compared.
Assumptions
For the purpose of time constraints, this study assumes constant weather and technology.
The labor necessary during harvest is assumed to be available for the course of the study. Results
of production during the fall season are assumed to be similar to those of the winter season for
this study.
Limitations
Though this study outlines basic costs associated with Brussels sprout, cabbage, and kale
production, the results of this study will only provide to be relevant to farming operations located
in similar Mediterranean environments in the state of California. Though the costs associated are
relevant to any farming operation, farming operations performing in different areas throughout
the United States might experience different yields due to the surrounding environment of the
operation. Farming operations located on the East Coast of the U.S. would not find relevance in
this study due to the harsh climatic environment provided during the winter season.
Along with climatic limitations, this study also deals with the limitation of time
constraints. Since this study is being performed during the fall season, yields may not provide to
be the same as they would be if this study were performed during the winter season of
production. Recommendations are being made off the financial profitability indicators outlined
within the literature review. More accurate results would be provided if this study were
performed during the winter season.

33
Chapter 4
DEVELOPMENT OF THE STUDY
Data Collection Problems
During the course of the study, San Ysidro experienced minor challenges that were not
expected or outlined in the limitations section of the previous chapter. In order to achieve a more
desired outcome for the study, a number of factors needed to be considered and in coalescence
with one another. Such factors included the scheduling of each the different commodity, so that
the company was not harvesting too much or too little during the production period. The need for
these factors to be in unison was in order to minimize the risk of loss in company revenue, as
well as continue a steady progressive flow of financial income. Problems that occurred during
the course of the study were as follows:
1) Create a new planting schedule with the new commodity mix and determine the planting
date for each commodity.
2) Determine a target volume of yield for the given period (January-March).
3) Coordinate the planting schedule to make sure the company is not harvesting too much
or too little and are able to fulfill contractual obligations.
4) Acquire sales contracts with various sales and distribution companies, such as Apio and
Beachside Produce, for the new commodities.
5) Develop, maintain, and improve farming practices to promote better growth and quality
for the Sprouts, Cabbage, and Kale.
6) Determine the labor necessary, as well as the harvesting period for each commodity.

34
7) Collecting and organizing the financial data to determine the effectiveness in increasing
the profitability of the company using FAMOUS software.
8) Finally, the last step was to adjust accordingly to the financials received from the
commodities, as well as the physical response of the commodities from production.
It was difficult to make sure these factors would line up to meet the desired expectations we had
set for the study. Through communicating amongst various growers and distribution companies,
most of these factors were straightened out. Growers were able to provide information regarding
the total number of days until each crop would be ready to harvest. San Ysidro refers to this as
the “Days to Maturity” of a crop. Distributors were able to point out rough estimates for the cost
of production, as well as contracts that would be manageable on both ends of the deal.
Analysis
The process of analyzing and testing the hypothesis for the study began with the
development and planning of San Ysidro’s planting schedule. Incorporating three entire new
crops into the production mix proved to be a difficult task as the company did not know when
each crop would harvest or how long it would take to grow the crop before the company would
start to see returns from production. Also, it was unknown what variety would be best to weather
the tough climatic conditions during months of January, February, and March. Through a series
of consultations with a San Ysidro seed representative, Santa Fe Nursery, and local farmers with
growing experience, the company was able to determine rough estimates of when the various
crops would start to be harvested and from that point make adjustments to the schedule.
The first Kale plantings showed the days to maturity had been overestimated. San Ysidro
had originally predicted an 80 days to maturity for the Kale, but it was ready for harvest at 50

35
days. Kale proved to be different than broccoli and cauliflower. By the time San Ysidro was
finished harvesting its first planting, located in field 11 North A, the crop had gone through
seven separate harvests. Field 44 West(W) was being grown at the same time, but this field had
been chopped in half the amount of time than that of 11NA. Because 44W had been chopped too
soon, this field only had half the number of harvests.
Unlike the kale plantings, the first series of cabbage plantings were not as much of a
challenge or learning experience due to the nature of the crop only requiring one harvest period
per planting. The same could be said for the Brussel Sprouts.
The growing process of these various crops was only the first half of the study. Once all
the crops had reached maturation, a harvest would follow within a few days. Sales of these crops
for San Ysidro took place roughly a week after harvest in which the product was transported
from the field and stored in a cooler. The sale value for each commodity is represented each
week by an income summary provided by the two sale organizations. The summary included the
volume received, the sales price for the volume, and a gross income estimate. This financial data
was inputted into a working database for the company that would give a detailed look at the
various different costs and revenue generated by each commodity, and even a breakdown of
costs incurred on a monthly basis by each crop.
Due to time constraints, financials were not gathered for the new crops within the winter
months. However; since the new commodities are under contract, financials are based on the
expected yield to fulfill the contractual agreement and the price San Ysidro is receiving along
with the associated costs of production. Through FAMOUS software, financials were generated
demonstrating the revenue brought in from each different crop and the different costs associated
such as Harvest, Fixed, and Variable costs. Along with this information, these financial
36
statements also indicated the total amount of acres for each crop. With this information available
it was easier to generate the costs, revenue, and yields of each individual field as well as each
different crop. Though the projections for the new crops are subject to vary, the information still
provides useful in comparing the financial data of the different commodities.
Before projections could be made, raw data first had to be collected and input into Excel.
San Ysidro had a working excel template to work from that already had pre-existing information
from crops of previous years. Information entered into the program included the revenue and
costs from total production and the dates of important steps for production of each crop such as
cultivation and spraying/fertilizer application. Dates of these important activities were derived
from the records of the daily meetings held each morning. Along with these important dates, the
days to maturity of each crop was entered to help determine when certain actions should be done.
The dates of these actions were determined by subtracting the date of the action from the total
days of maturity and then dividing by the total days of maturity. The number calculated
represents the stage of growth the crop is in when the action should be taken. The following
formula can be used to calculate this:
(Total Days to Maturity - Days until action performed)/ Total Days to Maturity= % Stage
of Growth of crop Activity was Performed
Calculating this number proved to be beneficial when creating the planting schedule as the
company was able to predict when certain actions should occur during the production process.
Over time, this method of record keeping has allowed for San Ysidro to build a working database
for the company and eventually start picking up trends within certain crops. This is only the
production side of the record keeping process, as there is still the financial information from
sales that needs to be recorded.
37
As mentioned previously, San Ysidro’s financial information is based upon billings from
sales that increase the accounts receivables of the company, as well as various billings entered
into FAMOUS software detailing the different costs associated with production. This
information, once entered into FAMOUS, was then re-entered into the working Excel sheets of
San Ysidro.
Through the use of FAMOUS software, field summaries were generated that give a
detailed account of the yield, gross revenue, harvest, variable, and fixed costs, as well as the total
net profit or loss during the period of growth for each crop. This process was done for all the
Broccoli, Cauliflower, Brussel Sprouts, Cabbage and Kale crops. To calculate things even further
within the crop accounting of San Ysidro, each field was calculated on a per acre basis by taking
the above information and dividing those numbers by the total number of acres of the planted
field.
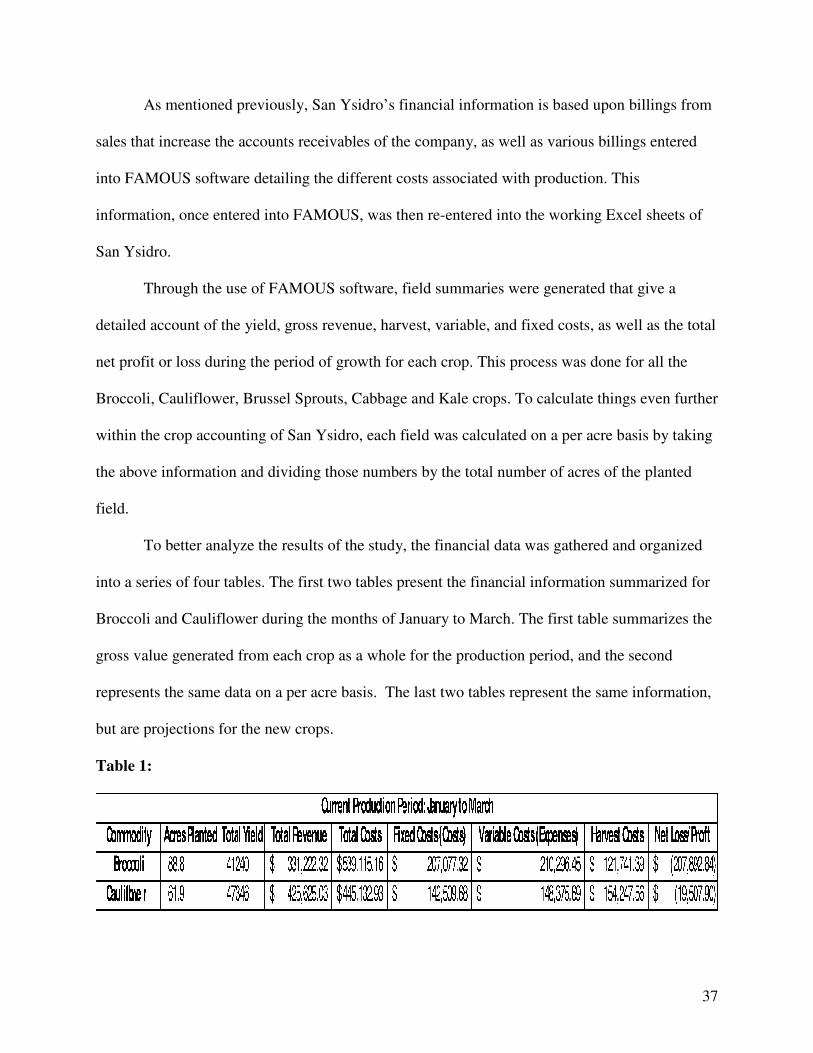
To better analyze the results of the study, the financial data was gathered and organized
into a series of four tables. The first two tables present the financial information summarized for
Broccoli and Cauliflower during the months of January to March. The first table summarizes the
gross value generated from each crop as a whole for the production period, and the second
represents the same data on a per acre basis. The last two tables represent the same information,
but are projections for the new crops.
Table 1:

38
As mentioned earlier in the problem statement, and as demonstrated here in the table,
both broccoli and cauliflower have not made money for the company during the winter months.
The costs to grow broccoli are too high for San Ysidro to make any sort of profit. The costs for
Cauliflower are too high as well, but these costs are significantly less than that of broccoli. The
primary reason for the escalation of costs results from large DTM values. For example, a winter
broccoli crop will take 120 days to maturity compared to a summer broccoli crop at 75 days. The
additional 45 days allow for additional fixed costs to enter as well as occasional variable costs.
Additionally, broccoli yields are normally lower in the winter due to the harsher growing climate
the crop encounters. Finally, the quality of crop is less during the winter than summer due to the
same reason. These three conditions culminate in the financials and are represented by large
financial losses.
A commodity comparison chart of both broccoli and cauliflower for 2012 and 2013,
located in the appendix, shows the two most costly variable expenses on a per acre basis are
management salaries and transplants. Broccoli had higher transplant costs per acre and
Cauliflower had higher management salaries per acre. The next table shows a breakdown of the
same crops on a per acre basis for the same production period.
Table 2.
Table 2 gives a better look at the averages for the two commodities per acre. Harvest
costs for Cauliflower were the largest contributors to the total costs. The table demonstrates, for
the production period, that Cauliflower does not incur a net loss for the company nearly as much
39
as broccoli. However, the crop is still at a loss and is not a desirable for San Ysidro. These
numbers are derived and summarized from the raw data of the company located within the
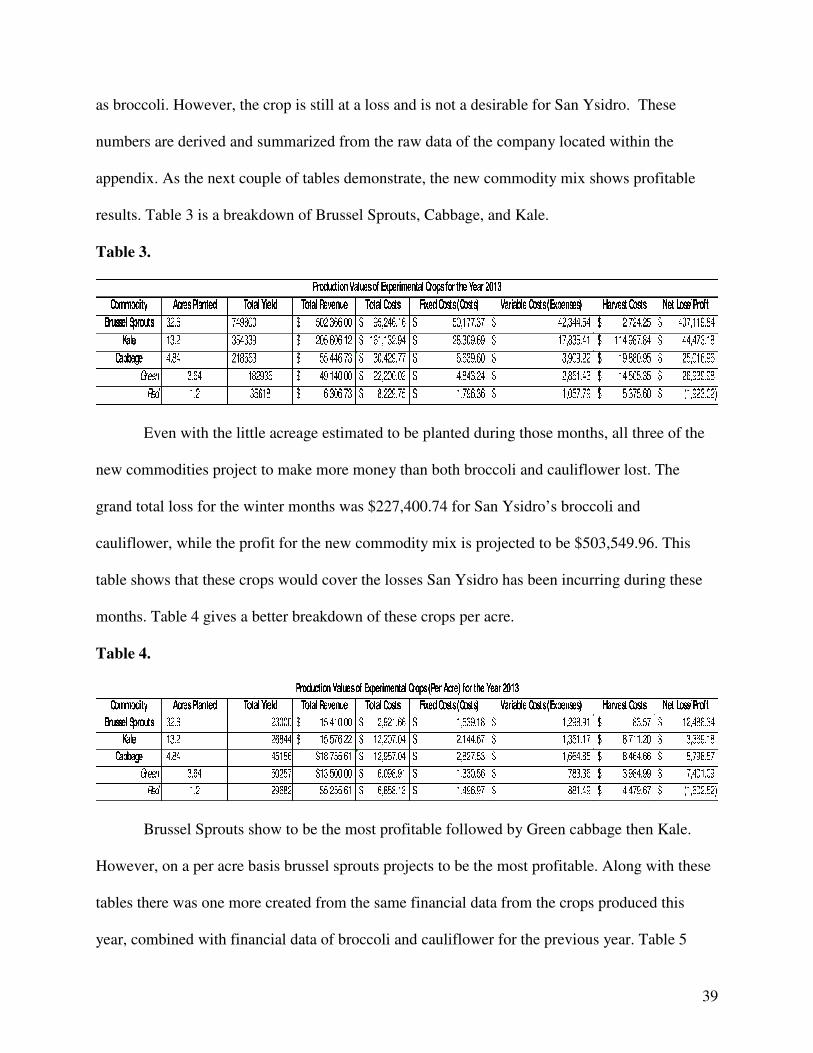
appendix. As the next couple of tables demonstrate, the new commodity mix shows profitable
results. Table 3 is a breakdown of Brussel Sprouts, Cabbage, and Kale.
Table 3.
Even with the little acreage estimated to be planted during those months, all three of the
new commodities project to make more money than both broccoli and cauliflower lost. The
grand total loss for the winter months was $227,400.74 for San Ysidro’s broccoli and
cauliflower, while the profit for the new commodity mix is projected to be $503,549.96. This
table shows that these crops would cover the losses San Ysidro has been incurring during these
months. Table 4 gives a better breakdown of these crops per acre.
Table 4.
Brussel Sprouts show to be the most profitable followed by Green cabbage then Kale.
However, on a per acre basis brussel sprouts projects to be the most profitable. Along with these
tables there was one more created from the same financial data from the crops produced this
year, combined with financial data of broccoli and cauliflower for the previous year. Table 5

40
contains two tables. The first table displays the net gain or loss of each crop for the winter
months of 2013. The second table represents the same data, but only for broccoli and cauliflower
for the previous year of 2012. It should be noted that the financial information for the last few
months of 2013 are projections based on per acre values multiplied by the according acreage of
each crop for the production month. Table 6 shows the difference between the production years
on a monthly basis by taking the difference of the net gain/loss of each month for 2013 and
subtracting those values from those of 2012.
Table 5.
Estimate Net Gain/Loss for 2013
January February March
Broccoli $ (251,442.26) $ (542,210.62) $ (993,491.31)
Cauliflower $ (322,029.10) $ (313,136.12) $ (442,200.17)
Kale $ 8,128.47 $ 19,025.59 $ 22,923.34
Brussels $ 57,641.98 $ 219,372.50 $ 151,507.50
Cabbage $ 11,180.85 $ 11,548.17 $ 9,501.07
Net Gain/Loss $ (496,520.06) $ (605,400.48) $ (1,251,759.58)
Estimate Net Gain/Loss for 2012
January February March
Broccoli $ (251,442.26) $ (542,210.62) $ (993,491.31)
Cauliflower $ (322,029.10) $ (313,136.12) $ (442,200.17)
Net Gain/Loss $ (573,471.35) $ (855,346.74) $ (1,435,691.49)
Table 6.
Difference in Net Income
January February March
Difference in Net Income
$ 76,951.30
$ 249,946.26
$ 183,931.91

41
Even though the experimenting crops were only grown during the second half of the year, Table
6 shows that with the new crops San Ysidro will actually make a net profit during the months of
January, February, and March. The financial data shows the month of February being affected
the most from the incorporation of these crops going from a net profit of $95,150.34 to
$345,096.60. A comparison of the three months between this year and last year shows that this
year, 2013, made $510,829.47 more between the winter months. These were the ultimate results
of the study and so far prove to be beneficial as a whole.
42
Chapter 5
SUMMARY, CONCLUSIONS, AND RECOMMENDATIONS
Summary Overall the crops brussel sprouts, cabbage, and kale prove to be beneficial to San Ysidro
for the 2013 production season. The most profitable of these three crops during the study was
brussel sprouts with a net profit of $12,488 per acre. The second most profitable was the green
cabbage while the red cabbage ended up incurring a loss for the company during the growing
period. Green cabbage resulted in a net gain of $7,400 per acre, while red cabbage ended up
incurring a loss for the period of $1,600 per acre. After analyzing the profitability of each of
these crops for the period, a comparison was made between broccoli and cauliflower production
for 2012 on a monthly basis to the production of these crops along with the experimenting ones
of the study for 2013. This comparison focused on the production during the winter months. The
results of the study showed that production for 2013 made more money during these winter
months compared to the year 2012. February had the greatest change in net gain making around
$250,000 more than the previous year. Overall, the 2013 production period for San Ysidro
generated a total of about $510,000 more than 2012.
Conclusions Farming is a challenging process that involves a series of actions and factors that need to
be in coalescence with one another. Such factors include preparing the planting schedule,
choosing the proper crops to grow, the adequate amounts to grow of each crop and the proper
dates that each crop should be planted. Based on an analysis of company financial data, San
Ysidro recognized that the company, more often than not, had been incurring a loss for the
months of January, February, and March for production. A closer look at the financial data of
each crop showed specifically that both broccoli and cauliflower crops have not been doing well

43
during this timeframe. Noticing this trend in the data, San Ysidro decided it would be in their
best interest to start expanding into other crops within the market and start diversifying. The
crops chosen to diversify into, based on analysis of USDA market prices over the previous years,
the crops brussel sprouts, both red and green cabbage, as well as incorporate the commodity kale.
All three crops were grown starting halfway through the production season of 2013 and all three
crops were able to generate revenue along with the associated costs for the company. The
commodities were grown by reducing the total amount of acreage grown for both broccoli and
cauliflower. Total acreage was reduced mostly in the commodity of broccoli due to the large loss
incurred during the 2012 production season in the winter months as well as the profitability of
the new experimenting crops.
As the idea of incorporating these crops began to become a reality, a series of
consultations with different seed representatives was necessary. These meetings were for the sole
purpose of discussing length it would take to grow the crops or days to maturity (DTM) before
the company would start seeing returns in sales. Based on this information the commodities were
planted accordingly and adjusted based on growth trends. Eventually San Ysidro harvested each
of the commodities in which were sold based on the contracts set with Apio. Once San Ysidro
started to receive financials, this information was then tracked and recorded for analysis.
Recommendations After the performance of this study, it would be in San Ysidro’s best interest to continue
the production and growth of these various different commodities. Those looking into further
diversifying their growing operation should start off by evaluating brussel sprouts, cabbage, and
kale. Operators who are incurring losses during the winter months would benefit from this study.
Though the results show that production will benefit as a whole, that is not to say that the crops
will be successful in the winter months as these are merely rough estimates.
44
If this project were to be expanded, starting the analysis during the winter months would
be most beneficial. Running the study during the winter months would provide the tester with
actual results on the performance of these crops during the winter months rather than rough
projections. Those who choose to expand on this study would be able to determine market prices
for the new commodities and any other specific problems that may be encountered during the
months of January to March. As for the recomm San Ysidro should continue to sustain growing
these experimenting crops. The 2013 production season has already showed profitable results for
the company, most notably the results for the brussels sprouts. Upon analysis, San Ysidro should
look to decrease the acreage of Red Cabbage plantings, and consider increasing the total planted
acreage of brussel sprouts and kale.

45
References Cited
Accounting For Management. 2012. Financial Statement Analysis. Accounting For
Management. Retrieved June 2, 2013.
Accounting For Management. 2012. Managerial cost accounting terms and definitions.
Accounting For Management. Retrieved June 2, 2013.
Barry, Peter. J, and Peter N. Ellinger, 2012. Financial management in agriculture (Seventh ed.).
Upper Saddle River, NJ: Pearson Prentice Hall.
Beierlein, J. G., Kenneth C. Schneeberger, and D. Donald Osburn, 1986. Principles of
agribusiness management. Englewood Cliffs, NJ: Prentice-Hall.
Bidlack, J. E., Shelley H. Jansky, S. H., and R. Kingsley Stern, 2011. Introductory plant biology.
New York, NY: McGraw-Hill.Hayes, D. C., 1977. The contingency theory of managerial
accounting. Accounting Review, pp.22-39.
Brady, N. C., and Weil, R. R. 2010. Elements of the nature and properties of soils (Third ed.).
Upper Saddle River, NJ: Prentice Hall.
Carroll, J. 2013. Kale plant protection: Tips for pest and kale disease prevention. Common Kale
Issues – Diseases Of Kale And Garden Pests Affecting Kale Plants. Retrieved June 2,
2013.
Cornelissen, J.H.C., Thompson, K., 1997. Functional attributes predict litter decomposition rate
in herbaceous plants. New Phytologist 135, 109-114.
Cowell, S.J., Clift, R., 1996. Impact assessment for LCAs involving agricultural production Int.
J. LCA 2, 99-103.
46
Delahaut, K. A., and Newenhouse, A. C. 1997. Growing Broccoli, Cauliflower, Cabbage, and
Other Cole Crops in Wisconsin: A Guide for Fresh-market Growers. University of
Wisconsin--Extension, Cooperative Extension.
Dictionary.com. 2013. Side-dress. Dictionary.com. Retrieved June 2, 2013.
Dyson, R. G. 2004. Strategic development and SWOT analysis at the University of Warwick.
European journal of operational research, (152:3), pp.631-640.
Giampietro, M., 1997. Socioeconomic pressure, demographic pressure, environmental loading
and technological changes in agriculture. Agricultural Ecosystem Environment 65, 201-
229.
Groundwater Quality Monitoring Act of 2001, State Water Resources Control Board §§ 10780-
10782.3 (California Enviornmental Protection Agency 2001).
Guvenc, I., and Yildirim, E. (2006). Increasing productivity with intercropping systems in
cabbage production. Journal of Sustainable Agriculture, (28:4), pp.29-44.
Hayes, D. C. 1977. The contingency theory of managerial accounting. Accounting Review,
pp.22-39.
Investopedia. 2013. Accounting terms. In Accounting Terms. Retrieved June 2, 2013.
Johll, M. E. 2007. Investigating chemistry a forensic science perspecitve (Second ed.). New
York, NY: W.H. Freeman.
Kay, R. D., Edwards, W. M., and Duffy, P. A. 1994. Farm management (pp. 281-299). New
York: McGraw-Hill. (Book)
Kennon, J. 2013. Return on Equity (ROE). About.com Investing for Beginners. Retrieved June 4,
2013,
47
Kennon, J. 2013. Shareholder equity. About.com: Investing for Beginners. Retrieved June 4,
2013.
Kent, J., and Demand Media. 2013. Significance of the gross profit margin. Small Business.
Retrieved June 3, 2013.
Killgore, Roy R. 2013. General Manager, San Ysidro Farms. Personal Interview, Santa Maria
(May 20)
Laemmlen, F. 2005, April. Central Coast Agriculture Highlights: Pin Rot in Broccoli.University
of California Agriculture and Natural Resources. Retrieved June 1, 2013.
Lesonsky, R. 2010, June 20. Small business trends. Small Business Trends. Retrieved June 3,
2013.
Morgan Community College, & Agribusiness Management Department. 1997. Rate of return on
farm equity. Ratios. Retrieved June 4, 2013.
Oregon State University. 2002, April 23. Collards and Kale, Commercial Vegetable Production
Guides, North Willamette Research and Extension Center. Collards and Kale,
Commercial Vegetable Production Guides, North Willamette Research and Extension
Center. Retrieved June 2, 2013.
Pacini, C., A. Wossink, G. Giesen, C. Vazzana, and R. Huirne, 2003. Evaluation of sustainability
of organic, integrated and conventional farming systems: a farm and field-scale analysis.
Agriculture, Ecosystems & Environment, 95(1), pp.273-288.
Prairie Swine Centre. 2001, January 1. Nitrates in soil water. Prairie Swine Centre. Retrieved
May 27, 2013.
Ready Ratios. 2013. Shareholders equity. Shareholders Equity. Retrieved June 4, 2013.
48
van Rijn, P., den Belder, E., Elderson, J., Vlaswinkel, M., and Van Alebeek, F. 2008.
Perspectives for functional agro biodiversity in Brussels sprouts.
Sanders, D. C. 2013, January 3. Broccoli production. NC State University: Horticulture
Information Leaflets. Retrieved June 1, 2013.
Sanders, D. C. 2013, January 3. Brussel sprouts. NC State University: Horticulture Information
Leaflets. Retrieved June 1, 2013.
Sanders, D. C. 2013, January 3. Cabbage production. NC State University: Horticulture
Information Leaflets. Retrieved June 1, 2013.
Sander, P. J., and Haley, J. 2008. Value investing for dummies (Second ed.). Hoboken, NJ:
Wiley Pub.
Sun Dance Farms. "Arizona Drip Systems, Inc.: Fuel Saving Equipment, Water Saving
Subsurface Drip Irrigation." Arizona Drip Systems, Inc. - Fuel Saving Equipment, Water
Saving Subsurface Drip Irrigation. Sun Dance Farms, 2012. Web. 11 Dec. 2013.
UNCED ( United Nations Conference on Environment and Develoment), 1992. Agenda 21 – an
action plan for the next century. Enorsed at the United Nations Conference on
Environment and Development, New York.
USDA. 2012. California agricultural statistics (pp. 1-95) (United States, United States
Department of Agriculture: National Agricultural Statistics Service, California Field
Office). CA: USDA National Agricultural Statistics Service.
United States Department of Agriculture. 2013, June 1. Fruit and vegetable market news portal.
USDA: FRUIT AND VEGETABLE MARKET NEWS PORTAL. Retrieved June 1,
2013.
49
United States Department of Homeland Security. 2012, November 29. USCIS - E-Verify. USCIS
- E-Verify. Retrieved June 1, 2013.
United States Department of Labor. 2010, January 11. The National Agricultural Workers
Survey. , Employment & Training Administration (ETA). Retrieved June 1, 2013.
Von Wirén-Lehr, S., 2001. Sustainability in agriculture—an evaluation of principal goal-oriented
concepts to close the gap between theory and practice. Agriculture, Ecosystems &
Environment, (84:2), pp.115-129.
Wesley, C. 2010, July 24. The importance of gross profit. EHow. Retrieved June 3, 2013.
Wilde, M. 2010, April 20. Agriculture Softens The Blow of Recession: The Road To Recovery.
Mason City Globe Gazette. Retrieved May 27, 2013.