a g d i working paper - afridev.org · a g d i working paper wp/16/042 bridging the divide:...
TRANSCRIPT

1
A G D I Working Paper
WP/16/042
Bridging the Divide: Measuring Party System Change and Classifying
Party Systems
Forthcoming: Politics & Policy
Riccardo Pelizzo
Graduate School of Public Policy,
Nazarbayev University.
E-mail: [email protected]
Zim Nwokora
School of Humanities and Social Sciences,
Faculty of Arts and Education,
Deakin University
E-mail: [email protected]
2
2016 African Governance and Development Institute WP/16/042
Research Department
Bridging the Divide: Measuring Party System Change and Classifying Party Systems
Riccardo Pelizzo & Zim Nwokora
October 2016
Abstract
Party systems research has proceeded along two parallel lines of inquiry, one predominantly
“qualitative” and the other “quantitative.” This article attempts to bridge this divide in two
ways. First, by showing that qualitative information can be valuable in the construction of
quantitative measures. Second, by showing that the results from applying theoretically-
sensitive measurement tools can be useful for qualitative classification. These analyses are
performed using an original dataset of party system changes in Sub-Saharan Africa.
Keywords: Political Parties, Political Institutions, Party System Change, Attributes,
Classifying Party Systems, Inter-Party Competition, Party System Stability, Qualitative
Information, Quantitative Measures, Qualitative-Quantitative Divide, Social Science
Methods, Index of Fluidity, Sub-Saharan Africa, Classification.
1. Introduction
Scholarly interest in party systems is motivated in part by a desire to better understand the
inherent characteristics of party systems, but even more so by awareness that these
characteristics can significantly impact on the functioning of political systems. Research has
shown that the characteristics of party systems—or party system attributes—can affect
government stability, political stability, fiscal irresponsibility, and legislative outputs, as well
as numerous other governance outcomes (e.g., Chhibber and Nooruddin, 2004; Mainwaring,

3
1993; Mainwaring and Scully, 1995).
While party system specialists, and political scientists in general, tend to agree that
party system attributes are an important determinant of the functioning and ultimately
survival of political systems, they disagree about how these attributes should be described,
compared and analyzed. Qualitatively-oriented scholars (e.g., Sartori, 2005[1976]; Bogaards,
2004; Siaroff, 2003; Ware, 1996, 2009; Wolinetz, 2004) tend to believe that party system
taxonomies based on qualitative criteria provide the most appropriate approach for mapping
variation in party system attributes. Quantitative scholars are more sceptical of the utility of
such classification schemes and the theories underpinning them, and prefer to analyze party
system attributes using metrics devised to capture the fragmentation (Rae, 1967; Laakso and
Taagepera, 1979), polarization (Dalton, 2008),and volatility (Pedersen, 1979; Bartolini and
Mair, 1990) of party systems. This qualitative-quantitative divide is not an absolute
one:researchers do draw from both traditions, and this was especially true in early party
systems scholarship (e.g., Duverger, 1951; Blondel, 1968). Nonetheless, it remains broadly
accurate to describe the literature as having developed along two parallel lines of inquiry,
separated by methods and fundamental beliefs about how party systems are best understood.
This paper attempts to move beyond the traditional qualitative-quantitative divide by
showing that when quantitative measures are conceived, devised and applied in ways that are
sensitive to theoretical arguments in the qualitative scholarship, they can improve the basic
taxonomic exercise of classifying party systems as types. In other words, theoretically-
informed quantification can improve the rigor of qualitative empirical analysis. We develop
this argument by using the recently developed index of party system fluidity (Nwokora and
Pelizzo, 2015) to measure the extent of stability of patterns of party competition across Sub-
Saharan Africa. The fluidity index, we show, enables a more precise classification of party
systems in this region as “structured” or “fluid” (Sartori, 2005; Bogaards, 2004, 2008;
4
Erdmann and Basedau, 2008).
The remainder of the article is organized in five sections. The first section races the
emergence of the qualitative-quantitative divide, highlighting two themes: the increasing
reluctance of qualitative party system specialists to use quantitative metrics; and the often
crudetreatment that quantitative measurement tools give to qualitative insights. Building on
this discussion, we make the case for deeper integration of qualitative and quantitative
research, arguing that qualitative insights can enable quantitative scholars to construct better
measures and that such measures can be usefully employed in qualitative analysis. Our
demonstration of this argument centers on the classification of party systems, which has been
an important agenda within the qualitative scholarship.
The second section shows that scholars who apply Sartori’s typology—still the most
widely used schema (see e.g., Wolinetz, 2004; 2006)—sometimes reach different conclusions
about the classification of particular cases. In some cases, an apparent disagreement may be
due to a basic misclassification, if a real-world system is classified as a type even though it
clearly lacks the essential attributes of that type. In other cases, however, the disagreement
may be more subtle and depend on judgments about the extent to which a type exhibits a
property. In these more difficult situations, a properly crafted quantitative measure, which is
consistent with the logic of the qualitative theory, can be used to resolve disagreements. We
use the recently developed index of party system fluidity to demonstrate this argument. Given
its newness to the literature, we discuss the index and some of its properties in the paper’s
third section. Then, in the fourth section, we show how it can be used to harmonize three
prominent classifications of African party systems (Bogaards,2004;2008; Erdmann and
Basedau, 2008). The final section summarizes the preceding analyses.

5
2. Emergence of the Qualitative-Quantitative Divide
To explore the emergence of the qualitative-quantitative divide in party systems research, it is
useful to have in mind a clear definition of the terms “qualitative” and “quantitative.” These
terms are widely used in social-science research, but not always consistently. For our
purposes, we draw on the influential scales-of-measurement theory, proposed initially by the
psychologist S.S. Stevens (see Jacoby, 1999), to define these terms. This theory distinguishes
four levels at which entities can be compared. At the nominal level, entities are divided into
classes based on their observable properties or some underlying theoretical criteria. It has
been common to restrict the use of the term “qualitative” to comparisons that operate at this
level, and this is the approach we follow in this paper. The nominal level can be contrasted
against ordinal, interval and ratio levels of measurement, all of which are usually considered
“quantitative.”1
The development of classification schemes to identify and compare distinct types of
party systems has long been central to the qualitative research agenda on party systems (e.g.,
Blondel, 1968; Duverger, 1951; La Palombara and Weiner, 1966; Macridis, 1967; Rokkan,
1968). The types in a typology operate at the nominal level so, strictly speaking, there is no
numerical relationship between them. However, early scholars of party systems used the
quantitative information that was available at that time—namely, the number of parties and
their relative electoral strength—for classification purposes (see especially Wolinetz 2006:
55-56). In this sense, their classification schemes crossed the standard qualitative-quantitative
divide. Duverger (1951) categorized party systems on the basis of the number of parties and
identified “one,” “two” and “multiparty” systems. These categories were types, but the
theoretical dimension used to derive them, the number of parties, is a ratio scale. Blondel
1An ordinal scale gives a rank-ordering of elements, but no indication of the extent of difference between them.
An interval scale permits entities to have differences of degree, while a ratio scale adds to this a meaningful (i.e.,
non-arbitrary) zero value.

6
(1968) examined the share of votes won by the two largest parties and the distribution of
support between the two major parties, and on this basis identified two-party systems, two-
and-half-party systems, multiparty systems with a predominant party and multiparty systems
without a predominant party. This schema nested qualitative and quantitative criteria. Like
Duverger’s typology, it distinguished between types using the number of parties, a
quantitative dimension. Blondel went beyond Duverger, however, by differentiating various
kinds of multiparty systems using qualitative criteria: the existence or absence of a minor
(“half”) party or a predominant party.2But these criteria were operationalized using
quantitative data. The half-party in a two-party system existed when the share of the vote of
the two largest parties exceeded 89 per cent, while a predominant party existed when the
strongest party averaged 40 percent or more of the vote and twice as much as the second
party.
In Parties and Party Systems, Sartori (2005[1976]) proposed what thereafter became
the most influential party systems typology. He distinguished seven distinct types, but
quantitative information was relevant to the theoretical specification of these types and their
identification in the real world. The number of “relevant” parties—that is, parties with
coalitional or blackmail potential—is essential to Sartori’s classification scheme. One-party,
hegemonic-party, and predominant-party systems are characterized by the presence of a
single relevant party, two-party systems are characterized by the presence of two relevant
parties, moderate pluralist party systems have between three and five relevant parties, while
polarized pluralist party systems have more than five parties because that is the level of
fragmentation at which fragmentation exacerbates ideological polarization. Numbers feature
prominently in Sartori’s framework in a second respect: the determination of whether a
2For a detailed study of “half parties” in party systems, see Siaroff (2003).
7
system has one, two, between 3 and 5, or more than five relevant parties largely depends on
the parties’ electoral returns which are expressed in numerical form.
With the exception of a few recent studies (Mainwaring and Scully, 1995; Ware,
1996), the development of qualitative typologies using quantitative information has generally
been abandoned by party system scholars. Party system taxonomists (Wolinetz, 2004: 9)
explain this change by saying that with the development of sophisticated measures of party
system attributes, quantitatively-inclined scholars lost interest in “tiresome exercises in
taxonomy.” New tools to measure attributes such as “fragmentation” and “polarization” were
shown to be associated with far-reaching political and economic consequences, including
government stability (Taylor and Herman, 1971), legislative stability (Pelizzo and Cooper,
2002), the stability of presidential regimes (Mainwaring, 1993), the quantity and quality of
legislation (Tsebelis, 1999), and the prevalence of electoral cycles in fiscal policy (Alt,
Dreyer and Lassen, 2006). Moreover, analyses using the new metrics could largely avoid the
difficulties and uncertainties associated with classification since they required the analyst to
count (in various ways) rather than identify differences of kind. A further criticism of the
qualitative approach applied specifically to the influential Sartori typology. Scholars such as
Peter Mair (1996) argued that due to party system changes since the 1970s—including the
demise of authoritarianism, communism, and fascism in Europe and the weakening of
traditional cleavage structures—there had been a convergence of party systems into the
moderate pluralist category. This crowding of moderate pluralism, and the emptying out of
other types, made classification on the basis of Sartori’s typology less useful for
understanding variation in the functioning of party systems. With quantitative metrics,
however, it was possible to undertake finer-grained analyses of party systems within the
bloated moderate pluralist category. In short, quantitative scholars believed that the new
measures could make a greater contribution than once popular typologies.
8
Meanwhile, qualitatively-oriented scholars, who were at first doubtful ofthe merits of
quantitative measures, became increasingly sceptical of them and keen to expose their
limitations (see e.g., Mair, 1996; Ware, 1996, 2009; Wolinetz, 2004, 2006). This scepticism
is echoed by Bogaards (2004: 174) who recently argued that “attempts to make inferences
about the type of party system on the basis of indexes of party number are seriously
flawed.”Furthermore, Bogaards remarked, “The failure of mathematical indexes to identify
party systems illustrates the tension that exists between the assumption of a continuum
underlying mathematical measures of party number and ‘jumps’ that occur in real-life politics
and are incorporated in discontinuous classification” (Bogaards, 2004:188).This critique of
quantitative metrics has not been matched by innovations from qualitiative scholars to
remedy these problems. There have been only a few attempts to develop new typologies that
improve upon Sartori’s. Crucially, none of these efforts has become popular in the way that
Sartori’s typology did, so this typology continues to dominate in qualitative research even
though scholars are quick to point out its limitations.
On the other hand, qualitatively-oriented scholars have had little choice but to rely on
quantitative metrics. This point is apparent in qualitative studies that aim to distinguish
between “stable” and “unstable” party systems (e.g., Bogaards, 2004, 2008; Erdmann and
Basedau, 2008). This qualitative distinction is important when applying Sartori’s typology in
emerging states, or “fluid polities, ”because Sartori developed separate, and slightly different,
classification schemes for systems that could be considered relatively stable and those that
were unstable. Sartori also proposed a qualitiative indicator to distinguish between these two
classes: the existence or absence of mass parties. But, as we discuss later, this can be a
problematic indicator of stability. Therefore, scholars have usually turned to quantitative
metrics of “volatility” to measure system stability. From a qualitative standpoint, this
approach is less than ideal. It leaves unsettled the question of how to determine a suitable

9
cut-off point to separate stable and unstable party systems. Moreover, these metrics do not
capture the stability of a party system, when this term is conceptualized in the Sartori sense to
mean the pattern of competition—they tend to capture change in the electoral standing of
parties in a party system, which can occur while a pattern of competition remains stable.
To summarize, the early scholarship on party systems made a serious effort to
integrate quantitative and qualitative approaches. But since the 1970s, a division has arisen
between (1) scholars who largely reject qualitative classification and (2) those who defend its
value and continue to apply the Sartori typology, while noting its problems and despite
having to use slightly problematic metrics to conduct their analyses. The development of
these two perspectives—and, to some extent, the emergence of parallel literatures—stands in
contrast to the early scholarship which embraced and mixed quantitative and qualitative
perspectives. In our view, this qualitative-quantitative divide seems likely to have obstructed
potential gains from cross-fertilizing quantitative rigour with qualitative insights. The
remainder of this paper seeks to demonstrate the complementarity of these approaches. In
particular, we aim to show that qualitative insights can facilitate better, more theoretically-
rigorous measurement tools(Collier, La Porte and Seawright, 2012), and these measures can
then be deployed by qualitative scholars in their classificatory efforts.
3. From a “System of Interactions” to a “Party System”
In an important passage in his book, Sartori noted that “parties make for a ‘system’, then,
only when they are parts (in the plural); and a party system is precisely the system of
interactions resulting from inter-party competition. That is the system in question bears on
the relatedness of parties to each other, on how each party is a function (in the mathematical
sense) of the other parties and reacts, competitively or otherwise, to other parties” (2005:39).

10
Thus, following the Sartori perspective, there is no doubt that a party system results from the
pattern of inter-party competition. However, the existence of a pattern of inter-party
competition does not in itself imply the existence of a party system. A party system exists
only if the pattern of inter-party competition is stable over time. In other words, stability of
the pattern of competition is necessary for “parties to make for a system.”While stable
patterns of interparty competition are party systems, unstable patterns of competition indicate
a “fluid polity.” As Sartori explains, “viscosity, resilience, and immobilizing impact of
structures” (Sartori, 2005:217) are what distinguish patterns of inter-party competition in
fluid polities from party systems proper.
While stability or fluidity is a discriminating factor, the pattern of competition—
which is the basis of Sartori’s “types”—is not. This is why Sartori (2005[1976]), and later
Bogaards (2004, 2008) and Erdmann and Basedau (2008), could say that the patterns of
competition in structured party systems were also detectable in fluid polities, and vice versa.
The pattern of competition that gives rise to one-party and hegemonic-party systems in
structured polities is the functional analogue of the dominant authoritarian pattern in fluid
polities. The pattern associated with the predominant-party system in a structured party
system finds its counterpart in the dominant non-authoritarian pattern in fluid polities. Two-
party, moderate pluralist and polarized pluralist systems are the structured analogue of the
non-dominant pattern in fluid polities, while the atomized system is the stable mirror image
of the pulverized pattern in fluid polities.
The widespread application of these categories testified to, and indeed was
responsible for, the success of Sartori’s framework. These categories have been used to study
party systems in all of the major geographical regions, though their best-known applications
have been in studies of structured, and predominantly Western, party systems. In recent
years, the framework has been used to classify party systems in Sub-Saharan Africa
11
(Bogaards, 2004; Bogaards, 2008; Erdmann and Basedau, 2008). The results of these three
well-known classificatory efforts suggest there is some agreement but also some significant
disagreement about how African party systems should be classified using Sartori’s categories.
Given that the framework is meant to capture the fundamental properties of party systems,
such disagreement suggests uncertainty about the applicability of Sartori’s framework or the
characteristics of the party systems in question.
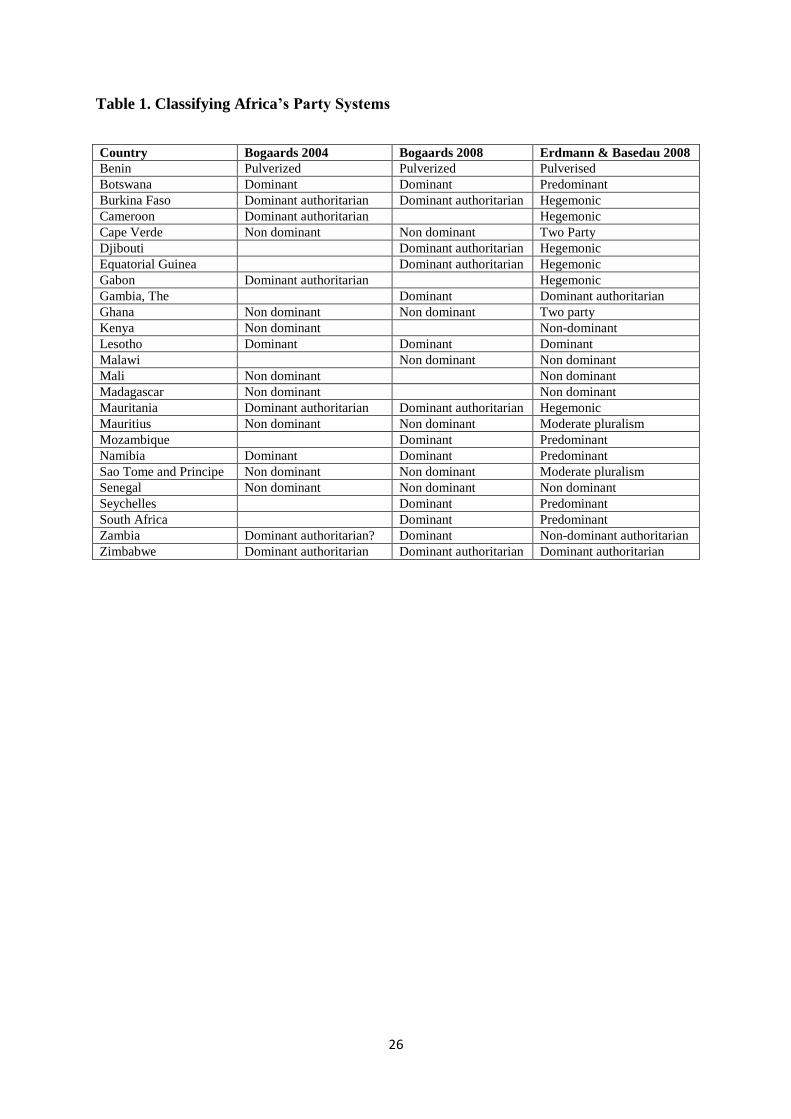
Table 1 presents data concerning the classification of 25 African party systems that
were included either in Bogaards (2004) or in Bogaards (2008) and also in Erdmann and
Basedau (2008). In his 2008 article, Bogaards classified 13 of the 18 party systems he had
classified in his 2004 analysis. In 12 of the 13 cases, the 2008 classification was identical to
the 2004 classification. The only exception is Zambia, which he classified as potentially
dominant authoritarian in 2004 but as dominant in 2008.
Erdmann and Basedau (2008) used a larger sample than Bogaards (2004, 2008), but
the cases analyzed in Bogaards (2004) and in Bogaards (2008) are also included in Erdmann
and Basedau (2008). Comparison of these classifications reveals a mix of agreement and
disagreement on particular cases. If we treat each country as an equivalent case, we can
summarize by saying there are more disagreements than agreements. In fact, the Bogaards
(2004) and Erdmann and Basedau (2008) taxonomies yield identical classifications for only
seven out of 18 countries (Benin, Kenya, Lesotho, Mali, Madascar, Senegal,
Zimbabwe).Comparing Bogaards (2008) and Erdmann and Basedau (2008), only five of the
20 party systems classified by Bogaards (Benin, Lesotho, Malawi, Senegal and Zimbabwe)
are classified in the same way by Erdmann and Basedau.
[Table 1 here]
12
Crucially, the differences between these taxonomies has very little to do with how
systems of interaction are classified. If one recalls that there is correspondence between fluid
patterns and structured patterns—for example, the dominant-authoritarian pattern
corresponds to the one-party/hegemonic-party pattern—then it is clear that Erdmann and
Basedau (2008) classify 17 out of 18 systems of interactions in a similar way to Bogaards
(2004), and 19 out of 20 systems of interaction in a similar way to Bogaards (2008). The only
disagreements not of this kind concern Zambia, where there is not correspondence on the
observed pattern of competition: in Bogaards (2004), the pattern is (probably) dominant
authoritarian; in Bogaards 2008, the pattern is dominant; and in Erdmann and Basedau
(2008), the pattern is non-dominant authoritarian. Hence, in nearly all cases, the
disagreements among these classifications depend entirely on whether patterns of competition
should be regarded as structured or fluid. These disagreements suggest, however, that
determining whether a party system is “structured” or “fluid” is far from straightforward. In
the section that follows, we review some alternative approaches to resolving this issue.
4. Structuration versus Fluidity
When Sartori conducted the analyses that were eventually presented in Parties and Party
Systems(1976), many African countries had just become independent and the parties and
party systems in the region had just been created. It was too early to assess whether these
emergent patterns of competition would “consolidate” or “institutionalize,” and therefore
Sartori chose to regard such patterns as “fluid.”Party system scholars have adopted, over the
years, various indicators to assess the extent of such party system “institutionalization.”
A Sartorian line of inquiry assesses the institutionalization of African party systems
based on the presence/absence of mass parties (Bogaards, 2008: 178), building on Sartori’s
13
(2005: 217) argument that “a party system becomes structured when it contains solidly
entrenched mass parties.” This approach assumes a strong connection between the existence
of mass parties and the stability of the pattern of competition. In Africa, however, proper
mass parties are rare, but there is clearly significant variation in the stability of party systems.
Some studies (Mozaffar et al. 2003; Mozaffar and Scarritt 2005; Bogaards, 2008;
Weghorst and Bernhard, 2014) employ Pedersen’s index of volatility (Pedersen, 1979) to
evaluate party system institutionalization in Africa. Pedersen’s index computes the net
change in parties’ vote or seat totals between elections. This approach works on the
assumption that high volatility indicates absence of consolidation. However, other studies,
such as Bartolini and Mair (1990), challenge this claim. Disaggregating volatility into two
basic types, they argue that while between-bloc volatility—the volatility caused by the vote-
switching across cleavage lines—provides a proper indication of the extent of consolidation,
within-bloc volatility—vote-switching between parties on the same side of a cleavage/issue—
provides no such indication. More recently, Powell and Tucker (2014) decompose total
volatility into “Type A” and “Type B” volatility, which indicate, respectively, vote-switching
to new parties and vote-switching among existing parties. These measures are used by
Weghorst and Bernhard (2014:1730) to argue that the steady decline in Type A volatility and
the corresponding increase in Type B volatility provide “important evidence of the beginning
of party system institutionalization,” and suggest that “that party systems in sub-Saharan
Africa are volatile but institutionalizing over time” (Weghorst and Bernhard, 2014:1708).
Kuenzi and Lambright (2001) apply multiple criteria to assess institutionalization.
They treat institutionalization as a function of acceptance/legitimacy of the electoral process
and results, the stability of party rootedness in society, and the regularity of party
competition. The legitimacy/acceptance of the electoral process is assessed on the basis of
whether a major party boycotts elections, whether losers accept the electoral result, and

14
whether elections are free and fair. The stability of party roots is measured on the basis of
parties’ average age and the percentage of lower chamber seats held by parties created by
1970. Finally, they estimate the regularity of party competition by computing volatility in
legislative elections, volatility of presidential elections and the difference between levels of
volatility recorded in these two types of elections.
Erdmann and Basedau (2008) adopt a two-stage approach to categorize African party
system. In the first stage, they use Sartori’s typology for fluid polities to categorize patterns
of competition in Africa as dominant, non-dominant and pulverized. In the second stage, they
assess whether the patterns of competition previously identified should be regarded as “fluid”
or “structured.” A party system qualifies as “institutionalized” when there have been at least
three consecutive elections, democracy has not been interrupted, seat volatility is no higher
than 40 (according to Pedersen’s index), and average party age is at least 15 years (or nearly
as old as the democratic regime itself).
The approaches applied by Weghorst and Bernhard, Kuenzi and Lambright, and
Erdmann and Basedau each amend the basic volatility index as developed by Pedersen. In the
case of Weghorst and Bernhard, the measurement of volatility is amended, while Kuenzi and
Lambright and Erdmann and Basedau bolster the measurement of volatility by tapping other
party system dimensions. In each approach, however, the measurement strategy is centered
on the volatility of the parties in the system, rather than the system itself. Furthermore, due to
this plurality of approaches, party system scholars have reached different conclusions about
whether particular party systems should be regarded as structured or fluid, and whether
“African party systems” in general should be regarded as structured or fluid. The absence of
mass parties and high levels of total volatility have led some scholars (Bogaards, 2008) to
regard patterns of interparty competition in Africa as fluid, while declining rates of Type A
volatility and the regularity/legitimacy of interparty competition have led other scholars to
15
consider at least some African party systems as increasingly if not properly institutionalized
(Weghorst and Bernhard, 2014).
We suggest a new approach for estimating the extent to which patterns of competition
are fluid or structured in this region, which aims to measure directly the stability of a party
system, rather than the volatility of the parties that make up that system. Like Erdmann and
Basedau (2008), we apply a two-stage approach. Using Sartori’s counting rules and party
system types, we collected electoral data for 49 African polities from their first elections (or
the first since WWII) until and including their 2012elections in order to assess whether
patterns of interaction corresponded to the properties of one-party, hegemonic-party,
predominant-party, two-party, moderate pluralist, polarized pluralist and atomized party
systems. (See Appendix). We believe this method is preferable to Erdmann and Basedau’s
treatment of patterns of competition as dominant, non-dominant and pulverized, for two
reasons.
First, our approach avoids the risk of putting together systems that differ in significant
respects. The dominant category used by Erdmann and Basedau (2008) could apply to the
fluid analogue of the predominant-party system if consistent with democratic practice, but
also to the fluid analogue of the one-party and hegemonic-party systems when coupled with
authoritarian tendencies. However, the distinction between democratic dominance and
autocratic dominance is theoretically and practically important. Similarly, the fact that a
system of interaction has two relevant parties makes it quite different from a system with a
larger number of relevant parties, though both might be considered “non-dominant.” Our
decision to use Sartori’s principal types prevents the conflation of such different patterns.
Second, our approach enables a more empirically-sensitive classification. Because Erdmann
and Basedau (2008) use only three categories to classify patterns of competition, they can
only detect changes among these categories. Using seven categories we can detect not only
16
the changes that Erdmann and Basedau detect, but also changes that occur among those
patterns of competition that are lumped together in Erdmann and Basedau’s (2008)
classification.
Having categorized patterns of competition, we then proceed in the second stage to
detect whether change in the pattern of interparty competition has occurred within a country.
In doing so, we track not only whether a system change has occurred but also the magnitude
of change. Any change in pattern of competition indicates some degree of instability in a
country’s party system, but some changes are more destabilizing than others. Change from a
one-party system to a hegemonic-party system or from polarized pluralism to atomization—
which are contiguous categories—is less transformative than change from a one-party system
to an atomized system. Change from a one-party system to a hegemonic-party system implies
change in the mechanism by which the relevant party secures its relevance, but the number of
relevant parties in the system remains unchanged. Similarly, in a change from polarized
pluralism to atomization, a system that already has a high number of relevant parties becomes
a system with an even higher number of parties. Butif a change occurs between the one-party
and atomized systems we witness change from a system of maximum power concentration to
a system where power is so dispersed that it is almost no longer a system.
Once this information is collected, we follow Nwokora and Pelizzo (2015) by
calculating the magnitude of party system change along three distinct dimensions. One
pertains to the frequency of change; one pertains to the scope or extent or change; while the
third concerns the variety of change, that is, the number of distinct patterns that a party
system goes through in its historical development. Each dimension is relevant for
understanding the dynamics of party systems. Furthermore, they do not necessarily correlate,
which means that a party system can be stable in one sense while being unstable in another.
An example would be a system that undergoes regular changes between the same two types.

17
Such a party system would have a high frequency of change, but a low variety of change. If
the changes occurred between two types with reasonably similar mechanical properties—for
example, the predominant and two-party types—then the scope of change would also be low.
We could conclude, in a party system with this dynamic pattern, that the predominant party
fails to consolidate its predominance over time or the two-party system is unable to ensure
regular alternation of parties in office.
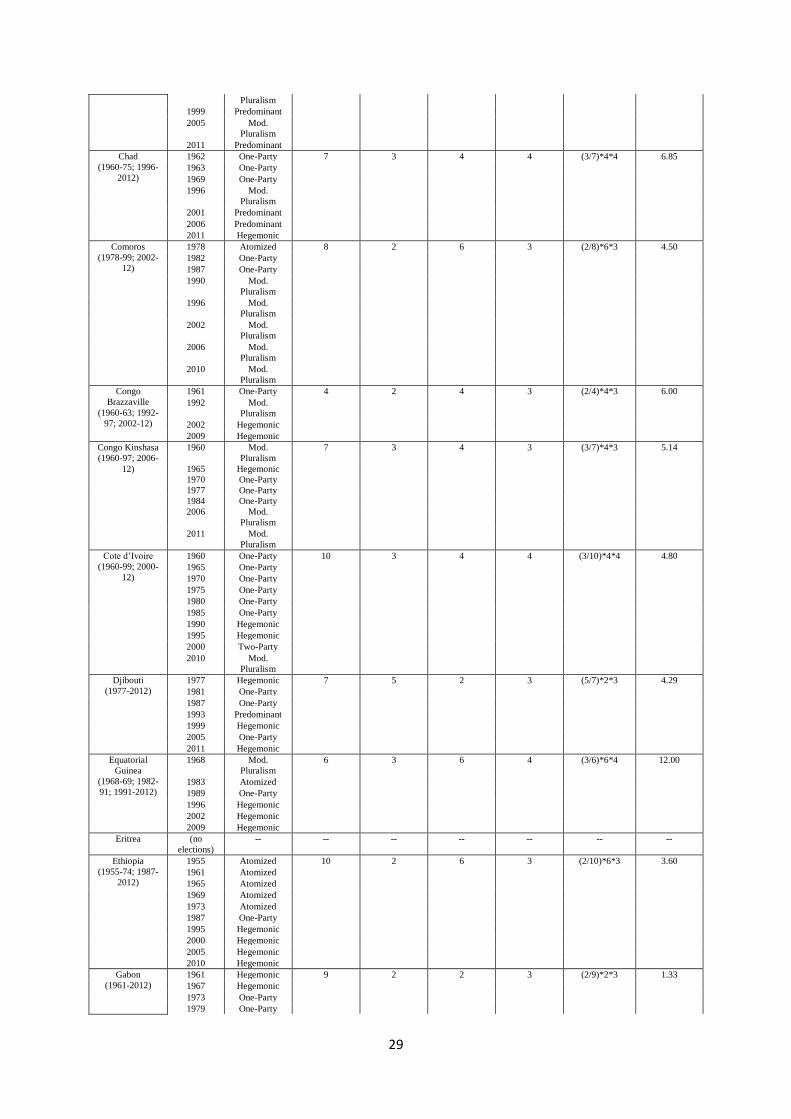
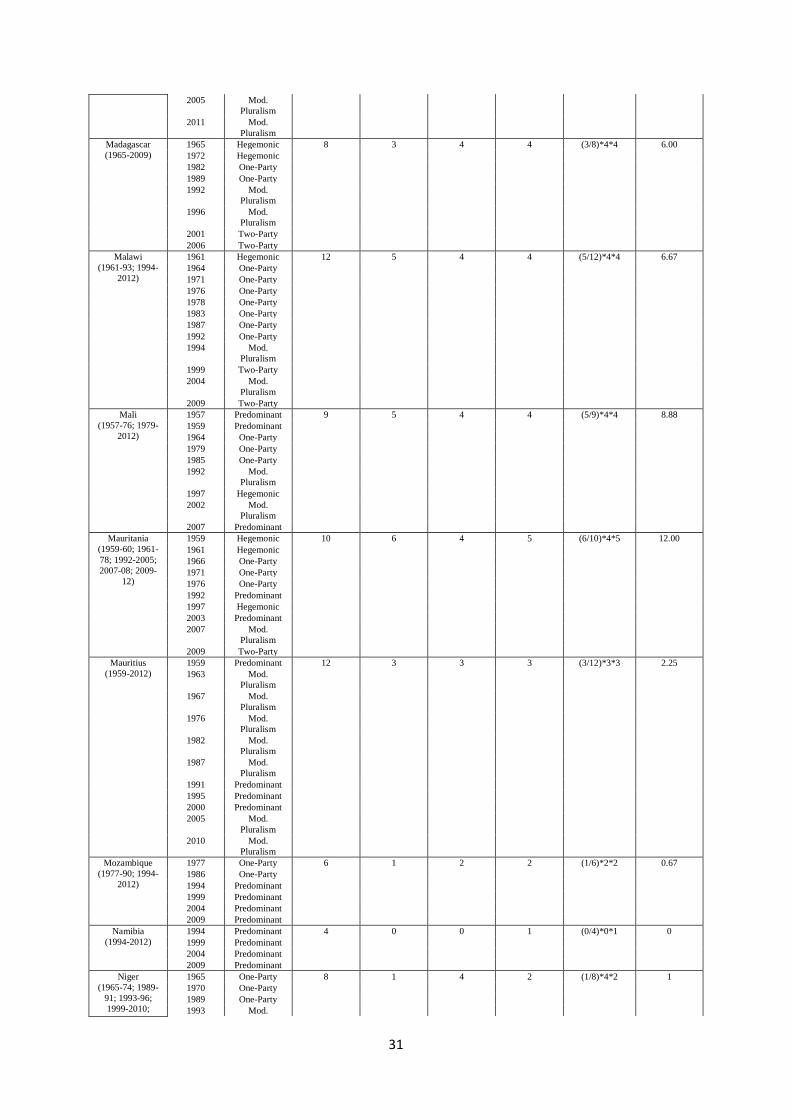
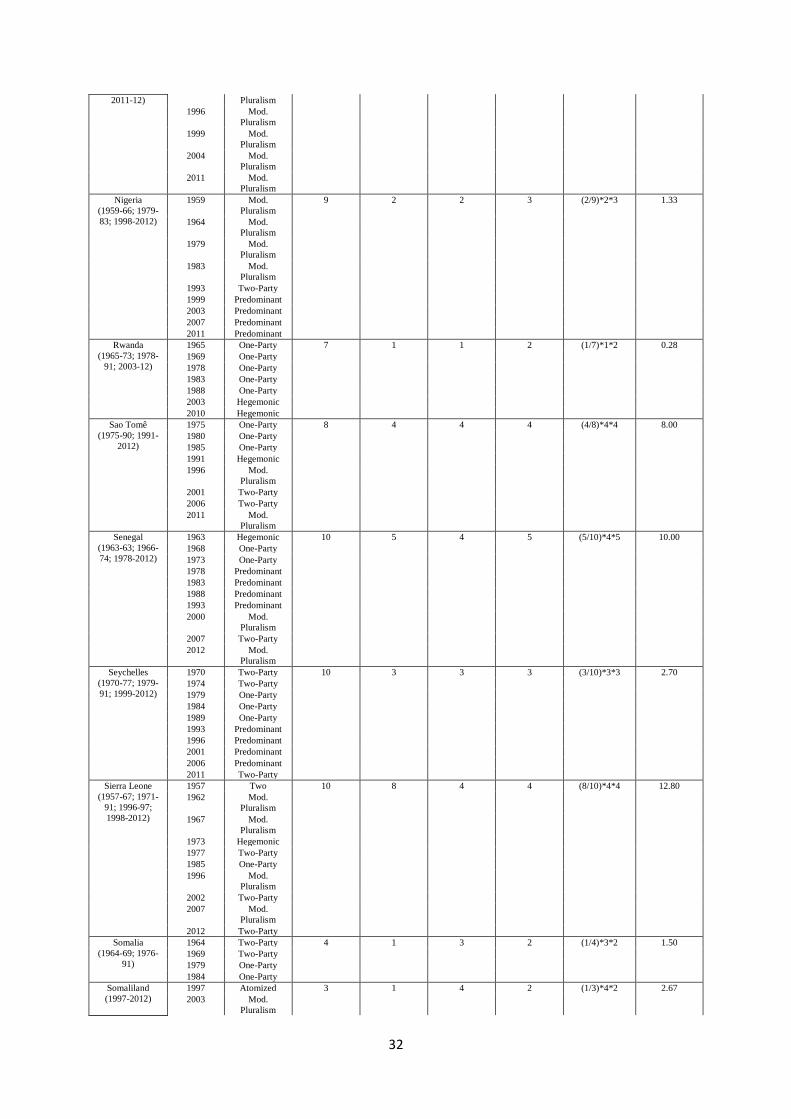
The frequency of party system change is measured by dividing the number of changes
in the pattern of competition by the number of elections (since independence and up to and
including 2012). The scope or extent of change is calculated on the basis of an ordinal scale
with seven points spanning from “one-party system” to “atomized system.”To calculate the
variety of change, we observe the number of different types that are observed in a country
during a historical period. The scores for each sub-dimension are multiplied to produce an
“index of fluidity” score. Let us consider an example to see how this score can be computed.
The Seychelles experienced three party system changes in the period from 1970 until 2012:
from a two-party system (1970-1979) to a one-party system (1979-1993); from a one-party
system to a predominant-party system (1993-2011); and from a predominant-party system to
a two-party system (2011 onwards). These three transitions occurred over the course of 10
elections, giving a frequency of 0.3. The scope of change, from a two-party system to a one-
party system, equals three. The variety of change also equals three. The total fluidity score in
this case is therefore 2.7, which is comparatively low for the region (see Appendix).
5. From Measurement to Classification
The index yields quantitative measures, but it requires input of qualitative data, which relies
on knowledge of the relevant countries’ elections, parties and party systems. Thus, the

18
index’s computation necessitates some bridging of the qualitative-quantitative divide. The
qualitative-quantitative divide is also overcome in a second way: the index can improve the
precision of qualitiative classification. Specifically, the index of fluidity provides analysts
with the information necessary to determine whether patterns of competition are fluid or
structured. As we discussed earlier, the disputed classifications in prominent taxonomies of
African party systems turn on the answer to this question.
Our computations reveal that African party systems display highly variable levels of
fluidity (see Table 2 and Appendix). In countries such as Namibia, South Africa, Botswana,
Djibuti, The Gambia and Zimbabwe, patterns of interparty competition are highly stable. The
party systems of these countries can be properly regarded as “stable” or “structured.”At the
other extreme, the data reveal that patterns of competition in Mali, Burkina Faso, Senegal and
Mauritania have been rather unstable, which sustains the claim that these are fluid party
systems. As a preliminary test of the validity of the index (in the African context), we
correlate the 2012 estimates against countries’ 2008 fluidity scores. This test reveals a very
strong, positive and statistically correlation between these estimates (r = .949, sig. = .000),
which indicates that the measure yields estimates that are stable over time. This suggests that
the index is a reliable tool. Moreover, it suggests that the party systems identified by the
index as being relativley stable are likely to remain so (at least in the short run), while
unstable party systems will tend to continue to display unstable properties.
We also correlated these fluidity scores against several measures that might be
expected to be empirically associated with party system stability, namely Kuenzi and
Lambright’s index of institutionalization, Basedau and Stroh’s index of institutionalization
(Basedau and Stroh, 2008), and the World Governance Indicators’ measure of political
stability (Kaufmann et al., 2014) in 2012.The correlation between fluidity in 2012 and the
level of institutionalization as measured by Kuenzi and Lambright in 2001 is negative, but
19
modest and not statistically significant (r = -.222, sig. = .238). The correlation between
fluidity and Basedau and Stroh’s measure of institutionalization yields a moderately strong,
negative, but statistically insignificant coefficient (r = -.351, sig. = .355).Unsurprisingly,
correlating 2008 fluidity scores instead of 2012 scores yields similar findings.3Overall, these
results suggest that higher levels of party system institutionalization are associated with
higher levels of party system stability and lower levels of institutionalization are associated
with higher levels of fluidity, but these connections are not highly reliable. In the case of the
correlation between the fluidity index and Basedau and Stroh’s measure, estimates of the
consistency of the relationship are also likely to be undermined by the small number (9) of
cases. Finally, the correlation between the index of fluidity and the measure of political
stability yields a moderately strong, negative and statistically significant cofficient (r = -.315,
sig. = .029), which confirms the widespread suspicion that unstable party systems are
associated with politically-motivated violence and unrest. Interestingly, the correlation
between fluidity 2008 scores and the political stability index is also statistically significant,
though the strength of this correlation is weaker than for the 2012 fluidity estimates (r = -
.290, sig. = .045). This finding has an important practical implication: it suggests that fluidity
might have potential as a prognostic tool for estimating political risk; its utility in this
capacity diminishes the further into the future the projection is made.
[Table 2 here]
In addition to being a valid and reliable measure of party system dynamics, the index
of fluidity can also be employed to categorize party systems. As noted above, Erdmann and
Basedau (2008) classified seven party systems (Benin, Kenya, Lesotho, Mali, Madagascar,
Senegal, Zimbabwe) in exactly the same way as Bogaards (2004), with both studies agreeing
3 Correlating the 2008 fluidity scores to Basedau and Stroh’s index produces a coefficient of r = -1.09, sig.
=.780; correlating these fluidity scores to Kuenzi and Lambright’s index produces a coefficient of r = -.236, sig.
= .209.

20
these patterns of inter-party competition are unstable. The fluidity index scores for 2012,
presented in Table 2, largely sustain this claim. In Madagascar, Mali and Senegal, the pattern
of interparty competition has been highly unstable and these systems should therefore be
regarded as fluid. These countries post fluidity index scores that are among the highest in the
sample. However, computing the fluidity index for Benin suggests a party system that may be
more stable than has been conventionally recognized. It posts a fluidity score of 3, which is
comparatively low for the region, but was regarded by Bogaards (2004) and Erdmann and
Basedau (2008) as unstable. Table 2 also shows that if the stability of competition is
measured autonomously (on the basis of electoral returns alone), as the fluidity index aims to
do, rather than heteronomously (on the basis of, for instance, political violence), both Kenya
and Zimbabwe should be regarded as structured party systems. A similar observation might
also be made of Lesotho, which posts a “borderline” fluidity index score.
11 out of the 18 cases that appear in Bogaards (2004) and Erdmann and Basedau
(2008) are classified differently. In most cases—the exception is Zambia—disagreement
consisted in the fact that while Bogaards (2004) regarded all the systems of interaction as
fluid, Erdmann and Basedau (2008) considered them structured. Looking at the data
presented in Table 2, we see that Erdmann and Basedau’s assessment is supported by the
2012 fluidity scores in half of the cases (5 out of 10). In Botswana, Cameroon, Gabon,
Mauritius, Namibia, patterns of competition display relatively little or no fluidity. Therefore,
Erdmann and Basedau are quite correct to regard these systems as structured. On the other
hand, the patterns of competition observed in Burkina Faso, Cape Verde, Ghana, Mauritania,
and Sao Tome and Principe accord more closely with Bogaards’s classification of them as
highly fluid. In the case of the Zambian party system, the disagreement between these
classifications depends on whether that system should be regarded as a dominant or a non-
dominant authoritarian system, but both studies agree on the fact that the pattern of

21
competition should be treated as fluid. The fluidity index scores provide only weak support
for this contention, with Zambia posting a fluidity score similar to the borderline score of
Lesotho.
Comparing Bogaards (2008) toErdmann and Basedau (2008), there are five agreed on
cases (Benin, Lesotho, Malawi, Senegal and Zimbabwe). The 2012 fluidity index scores
sustain the classification of two of these cases (Malawi and Senegal), both of which post
relatively high scores and are classified as being highly unstable in Erdmann and Basedau
(2008) and in Bogaards (2008).However, the fluidity data casts some doubt on the
classification of three cases. As noted earlier (in the comparison of Erdmann and Basedau
(2008) to Bogaards (2004)), the index suggests that the classification of Benin, Lesotho and
Zimbabwe as unstable systems is questionable. Of the 15 cases where these classifications
disagree, only one of these disagreements (Zambia) does not turn on the question of whether
the party system is fluid or not. Of the remaining 14, the index scores again support the two
classification schemes in a roughly even number of cases. The index sustains the Erdmann
and Basedau categorization in seven cases (Botswana, the Gambia, Mauritius, Mozambique,
Namibia, Seychelles, and South Africa); but offers more support for Bogaards’s
classifications in six cases (Burkina Faso, Cape Verde, Equatorial Guinea, Ghana,
Mauritania, Sao Tome and Principe). The party system of Djibuti posts an index score similar
to that of Lesotho and Zambia, and therefore might be reasonably described as “stable” or
“unstable.”
6. Conclusions
We have argued that our knowledge about party systems would improve more rapidly if, in
instead of reinforcing the qualitative-quantitative methodological divide, qualitative and

22
quantitative party system scholars found ways to influence each other’s analyses.
Quantitatively-oriented party system scholars could benefit from the input of qualitatively-
oriented scholars especially when refining quantitative tools. On the other hand, qualitatively-
oriented party system scholars could also benefit from using properly crafted and well-
informed quantitative measures and indexes for their taxonomic purposes.
In this paper we presented a theory-based, qualitatively-informed measure of party
system change and have tried to show how it can improve party system classification. This is
because the index of fluidity can enable party system scholars to establish whether a pattern
of competition is largely structured or fluid. It is not an alternative to classification, we argue,
but an effective tool to make classification more rigorous. The qualitative-quantitative
methodological divide is a relatively recent development. The originators of party system
research (Duverger, Sartori, Rokkan) applied qualitative and quantitative information to
analyze party systems. In this paper, we have also argued that such integration can produce
better scholarship than either numbers-aversion or numbers-obsession.

23
References
Alt, J. E., and Dreyer Lassen, D. (2006).“Transparency, political polarization, and political
budget cycles in OECD countries.” American Journal of Political Science 50(3): 530-550.
Bartolini, S., and Mair, P. (1990).Identity, competition, and electoral availability: The
stability of European electorates, 1885-1985. Cambridge: Cambridge University Press.
Basedau, M., and Stroh, A. (2008). “Measuring party institutionalization in developing
countries: A new research instrument applied to 28 African political parties.” GIGA Working
Paper No. 69.
Blondel, J. (1968). “Party systems and patterns of government in Western
Democracies.”Canadian Journal of Political Science 1(2):167-181.
Bogaards, M. (2004). “Counting parties and identifying dominant party systems in
Africa.”European Journal of Political Research 43(2): 173-197.
Bogaards, M. (2008) “Dominant party systems and electoral volatility in Africa: A comment
on Mozaffar and Scarritt.” Party Politics 14(1): 113-130.
Chhibber, P., and Nooruddin, I. (2004). “Do party systems count? The number of parties and
government performance in the Indian states.” Comparative Political Studies37(2): 152-187.
Collier, D., LaPorte, J., and Seawright, J. (2012). “Putting typologies to work: Concept
formation, measurement, and analytic rigor.” Political Research Quarterly 65(1): 217-232.
Dalton, R.J. (2008). “The quantity and the quality of party systems: Party system
polarization, its measurement and its consequences.” Comparative Political Studies 41(7):
899-920.
Duverger, M. (1951). Les Partis Politiques, Paris, Colin.
Erdmann G., and Basedau, M. (2008). Political parties in Africa: Problems of categorising
and explaining party systems. Journal of Contemporary African Studies 26(3): 241-258.
Jacoby, W. (1999). Levels of measurement and political research: An optimistic view.
American Journal of Political Science 43(1): 271-301.
Kaufmann, D., Kraay, A., Mastruzzi, M. (2014). The Worldwide Governance Indicators
(WGI) project. (www.govindicators.org).
Kuenzi, M., and Lambright, G. (2001).“Party system institutionalization in 30 African
countries.” Party Politics 7(4): 437-468.
Laakso, M. and Taagepera, R. (1979). “‘Effective’ number of parties: A measure with
application to West Europe.” Comparative Political Studies 12(1): 3-27.
LaPalombara, J., and Weiner, M. (1969). Political parties and political development.
Princeton, NJ: Princeton University Press.

24
Lipset, S.M. and Rokkan, S. (1967). “Cleavage structures, party systems and voter
alignments: An introduction.” Pp. 1-64 in Party systems and voter Alignments: Cross-
national perspectives, edited by S.M. Lipset and S. Rokkan. New York: Free Press.
Macridis, R. C. (Ed.). (1967). Political parties: contemporary trends and ideas (Vol. 1322).
Harper & Row.
Mair, P. (1996). “Party systems and structures of competition.” Pp. 49-82 in Comparing
democracies: Elections and voting in global perspective, edited by Lawrence LeDuc, Richard
G. Niemi and Pippa Norris. Sage: Thousand Oaks and London.
Mainwaring, S.(1993). “Presidentialism, multipartism, and democracy: The difficult
combination.” Comparative Political Studies 26(2): 198-228.
Mainwaring, S., and Scully, T.R. (Eds.). (1995). Building democratic institutions: Party
systems in Latin America. Stanford, CA: Stanford University Press.
Mozaffar, S., Scarritt, J.R. and Galaich, G. (2003).“Electoral institutions, ethnopolitical
cleavages, and party systems in Africa's emerging democracies.” American Political Science
Review 97(3): 379-390.
Mozaffar, S., and Scarritt, J.R. (2005). “The puzzle of African party systems.” Party
Politics 11(4): 399-421.
Nwokora, Z., and Pelizzo, R. (2015). “The political consequences of party system change.”
Politics & Policy 43(4), 1-21.
Pedersen, Mogens N. (1979).“The dynamics of European party systems: Changing patterns of
electoral volatility.” European Journal of Political Research 7(1): 1-26.
Pelizzo, R., and Cooper, J. (2002).“Stability in parliamentary regimes: The Italian
case.” Legislative Studies Quarterly 27(2): 163-190.
Powell, E. N., and Tucker, J.A. (2014).“Revisiting Electoral Volatility in Post-Communist
Countries: New Data, New Results and New Approaches.” British Journal of Political
Science 44(1): 123-147.
Rae, D. (1967). The political consequences of electoral laws. New Haven, CT: Yale
University Press.
Rokkan, S. (1968). The structuring of mass politics in the smaller European democracies: A
developmental typology. Comparative Studies in Society and History 10(2): 173-210.
Sartori, G. (1976). Parties and party systems: A framework for analysis. Cambridge:
Cambridge University Press.
Siaroff, A. (2003). “Two-and-a-half-party systems and the comparative role of the ‘half’.”
Party Politics 9(3), 267-90.

25
Taylor, M., and Herman, V.M. (1971).“Party systems and government stability.” American
Political Science Review 65(1): 28-37.
Tsebelis, G. (1999).“Veto players and law production in parliamentary democracies: An
empirical analysis.” American Political Science Review 93(3): 591-608.
Ware, A. (1996). Political parties and party systems. Oxford: Oxford University Press.
Ware, A. (2009). The dynamics of two-party politics. Oxford: Oxford University Press.
Weghorst, K.R., and Bernhard, M. (2014). “From formlessness to structure? The
institutionalization of competitive party systems in Africa.” Comparative Political
Studies 47(12): 1707-1737.
Wolinetz, S.B. (2004). “Classifying party systems: Where have all the typologies gone?”
Paper prepared for the Annual Meeting of the Canadian Political Science Association.
Winnipeg, Manitoba.
Wolinetz, S.B. (2006). “Party systems and party system types.” Pp. 51-62 in Handbook of
party politics, edited by R.S. Katz and W.S. Crotty. London: Sage Press.
26
Table 1. Classifying Africa’s Party Systems
Country Bogaards 2004 Bogaards 2008 Erdmann & Basedau 2008
Benin Pulverized Pulverized Pulverised
Botswana Dominant Dominant Predominant
Burkina Faso Dominant authoritarian Dominant authoritarian Hegemonic
Cameroon Dominant authoritarian Hegemonic
Cape Verde Non dominant Non dominant Two Party
Djibouti Dominant authoritarian Hegemonic
Equatorial Guinea Dominant authoritarian Hegemonic
Gabon Dominant authoritarian Hegemonic
Gambia, The Dominant Dominant authoritarian
Ghana Non dominant Non dominant Two party
Kenya Non dominant Non-dominant
Lesotho Dominant Dominant Dominant
Malawi Non dominant Non dominant
Mali Non dominant Non dominant
Madagascar Non dominant Non dominant
Mauritania Dominant authoritarian Dominant authoritarian Hegemonic
Mauritius Non dominant Non dominant Moderate pluralism
Mozambique Dominant Predominant
Namibia Dominant Dominant Predominant
Sao Tome and Principe Non dominant Non dominant Moderate pluralism
Senegal Non dominant Non dominant Non dominant
Seychelles Dominant Predominant
South Africa Dominant Predominant
Zambia Dominant authoritarian? Dominant Non-dominant authoritarian
Zimbabwe Dominant authoritarian Dominant authoritarian Dominant authoritarian

27
Table 2. Fluidity in Sub-Saharan Africa
Country Fluidity in 2012 Fluidity in 2008
Angola 3.60 4.50
Benin 3.00 2.25
Botswana 0.20 0.22
Burkina Faso 6.86 8.00
Cameroon 3.60 4.00
Cape Verde 6.00 6.86
Djibuti 4.29 4.00
Equatorial Guinea 12.00 14.40
Gabon 1.33 1.50
Gambia, The 0.66 0.73
Ghana 6.00 6.00
Kenya 2.40 2.40
Lesotho 4.50 1.71
Liberia 2.45 2.70
Madagascar 6.00 6.86
Malawi 6.67 5.82
Mali 8.88 8.88
Mauritania 12.00 8.89
Mauritius 2.25 2.45
Mozambique 0.67 0.80
Namibia 0.00 0.00
Sao Tome and Principe 8.00 6.86
Senegal 10.00 8.89
Seychelles 2.70 2.00
South Africa 0.00 0.00
Zambia 4.36 1.20
Zimbabwe 1.00 0.80

28
Fluidity in Sub-Saharan Africa
Country
(Electoral
Regimes)
Year of
Election
Type of
Party System
Frequency Scope Variety
Frequency*
Scope*Variety
Fluidity
Index Score
Number of
Elections
Number of
Type
Changes
Distance
between
Most
Different
Types
Number of
Different
Types
Angola
(1975-2012)
1980 One-Party 5 2 3 3 (2/5)*3*3 3.60
1986 One-Party
1992 Two-Party
2008 Hegemonic
2012 Hegemonic
Benin
(1960-61; 1964-
65; 1968-69;
1970-72; 1991-
2012)
1960 Two-Party 9 3 3 3 (3/9)*3*3 3.00
1964 Hegemonic
1968 Hegemonic
1970 Mod.
Pluralism
1991 Mod.
Pluralism
1996 Mod.
Pluralism
2001 Mod.
Pluralism
2006 Mod.
Pluralism
2011 Two-Party
Botswana
(1965-2012)
1965 Hegemonic 10 1 1 2 (1/10)*1*2 0.20
1969 Hegemonic
1974 Hegemonic
1979 Hegemonic
1984 Hegemonic
1989 Hegemonic
1994 Predominant
1999 Predominant
2004 Predominant
2009 Predominant
Burkina Faso
(1959-66; 1970-
74; 1977-80;
1991-2012)
1959 Two-Party 7 3 4 4 (3/7)*4*4 6.86
1965 One-Party
1978 Mod.
Pluralism
1991 Hegemonic
1998 Hegemonic
2005 Hegemonic
2010 Hegemonic
Burundi
(1962-66; 1979-
96; 2005-12)
1961 Hegemonic 5 4 3 4 (4/5)*3*4 9.60
1965 Predominant
1984 One-Party
1993 Two-Party
2010 Hegemonic
Cameroon
(1965-2012)
1965 One-Party 10 3 4 3 (3/10)*4*3 3.60
1970 One-Party
1975 One-Party
1980 One-Party
1984 One-Party
1988 One-Party
1992 Mod.
Pluralism
1997 Hegemonic
2004 Hegemonic
2011 Hegemonic
Cape Verde
(1975-2012)
1975 One-Party 8 3 4 4 (3/8)*4*4 6.00
1980 One-Party
1985 One-Party
1991 Two-Party
1996 Hegemonic
2001 Two-Party
2006 Two-Party
2011 Two-Party
Central African
Republic
(1959-66; 1981-
2003; 2005-12)
1959 Hegemonic 8 6 4 5 (6/8)*4*5 15.00
1964 One-Party
1981 Two-Party
1992 (Result
annulled)
1993 Mod.
29
Pluralism
1999 Predominant
2005 Mod.
Pluralism
2011 Predominant
Chad
(1960-75; 1996-
2012)
1962 One-Party 7 3 4 4 (3/7)*4*4 6.85
1963 One-Party
1969 One-Party
1996 Mod.
Pluralism
2001 Predominant
2006 Predominant
2011 Hegemonic
Comoros
(1978-99; 2002-
12)
1978 Atomized 8 2 6 3 (2/8)*6*3 4.50
1982 One-Party
1987 One-Party
1990 Mod.
Pluralism
1996 Mod.
Pluralism
2002 Mod.
Pluralism
2006 Mod.
Pluralism
2010 Mod.
Pluralism
Congo
Brazzaville
(1960-63; 1992-
97; 2002-12)
1961 One-Party 4 2 4 3 (2/4)*4*3 6.00
1992 Mod.
Pluralism
2002 Hegemonic
2009 Hegemonic
Congo Kinshasa
(1960-97; 2006-
12)
1960 Mod.
Pluralism
7 3 4 3 (3/7)*4*3 5.14
1965 Hegemonic
1970 One-Party
1977 One-Party
1984 One-Party
2006 Mod.
Pluralism
2011 Mod.
Pluralism
Cote d’Ivoire
(1960-99; 2000-
12)
1960 One-Party 10 3 4 4 (3/10)*4*4 4.80
1965 One-Party
1970 One-Party
1975 One-Party
1980 One-Party
1985 One-Party
1990 Hegemonic
1995 Hegemonic
2000 Two-Party
2010 Mod.
Pluralism
Djibouti
(1977-2012)
1977 Hegemonic 7 5 2 3 (5/7)*2*3 4.29
1981 One-Party
1987 One-Party
1993 Predominant
1999 Hegemonic
2005 One-Party
2011 Hegemonic
Equatorial
Guinea
(1968-69; 1982-
91; 1991-2012)
1968 Mod.
Pluralism
6 3 6 4 (3/6)*6*4 12.00
1983 Atomized
1989 One-Party
1996 Hegemonic
2002 Hegemonic
2009 Hegemonic
Eritrea (no
elections)
-- -- -- -- -- -- --
Ethiopia
(1955-74; 1987-
2012)
1955 Atomized 10 2 6 3 (2/10)*6*3 3.60
1961 Atomized
1965 Atomized
1969 Atomized
1973 Atomized
1987 One-Party
1995 Hegemonic
2000 Hegemonic
2005 Hegemonic
2010 Hegemonic
Gabon
(1961-2012)
1961 Hegemonic 9 2 2 3 (2/9)*2*3 1.33
1967 Hegemonic
1973 One-Party
1979 One-Party

30
1986 One-Party
1993 Predominant
1996 Predominant
2005 Predominant
2009 Predominant
Gambia
(1960-94; 1996-
2012)
1960 Atomized 12 1 4 2 (1/12)*4*2 0.66
1962 Predominant
1966 Predominant
1972 Predominant
1977 Predominant
1982 Predominant
1987 Predominant
1992 Predominant
1996 Predominant
2001 Predominant
2006 Predominant
2011 Predominant
Ghana
(1960-66; 1979-
81; 1992-2012)
1960 Hegemonic 8 3 4 4 (3/8)*4*4 6.00
1965 One-Party
1979 Mod.
Pluralism
1992 Two-Party
1996 Two-Party
2000 Two-Party
2004 Two-Party
2008 Two-Party
Guinea
(1957-84; 1993-
2008; 2010-12)
1957 Predominant 9 4 4 4 (4/9)*4*4 7.11
1961 One-Party
1968 One-Party
1974 One-Party
1982 One-Party
1993 Predominant
1998 Predominant
2003 Hegemonic
2010 Mod.
Pluralism
Guinea Bissau
(1972-80; 1984-
2003; 2005-12)
1972 One-Party 9 1 4 2 (1/9)*4*2 0.89
1976 One-Party
1984 One-Party
1989 One-Party
1994 Mod.
Pluralism
1999 Mod.
Pluralism
2005 Mod.
Pluralism
2009 Mod.
Pluralism
2012 Mod.
Pluralism
Kenya
(1963-91; 1992-
2012)
1963 Predominant 10 2 4 3 (2/10)*4*3 2.40
1969 One-Party
1974 One-Party
1979 One-Party
1983 One-Party
1988 One-Party
1992 Mod.
Pluralism
1997 Mod.
Pluralism
2002 Mod.
Pluralism
2007 Mod.
Pluralism
Lesotho
(1965-86; 1993-
2012)
1965 Two-Party 8 3 3 4 (3/8)*3*4 4.50
1970 Two-Party
1985 Hegemonic
1993 Hegemonic
1998 Predominant
2002 Predominant
2007 Predominant
2012 Mod.
Pluralism
Liberia
(1951-80; 1984-
90; 1997-2001;
2003-12)
1951 Hegemonic 11 3 3 3 (3/11)*3*3 2.45
1955 Hegemonic
1959 Hegemonic
1963 Hegemonic
1967 Hegemonic
1971 Hegemonic
1975 Hegemonic
1985 Two-Party
1997 Hegemonic
31
2005 Mod.
Pluralism
2011 Mod.
Pluralism
Madagascar
(1965-2009)
1965 Hegemonic 8 3 4 4 (3/8)*4*4 6.00
1972 Hegemonic
1982 One-Party
1989 One-Party
1992 Mod.
Pluralism
1996 Mod.
Pluralism
2001 Two-Party
2006 Two-Party
Malawi
(1961-93; 1994-
2012)
1961 Hegemonic 12 5 4 4 (5/12)*4*4 6.67
1964 One-Party
1971 One-Party
1976 One-Party
1978 One-Party
1983 One-Party
1987 One-Party
1992 One-Party
1994 Mod.
Pluralism
1999 Two-Party
2004 Mod.
Pluralism
2009 Two-Party
Mali
(1957-76; 1979-
2012)
1957 Predominant 9 5 4 4 (5/9)*4*4 8.88
1959 Predominant
1964 One-Party
1979 One-Party
1985 One-Party
1992 Mod.
Pluralism
1997 Hegemonic
2002 Mod.
Pluralism
2007 Predominant
Mauritania
(1959-60; 1961-
78; 1992-2005;
2007-08; 2009-
12)
1959 Hegemonic 10 6 4 5 (6/10)*4*5 12.00
1961 Hegemonic
1966 One-Party
1971 One-Party
1976 One-Party
1992 Predominant
1997 Hegemonic
2003 Predominant
2007 Mod.
Pluralism
2009 Two-Party
Mauritius
(1959-2012)
1959 Predominant 12 3 3 3 (3/12)*3*3 2.25
1963 Mod.
Pluralism
1967 Mod.
Pluralism
1976 Mod.
Pluralism
1982 Mod.
Pluralism
1987 Mod.
Pluralism
1991 Predominant
1995 Predominant
2000 Predominant
2005 Mod.
Pluralism
2010 Mod.
Pluralism
Mozambique
(1977-90; 1994-
2012)
1977 One-Party 6 1 2 2 (1/6)*2*2 0.67
1986 One-Party
1994 Predominant
1999 Predominant
2004 Predominant
2009 Predominant
Namibia
(1994-2012)
1994 Predominant 4 0 0 1 (0/4)*0*1 0
1999 Predominant
2004 Predominant
2009 Predominant
Niger
(1965-74; 1989-
91; 1993-96;
1999-2010;
1965 One-Party 8 1 4 2 (1/8)*4*2 1
1970 One-Party
1989 One-Party
1993 Mod.
32
2011-12) Pluralism
1996 Mod.
Pluralism
1999 Mod.
Pluralism
2004 Mod.
Pluralism
2011 Mod.
Pluralism
Nigeria
(1959-66; 1979-
83; 1998-2012)
1959 Mod.
Pluralism
9 2 2 3 (2/9)*2*3 1.33
1964 Mod.
Pluralism
1979 Mod.
Pluralism
1983 Mod.
Pluralism
1993 Two-Party
1999 Predominant
2003 Predominant
2007 Predominant
2011 Predominant
Rwanda
(1965-73; 1978-
91; 2003-12)
1965 One-Party 7 1 1 2 (1/7)*1*2 0.28
1969 One-Party
1978 One-Party
1983 One-Party
1988 One-Party
2003 Hegemonic
2010 Hegemonic
Sao Tomê
(1975-90; 1991-
2012)
1975 One-Party 8 4 4 4 (4/8)*4*4 8.00
1980 One-Party
1985 One-Party
1991 Hegemonic
1996 Mod.
Pluralism
2001 Two-Party
2006 Two-Party
2011 Mod.
Pluralism
Senegal
(1963-63; 1966-
74; 1978-2012)
1963 Hegemonic 10 5 4 5 (5/10)*4*5 10.00
1968 One-Party
1973 One-Party
1978 Predominant
1983 Predominant
1988 Predominant
1993 Predominant
2000 Mod.
Pluralism
2007 Two-Party
2012 Mod.
Pluralism
Seychelles
(1970-77; 1979-
91; 1999-2012)
1970 Two-Party 10 3 3 3 (3/10)*3*3 2.70
1974 Two-Party
1979 One-Party
1984 One-Party
1989 One-Party
1993 Predominant
1996 Predominant
2001 Predominant
2006 Predominant
2011 Two-Party
Sierra Leone
(1957-67; 1971-
91; 1996-97;
1998-2012)
1957 Two 10 8 4 4 (8/10)*4*4 12.80
1962 Mod.
Pluralism
1967 Mod.
Pluralism
1973 Hegemonic
1977 Two-Party
1985 One-Party
1996 Mod.
Pluralism
2002 Two-Party
2007 Mod.
Pluralism
2012 Two-Party
Somalia
(1964-69; 1976-
91)
1964 Two-Party 4 1 3 2 (1/4)*3*2 1.50
1969 Two-Party
1979 One-Party
1984 One-Party
Somaliland
(1997-2012)
1997 Atomized 3 1 4 2 (1/3)*4*2 2.67
2003 Mod.
Pluralism

33
2010 Mod.
Pluralism
South Africa
(1994-2012)
1994 Predominant 4 0 0 1 (0/4)*0*1 0.00
1999 Predominant
2004 Predominant
2009 Predominant
South Sudan
(2010-12)
2010 Hegemonic 1 0 0 1 (0/1)*0*1 0.00
Sudan
(1953-58; 1965-
85; 1993-2012)
1953 Two-Party 9 5 6 6 (5/9)*6*6 20.00
1958 Mod.
Pluralism
1968 Mod.
Pluralism
1971 One-Party
1978 One-Party
1983 One-Party
1996 Atomized
2000 Hegemonic
2010 Predominant
Swaziland
(1964-2012)
1964 Predominant 10 1 4 2 (1/10)*4*2 0.80
1967 Predominant
1972 Predominant
1978 Atomized
1983 Atomized
1987 Atomized
1993 Atomized
1998 Atomized
2003 Atomized
2008 Atomized
Tanzania
(1962-2012)
1962 Hegemonic 11 2 2 3 (2/11)*2*3 1.10
1965 One-Party
1970 One-Party
1975 One-Party
1980 One-Party
1985 One-Party
1990 One-Party
1995 Predominant
2000 Predominant
2005 Predominant
2010 Predominant
Togo
(1961-61; 1963-
67; 1979-91;
1993-2012)
1961 Hegemonic 9 3 2 3 (3/9)*2*3 2.00
1963 Hegemonic
1979 One-Party
1986 One-Party
1993 Hegemonic
1998 Predominant
2003 Predominant
2005 Predominant
2010 Predominant
Uganda
(1961-66; 1980-
80; 1989-2012)
1961 Mod.
Pluralism
8 3 4 4 (3/8)*4*4 6.00
1962 Two-Party
1980 Two-Party
1989 Atomized
1996 Predominant
2001 Predominant
2006 Predominant
2011 Predominant
Zambia
(1968-2012)
1968 Hegemonic 11 3 4 4 (3/11)*4*4 4.36
1973 One-Party
1978 One-Party
1983 One-Party
1988 One-Party
1991 Predominant
1996 Predominant
2001 Predominant
2006 Predominant
2008 Predominant
2011 Mod.
Pluralism
Zimbabwe
(1980-2012)
1980 Predominant 6 3 1 2 (3/6)*1*2 1.00
1985 Predominant
1990 Hegemonic
1996 Hegemonic
2002 Predominant
2008 Hegemonic

34