a general approach to intertemporal and interspatial productivity comparisons
TRANSCRIPT

Journal of Econometrics 23 (1983) 3 15-330. North-Holland
A AND
GENERAL APPROACH TO INTERTEMPORAL INTERSPATIAL PRODUCTIVITY COMPARISONS*
Michael DENNY and Melvyn FUSS University of Toronto, Toronto, Ont., Canada M5S IA1
Received March 1982, final version received December 1982
The purpose of this paper is to introduce a general methodology for analysing the sources of intertemporal or interspatial differences in outputs and costs, general in the sense that our methodology allows the productivity analyst to ‘break out’ of the quadratic ‘straightjacket’ imposed by the class of superlative index number comparisons. Starting from Taylor’s series expansions about the two points to be compared, we develop a general growth accounting equation which can be approximated to any desired degree of accuracy, depending on the information available.
The theoretical framework is applied to two recent examples of interspatial comparisons which use the Tomqvist superlative index. In the first example, we show that the biases in regional Canadian total manufacturing cost-efficiency comparisons which result from the use of this index are negligible. However, in the second example, it is shown that the Tornqvist index imparts a substantial bias in United States-Japan total domestic economy productivity comparisons. The index consistently overestimates the relative productivity level of the U.S. economy and misses the turning point, when the Japanese economy becomes more efficient, by two years.
1. Introduction
Since the seminal paper by Robert Solow in 1957, productivity analysts have become increasingly aware of the close relationship between productivity accounting (or index number) equations and the form of the underlying production or cost function. An important step in the understanding process was taken by Diewert (1976) who introduced the notion of superlative index numbers to represent that class of equations which are exact for quadratic functional forms. For example, Diewert showed that for intertemporal comparisons, the Tornqvist approximation to the Divisia aggregate input index1 is exact for a linear homogeneous translog production function. Recently, Denny and Fuss (1980), Denny, Fuss and
*An earlier version of this paper was presented at the Econometric Society Summer Meetings, San Diego, California, June 24-27, 1981. We wish to thank Meiko Nishimizu and an anonymous referee for helpful comments and John Veitch for excellent research assistance.
‘Hereafter we will refer to the Tomqvist approximation to the Divisia index as the Tornqvist index. The Divisia index itself is a continuous index which cannot be calculated from data which are observed at discrete intervals.
0304-4076/83/S3.00 0 1983, Elsevier Science Publishers B.V. (North-Holland)

316 M. Denny and M. Fuss, lntertemporal and interspatial productivity comparisons
May (1981), and Caves, Christensen and Diewert (1982a, b) have extended this class of results to interspatial efficiency comparisons, including those where constant returns to scale is not necessarily maintained.2
The results cited above are based on applications of the quadratic lemma [Diewert (1976)], and hence restrict the analyst to a consideration of quadratic approximations to the function which is generating the data. This will often be acceptable for intertemporal comparisons but may well prove inadequate for interspatial comparisons, especially when international data are involved. As we will show below, what is important is whether second- or higher-order parameters differ across comparisons. Even for intertemporal comparisons within a single spatial entity, external shocks (such as the 1973 energy crisis) may cause basic production parameters to change over time and thus render the Tornqvist approximation suspect.
The purpose of this paper is to introduce a general methodology for analysing the sources of intertemporal or interspatial differences in outputs and costs, general in the sense that our methodology allows the productivity analyst to ‘break out’ of the quadratic ‘straightjacket’. Starting from Taylor’s series expansions about the two points to be compared, we develop a general growth accounting equation which can be approximated to any desired degree of accuracy, depending on the information available. A special case of our general equation is the quadratic lemma, which as noted above provides the underpinning for the class of superlative index number comparisons. Using our basic equation, we are able to demonstrate that even under the assumptions of constant returns to scale and perfectly competitive markets, the most general case which can be analysed by price and quantity data alone (no estimation of the parameters of the underlying cost or production functions) is one in which the underlying functions are quadratic and differ intertemporally and interspatially in the zero- and first-order terms, but not in the second-order terms. As we show, this is just the case where application of the quadratic lemma yields a zero approximation error. The bias in index number comparisons when the above assumptions are violated can be calculated from our general equation.
The theoretical framework is applied to two recent examples of interspatial comparisons which use the Tornqvist index. In the first example, we show that the biases in comparisons of the regional levels of cost efficiency for Canadian total manufacturing which result from the use of Tornqvist index [Denny and Fuss (1980)] are negligible. However, in the second example, it is shown that the Tornqvist index imparts a substantial bias in United States-Japan total domestic economy productivity level comparisons [Jorgenson and Nishimizu (1978)]. The Tornqvist index consistently
‘For recent empirical examples of interspatial comparisons using the Tornqvist index, see Caves, Christensen and Tretheway (1981), Denny and Fuss (1982b), and Hulten and Schwab (1982).

M. Denny and M. Fuss, Intertemporal and interspatial productivity comparisons 317
overestimates the relative productivity level of the U.S. economy and misses the turning point, when the Japanese economy becomes more efficient, by
two years. Thus the U.S.-Japan example illustrates the fact that there are cases when the superlative indexes can be quite misleading. In such cases there is no substitute for econometric estimation. A secondary purpose of this paper is to demonstrate how estimation can be combined with index numbers to facilitate more accurate productivity comparisons.
2. The conceptual framework
Consider an arbitrary function
Y =f(Z1,zz,. . ., %A, (1)
with nth-order continuous partial derivatives with respect to the zi. The function f(z) may be either a production or cost function, or perhaps an input demand function. The zi are typically factor inputs, factor prices and outputs (in the case of cost or input demand functions), intertemporal efficiency difference indicators, and interspatial efficiency difference indicators. The latter two categories are often represented by discrete variables (such as dummy variables) and must be handled with some care. This problem has been considered explicitly by Denny and Fuss (1983).
We begin by expressing (1) as an nth-order Taylor series expansion around the point z’,
. . .
fK+l, (2)
where R; + 1 is the (n+ 1)-order remainder term, and the superscript r denotes ‘evaluation at the data set r’.
Suppose we replace Zi by zf. Then the right-hand side of (2) is just equal to y”. If we reverse the roles of r and s (i.e., evaluate the derivatives at s and replace zl by z; and zi by z:) we obtain an expression for yr. Subtracting the
two expressions and dividing by 2, we obtain an exact representation of the difference dy =f - y'. This difference, with suitable interpretation, is the general growth accounting equation.
Before proceeding further with the general case, we illustrate our methodology for two important special cases.
We first consider a linear approximation to (1) in order to provide a

318 M. Denny and M. Fuss, lntertemporal and interspatial productivity comparisons
2’ z= z
Fig. 1
geometric illustration. Suppose we observe the two data sets {z’} and {z”}. These data sets, along with the corresponding true values of the function (l), y’ and y”, are labelled points A and B respectively in fig. 1. It is assumed that the function f(z) is unknown and hence y” and y’ and the difference y” - y’ are also unknown.3 To approximate y”, we take a linear expansion of f(z)
around A and evaluate it at z’. Call this point C and the corresponding value on the y axis, 9”. The approximation can be written as
j”=y”-R;=y’+C f;.[z;-zf].
(Although the approximation depends on the unknown y’ we will see shortly that this creates no problem.) Similarly, to approximate y’, we take a linear expansion of f(z) around B ‘and evaluate it at z’, denoting the point D and
3This statement is correct for the case of index number formation pursued in the next section, since y is the unknown aggregate. For the case of productivity measurement (section 4), y will be known but f(z) will be unknown, as will the productivity index, necessitating the approximation methodology developed in this section.

M. Denny and M. Fuss, Zntertemporal and interspatial productivity comparisons 319
the relevant value $‘. This approximation can be written as
j’=y’-R”,=y”+Cf;+-4]. (4)
It is now natural to approximate the unknown difference y”-yr by the approximate difference jY - jY, where
y-9’=(y”-y’)+(R”,-R’,)
=(y'-y")+~[~;+fS]~[Z;-Zf]. (5)
Utilizing the last set of equalities and solving for y” -y’ we obtain
v”-yy[f;+f;]fz;-<]+)[R;-R;]. (6)
Note that if we ignore the error of approximation f[R\-R”2], eq. (6) is just the quadratic lemma used by Diewert (1976) to derive the class of superlative indexes. Hence we obtain the surprising result that the quadratic lemma can be interpreted as resulting from a differencing of two linear approximations. As we shall see below, while all first-order approximations satisfy the quadratic lemma; this is not true of all second-order approximations.
We now turn to the case of second-order expansions. Consider second- order expansions of (1) as a means of evaluating y’ and y’,
Y”=Yr+~S;~C~-~l+)~f~j.[z;-z~].[z~-z~]+R;, (7) ij
LI=Y~+~f~.CZI-~]+f~f:j.[Zf-Zf].[Z~-z~]+R~. (8) ij
Subtracting (8) from (7) we obtain
2[y”-y’] =C [(f;+ff)] ‘[+&I ++ i
1 [f~j~f~jl[zf~zflCZ~~z~l ij I
or
++[R; - R;]. (9)

320 M. Denny and M. Fuss, Intertemporal and interspatial productivity comparisons.
If
fTj_flj=O, ,..., m, i,j=l (10)
and
R;-R;=O, (11)
eq. (9) is just the quadratic lemma. Hence the quadratic lemma is exact for the class of functional forms such that constraints (10) and (11) are satisfied. Of course the linear function
f(Z)=Uo+CUiZi (12)
satisfies (10) and (11) since f ii = f fj = Rj = R; =O. In addition the quadratic function
f(Z)=UO+CUiZi+3CUijZiZj (13) ij
also satisfies (10) and (11) since fij = fyj =aij and Rj = R; =O. However, of importance to our productivity discussion below is the fact that the ‘quadratic’ function
f(Z”)=Uo.+CUisg+CUijg$ (14) ij
satisfies (10) and (11) as well. Eq. (14) is a second-order expression in which the zero-order and first-order parameters are data point s specific, but the second-order parameters are independent of the data point. The functional form (14) is the most general form for which the quadratic lemma is exact, since the form
f(z”)=uo~+~ui~~+~Uij,~Z~z~ (15) ij
violates constraint (10) although it satisfies (11). Note that in the case of (15) an exact representation of the difference y” --y’ is given by
+~C~ffj-f9j)lC(~-~)(z~-z~)l. (16) ij
Any higher-order functional form will violate both constraints (10) and (11).

M. Denny and M. Fuss, Intertemporal and interspatial productivity comparisons 321
We can rewrite (9) in the form
Y”-Y’=+C C6-zll (fl +fD+(1/29 ~Cz~-$)(flj-ffj) 1 +$[Rj - Rgj. (17)
Analogous to (17), the general &h-order accounting equation can be written in the form
+Yr=ap-g] (f;+f;)+(1/2!)C(zj-z;)(f;j-ffj) [ .i
+(1/3!) &(Z;-Z;)(z;-Z;)(ftr +fljk) +. . .
3. Application of the conceptual framework to index numbers
Suppose we interpret (1) as an aggregator function, so that y is the aggregate index obtained by aggregating the components zl,. . . , z,. If y and z are logarithms of outputs (inputs), production is characterized by constant returns to scale, there exist perfectly competitive output (input) markets, and s= t, I= t- 1, then application of the quadratic lemma to (1) yields the intertemporal Tornqvist approximation to the Divisia index of aggregate output (input):
(19)
where Si is the revenue (cost) share of the ith component [Diewert (1976)]. Similarly, if y and z are logarithms of prices, (19) is the Tornqvist approximation to the corresponding aggregate price index. If s and r represent two spatially distinct locations at the same point in time, then
y” - y’ = c $is; + S;)(z; - z;) (20)
is the interspatial Tornqvist index of aggregate output (input) differences.4
4Jorgenson and Nishimizu (1978) and Caves et al. (1982a) have called the interspatial Tomqvist index the ‘translog index’. We prefer to reserve the name ‘translog index’ for the case where the index is obtained from estimated parametric production or cost functions (see footnote 8 below).

322 M. Denny and M. Fuss, Intertemporal and interspatial productivity comparisons
The aggregation procedures (19) and (20) can be characterized as ‘locally linear’ aggregation since given the values of the logarithmic derivatives (Si), y” - yr is just a weighted sum of components z; -z;. If this is to be a correct aggregation procedure, constraints (10) and (11) must hold. Constraint (11) is satisfied as long as the aggregator function is second order. For (10) to be satisfied, the share derivatives must be constant across comparisons, since fij = 8S,/dz,. Hence if locally linear aggregation using the superlative logarithmic index is to be exact, we must add to the assumptions of constant returns to scale and perfectly competitive markets the assumption of constant share derivatives.5 If the share derivatives are not constant but the aggregator function is second-order, then (16) rather than (19) or (20) is the correct exact aggregation procedure. This procedure is no longer locally linear since it contains interaction and second-order terms of the form (z; -z;) .(z; -z;). In addition it uses knowledge of the share derivatives which cannot be obtained from price, quantity data alone but requires structural estimation. Hence an important empirical consideration is whether the Tornqvist index provides an adequate approximation when (16) is the exact representation. In the empirical section this issue is pursued for the productivity measures discussed below.
Suppose we now interpret (19) and (20) in an accounting framework. These equations allow us to ‘account for’ the logarithmic difference in the aggregate ys - y’ by the effects due to the logarithmic differences in the components, 6 - zf, and the effects are additive. However, when (16) is used to provide the accounting framework, the effects are no longer additive and interaction terms must be included.
The Tornqvist accounting framework (19)-(20) is very convenient since no structural estimation is needed. However, it would appear that this is the only framework within the quadratic family for which this is true. Consider the Generalized Box-Cox transformation [Berndt and Khaled (1979)]. In this case y=( I/” - 1)/L, where I/ is the aggregate variable of interest and 1 is the Box-Cox parameter (assumed known). Further, Zi =(x:- 1)/L, where Xi is the component of interest. Then
fi = Si( I/lXi)". (21)
Only in the case where 140 (the Tornqvist approximation) is fi independent of the unknown aggregate K If L-/+0, then V must be obtained by estimating the parameters of the underlying aggregator function. A similar analysis shows that the same problem occurs with the closely related family of
‘For the case of the Tornqvist aggregator function, the constant share derivative property is equivalent to what Jorgenson and Lau (1983) call the constant share elasticity (CSE) property. They show that this property holds only for the translog function. This fact is just another way of demonstrating that the translog function is uniquely exact for the Tornqvist index.

M. Denny and M. Fuss, Intertemporal and interspatial productivity comparisons 323
superlative indexes - the quadratic mean of order I [Diewert (1976)]. Even if I is assumed known a priori, only in the case where r+O (the Tornqvist index) can the accounting framework derived from the quadratic lemma be applied without structural estimation.
4. Application of the conceptual framework to productivity measurement
The analysis of the preceding section can be applied to the issue of productivity measurement in a direct way. Suppose two of the zi variables in (1) are the technological change indicator (say time T) and an efficiency difference indicator [say the (0,l) dummy variable O,], so that (1) can be written as
Y=fb I,. . . > ZM, 7; D,, . . . , DA (22)
and interpreted as a production (transformation) or cost function.
Denny and Fuss (1980) have shown that the quadratic lemma applied to a logarithmic version of (22) yields the accounting equation
ys - y’ = c $7; + sq] [zf - 211 + pir + z,l,, (23)
where
P,‘, = f L-f;, +&I . CD, - &I
is the interspatial effect, and
is the intertemporal effect.
Denny and Fuss (1983) have shown that fD is well-defined even though D is discontinuous, and that the quadratic expansion of (22) corresponds to the underlying function (14). Solving (23) for r,‘, when D, = D, and the Zi are inputs yields the intertemporal Tornqvist index of productivity growth for a particular spatial entity [Jorgenson and Griliches (1967)]. Solving (23) for p,‘, when T" = T' yields the interspatial Tornqvist productivity difference index for a particular level of technology (usually a particular point in time) [Jorgenson and Nishimizu (1978)]. Note that in each of these cases the accounting equation (23) is linear in the index, thus facilitating solution, An accounting equation similar to (23) can be derived for the Box-Cox and quadratic mean of order r families when the quadratic lemma is applicable.

324 M. Denny and M. Fuss, Intertemporal and interspatial productivity comparisons
For example, the Box-Cox equation would be
Once again, application of (24) requires structural estimation (even when L is known) since V must be estimated.
Now suppose the underlying functional form is second-order, but all coefftcients differ across comparisons [analogous to eq. (15)]. A second-order expansion of (22) around the data point r, evaluated at the data point s, yields6
+Cf;T(z4-~)(Ts-Tr)+fl~D(TS-Tr)(Ds-D*) . i 1 (25)
Expanding (22) around the data point s, evaluating the function at r yields
Y’-b=Cfl(zl-zI)+f”T(T’-r’)+fSo(D,-D,)
+ fSTT( T’ - T’)’ + c f;o(Z: - Z;)(D, - D,) i
+CffT(~I-~)(Tr--TS)+fSTD(Tr-TS)(D,-Ds) . I 1 (26)
6Although D is discontinuous, the second-order ‘derivatives’ fDD, fTD, AI, can be computed as if D were continuous. The proof is analogous to that used by Denny and Fuss (1983) for the first-order term fr,.

M. Denny and M. Fuss, Intertemporal and interspatial productivity comparisons 325
Subtracting (26) from (25) yields
C(fl+ff)(~-zI)+(f;+f;)(r”-T’)+(f;,+f)(o,-D,) 1 +d ~(flj-f~j)(z;-~)(~-z;)+(f;T-f;.T)(TS-Tr)2
[
+ Km - ~o)(D,-0,)2+C(f:D-f:D)(ZS-~~)(D~--r)
(27)
Eq. (27) is a general second-order accounting equation which includes intertemporal and interspatial effects as well as second-order and interaction effects. The general second-order intertemporal logarithmic productivity index can be obtained, by collecting all terms in T" - T', as
r,“,=W-k+_M+a (f;T-fSTT)+C(f;T-ffT)(Zf-ZI) [ 1
=(Y"-Yy?-fC(fr+j;)(z:--zj)
-f~(f;j-ffj)(ZI-Z~)(z;-Z~),
where
s = t, r=t-1, D,=D,, TS=t, T'=t-1.
(28)
Similarly, the general second-order interspatial logarithmic productivity comparison index can be obtained, by collecting all terms in D,-D,, as
LC,=&-L+GJ+$ (f;ll,-~D)+C(flD-SiD)(zl-zl) [ 1
=(V’-_Y’)-_)~(fj+f1)(z9-~) -gc(f~j-fSj)(Z~-Zl)(~-Z~),
ij
JE 6
(29)

326 M. Denny and M. Fuss, Intertemporal and inter-spatial productivity comparisons
where
Ts=Tr=r, D,=l, D,=O.
Both (28) and (29) require structural estimation before they can be evaluated. Higher-order productivity index calculations can be obtained if necessary
using our general procedure. However, it is unlikely that an accounting equation more general than (27) will be used in any empirical application.
If (27) is the ‘correct’ accounting equation, then the bias’ that results from using the Tornqvist intertemporal index is measured by
B,=$ [
~(f~~~‘-f~j)(z~-z~-‘)(Zf-z~-l) )
ij 1 (30)
where hj is the derivative of the ith share with respect to the logarithm of the jth exogenous variable (the share elasticity). Similarly, the bias corresponding to the Tornqvist interspatial index is
B, =$ [ C(flj -ffj)(z; -zg(z; -z;, . ij 1 (31)
5. Two empirical examples
In order to illustrate the potential bias which may result when the Tornqvist comparison index is used, we present in this section two empirical examples. The first involves a comparison of the total manufacturing cost efficiency levels for two geographical regions in Canada. The second example is an international comparison of production efficiency of the private domestic economies of Japan and the United States. As we shall see, the bias computed according to (31) is insignificant for the interregional example, but is of considerable importance in the international example.
5.1. Interregional manufacturing cost efficiency: Canada
Denny and Fuss (1980) used the Tornqvist comparison index based on prices (the dual index) to evaluate the relative cost efficiencies of Canadian regional total manufacturing. Column 2 of table 1 presents the results of comparisons using this index of the efficiency level differentials between Ontario and British Columbia, two provinces of Canada. Column 3 of table
‘The biases B, and B, are computed assuming that the only assumption violated is that of constant second-order parameters. When the assumptions of constant returns to scale and competitive markets are incorrect, additional biases result. For an analysis of these biases, see Denny, Fuss and Waverman (1981).
M. Denny and M. Fuss, Intertemporal and interspatial productivity comparisons 327
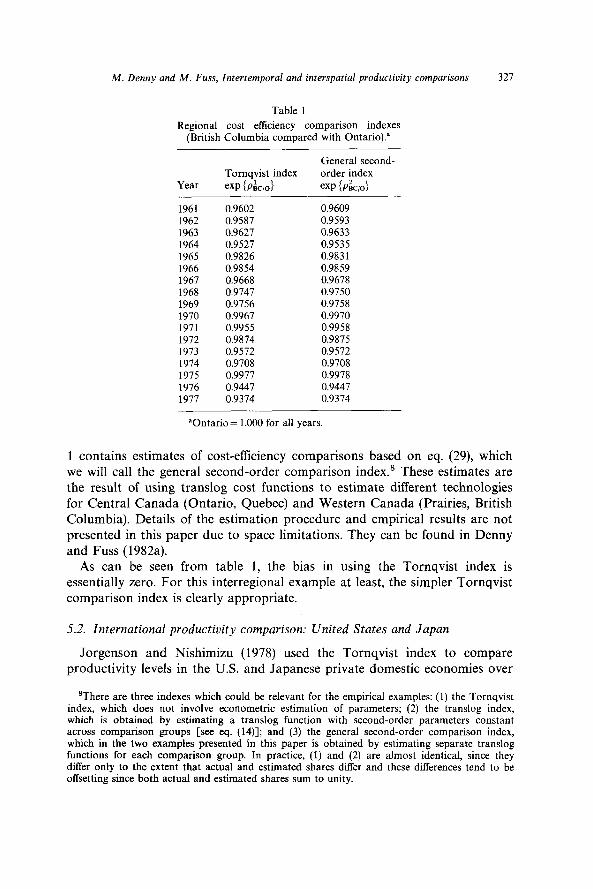
Table 1
Regional cost efficiency comparison indexes (British Columbia compared with Ontario).’
Year Tornqvist index
exp &o}
General second- order index
exp k%Lo~
1961 0.9602 0.9609 1962 0.9587 0.9593 1963 0.9627 0.9633 1964 0.9527 0.9535 1965 0.9826 0.9831 1966 0.9854 0.9859 1967 0.9668 0.9678 1968 0.9747 0.9750 1969 0.9756 0.9758 1970 0.9967 0.9970 1971 0.9955 0.9958 1972 0.9874 0.9875 1973 0.9572 0.9572 1974 0.9708 0.9708 1975 0.9977 0.9978 1976 0.9447 0.9447 1977 0.9374 0.9374
aOntario = 1.000 for all years.
1 contains estimates of cost-efficiency comparisons based on eq. (29), which we will call the general second-order comparison index.8 These estimates are the result of using translog cost functions to estimate different technologies for Central Canada (Ontario, Quebec) and Western Canada (Prairies, British Columbia). Details of the estimation procedure and empirical results are not presented in this paper due to space limitations. They can be found in Denny and Fuss (1982a).
As can be seen from table 1, the bias in using the Tornqvist index is essentially zero. For this interregional example at least, the simpler Tornqvist comparison index is clearly appropriate.
5.2. International productivity comparison: United States and Japan
Jorgenson and Nishimizu (1978) used the Tornqvist index to compare productivity levels in the U.S. and Japanese private domestic economies over
‘There are three indexes which could be relevant for the empirical examples: (1) the Tornqvist index, which does not involve econometric estimation of parameters; (2) the translog index, which is obtained by estimating a translog function with second-order parameters constant across comparison groups [see eq. (14)]; and (3) the general second-order comparison index, which in the two examples presented in this paper is obtained by estimating separate translog functions for each comparison group. In practice, (1) and (2) are almost identical, since they differ only to the extent that actual and estimated shares differ and these differences tend to be offsetting since both actual and estimated shares sum to unity.

328 M. Denny and M. Fuss, Intertemporal and interspatial productivity comparisons
the period 1952-74. In this section we demonstrate that for this international comparison the Tornqvist index contains a substantial bias relative to the general second-order index.
The Tornqvist index comparison of U.S.-Japanese productivity differences based on quantities (the primal index) is contained in column 2 of table 2. The data used in this computation are available from Jorgenson and Nishimizu (1978). Columns 3 and 4 contain two estimates of the general second-order productivity index, obtained by estimating separate translog production functions for the United States and Japan. The details of the estimation procedure can be found in Denny and Fuss (1982a). The reason there are two indexes is that there are two ways of using the data to estimate separate American and Japanese technologies which imply different maintained hypotheses concerning the variance-covariance matrix of the error vector.’ One estimation method is to pool the U.S. and Japan data and
Table 2
International productivity comparison indexes (United States compared with Japan).”
General second-order index
exp MA
Year Tornqvist index
exp W&
Separate regressions
Pooled regressions
1952 2.160 1.811 1.937 1953 2.203 1.801 1.944 1954 2.058 1.680 1.814 1955 1.976 1.585 1.723 1956 1.806 1.404 1.545 1957 1.779 1.393 1.528 1958 1.827 1.450 1.583 1959 1.703 1.357 1.480 1960 1.526 1.216 1.325 1961 1.315 1.061 1.151 1962 1.484 1.250 1.334
1963 1.421 1.218 1.292 1964 1.287 1.118 1.179 1965 1.304 1.157 1.211 1966 1.252 1.115 1.166
1967 1.211 1.081 1.128 1968 1.119 1.017 1.054 1969 1.046 0.965 0.995 1970 1.026 0.955 0.981 1971 1.053 1.002 1.021 1972 0.999 0.956 0.972 1973 0.950 0.907 0.923
“Japan= 1.000 for all years.
‘This issue was not raised in the previous example since both methods gave virtually identical results.

M. Denny and M. Fuss, Intertemporal and interspatial productivity comparisons 329
use dummy variables to specify different coefficients for the production functions. This method implies the assumption of identical variance-
covariance matrices for the U.S. and Japan. If this assumption is correct efficiency gains in technological parameter estimation can occur. An alternative method is not to pool the data, i.e., to estimate separate technologies from separate regressions. In this case the variancecovariance matrices are assumed to be different. We tested the identical variance- covariance matrix assumption using a likelihood ratio test and rejected it at conventional significance levels. Details can be found in Denny and Fuss (1982a). We believe that the ‘separate regressions’ index (column 3) is the preferred index. However there was some evidence of significant positive serial correlation in the residuals for the equations underlying this index which may have biased the test toward rejection. Therefore in column 4 we present the comparison index computed from the technologies estimated when the identical varianceecovariance matrix assumption was maintained.
The substantial bias in the Tornqvist productivity index is evident from table 2. This index consistently overestimates the magnitude of the U.S. productivity advantage and misses by two years the turning point when the Japanese economy became more productive.” The American and Japanese technologies appear to be sufficiently different that the assumption underlying the Tornqvist index (identical second-order terms in the quadratic functions) is inappropriate.’ ’
6. Conclusions
The non-parametric Tornqvist intertemporal and interspatial comparison indexes are widely used since they can be computed from price and quantity
“-‘In a later paper, Christensen, Cummings and Jorgenson (1980) revised the Japanese labour data and no longer found a turning point in the productivity comparison. We do not know whether we would still find a turning point with the revised data but that issue is immaterial to the purpose of this section - to demonstrate the possible bias in the Tornqvist index.
“In some circumstances qualitative efficiency comparisons can be made without resort to econometric estimation even in this case. Consider the efficiency comparison between two countries (or regions), s and r, at a point in time. We observe the price and quantity data {P’, X’, p}, {P”, X”, Q”}. Assume that production is subject to constant returns to scale. Suppose we evaluate the average cost of production in country r if producers in that country were to use inputs X’ to produce output g when faced with factor prices P”:
C’=(l/e’).P”.X’.
But C’f c’(P”), the unit cost calculated from the unit cost function, since X’ is not the cost- minimizmg input vector at P”. If it is the case that
c”(P”) = (l/P) p” X” > c, then c”(P”) > c’(P’) and production in country r is more efficient than production in country s at factor prices P”. Note that if c’(P’)<C’, no efficiency implications can be obtained since C’~c’(P”). Obviously, the above analysis is symmetric in I and s, so that if C”=( l/p) .P' 'X3 is such that c’(P’) > C”, production in country s is more efficient than that in country r at prices P’. The weak nature of the above non-parametric tests can be seen from the fact that we can at best infer that one country is more efficient at the other country’s prices and can infer nothing about its efficiency at its own prices, or any other prices.
330 M. Denny and M. Fuss, Intertemporal and interspatial productivity comparisons
data alone, thus eliminating the need to estimate an underlying structure. But it should not be forgotten that this convenience is bought at a cost. For the U.S.-Japan productivity comparison case, the assumption of interspatially constant second-order parameters needed to calculate the Tornqvist comparison index resulted in a substantial bias relative to the more general second-order index.
References
Berndt, E. and M. Khaled, 1979, Parametric productivity measurement and choice among flexible functional forms, Journal of Political Economy 87, 122&1245.
Caves, D., L. Christensen and W.E. Diewert, 1982a, Multilateral comparisons of output, input and productivity using superlative index numbers, Economic Journal 92, 73-86.
Caves, D., L. Christensen and W.E. Diewert, 1982b, The economic theory of index numbers and the measurement of input, output and productivity, Econometrica 50, 1393-1414.
Caves, D., L. Christensen and M. Tretheway, 1981, U.S. trunk air carriers, 1972-77: A multilateral comparison of total factor productivity, Ch. 3 in: T. Cowing and R. Stevenson, eds., Productivity measurement in regulated industries (Academic Press, New York) 47-76.
Christensen, L.R., D. Cummings and D.W. Jorgenson, 1976, Economic growth, 1947-1973: An international comparison, Harvard Institute for Economic Research discussion paper no. 521 (Harvard University, Cambridge, MA).
Christensen, L.R., D. Cummings and D.W. Jorgenson, 1980, Relative productivity levels, 1947- 1973: An international comparison, Harvard Institute for Economic Research discussion paper no. 773 (Harvard University, Cambridge, MA).
Denny, M. and M. Fuss, 1980, Intertemporal and interspatial comparisons of cost efficiency and productivity, Institute for Policy Analysis working paper no. 8018, Dec. (University of Toronto, Toronto).
Denny, M. and M. Fuss, 1982a, A general approach to intertemporal and interspatial productivity comparisons, Institute for Policy Analysis working paper no. 8202, Jan. (University of Toronto, Toronto).
Denny, M. and M. Fuss, 1982b, Intertemporal changes in the levels of regional labour productivity in Canadian manufacturing, Ch. 2 in: A. Dogramaci, ed., Developments in econometric analyses of productivity (Kluwer Nijhoff, Boston, MA) 17-34.
Denny, M. and M. Fuss, 1983, The use of discrete variables in superlative index number comparisons, International Economic Review 24, 419421.
Denny, M., M. Fuss and J.D. May, 1981, Intertemporal changes in regional productivity in Canadian manufacturing, Canadian Journal of Economics, Aug., 39&408.
Denny, M., M. Fuss and L. Waverman, 1981, The measurement and interpretation of total factor productivity in regulated industries, with an application to Canadian telecommunications, Ch. 8 in: T. Cowing and R. Stevenson, eds., Productivity measurement in regulated industries (Academic Press, New York) 179-218.
Diewert, W. Erwin, 1974, Exact and superlative index numbers, Journal of Econometrics 4, 115- 145.
Hulten, C. and R. Schwab, 1982, Regional productivity growth in U.S. manufacturing: 1951- 1978, Urban Institute research paper 1485-06, July (The Urban Institute, Washington, DC).
Jorgenson, D.W. and Z. Griliches, 1967, The explanation of productivity change, Review of Economic Studies 34, 249-283.
Jorgenson, D.W. and L.J. Lau, 1983, Transcendental logarithmic production functions, forthcoming.
Jorgenson, D.W. and M. Nishimizu, 1978, U.S. and Japanese economic growth, 1952-74: An international comparison, Economic Journal 88, 707-726.
Solow, R., 1957, Technical change and the aggregate production function, Review of Economics and Statistics 39, 312-320.