a guide to iedc site selection data standards
TRANSCRIPT

A Guide to
IEDC Site Selection Data Standards
December 2014
Spoon River Partnership for Economic DevelopmentCanton Main Street
University of Illinois ExtensionUniversity of Illinois at Urbana-Champaign

This page is intentionally left blank

1
A Guide to IEDC Site Selection Data Standards
Prepared for
Spoon River Partnership for Economic Development45 East Side Square, Suite 303Canton, IL 61520
December 2014
Produced by
Department of Urban and Regional PlanningUniversity of Illinois at Urbana-Champaign111 Temple Buell Hall611 Taft DriveChampaign, IL 61820www.urban.illinois.edu
In cooperation with
University of Illinois Extension111 Mumford Hall 1301 W. Gregory Dr.Urbana, IL 61801 web.extension.illinois.edu
Acknowledgment of funding support
Project funding was provided by Spoon River Partnership for Economic Development and Canton Main Street.

2
Team
Faculty Advisor
Dr. Stacy Harwood
Economic Development Educator
Kathleen Brown
Research Assistant
Manish Singh
Dep
artm
ent o
f Urb
an a
nd R
egio
nal P
lann
ing

3
A Guide to IEDC Site Selection Data Standards
Introduction
Table 1: Demographic Characteristics
Table 2: Labor Force Characteristics
Table 3: Leading Employers
Table 4: New/Expanding Companies
Table 5: Military Base and Installations
Table 6: Research Base
Table 7: Four Year Institutions
Table 8: Community Colleges
Table 9: Vocational/Training Center Resources
Table 10: Available Payroll Costs by Industry
Table 11: Average Salary by Selected Occupation
Table 12: Workers Compensation and Unemployment Insurance
Table 13: Labor Management Relations
Table 14: Transportation
Table 15: Taxation
Table 16: Occupancy/Supply
Table 17: Utilities
Table 18: Environmental
Table 19: Government
Table 20: International Resources
Table 21: Quality of Life
Appendix 1: Contact Information for Data Sources
Table of Contents5
6
13
20
24
26
27
28
29
30
31
33
36
38
41
47
52
55
57
59
60
62
69

This page is intentionally left blank

5
A Guide to IEDC Site Selection Data Standards
The International Economic Development Council (IEDC) Site Selection Data Standards are common information-gathering questionnaire that communities complete for site selection consultants. These standards were launched by International Economic Development Council in New York in 2000. The data set contained over 1,000 data elements organized into 21 spreadsheets. The standard dataset facilitates the decision of site selection and serves as a tool to promote economic development for communities that strive for relocating employers. The datasets provide critical information to help location professionals and businesses determine the suitability of the community for their site needs. It also helps economic development professionals better understand the economic base of their communities for all development and planning purposes.
The purpose of this guide is to enable Spoon River Partnership for Economic Development and other concerned agencies to update the IEDC Site Selection Data Standards for Fulton County in future. It provides step by step process of information collection for these datasets. The IEDC Site Selection Data Standard tables for Fulton County and City of Canton were completed by Department of Urban and Regional Planning, University of Illinois at Urbana-Champaign in collaboration with the Spoon River Partnership for Economic Development, Canton Main Street and University of Illinois Extension in 2014.
These tables are available with Spoon River Partnership for Economic Development and these are to be referred while using this guide as the step by step process follows the same order in which information is required in IEDC Site Selection Data Standard tables for Fulton County.
The process of updating information requires general proficiency with Microsoft Excel as the guide frequently asks you to use general Excel formulas. Part of this guide requires navigating through government data sources such as US Census Bureau and Bureau of Labor Statistics but it also requires contacting relevant agencies for gathering information. The guide refers to a number of government and private data sources to collect data. It is important to note that the exact location of the required information on these sources might change in future. Although the guide focuses on the procedure followed in collecting IEDC Site Selection Data Standards for Fulton County in 2014, most recently available information shall be used while updating the datasets in future.
The guide uses a list of businesses for Fulton County, IL (accessed on September 04, 2014 from ESRI Business Analyst) which is provided with this guide in Microsoft Excel format. The data accompanying this guide is available on request from Spoon River Partnership for Economic Development (see Appendix 1 for contact information).
Introduction
5
A Guide to IEDC Site Selection Data Standards

6
A Guide to IEDC Site Selection Data Standards
Population
1. US Census Bureau maintains the data for population by age group. US Census Bureau can be accessed through American FactFinader. The ‘Advance Search’ feature allows searching data in American FactFinder, with access to all geographic types and datasets.
2. Open American FactFinder (factfinder2.census.gov) and go to Advance Search.
3. Select Fulton County, IL as geography type and add this to your selection.
4. Type P012: SEX BY AGE [49] in topic or table name to access 2000 data for population by age group.
5. Select and open the table with 2000 SF1 100% Data as dataset.
6. Download the table in Microsoft Excel (.xls) format.
Table 1Demographic Characteristics

7
A Guide to IEDC Site Selection Data Standards
7. Go back in FactFinder and type B01001: SEX BY AGE in topic or table name to access 2012 data for population by age group.
8. Select and open the table with 2012 ACS 5-year estimates as dataset.
9. Download the table in Microsoft Excel (.xls) format.
10. The age groups listed in IEDC table 1 do not match with the age groups available with US Census Bureau. Along with this, US Census Bureau lists population by age groups separately for male and female. Consolidate the age groups and sexes in the tables downloaded in step 6 and step 9 using following calculations –
a. For Under 17, add Under 5 years, 5 to 9 years, 10 to 14 years and 15 to 17 years for both male and female.
b. For 18-34, add 18 and 19 years, 20 years, 21 years, 22 to 24 years, 25 to 29 years, 30 to 34 years for both male and female.
c. For 35-54, add 35 to 39 years, 40 to 44 years, 45 to 49 years, and 50 to 54 years for both male and female.
d. For 55-74, add 55 to 59 years, 60 and 61 years, 62 to 64 years, 65 and 66 years, 67 to 69 years and 70 to 74 years for both male and female.
e. For 74 - Older, add 75 to 79 years, 80 to 84 years and 85 years and over for both male and female.
% Distribution by Age Group
11. Calculate % Distribution by Age Group using the values obtained in step 10 and the total population listed in the tables downloaded in step 6 and step 9.
Median Age
12. US Census Bureau maintains the data for median age.
13. Open American FactFinder (factfinder2.census.gov) and go to Advance Search.
14. Select Fulton County, IL as geography type and add this to your selection.
15. Type DP-1: Profile of General Demographic Characteristics: 2000 in topic or table name to access median age for 2000.
16. Select and open the table with 2000 SF1 100% Data as dataset.
17. Download the table in Microsoft Excel (.xls) format.

8
A Guide to IEDC Site Selection Data Standards
18. The table downloaded in step 17 contains median age for 2000.
19. Go back in FactFinder and type B01002: MEDIAN AGE BY SEX in topic or table name to access median age for 2012.
20. Select and open the table with 2012 ACS 5-year estimates as dataset.
21. Download the table in Microsoft Excel (.xls) format.
22. The table downloaded in step 21 contains median age for 2012.
Households
23. US Census Bureau maintains the data for number of households, median household income and household income distribution.
24. Open American FactFinder (factfinder2.census.gov) and go to Advance Search.
25. Select Fulton County, IL as geography type and add this to your selection.
26. Type DP-3: Profile of Selected Economic Characteristics: 2000 in topic or table name to access data for 2000 households.
27. Select and open the table with 2000 SF3 Sample Data as dataset.
28. Download the table in Microsoft Excel (.xls) format.
29. The table downloaded in step 28 contains number of household and median household income for 2000.
30. The household income ranges listed in IEDC table 1 do not match with the income ranges available with US Census Bureau. For 2000 household income distribution, consolidate the household income ranges in the table downloaded in step 28 using following calculations –
a. For Under - $35,000, add Less than $10,000, $10,000 to $14,999, $15,000 to $24,999 and $25,000 to $34,999.
b. For $35,001 - $50,000, use $35,000 to $49,999.
c. For $50,001 - $75,000, use $50,000 to $74,999.
d. For $75,001 - Above, add $75,000 to $99,999, $100,000 to $149,999, $150,000 to $199,999 and $200,000 or more.
31. Go back in FactFinder and type DP03: Selected Economic Characteristics in topic or table name to access data for 2012 households.
32. Select and open the table with 2012 ACS 5-year estimates as dataset.

9
A Guide to IEDC Site Selection Data Standards
33. Download the table in Microsoft Excel (.xls) format.
34. The table downloaded in step 33 contains number of household and median household income for 2012.
35. For 2012 household income distribution, consolidate the household income ranges in the table downloaded in step 33 using calculations similar to step 30.
Five Year Projections
36. Department of Commerce and Economic Opportunity (DCEO) projects Illinois County Population numbers categorized by race, age group and gender through 2030. These population projections can be accessed through State of Illinois Data Portal.
37. Open DCEO County Population Projections (https://data.illinois.gov/Economics/DCEO-County-Population-Projections/h3bx-hbbh).
38. User ‘Fulton’ as a filter for State/County and ‘All’ as a filter for Race.
39. Export the filtered table as XLS format.
40. The age groups listed in IEDC table 1 do not match with the age groups available at DCEO County Population Projections. Along with this, DCEO County Population Projections list population by age groups separately for male and female. Consolidate the age groups and sexes for 2015 in the table exported in step 39 using following calculations –
a. For Under 17, add 0-4 Years, 5-9 years, 10-14 years and half of 15-19 years for both male and female.
b. For 18-34, add half of 15-19 years, 20-24 years, 25-29 years and 30-34 years for both male and female.
c. For 35-54, add 35-39 years, 40-44 years, 45-49 years and 50-54 years for both male and female.
d. For 55-74, add 55-59 years, 60-64 years, 65-69 years and 70-74 years for both male and female.
e. For 74 - Older, add 75-79 years, 80-84 years and 85+ years for both male and female.
41. Calculate % distribution by age group for 2015 using the values obtained in step 40 and the total population listed in the table exported in step 39.
42. Repeat step 40 and step 41 to obtain population projections for 2020, 2025 and 2030.
43. For 2035, use the forecast function in Microsoft Excel. Forecast function calculates, or predicts, a future value by using existing values. The predicted value is a y-value for a

10
A Guide to IEDC Site Selection Data Standards
given x-value. The known values are existing x-values and y-values, and the new value is predicted by using linear regression. An example forecasting function can be found at https://www.youtube.com/watch?v=ksCVXXh5_hk. For each age group, use syntax FORECAST(x,known_y’s,known_x’s) -
a. X is the data point for which you want to predict a value (year 2035).
b. Known_y’s is the dependent array or range of data (populations from 2015 to 2030).
c. Known_x’s is the independent array or range of data (years 2015 to 2030).
44. Calculate the total population for 2035 by adding the age group populations forecasted in step 43.
45. Calculate % distribution by age group for 2035 using the values obtained in step 43 and the total population calculated in step 44.
46. Five year projections for median age, household number, median household income and household income distribution are not available.
Net Migration Last Five Years Available
47. US Census Bureau maintains the data for net migration on county level. This data is available for 2011 to 2013 from American FactFinder and it is archived for years prior to 2011 on US Census Bureau website.
48. Open American FactFinder (factfinder2.census.gov) and go to Advance Search.
49. Select Fulton County, IL as geography type and add this to your selection.
50. Type PEPTCOMP: Estimates of the Components of Resident Population Change: April 1, 2010 to July 1, 2013 in topic or table name to access data for 2013 net migration.
51. Select and open the table with 2013 Population Estimates as dataset.
52. Download the table in Microsoft Excel (.xls) format.
53. The table downloaded in step 52 contains net migration for 2013.
54. Go back in FactFinder and type PEPTCOMP: Estimates of the Components of Resident Population Change: April 1, 2010 to July 1, 2012 in topic or table name to access data for 2012 net migration.
55. Select and open the table with 2012 Population Estimates as dataset.
56. Download the table in Microsoft Excel (.xls) format
57. The table downloaded in step 56 contains net migration for 2012.
11
A Guide to IEDC Site Selection Data Standards
58. Go back in FactFinder and type PEPTCOMP: Estimates of the Components of Resident Population Change: April 1, 2010 to July 1, 2011 in topic or table name to access data for 2011 net migration.
59. Select and open the table with 2011 Population Estimates as dataset.
60. Download the table in Microsoft Excel (.xls) format.
61. The table downloaded in step 60 contains net migration for 2011.
62. For years prior to 2010, access the archived information on US Census Bureau website (https://www.census.gov/popest/research/eval-estimates/eval-est2010.html).
63. Look for Annual Resident Population Estimates, Estimated Components of Resident Population Change, and Rates of the Components of Resident Population Change for States and Counties: April 1, 2000 to July 1, 2010 (CO-EST2010-ALLDATA) and download the CSV file. An explanation of the variables in this dataset can be found at https://www.census.gov/popest/research/eval-estimates/CO-EST2010-ALLDATA.pdf.
64. In the table downloaded in step 63, note the values of NETMIG2010 and NETMIG2009 for Fulton County, IL. NETMIG2010 is the net migration in 2010 and NETMIG2009 is the net migration in 2009.
Workforce Education Attainment (25 - 64 Years of Age)
65. US Census Bureau maintains the data for education attainment for population of 25 years or older.
66. Open American FactFinder (factfinder2.census.gov) and go to Advance Search.
67. Select Fulton County, IL as geography type and add this to your selection.
68. Type B15002: SEX BY EDUCATIONAL ATTAINMENT FOR THE POPULATION 25 YEARS AND OVER in topic or table name to access data for 2012 education attainment.
69. Select and open the table with 2012 ACS 5-year estimates as dataset.
70. Download the table in Microsoft Excel (.xls) format.
71. The education groups listed in IEDC table 1 do not match with the education groups available with US Census Bureau. Along with this, US Census Bureau lists education attainment groups separately for male and female. Consolidate the education groups and sexes in the table exported in step 70 using following calculations –
a. For Under - 12 Years, add No schooling completed, Nursery to 4th grade, 5th and 6th grade, 7th and 8th grade, 9th grade, 10th grade, 11th grade, and 12th grade, no diploma for both male and female.
12
A Guide to IEDC Site Selection Data Standards
b. For 12 - 15 Years, add some college, less than 1 year and some college, 1 or more years, no degree for both male and female.
c. For 12 Years Only, add High school graduate, GED, or alternative for both male and female.
d. For Some College, add some college, less than 1 year and some college, 1 or more years, no degree for both male and female.
e. For Associate Degrees, add Associate degrees for both male and female.
f. For Subtotal, add the values for under - 12 Years, 12 Years Only, Some College and Associate Degrees. Do not add 12 - 15 Years to avoid duplicacy.
g. For 16 Years - More, add Master’s degree, Professional school degree, Doctorate degree both male and female.
h. For 16 Years Only, add Bachelor’s degree for both male and female.
72. Calculate % education attainment for using the values obtained in step 71 and the total population listed in the table downloaded in step 70.

13
A Guide to IEDC Site Selection Data Standards
Unemployment Rate
1. US Bureau of Labor Statistics maintains the data for unemployment rate.
2. Open data tools under US Bureau of Labor Statistics (http://www.bls.gov/data/) and go to unemployment.
3. Find multi-screen search function for Local Area Unemployment Statistics (LAUS).
4. Select Illinois for State(s) where area(s) located or Census regions and divisions.
5. Select counties and equivalents for Areatype.
6. Select Fulton County, IL as Area.
7. Select unemployment rate as Measure.
8. Retrieve data for series id LAUCN170570000000003.
9. Download the table in .xls format.
Table 2Labor Force Characteristics

14
A Guide to IEDC Site Selection Data Standards
10. The table downloaded in step 9 contains annual unemployment rates from 2009 to 2013.
Non-Agricultural Employment Reported by Place of Work
11. US Bureau of Economic Analysis maintains the data for Non-Agricultural Employment Reported by Place of Work.
12. Open regional economic accounts at US Bureau of Economic Analysis (http://www.bea.gov/regional/) and go to Local Area Personal Income & Employment.
13. Open Total full-time and part-time employment by industry (CA25, CA25N).
14. Select NAICS (2001 forward) as Classification.
15. Select County as Major Area.
16. Select Illinois as State.
17. Select Fulton, IL as Area.
18. Select All years as Time Period.
19. Download the table in XLS format.
20. The table downloaded in step 19 contains information about Non-Agricultural Employment Reported by Industry, Total Non-Farm Employment and Total Employment for 2001-2012.
21. The table downloaded in step 19 may have some missing data (some data may not be shown to avoid disclosure of confidential information). Use estimation method to calculate these missing values. Estimation method is appropriate when values are missing sporadically for different industries. To estimate these missing values (D), subtract the known employment values from the non-farm employment. Then allocate the employment to (D) industries by –
a. Proportionality to employment in years without (D).
b. Or judgmentally based upon your observation.
c. Or based on utilization of other data sources (ex. BLS).
22. The employment categories listed in IEDC table 2 do not match with the employment categories available with US Bureau of Economic Analysis. Consolidate the employment categories in the table downloaded in step 19 using following calculations for 2001, 2011 and 2012 –
a. Mining, Construction, Manufacturing, Wholesale Trade and Retail Trade employment can be directly noted from the table downloaded in step 19.
b. For Transportation and public utilities, add Utilities and Transportation and

15
A Guide to IEDC Site Selection Data Standards
warehousing.
c. For Finance, Insurance & Real Estate, add Finance and insurance and Real estate and rental and leasing.
d. For Service, add Professional, scientific, and technical services, Management of companies and enterprises, Administrative and waste management services, Educational services, Health care and social assistance, Arts, entertainment, and recreation, Accommodation and food services and Other services, except public administration.
e. For Government, note Government and government enterprises.
f. For Total, note the Non-farm Employment.
23. For 5 year projections, use the forecast function in Microsoft Excel. Forecast function calculates, or predicts, a future value by using existing values. The predicted value is a y-value for a given x-value. The known values are existing x-values and y-values, and the new value is predicted by using linear regression. An example forecasting function can be found at https://www.youtube.com/watch?v=ksCVXXh5_hk. For each employment category, use syntax FORECAST(x,known_y’s,known_x’s).
a. X is the data point for which you want to predict a value (year 2017).
b. Known_y’s is the dependent array or range of data (employment from 2001 to 2012).
c. Known_x’s is the independent array or range of data (years 2001 to 2012).
24. Calculate % of Total Employed Persons using the values obtained in step 22 and step 23 and the total employment listed in the table downloaded in step 19.
Resident Employment Reported by Group Occupation
25. US Census Bureau maintains the data for employment reported by group occupation.
26. Open American FactFinder (factfinder2.census.gov) and go to Advance Search.
27. Select Fulton County, IL as geography type and add this to your selection.
28. Type DP-3: Profile of Selected Economic Characteristics: 2000 in topic or table name to access data for 2000 employment by group occupation.
29. Select and open the table with 2000 SF3 Sample Data as dataset.
30. Download the table in Microsoft Excel (.xls) format.
31. The table downloaded in step 30 contains the employment by group occupation for 2000.

16
A Guide to IEDC Site Selection Data Standards
32. Go back in FactFinder and type DP03: Selected Economic Characteristics in topic or table name to access data for 2012 employment by group occupation.
33. Select and open the table with 2012 ACS 5-year estimates as dataset.
34. Download the table in Microsoft Excel (.xls) format.
35. The table downloaded in step 34 contains the employment by group occupation for 2012.
36. The table downloaded in step 30 has one extra group occupation category than the table downloaded in step 34. For the table downloaded in step 30, consolidate the group occupation categories using following calculation –
a. For Natural resources, construction, and maintenance occupations, add Farming, fishing, and forestry occupations and Construction, extraction, and maintenance occupations.
Employed Residents Working in 2012
37. US Census Bureau maintains the data for employed residents working inside and outside the county of residence.
38. Open American FactFinder (factfinder2.census.gov) and go to Advance Search.
39. Select Fulton County, IL as geography type and add this to your selection.
40. Type B08007: SEX OF WORKERS BY PLACE OF WORK--STATE AND COUNTY LEVEL in topic or table name to access data for 2012 employed residents working outside the county of residence.
41. Select and open the table with 2012 ACS 5-year estimates as dataset.
42. Download the table in Microsoft Excel (.xls) format.
43. The table downloaded in step 42 contains the number of employed residents working outside the county of residence for 2012.
44. Calculate percentage using the number of employed residents working outside the county of residence and the total listed in the table downloaded in step 42.
Commute Times
45. US Census Bureau maintains the data for travel time to work.
46. Open American FactFinder (factfinder2.census.gov) and go to Advance Search.
47. Select Fulton County, IL as geography type and add this to your selection.

17
A Guide to IEDC Site Selection Data Standards
48. Type S0801: Commuting Characteristics by Sex in topic or table name to access data for 2012 commute times.
49. Select and open the table with 2012 ACS 5-year estimates as dataset.
50. Download the table in Microsoft Excel (.xls) format.
51. The table downloaded in step 50 contains percentage values for the number of workers for commute time categories.
52. The commute time categories listed in IEDC table 2 do not match with the commute time categories available with US Census Bureau. Consolidate the commute time categories in the table downloaded in step 50 using following calculations –
a. For Less than 15 Minutes, add Less than 10 minutes and 10 to 14 minutes.
b. For 15 - 29 Minutes, add 15 to 19 minutes, 20 to 24 minutes and 25 to 29 minutes.
c. For Over 30 Minutes, add 30 to 34 minutes, 35 to 44 minutes, 45 to 59 minutes and 60 or more minutes.
53. For number (#), multiply the percentage values obtained in step 52 to the number of Workers 16 years and over who did not work at home from the table downloaded in step 50.
54. For Median commute times, note Mean travel time to work (minutes) from the table downloaded in step 50.
Labor Participation Rate
55. US Census Bureau maintains data about number of males and females in labor force. This data can be used to calculate labor participation rate. The labor force participation rate is the ratio between the labor force and the overall size of their cohort.
56. Open American FactFinder (factfinder2.census.gov) and go to Advance Search.
57. Select Fulton County, IL as geography type and add this to your selection.
58. Type DP03: Selected Economic Characteristics in topic or table name to access data for 2012 employment status.
59. Select and open the table with 2012 ACS 5-year estimates as dataset.
60. Download the table in Microsoft Excel (.xls) format.
61. The table downloaded in step 60 contains the data for labor force. To calculate labor force participation rate, perform following calculations in the table downloaded in step 60 -

18
A Guide to IEDC Site Selection Data Standards
a. Total number of females 16 years or over is given in the table; calculate the total number of males 16 years or over by subtracting the females 16 years or over from the population 16 years or over.
b. Total number of females in labor force is given in the table; calculate the total number of males in labor force by subtracting the females in labor force from the total population in labor force.
c. Labor participation rate for male can be calculated by dividing males in labor force obtained in step 61.b by males 16 years or over obtained in step 61.a. Convert the ratio in percentage.
d. Labor participation rate for female can be calculated by dividing females in labor force by the females 16 years or over.
e. Total labor participation rate can be calculated by dividing the population in labor force by population 16 years or over.
Education & Labor Force
62. Illinois State Board of Education maintains the data for school enrollment; Spoon River College maintains data for community college enrollment and US Census Bureau maintains the data for the number of high school and community college graduates.
63. The data for number of High School Students Enrolling in College is not maintained by the schools in Fulton County, IL.
64. The data for 4 Year University (Full-Time) enrollment and graduates is not available for Fulton County, IL as the county does not have any 4 year university.
65. For High School (Public/Private) enrollment, open Data Analysis and Accountability on Illinois State Board of Education webpage (http://www.isbe.net/research/htmls/fall_housing.htm).
66. Look for District Summary under 2013-14 Students Housed by Serving School and download the excel file.
67. Add the number of K-12 students for Fulton County school districts in the table downloaded in step 66. Fulton County has following school districts –
a. Astoria CUSD 1
b. V I T CUSD 2
c. CUSD 3 Fulton County
d. Spoon River Valley CUSD 4

19
A Guide to IEDC Site Selection Data Standards
e. Canton Union SD 66
f. Lewistown CUSD 97
68. The value obtained in step 67 is the enrollment for High School (Public/Private).
69. For Community College (Full-Time) enrollment, open Spoon River College Reports (http://www.src.edu/about/Pages/reports.aspx).
70. Look for student headcount in Fall 2013. This value is the enrollment for Community College (Full-Time).
71. For number of graduates, open American FactFinder (factfinder2.census.gov) and go to Advance Search.
72. Select Fulton County, IL as geography type and add this to your selection.
73. Type B15002: SEX BY EDUCATIONAL ATTAINMENT FOR THE POPULATION 25 YEARS AND OVER in topic or table name to access data for graduates.
74. Select and open the table with 2012 ACS 5-year estimates as dataset.
75. Download the table in Microsoft Excel (.xls) format.
76. The education groups listed in IEDC table 2 do not match with the education groups available with US Census Bureau. Along with this, US Census Bureau lists education attainment groups separately for male and female. Consolidate the education groups and sexes in the table exported in step 75 using following calculations –
a. For High School (Public/Private) graduates, add High school graduate, GED, or alternative for both male and female.
b. For Community College (Full-Time) graduates, add Associate Degrees for both male and female.
Military Presence
77. US Department of Defense (DoD) maintains the data for military installations for all branches of military. The data for military installations can be accessed at DoD website (http://www.militaryinstallations.dod.mil/pls/psgprod/f?p=MI:LOOKUP:0::::P3_VAL:MI).
78. Fulton County, IL has no Military Installations.
20
A Guide to IEDC Site Selection Data Standards
All Sectors
1. ESRI Business Analyst maintains the list of businesses along with their NAICS codes and number of employees. The official website if Fulton County, IL also lists the leading employers (http://www.fultonco.org/work-here/fulton-county-employment/).
2. A list of all businesses for Fulton County, IL (accessed on September 04, 2014 from ESRI Business Analyst) is provided with this guide. It has following information about businesses – address, phone number, NAICS code and number of employees. Look for an Excel file with the name “Fulton County IL Businesses 2014” in the data provided with this guide. The data accompanying this guide is available on request from Spoon River Partnership for Economic Development (see Appendix 1 for contact information).
Table 3Leading Employers
21
A Guide to IEDC Site Selection Data Standards
3. Sort the table mentioned in step 2 from highest to lowest Employment. The sorted table is the list of leading employer for all sectors. You can mention the top ten leading employers for all sectors.
4. You can get the city and county information from the address of the business in the table from step 3.
5. The first two digits of the NAICS code from in this table from step 3 are the 2 digit NAICS code for businesses.
6. US Census Bureau provides explanation for the NAICS codes (http://www.census.gov/eos/www/naics/). For product and services, check individual NAICS codes for explanation. You can enter the six digit NAICS code from table listed in step 3 under ‘Enter keyword or 2-6 digit code’ on US Census Bureau website for the explanation.
7. You can get employment numbers from the table mentioned in step 3. However, it is recommended to verify the number of employees by contacting the employers (see Appendix 1 for contact information).
8. The function, union affiliation and percentage of number of union workers information can be collected by contacting the employers (see Appendix 1 for contact information).
Manufacturing
9. Sort the table mentioned in step 2 from highest to lowest Employment and for NAICS codes starting with 31 - 33. The sorted table is the list of leading employers for manufacturing.
10. You can get the city and county information from the address of the business in the table from step 9.
11. The first two digits of the NAICS code from in this table from step 9 are the 2 digit NAICS code for businesses.
12. US Census Bureau provides explanation for the NAICS codes (http://www.census.gov/eos/www/naics/). For product and services, check individual NAICS codes for explanation. You can enter the six digit NAICS code from table listed in step 9 under ‘Enter keyword or 2-6 digit code’ on US Census Bureau website for the explanation.
13. You can get employment numbers from the table mentioned in step 9. However, it is recommended to verify the number of employees by contacting the employers (see Appendix 1 for contact information).
14. The function, union affiliation and percentage of number of union workers information can be collected by contacting the employers (see Appendix 1 for contact information).

22
A Guide to IEDC Site Selection Data Standards
Distribution
15. Sort the table mentioned in step 2 from highest to lowest Employment and for NAICS codes starting with 42, 44 -45 and 48-49. The sorted table is the list of leading employers for distribution.
16. You can get the city and county information from the address of the business in the table from step 15.
17. The first two digits of the NAICS code from in this table from step 15 are the 2 digit NAICS code for businesses.
18. US Census Bureau provides explanation for the NAICS codes (http://www.census.gov/eos/www/naics/). For product and services, check individual NAICS codes for explanation. You can enter the six digit NAICS code from table listed in step 15 under ‘Enter keyword or 2-6 digit code’ on US Census Bureau website for the explanation.
19. You can get employment numbers from the table mentioned in step 15. However, it is recommended to verify the number of employees by contacting the employers (see Appendix 1 for contact information).
20. The function, union affiliation and percentage of number of union workers information can be collected by contacting the employers (see Appendix 1 for contact information).
FIRE
21. FIRE stands for Finance, Insurance and Real Estate.
22. Sort the table mentioned in step 2 from highest to lowest Employment and for NAICS codes starting with 52 - 53. The sorted table is the list of leading employers for FIRE.
23. You can get the city and county information from the address of the business in the table from step 22.
24. The first two digits of the NAICS code from in this table from step 22 are the 2 digit NAICS code for businesses.
25. US Census Bureau provides explanation for the NAICS codes. (http://www.census.gov/eos/www/naics/) For product and services, check individual NAICS codes for explanation. You can enter the six digit NAICS code from table listed in step 22 under ‘Enter keyword or 2-6 digit code’ on US Census Bureau website for the explanation.
26. You can get employment numbers from the table mentioned in step 22. However, it is recommended to verify the number of employees by contacting the employers (see Appendix 1 for contact information).

23
A Guide to IEDC Site Selection Data Standards
27. The function, union affiliation and percentage of number of union workers information can be collected by contacting the employers (see Appendix 1 for contact information).
Back Offices Across all Sector
28. While contacting the employers for All sectors, Manufacturing, Distribution and FIRE for their function, notice if they mention that they are a back office. You can list those employers in this section.
29. Fulton County, IL has no back offices for any sector (as on October 23, 2014).

24
A Guide to IEDC Site Selection Data Standards
New to the Area and Expansions/New Facilities
1. The information about the companies new to the area can be gathers by contacting companies with 50 of more employees.
2. A list of all businesses for Fulton County, IL (accessed on September 04, 2014 from ESRI Business Analyst) is provided with this guide. It has following information about businesses – address, phone number, NAICS code and number of employees. Look for an Excel file with the name “Fulton County IL Businesses 2014” in the data provided with this guide. The data accompanying this guide is available on request from Spoon River Partnership for Economic Development (see Appendix 1 for contact information).
3. Filter the table mentioned in step 2 for more than 50 employees.
Table 4New/Expanding Companies

25
A Guide to IEDC Site Selection Data Standards
4. Contact the companies to inquire if they started in the county within three years or expanded in past two years (see Appendix 1 for contact information).
5. Fulton County, IL has no company with more than 50 employees that started within three years or expanded in past two years (as on October 23, 2014).
Downsizing/Closing/Layoff
6. Illinois Worknet Center maintains statewide data for downsizing, closures and layoffs in form of WARN notices (Worker Adjustment and Retraining Notification Act). WARN offers protection to workers, their families and communities by requiring employers to provide notice 60 days in advance of covered plant closings and covered mass layoffs.
7. Open archived WARN reports at Illinois Worknet Center website (http://www2.illinoisworknet.com/LayoffRecovery/Pages/ArchivedWARNReports.aspx).
8. Download WARN notices for past two years.
9. Look for Fulton County in downloaded PDF files from step 8.
10. Fulton County, IL has no company with more than 50 employees that downsized, closed and laid off employees in past two years.

26
A Guide to IEDC Site Selection Data Standards
1. The US Department of Defense (DoD) maintains the data for military installations for all branches of military. The data for military installations can be accessed at DoD website (http://www.militaryinstallations.dod.mil/pls/psgprod/f?p=MI:LOOKUP:0::::P3_VAL:MI).
2. Fulton County, IL has no Military Installation.
Table 5Military Base and Installations

27
A Guide to IEDC Site Selection Data Standards
1. County and city governments along with Spoon River College can be inquired to locate R&D centers (see Appendix 1 for contact information).
2. Fulton County, IL has no R&D center.
Table 6Research Base

28
A Guide to IEDC Site Selection Data Standards
1. County and city governments along with Spoon River College can be inquired to locate four year institutions (see Appendix 1 for contact information).
2. Fulton County, IL has no four year institution.
Table 7Four Year Institutions

29
A Guide to IEDC Site Selection Data Standards
1. County and city governments can be inquired to locate community colleges (see Appendix 1 for contact information).
2. Spoon River College in Canton is the only community college in Fulton County, IL.
3. Spoon River College maintains the data for total enrollment.
4. Open ‘Essentially SRC Report’ on Spoon River College website (http://www.src.edu/about/Pages/reports.aspx).
5. Look for Student Headcounts under Spoon River College statistics. The value for Fall 2013 is the total enrollment.
6. Spoon River College can be contacted for the information regarding full time and part time enrollment, programs, number of annual graduate degrees and percentage of graduates joining a four year university (see Appendix 1 for contact information).
Table 8Community Colleges

30
A Guide to IEDC Site Selection Data Standards
1. County and city governments along with Spoon River College can be inquired to locate vocational and training centers other than the community college (see Appendix 1 for contact information).
2. Innovations Design Academy and Graham Hospital School of Nursing in Canton are the two vocational and training centers other than the community college in Fulton County, IL.
3. Innovations Design Academy and Graham Hospital School of Nursing can be contacted for the information regarding total, full time and part time enrollment, programs, number of annual graduate degrees and certificates (see Appendix 1 for contact information).
Table 9Vocational/Training Center Resources

31
A Guide to IEDC Site Selection Data Standards
1. Illinois Department of Economic Security (IDES) maintains the data for Average Annual Salary by Major Industry under Quarterly Census of Employment & Wages (QCEW).
2. Open Quarterly Census of Employment & Wages (QCEW) on Illinois Department of Economic Security (IDES) website (http://www.ides.illinois.gov/LMI/Pages/Quarterly_Census_of_Employment_and_Wages.aspx).
3. Look for Illinois at Work section.
4. Set Area as Counties.
5. Set Quarter as 1st Quarter 2014.
6. Download the table in Excel format.
Table 10Available Payroll Costs by Industry

32
A Guide to IEDC Site Selection Data Standards
7. The table downloaded in step 6 contains the information for salary and employment for NAICS industry classification for all Illinois counties.
8. Search for the information for Fulton County.
9. The industry categories listed in IEDC table 10 do not match with the employment categories available with Quarterly Census of Employment & Wages (QCEW). Consolidate the industry categories for Fulton County in the table downloaded in step 6 using following calculations –
a. Mining, Construction, Manufacturing, Wholesale Trade and Retail Trade employment and salary can be directly noted from the table downloaded in step 6.
b. For Transportation and public utilities, add Utilities and Transportation and warehousing.
c. For FIRE, note Financial Activities.
d. For Service, add Professional and Business Services, Educational and Health Services, Leisure and Hospitality and Other services.
e. For Government, note State & Local Government.
10. For total salary, add the salaries for all industrial categories from step 9.
11. For total number of employees, add the number of employees for all industrial categories from step 9.
12. Calculate Total Wages Paid Divided by Number of Employees by dividing total salary from step 10 with total employment from step 11.

33
A Guide to IEDC Site Selection Data Standards
1. Illinois Department of Economic Security (IEDS) maintains data for wages under Occupational Employment Statistics (OES).
2. As we are not following the survey method but using government databases for salary information, the number of surveyed firms, the number of covered employees and weighted average salary will not be available.
3. Open Occupational Employment Statistics (OES) on Illinois Department of Economic Security (IEDS) website (http://www.ides.illinois.gov/LMI/Pages/Occupational_Employment_Statistics.aspx).
4. Download following tables from Occupational Employment Statistics (OES) –
Table 11Average Salary by Selected Occupation

34
A Guide to IEDC Site Selection Data Standards
a. Look for County Occupational Wages (PDF & Excel) section, select Fulton as County and download the table in PDF format.
b. Look for Local Workforce Area Occupational Wages (PDF & Excel) section, select LWA 16 as local workforce area and download the table in PDF format.
c. Look for MSA Occupational Wages (PDF & Excel) section, select Peoria MSA as Metropolitan Statistical Area and download the table in PDF format.
5. The tables downloaded in step 4 contain Entry Wage, Median Wage and Experienced Wage for selected Standard Occupational Classification (SOC) codes and SOC occupational title.
6. The types of wages asked in IEDC table 11 do not match with the wage types available in the tables downloaded in step 4. Use following correspondence –
a. For Average Hire-In Rate, note hourly entry wage.
b. For Average Minimum, note annual entry wage.
c. For Average Median Salary, note annual median wage.
d. For Average Maximum Salary, note annual experienced wage.
7. The occupation categories listed in IEDC table 11 do not match with the SOC codes and occupation titles listed in tables downloaded in step 4. Use following correspondence –
a. Professional: Accountant (13-2011), Management Trainee (11-0000), Programmer/Analyst (15-1131) and Engineer (17-0000).
b. Retail: Retail Store Clerk (41-2031), Stock Room Clerk (43-5081) and Hospitality Clerk (41-2021).
c. Clerical: Customer Service Rep. (43-4051), Telesales Rep. (41-3099), Data Entry Clerk (43-9021), Executive Secretary (43-6011), Accounting Clerk (43-3031) and Word Processor (43-9061).
d. Unskilled: General Laborer (53-7062), Warehouse Person (53-7062), Hand Packer (53-7064), Material Handler (53-7062) and Light Assembly (51-2092).
e. Semi-Skilled: Machine Operator (51-4011) and Fork Lift Operator (53-7051).
f. Skilled: Machine Maintenance (49-9043), Tool & Die (51-4111), Machinist (51-4041) and Welder (51-4121).
g. Technical: Numerical Control Machine Programmer (51-4011), Electronic Technician (47-2111), Medical Laboratory Technician (29-2071) and Network Technician (15-1142).
35
A Guide to IEDC Site Selection Data Standards
8. You will check for the availability of data on Fulton County level from in the table downloaded from step 4a. If the data for the respective SOC code is not available on County level, you will check the availability of data on Local Workforce Area level from in the table downloaded from step 4b. If the data for the respective SOC code is not available on Local Workforce Area level, you will check the availability of data on Peoria MSA level from in the table downloaded from step 4c (due to the limitation of data available for all SOC codes on Fulton County level, Local Workforce Area 16 and Peoria MSA can be used as a proxy for wage information).
9. Contact manufacturing firms and offices (banks) in the county for average work week and annual turnover information. For manufacturing firms, contact Cook Medical, Kitchen Cooked, Sawmill Hydraulics and LTD Industries. For offices, contact MidAmerica National Bank, Prairie State Bank & Trust, Bank of Farmington, Ipava State Bank and Tomkins State Bank (see Appendix 1 for contact information).

36
A Guide to IEDC Site Selection Data Standards
Workers Compensation
1. Forward Wisconsin, Inc and Illinois Workers’ Compensation Commission maintain the data for Workforce Compensation.
2. Open State Comparison on Forward Wisconsin website (http://www.forwardwi.com/category45/State-Comparisons).
3. Look for WI, MN, IL & MI Worker Compensation Comparison and download the PDF file.
4. The file downloaded in step 3 contains the information about Average Cost for All Manufacturing per $100 Payroll and Average Rate for Office Workers (8810).
5. Open Benefit Rates on Illinois Workers’ Compensation Commission website (http://www.iwcc.il.gov/benefits.htm).
Table 12Workers Compensation and Unemployment Insurance

37
A Guide to IEDC Site Selection Data Standards
6. For Maximum Weekly Benefit, note the maximum value for the death and PTD benefits.
Unemployment Insurance
7. Forward Wisconsin, Inc and Illinois Department of Economic Security maintain the data for Unemployment Insurance.
8. Open State Comparison on Forward Wisconsin website (http://www.forwardwi.com/category45/State-Comparisons).
9. Look for Wisconsin vs Illinois Tax Rates and download the PDF file.
10. The file downloaded in step 9 contains the information about Taxable base, Rate % and Average among New Employers.
11. Open Frequently Used Forms and Publications on Illinois Department of Economic Security website (http://www.ides.illinois.gov/SitePages/Employer%20Forms%20and%20Publications.aspx).
12. Look for Illinois Unemployment Insurance Tax Rate Chart, 2004-2014 and download the PDF file.
13. The file downloaded in step 12 contains the information about Average among Existing Employers. Note the value for standard rate for 2013 for Average among Existing Employers.
14. Infoplease.com maintains the data for maximum weekly benefit for unemployment insurance.
15. Open State Unemployment Compensation on Infoplease.com (http://www.infoplease.com/business/economy/state-unemployment-compensation.html).
16. For Maximum Weekly Benefit, note the value of maximum weekly benefit for Illinois.

38
A Guide to IEDC Site Selection Data Standards
Right to Work and Organized Workforce
1. National Right to Work Legal Defense Foundation maintains a list of right to work states.
2. Open Right to Work FAQs on National Right to Work Legal Defense Foundation website (http://www.nrtw.org/b/rtw_faq.htm).
3. Look for the question - What is a Right to Work law? It has the list of 24 Right to Work states.
4. Illinois is not a right to work state.
5. Union Membership and Coverage Database from Current Population Survey (CPS) maintain the information about organized workforce.
6. Open Union Membership and Coverage Database website (http://www.unionstats.com/).
Table 13Labor Management Relations

39
A Guide to IEDC Site Selection Data Standards
7. Look for State: Union Membership, Coverage, Density, and Employment by State and Sector, 1983-2013.
8. Select html 2013 as year and format.
9. The webpage contains information about percentage total organized workforce and percentage of manufacturing organized workforce for Illinois.
Union Elections and Listing by Company - Companies w/50 or more Employees, Last 5 Years
10. National Labor Relations Board maintains the data about all union elections and their results.
11. Open election reports on National Labor Relations Board website (http://www.nlrb.gov/reports-guidance/reports/election-reports).
12. Download all pdf files for last five financial years (FY2014 – FY2009).
13. The files downloaded in step 12 contain information about election results, company name, union involved, NAICS code, Date, Number of Votes for Union and Number of Votes against Union.
14. Note the elections from Fulton County cities in pdf files downloaded in step 12. A list of Fulton County communities can be found at Fulton County’s website (http://www.fultonco.org/live-here/experience-communities).
15. To list the union election in appropriate row if industry classification, note the NAICS codes. Manufacturing industries are NAICS codes starting with 31 – 33. Distribution industries are NAICS codes starting with 42, 44 -45 and 48-49 and FIRE industries are NAICS codes starting with 52 - 53.
16. Use the election results to calculate percentage of elections won by the union.
Strikes by Company (Listing by Company)
17. Union Facts maintains the data for strikes and work stoppages for unions.
18. You need the information about union affiliations for companies with more than 50 employees. If you have the name of a union, Union Facts provides you information about all strikes and work stoppages for that union from whole US.
19. A list of all businesses for Fulton County, IL (accessed on September 04, 2014 from ESRI Business Analyst) is provided with this guide. It has following information about businesses – address, phone number, NAICS code and number of employees. Look for an Excel file with

40
A Guide to IEDC Site Selection Data Standards
the name “Fulton County IL Businesses 2014” in the data provided with this guide. The data accompanying this guide is available on request from Spoon River Partnership for Economic Development (see Appendix 1 for contact information).
20. Filter the table mentioned in step 19 for more than 50 employees.
21. Contact the companies to inquire if they have a union affiliation (see Appendix 1 for contact information).
22. Open Union Facts (https://www.unionfacts.com/cuf/).
23. Look for Find Your Union and select the union names collected from step 21 one by one.
24. For each search in step 23, look for strikes.
25. The webpage contains information about company name, union involved, number of employees on strike, date and duration of the strike.
26. Fulton County has no strikes for companies with more than 50 employees in last five years.

41
A Guide to IEDC Site Selection Data Standards
Major 2 or 4 Lane Highways Linking the Areas, indicate if City, County, State, US or Interstate
1. Fulton County website contains the information for major 2 or 4 lane highways.
2. Open Transportation page of Fulton County website (http://www.fultonco.org/economic-development/transportation/). Note the information for highways serving community.
3. Google maps can be used to look for nearby cities around Fulton County, IL (https://www.google.com/maps). Calculate distance from Canton, IL to nearby cities. However, you need to check if nearby cities lie in any metropolitan and micropolitan area.
4. Office of Management and Budget (OMB) maintains the information for metropolitan and micropolitan areas (http://www.whitehouse.gov/sites/default/files/omb/bulletins/2013/b-13-01.pdf).
Table 14Transportation

42
A Guide to IEDC Site Selection Data Standards
5. Look for the nearby cities from step 3 in the pdf from step 4 to note the metropolitan and micropolitan areas.
Motor Carriers/Trucks
6. Quick TSI maintains a list of Canton trucking companies. These companies can be used as a proxy for Fulton County, IL.
7. Open Canton trucking companies on Quick TSI website (http://www.quicktransportsolutions.com/carrier/illinois/canton.php).
8. The page accessed in step 7 contains the number of Common Carriers Serving the Area. As all companies have their office in Canton, IL, the same number will work for number of Common Carriers with Local Terminals.
Railroads (by Rail Carrier)
9. Fulton County website contains the information about the rail service.
10. Fulton County is served by two active railroads, the Burlington Northern Santa Fe, and the Keokuk Junction Railway.
11. The Burlington Northern Santa Fe, and the Keokuk Junction Railway can be contacted for Main or Branch Line, Shortline or National and Nearest Switching Yard (see Appendix 1 for contact information).
Commercial Airport
12. County and city governments can be inquired about commercial airport (see Appendix 1 for contact information).
13. General Wayne A. Downing Peoria International Airport is the nearest commercial airport from Fulton County, IL.
14. Federal Aviation Administration maintains information about hub status.
15. Open National Plan of Integrated Airport System (2015-2019) on Federal Aviation Administration website (http://www.faa.gov/airports/planning_capacity/npias/reports/media/npias-2015-2019-report-appendix-a.pdf).
16. The pdf file accessed in step 15 contains information about the hub status of Peoria International Airport.
17. Google Maps can be used to calculate the distance of Peoria International Airport from Canton, IL (https://www.google.com/maps).

43
A Guide to IEDC Site Selection Data Standards
18. AirNav.com maintains information about number of runways and runway lengths.
19. Open Peoria International Airport at AirNav.com (http://www.airnav.com/airport/KPIA).
20. The webpage accessed in step 18 contains information about number of runways and length of runways for Peoria International Airport.
21. The website of Peoria International Airport maintains information about Carriers (Names) Serving Airport (https://www.flypia.com/).
a. Look for Airlines to note passenger carriers (https://www.flypia.com/).
b. Look for General Aviation to note Charter carriers (https://www.flypia.com/aviation.php).
c. Look for Air Cargo for Cargo carriers (https://www.flypia.com/cargo.php).
22. Peoria International Airport can be contacted for information Approved Capital Expansion Plan, Approved New Service by Carrier (with Carrier & Start Date) and number of Days Closed to Inclement Weather for the Last 3 Years (see Appendix 1 for contact information).
23. Check daily schedule at individual airline pages to calculate Total # of Daily Non-Stops to All Cities Served and Six Largest Cities Served.
a. For Allegiant, https://www.flypia.com/allegiant.php
b. For American Airlines, https://www.flypia.com/american.php
c. For Delta Airlines, https://www.flypia.com/delta.php
d. For United Airlines, https://www.flypia.com/united.php
Distance to the Nearest General Aviation Airport
24. County and city governments can be inquired about General Aviation Airport (see Appendix 1 for contact information).
25. Ingersoll Airport is the only General Aviation Airport in Fulton County, IL.
26. Google Maps can be used to calculate the distance of Ingersoll Airport from Canton, IL (https://www.google.com/maps).
27. AirNav.com maintains information about number of runways and runway lengths.
28. Open Peoria International Airport at AirNav.com (http://www.airnav.com/airport/KCTK).
29. The webpage accessed in step 28 contains information about number of runways and length of runways for Ingersoll Airport.

44
A Guide to IEDC Site Selection Data Standards
30. Ingersoll Airport can be contacted for information about Full Instrument Landing Capabilities, Hours of Operation and number of Days Closed to Inclement Weather for the Last 3 Years (see Appendix 1 for contact information).
Ports
31. Illinois International Port District maintains information about the port.
32. The Port of Chicago is the nearest international port from Fulton County, IL.
33. Google Maps can be used to calculate the distance The Port of Chicago from Canton, IL (https://www.google.com/maps).
34. Open Facilities on Illinois International Port District website to note Channel Depth, Turning Basin, Barging Facilities and General Cargo Facilities (http://iipd.com/operations/facilities.htm).
35. Open Services on Illinois International Port District website to note Containerized Facilities, Storage Facilities, Highways Serving Port and Railways Serving Port (http://iipd.com/operations/services.htm).
36. Forwarders.com maintains the data for number of Freight Forwarders Serving Area.
37. Open Directory of Freight Forwarding Services for Illinois (http://www.forwarders.com/StateDirectory/IL.html).
38. Look for the Chicago service providers in the webpage from step 37 for number of Freight Forwarders Serving Area.
39. Chicago Customs Brokers and Forwarders Association maintains the number of Import/Export Brokers Serving Area.
40. Open Chicago Customs Brokers and Forwarders Association website (http://www.ccbfa.org/).
41. Note the number of members in the webpage opened in step 40 for the number of Import/Export Brokers Serving Area.
42. Danex Marketing & Business Resources maintains a list of international courier services.
43. Open Danex Marketing & Business Resources website (http://www.danex-exm.dk/courier-delivery-services.htm).
44. Individually check each service provider if they have a service in Chicago for the number of International Courier Firms Serving Area.
Foreign Trade Zones in Area

45
A Guide to IEDC Site Selection Data Standards
45. Enforcement and Compliance maintains the information about Foreign Trade Zones.
46. Open Illinois Foreign Trade Zones on Enforcement and Compliance webpage (http://enforcement.trade.gov/ftzpage/letters/ftzlist-map.html#illinois).
47. Fulton County, IL has no Foreign Trade Zones.
Custom Port of Entry in the Area
48. US Customs and Border Protection maintains information about Custom Port of Entry.
49. Peoria is the Custom Port of Entry for Fulton County, IL.
50. Open Peoria Port Information on US Customs and Border Protection page (http://www.cbp.gov/contact/ports/peoria).
51. The webpage opened in step 50 contains information about Site Location (City & Street Address) and indicate it at a Port, Airport, FTZ, Bridge, etc.
Warehouses
52. Leonard’s Guide maintains information about bonded warehouses.
53. Open Illinois Warehouse Companies on Leonard’s Guide page (http://www.leonardsguide.com/lgo/warehouse-companies/illinois.shtml).
54. Individually check each company if they are in Fulton County, IL or not for the number of Bonded Warehouses in the Area.
55. Public warehouses can be searched in the existing businesses in the county for the NAICS code 493110.
56. A list of all businesses for Fulton County, IL (accessed on September 04, 2014 from ESRI Business Analyst) is provided with this guide. It has following information about businesses – address, phone number, NAICS code and number of employees. Look for an Excel file with the name “Fulton County IL Businesses 2014” in the data provided with this guide. The data accompanying this guide is available on request from Spoon River Partnership for Economic Development (see Appendix 1 for contact information).
57. Search for NAICS code 493110 in the list of businesses from step 56.
Overnight Express Service Availability
58. Check the web pages of each service providers listed in IEDC table 14 to locate Overnight Express Service Availability.

46
A Guide to IEDC Site Selection Data Standards
a. FedEx, http://www.fedex.com/
b. UPS, http://www.ups.com/
c. Airborne, http://www.alpl.in/
d. DHL, http://www.dhl.com/en.html
e. United States Post Office, https://www.usps.com/
59. Fulton County does not have overnight express service availability for FedEx, UPS, Airborne and DHL.
60. Canton Post Office can be contacted for Nearest General Mail, Latest Pick-Up Time, Earliest Delivery, Next Day Delivery (specify States) and Nearest Bulk Mail Facility (see Appendix 1 for contact information).

47
A Guide to IEDC Site Selection Data Standards
Corporate Income Tax/Franchise Tax
1. Illinois Department of Revenue maintains State Wide Fix Rates under Tax Rate Database.
2. Open Tax Rate Database on Illinois Department of Revenue website (http://www.revenue.state.il.us/TaxRates/).
3. Go to Income Tax.
4. The webpage opened in step 3 contains information about state corporate income tax rate and the formula.
5. Illinois Department of Revenue can be contacted for information regarding Federal Taxes Deductible and Accelerated Depreciation Permitted (see Appendix 1 for contact information).
6. Fulton County, IL has no local corporate income tax.
Table 15Taxation

48
A Guide to IEDC Site Selection Data Standards
Personal Income Tax
7. Illinois Department of Revenue maintains State Wide Fix Rates under Tax Rate Database.
8. Open Tax Rate Database on Illinois Department of Revenue website (http://www.revenue.state.il.us/TaxRates/).
9. Go to Income Tax.
10. The webpage opened in step 9 contains information about state personal income tax rate.
11. Fulton County, IL has no local personal income tax.
Local Occupation Tax (Paid by Employee)
12. Illinois Department of Revenue maintains State Wide Fix Rates under Tax Rate Database.
13. Open Tax Rate Database on Illinois Department of Revenue website (http://www.revenue.state.il.us/TaxRates/).
14. Fulton County, IL has no Local Occupation Tax.
Local Wage Tax (Paid by Employer)
15. Illinois Department of Revenue maintains State Wide Fix Rates under Tax Rate Database.
16. Open Tax Rate Database on Illinois Department of Revenue website (http://www.revenue.state.il.us/TaxRates/).
17. Fulton County, IL has no Local Wage Tax.
Gross Receipts Tax Rate by Type of Business
18. Illinois Department of Revenue maintains State Wide Fix Rates under Tax Rate Database.
19. Open Tax Rate Database on Illinois Department of Revenue website (http://www.revenue.state.il.us/TaxRates/).
20. Fulton County, IL has no Gross Receipts Tax.
Sales/Use Tax Rate
21. Illinois Department of Revenue maintains Sales/Use Tax Rate under Illinois Tax Rate Finder.
22. Open Illinois Tax Rate Finder on Illinois Department of Revenue website (https://www.revenue.state.il.us/app/trii/).
23. Search tax rates for Fulton County.
49
A Guide to IEDC Site Selection Data Standards
24. The webpage accessed in step 23 contains information about state, local and total sales taxes.
25. Illinois Department of Revenue maintains State Wide Fix Rates under Tax Rate Database.
26. Open Tax Rate Database on Illinois Department of Revenue website (http://www.revenue.state.il.us/TaxRates/).
27. Go to excise tax.
28. The webpage opened in step 27 contains information about Electric Power, Natural Gas and Fuel Oil.
29. Fulton County and city governments can be contacted for Water, Sewer and Hazardous Waste Disposal sales tax rates (see Appendix 1 for contact information).
Telephone
30. The webpage accessed in step 23 contains information about telecommunication tax.
Machinery & Equipment Subject to Sales/Use Tax
31. Illinois Department of Revenue can be contacted for Machinery & Equipment Subject to Sales/Use Tax (see Appendix 1 for contact information).
Intangible Property
32. Illinois Department of Revenue can be contacted for intangible property tax (see Appendix 1 for contact information).
33. Fulton County, IL has no intangible property tax.
Real Property Tax Rates for Jurisdictions Featuring
34. Illinois Department of Revenue maintains the data for Real Property Tax Rates.
35. Open 2012 Property Tax Statistics on Illinois Department of Revenue website (http://tax.illinois.gov/AboutIdor/TaxStats/PropertyTaxStats/2012/index.htm).
36. Download the XLS file with name Table 10 - Principal Aggregate Rates of County Seats and Cities with 10,000 or More in Population.
37. The file downloaded in step 36 contains Real Property Tax Rates for Canton and Lewistown.
38. The real property tax breakdown in IEDC table 15 does not match with the breakdown provided by Illinois Department of Revenue. Consolidate the tax categories in the table

50
A Guide to IEDC Site Selection Data Standards
downloaded in step 36 using following calculations –
a. For City Millage, note City.
b. For County Millage, note County.
c. For School Millage, add Elementary/unit, High school and Community college.
d. For Special District Millage, add all remaining categories.
39. Illinois Department of Revenue maintains the data for assessment ratios.
40. Open tax statistics on Illinois Department of Revenue website (http://tax.illinois.gov/aboutidor/taxstats/).
41. Download the pdf file for 2012 Table 1 - Assessment Ratios.
42. The file downloaded in step 41 contains the assessment ratio for Canton under Fulton County. For Lewistown, note the assessment ratio for all other places under Fulton County.
Personal Property Tax Rates per $100
43. Illinois Department of Revenue maintains State Wide Fix Rates under Tax Rate Database.
44. Open Tax Rate Database on Illinois Department of Revenue website (http://www.revenue.state.il.us/TaxRates/).
45. Fulton County, IL has no Personal Property Tax.
State Property Tax Effective Rate per $100
46. Illinois Department of Revenue maintains State Wide Fix Rates under Tax Rate Database.
47. Open Tax Rate Database on Illinois Department of Revenue website (http://www.revenue.state.il.us/TaxRates/).
48. Fulton County, IL has no State Property Tax.
Property Tax After Core Income Tax
49. Illinois Department of Revenue maintains State Wide Fix Rates under Tax Rate Database.
50. Open Tax Rate Database on Illinois Department of Revenue website (http://www.revenue.state.il.us/TaxRates/).
51. Fulton County, IL has no Property Tax after Core Income Tax.

51
A Guide to IEDC Site Selection Data Standards
Property Tax After Core Income Tax & State Excise Tax
52. Illinois Department of Revenue maintains State Wide Fix Rates under Tax Rate Database.
53. Open Tax Rate Database on Illinois Department of Revenue website (http://www.revenue.state.il.us/TaxRates/)
54. Fulton County, IL has no Property Tax after Core Income Tax & State Excise Tax.
Subject to Personal Property Tax
55. Illinois Department of Revenue maintains State Wide Fix Rates under Tax Rate Database.
56. Open Tax Rate Database on Illinois Department of Revenue website (http://www.revenue.state.il.us/TaxRates/).
57. Fulton County, IL has no Subject to Personal Property Tax.

52
A Guide to IEDC Site Selection Data Standards
Business Parks
1. Fulton County Planning and Zoning Department can be contacted for the information about total acreage and available acreage.
Average Cost Per Acre for Fully Developed Sites
2. Peoria Area Association of Realtors maintains the information about office and industrial properties for sale.
3. Open Peoria Area Commercial Real Estate Property Search on Peoria Area Association of Realtors website (http://www.paarealtors.com/search/commercial_search.asp).
4. Select Warehouse/Industrial as property type.
5. Select Fulton County under search by city or county.
Table 16Occupancy/Supply

53
A Guide to IEDC Site Selection Data Standards
6. Select for sale under For Sale/For Lease Option and search properties.
7. Calculate the sales price per acre for all industrial properties listed for sale.
8. The average of the sales prices calculated in step 6 will be the Average Cost per Acre for Fully Developed Sites for industrial.
9. Fulton County has no Warehouse/Industrial suburban sites.
10. Open Peoria Area Commercial Real Estate Property Search on Peoria Area Association of Realtors website (http://www.paarealtors.com/search/commercial_search.asp).
11. Select office as property type.
12. Select Fulton County under search by city or county.
13. Select for sale under For Sale/For Lease Option and search properties.
14. Calculate the sales price per acre for all office properties listed for sale.
15. The average of the sales prices calculated in step 14 will be the Average Cost per Acre for Fully Developed Sites for office.
16. Fulton County has no suburban office sites.
Average Asking Rents (Gross Rent per Square Foot)
17. Local real estate agents and businesses can be contacted for the rent information (see Appendix 1 for contact information).
18. The real estate agents in Fulton County do not categorize offices in A, B and C classes and the county has no suburban development. In this case, the value for City (non CBD) will be the total weighted average.
Vacancy Rates %
19. Local real estate agents can be contacted for the vacancy information (see Appendix 1 for contact information).
20. The real estate agents in Fulton County do not categorize offices in A, B and C classes and the county has no suburban development. In this case, the value for City (non CBD) will be the total weighted average.
Name of Buildings Available By Size of Range (in Square Feet)
21. Peoria Area Association of Realtors maintains the information about available office, warehouse and industrial buildings.

54
A Guide to IEDC Site Selection Data Standards
22. Open Peoria Area Commercial Real Estate Property Search on Peoria Area Association of Realtors website (http://www.paarealtors.com/search/commercial_search.asp).
23. Select Warehouse/Industrial as property type.
24. Select Fulton County under search by city or county.
25. Select for sale under For Sale / For Lease Option and search properties.
26. Note the number of available buildings, their type, size and location.
27. Fulton County has no suburban Warehouse/Industrial sites.
28. Open Peoria Area Commercial Real Estate Property Search on Peoria Area Association of Realtors website (http://www.paarealtors.com/search/commercial_search.asp).
29. Select office as property type.
30. Select Fulton County under search by city or county.
31. Select for sale under For Sale / For Lease Option and search properties.
32. Note the number of available buildings, their type, size and location.
33. Fulton County has no suburban office sites.
Average Length of Time for Local Permit Approvals
34. The planning and zoning department at City of Canton can be inquired about the Average Length of Time for Local Permit Approvals, Certificate Occupancy, Building Permit and Environmental approvals for office and industrial (see Appendix 1 for contact information).
35. The information about City of Canton can be used as a proxy for Fulton County, IL.

55
A Guide to IEDC Site Selection Data Standards
Water and Sewer
1. Water and sewer departments of Canton, Farmington and Lewistown can be contacted for information about water availability; water treatment and sewer treatment (see Appendix 1 for contact information).
Electric Power
2. Ameren Illinois and Spoon River Cooperative can be contacted for information about Electric Power (see Appendix 1 for contact information).
Natural Gas
3. Ameren Illinois can be contacted for information about Natural Gas (see Appendix 1 for contact information).
Table 17Utilities

56
A Guide to IEDC Site Selection Data Standards
Telecommunication
4. Fulton County website provides information about Local Service Providers and Long Distance Service Providers (http://www.fultonco.org/economic-development/utilities/).
5. AT&T can be contacted for other Telecommunication information (see Appendix 1 for contact information).
Points of Presence (POPs) of Long Distance Carriers
6. AT&T can be contacted for Points of Presence (POPs) of Long Distance Carriers (see Appendix 1 for contact information).
Business Support Services (#)
7. A list of all businesses for Fulton County, IL (accessed on September 04, 2014 from ESRI Business Analyst) is provided with this guide. It has following information about businesses – address, phone number, NAICS code and number of employees. Look for an Excel file with the name “Fulton County IL Businesses 2014” in the data provided with this guide. The data accompanying this guide is available on request from Spoon River Partnership for Economic Development (see Appendix 1 for contact information).
8. Note the number of businesses with following NAICS codes in the table mentioned in step 7-
a. For Tool & Die, look for 332216, 333243, 333511, 333514 and 333515.
b. For Machine Shop, look for 332710, 333517 and 335210.
c. For Welding, look for 238190, 325998, 331491, 332313, 333514, 333517, 333992, 335311, 335312, 423830, 423840, 424690, 532412 and 811310.
d. For Office Equipment Service & Repair, look for 811212.
e. For Temporary Employment Services, look for 561320.
United States Post Office (Including Performance Ratings)
9. Canton Post Office can be contacted for information regarding post office (see Appendix 1 for contact information).
57
A Guide to IEDC Site Selection Data Standards
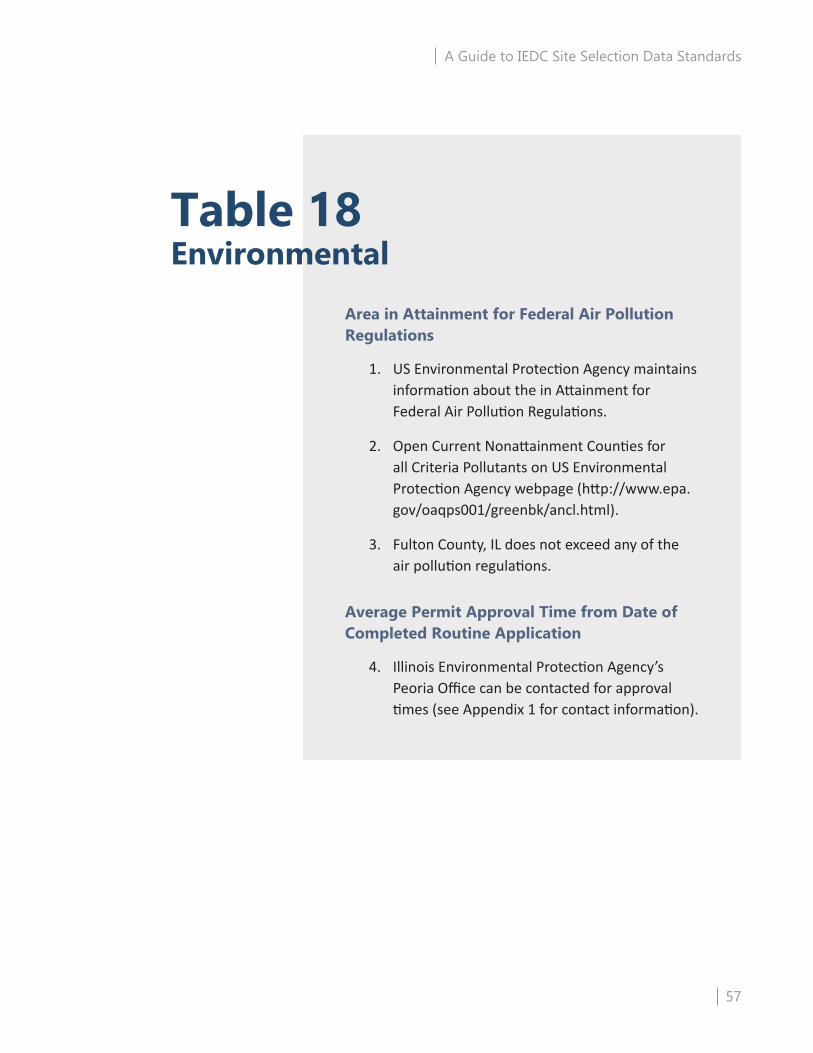
Area in Attainment for Federal Air Pollution Regulations
1. US Environmental Protection Agency maintains information about the in Attainment for Federal Air Pollution Regulations.
2. Open Current Nonattainment Counties for all Criteria Pollutants on US Environmental Protection Agency webpage (http://www.epa.gov/oaqps001/greenbk/ancl.html).
3. Fulton County, IL does not exceed any of the air pollution regulations.
Average Permit Approval Time from Date of Completed Routine Application
4. Illinois Environmental Protection Agency’s Peoria Office can be contacted for approval times (see Appendix 1 for contact information).
Table 18Environmental

58
A Guide to IEDC Site Selection Data Standards
5. Illinois Environmental Protection Agency maintains information about Hazardous Waste Disposal Sites and Licensed Hazardous Waste Haulers Serving the Area.
6. Open Hazardous Waste Disposal Sites on Illinois Environmental Protection Agency website (http://www.epa.state.il.us/land/waste-mgmt/haz-waste-sites.html).
7. The webpage opened in step 6 contains information about Name of Site, City and Class.
8. Google maps can be used to calculate distance of the sites from step 7 (https://www.google.com/maps/).
9. Open Licensed Hazardous Waste Haulers Serving the Area on Illinois Environmental Protection Agency website (http://www.epa.state.il.us/land/regulatory-programs/transportation-permits/county-order.pdf).
10. Count the number of Hazardous Waste Haulers serving Fulton County in the pdf opened in step 9.
Landfill Location(s)
11. Illinois Environmental Protection Agency maintains information about Landfill Location sites.
12. Open Illinois Landfill Projections on Illinois Environmental Protection Agency website (http://www.epa.state.il.us/land/landfill-capacity/2013/landfill-capacity-report-2014.pdf).
13. The webpage opened in step 12 contains information about Landfill Location (s), Capacity Left at Current Site(s) and Plans for New Capacity. Look in the details of Region 3 (Peoria region).
14. Illinois Environmental Protection Agency’s Peoria office can be contacted for further information about air quality, water quality or hazardous waste (see Appendix 1 for contact information).

59
A Guide to IEDC Site Selection Data Standards
1. City and County Governments can be contacted to inquire about City Government, County Government, State Government, Governor, US Government Representation, US Congresspersons Serving the Area and US Senators Serving Area (see Appendix 1 for contact information).
2. Additionally, Fulton County website maintains the list of elected officials for the County (http://www.fultonco.org/officials/elected/).
Table 19Government

60
A Guide to IEDC Site Selection Data Standards
1. City and County Governments can be contacted to inquire about international resources in Fulton County, IL (see Appendix 1 for contact information).
2. Fulton County has no international companies, international business associations, foreign institutions, international schools, international airport and international college education.
3. Fulton County website has the information about the International Courier Services in the Area (http://www.fultonco.org/economic-development/transportation/).
4. US Census Bureau maintains the data for People Fluent in a Second Language.
Table 20International Resources
61
A Guide to IEDC Site Selection Data Standards
5. Open American FactFinder (factfinder2.census.gov) and go to Advance Search.
6. Select Fulton County, IL as geography type and add this to your selection.
7. Type DP02: Selected Social Characteristics in the United States in topic or table name to access 2012 data for language spoken at home.
8. Select and open the table with 2012 ACS 5-year estimates as dataset.
9. Download the table in Microsoft Excel (.xls) format.
10. The table downloaded in step 9 contains number of people speaking Spanish, Other Indo-European languages and Asian and Pacific Islander languages. The number of people speaking Other Indo-European languages can be used as a proxy for French and German. The number of people speaking Asian and Pacific Islander languages can be used as a proxy for Chinese and Japanese.
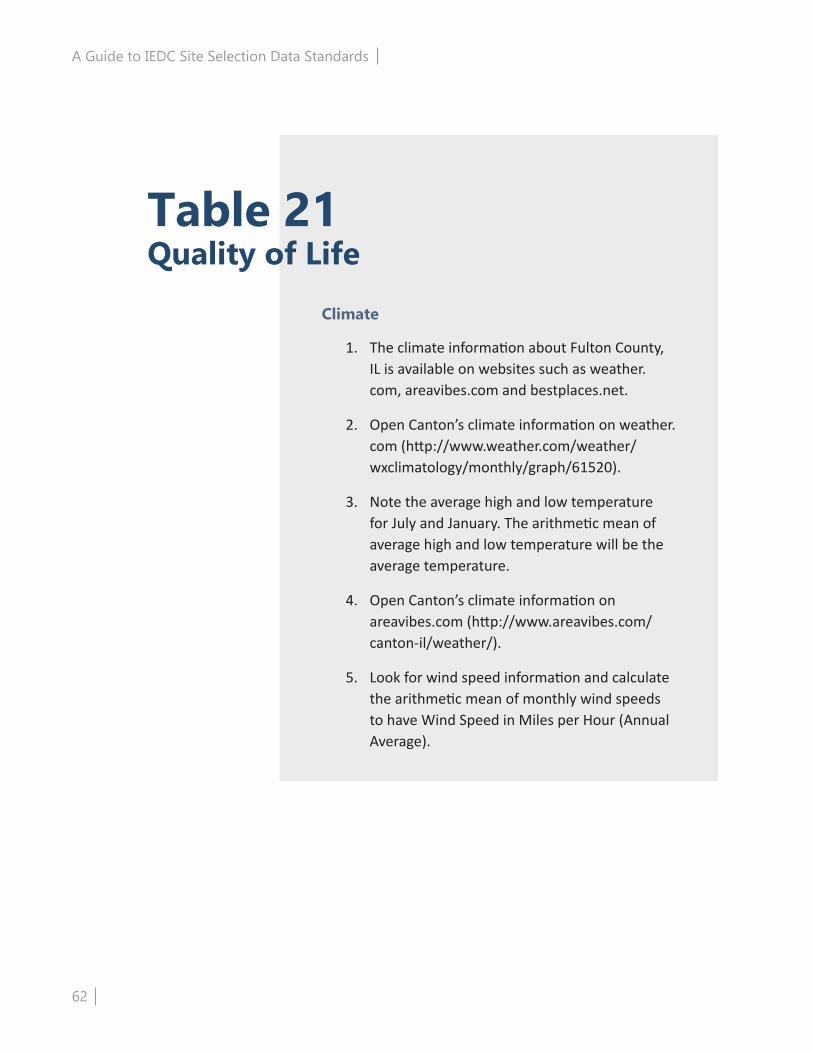
62
A Guide to IEDC Site Selection Data Standards
Climate
1. The climate information about Fulton County, IL is available on websites such as weather.com, areavibes.com and bestplaces.net.
2. Open Canton’s climate information on weather.com (http://www.weather.com/weather/wxclimatology/monthly/graph/61520).
3. Note the average high and low temperature for July and January. The arithmetic mean of average high and low temperature will be the average temperature.
4. Open Canton’s climate information on areavibes.com (http://www.areavibes.com/canton-il/weather/).
5. Look for wind speed information and calculate the arithmetic mean of monthly wind speeds to have Wind Speed in Miles per Hour (Annual Average).
Table 21Quality of Life

63
A Guide to IEDC Site Selection Data Standards
6. Open Canton’s climate information on bestplaces.net. (http://www.bestplaces.net/climate/county/illinois/fulton)
7. Note the Rainfall in Inches, Snowfall in Inches, Number of Days Sunny or Partly Sunny and average elevation.
8. On the webpage opened in step 7, search for the elevation of cities in Fulton County to get a range of elevations in the county. The Website of Futon County provides the list of communities in the county (http://www.fultonco.org/live-here/experience-communities/).
Personal Income Tax (RATE in Ranges)
9. Illinois Department of Revenue maintains State Wide Fix Rates under Tax Rate Database.
10. Open Tax Rate Database on Illinois Department of Revenue website (http://www.revenue.state.il.us/TaxRates/).
11. Go to Income Tax.
12. The webpage opened in step 11 contains information about state personal income tax rate.
13. Fulton County, IL has no local personal income tax.
Local Occupation Tax
14. Illinois Department of Revenue maintains State Wide Fix Rates under Tax Rate Database.
15. Open Tax Rate Database on Illinois Department of Revenue website (http://www.revenue.state.il.us/TaxRates/).
16. Fulton County, IL has no Local Occupation Tax.
Sales Tax
17. Illinois Department of Revenue maintains can be contacted for major sales tax exemptions (see Appendix 1 for contact information).
18. Illinois Department of Revenue maintains Sales/Use Tax Rate under Illinois Tax Rate Finder.
19. Open Illinois Tax Rate Finder on Illinois Department of Revenue website (https://www.revenue.state.il.us/app/trii/).
20. Search tax rates for Fulton County.
21. The webpage accessed in step 20 contains information about state, local and total sales taxes.

64
A Guide to IEDC Site Selection Data Standards
Housing
22. Peoria Area Association of Realtors maintains information about housing.
23. Open Residential Real Estate Home Search on Peoria Area Association of Realtors website (http://www.paarealtors.com/search/index.asp).
24. Clear all filters and select Fulton County communities one by one to access information about houses for sale. The Website of Futon County provides the list of communities in the county (http://www.fultonco.org/live-here/experience-communities/).
25. Open Microsoft Excel and prepare the table with columns: City, House type (Single family, Condo etc.), Address, Area in sqft, Number of bedrooms, Number of bathrooms, price and MLS number.
26. Use the table prepared in step 25 to extract information about Number of Homes on the Market, Average Selling Prices and Number of Single Family Homes for Sale by Price.
27. The real estate agents in the county can be contacted to know about Rentals and Apartment Vacancy rates (see Appendix 1 for contact information).
Education
28. Illinois State Board of Education maintains the data for school districts and school enrollment.
29. Open Data Analysis and Accountability on Illinois State Board of Education webpage (http://www.isbe.net/research/htmls/fall_housing.htm).
30. Look for District Summary under 2013-14 Students Housed by Serving School and download the excel file.
31. For Number of School Districts, count the number of Fulton County school districts in the table downloaded in step 30.
32. Add the number of Pre-K to 8th grade students for Canton Union School District 66 in the table downloaded in step 30 for Elementary School Enrollment. Add the number of 9th grade to 12th grade students for Canton Union School District 66 in the table downloaded in step 30 for Secondary School Enrollment.
33. Illinois State Board of Education maintains the information about spending per student.
34. Open Illinois Report Card 2013-2014 provided by Illinois State Board of Education (http://illinoisreportcard.com/District.aspx?source=Profile&Districtid=22029066025).
35. Note the value of Instructional spending for instructional spending per student.

65
A Guide to IEDC Site Selection Data Standards
36. Add the value of instructional spending and operational spending from the webpage opened in step 34 to calculate total spending per student.
37. Teachersalaryinfo.com can be used to calculate student teacher ratios.
a. Open Canton School District information on teachersalaryinfo.com (http://www.teachersalaryinfo.com/illinois/teacher-salary-in-canton-union-school-district-66/).
b. Note the number of total teachers and elementary school teachers.
c. Subtract the number of elementary school teachers from the total to calculate number of secondary school teachers.
d. Use the elementary school enrollment from step 32 and the number of elementary school teachers to calculate student teacher ratio for elementary School.
e. Use the secondary school enrollment from step 32 and the number of secondary school teachers to calculate student teacher ratio for secondary School.
38. Illinois State Board of Education maintains the information about 7th Grade Standard Achievement Test Results.
39. Open Illinois Report Card 2013-2014 provided by Illinois State Board of Education (http://illinoisreportcard.com/District.aspx?source=Trends&source2=ISAT&Districtid=22029066025).
40. Note ISAT test results for Canton School Districts as 7th Grade Standard Achievement Test Results.
41. Canton School District can be contacted for ACT, SAT, Merit Scholarships, High schools seniors attending college, Mandatory Competency Testing for High School Graduation, Science & Technology Magnet, Specialized High Schools, Tech Prep Programs, Occupational Clusters or Career Pathways, Vocational high Schools, Private Schools, number of schools and Average Annual Tuition (see Appendix 1 for contact information).
42. Note elementary and secondary school enrollments from step 32.
Higher Education (Provide for Each Institution)
43. County and city governments can be inquired to locate four year institutions and community colleges (see Appendix 1 for contact information).
44. Fulton County, IL has no four year institution.
45. Spoon River College is the community college in Fulton County. Note the address from the college website (www.src.edu/).
46. Spoon River College can be contacted for full time enrollment and Annual Degrees

66
A Guide to IEDC Site Selection Data Standards
Conferred (see Appendix 1 for contact information).
Health Care
47. County and city governments can be inquired to locate hospitals (see Appendix 1 for contact information) .
48. Graham Hospital is located in Fulton County, IL
49. US News maintains information about Graham Hospital.
50. Open Graham Hospital on US News website (http://health.usnews.com/best-hospitals/area/il/graham-hospital-6430320/details).
51. Note the number of beds and number of physicians and dentists.
52. Divide the number of physicians and dentists from step 51 with population of the county (~36,000) to estimate Ratio per 1,000 Population.
53. Fulton County website maintains information about clinics (http://www.fultonco.org/live-here/clinics-medical-groups/).
54. US Department of Justice maintains the information about crime. This data is not available for Fulton County so the information about Canton can be used as a proxy for the county.
55. Open Uniform Crime Reporting Statistics on US Department of Justice website (http://www.ucrdatatool.gov/Search/Crime/Local/JurisbyJuris.cfm).
56. Select Illinois as State.
57. Select Cities from 10,000 thru 24,999 as population group.
58. Select Canton Police Department as agency.
59. Select Property Crime Rate and Violent Crime Rate as variable groups.
60. The resulting table contains information about Crime Rate per 100,000 Inhabitants.
61. Mallseeker.com maintains information about enclosed malls.
62. Open Shopping Malls in Illinois at mallseekers.com (http://www.mallseeker.com/state.aspx?sid=15&mt=0).
63. Fulton County has no enclosed malls.
64. City-data.com maintains information about religious institutions.
65. Open Fulton County religious profile at city-data.com (http://www.city-data.com/county/religion/Fulton-County-IL.html).

67
A Guide to IEDC Site Selection Data Standards
66. Note the number of Protestant, Catholic, Synagogues and Other religious institutions.
Sports
67. 50states.com maintains the list of professional teams.
68. Open Illinois professional teams in 50states.com (http://www.50states.com/sports/illinois.htm#.VFsFHvnF-Sp).
69. Fulton County, IL has no professional teams.
Culture
70. Fulton County Tourism website maintains the list of events with dates (http://www.fultoncountytourism.org/calendar.htm).
71. Illinois Association of Museums maintains information about museums.
72. Open Illinois Association of Museums website (http://www.illinoismuseums.org/museums/).
73. Select Fulton as County for museum information.
74. Illinois Dance Studios maintains information about dance companies.
75. Open Illinois Dance Studios website (http://www.dancelessons.net/dancestudios/page312.html).
76. Look for dance studios in Fulton County communities. The Website of Futon County provides the list of communities in the county (http://www.fultonco.org/live-here/experience-communities/).
77. Fulton County has no dance companies.
78. Illinois Council of Orchestras maintains information about Symphony Orchestras.
79. Open directory at Illinois Council of Orchestras webpage (http://www.ilcouncilorchestras.org/directory.php).
80. Look for Symphony Orchestras in Fulton County communities. The Website of Futon County provides the list of communities in the county (http://www.fultonco.org/live-here/experience-communities/).
81. Fulton County has no Symphony Orchestras.
82. Stanford.edu maintains a list of opera companies (http://opera.stanford.edu/companies.html).
83. Look for opera companies in Fulton County communities. The Website of Futon County

68
A Guide to IEDC Site Selection Data Standards
provides the list of communities in the county (http://www.fultonco.org/live-here/experience-communities/).
84. Fulton County has no opera companies.
85. Illinois Theater Association maintains a list of theater companies (http://www.illinoistheatre.org/MemberDirectory/tabid/502/Default.aspx).
86. Look for theater companies in Fulton County communities. The Website of Futon County provides the list of communities in the county (http://www.fultonco.org/live-here/experience-communities/).
87. Fulton County has no theater companies.
88. Fulton County Tourism website maintains a list of recreational sites (http://www.fultoncountytourism.org/attractionsmap.htm).

69
A Guide to IEDC Site Selection Data Standards
This contact information was put together on November 25, 2014. Please contact Spoon River Partnership for Economic Development if any of these contacts does not work.
Appendix 1Contact Information for Data Sources
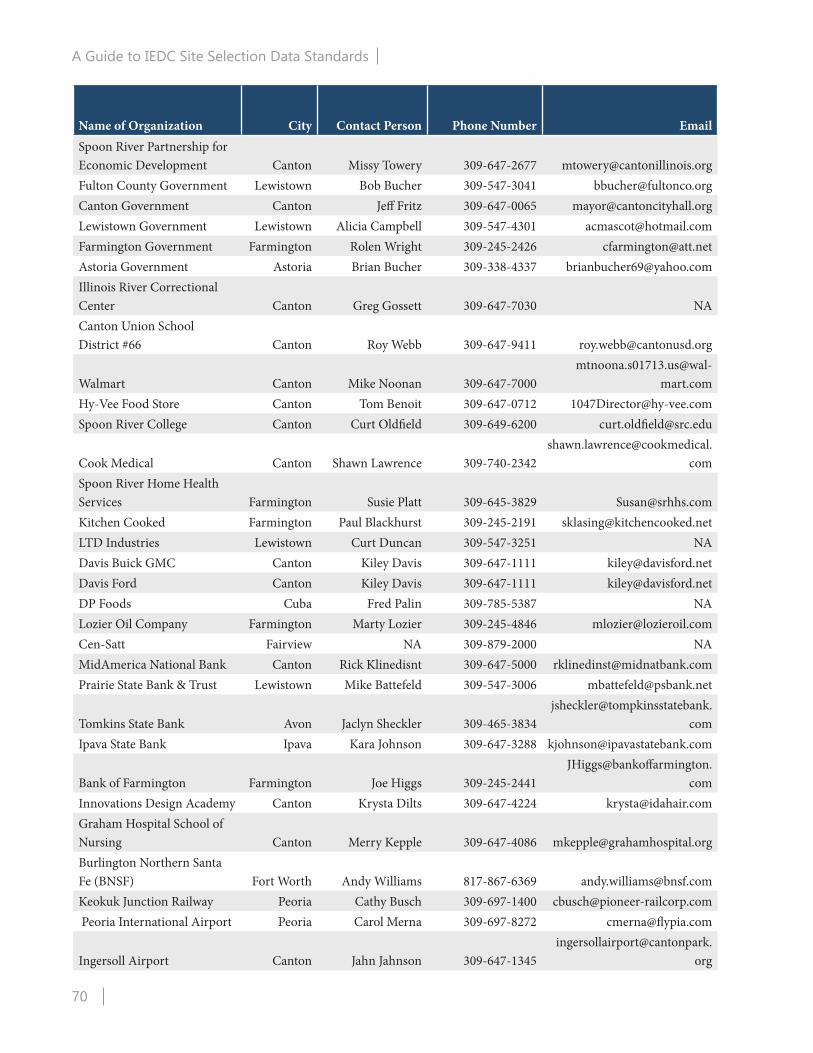
70
A Guide to IEDC Site Selection Data Standards
Name of Organization City Contact Person Phone Number EmailSpoon River Partnership for Economic Development Canton Missy Towery 309-647-2677 [email protected] County Government Lewistown Bob Bucher 309-547-3041 [email protected] Government Canton Jeff Fritz 309-647-0065 [email protected] Government Lewistown Alicia Campbell 309-547-4301 [email protected] Government Farmington Rolen Wright 309-245-2426 [email protected] Government Astoria Brian Bucher 309-338-4337 [email protected] River Correctional Center Canton Greg Gossett 309-647-7030 NACanton Union School District #66 Canton Roy Webb 309-647-9411 [email protected]
Walmart Canton Mike Noonan 309-647-7000mtnoona.s01713.us@wal-
mart.comHy-Vee Food Store Canton Tom Benoit 309-647-0712 [email protected] River College Canton Curt Oldfield 309-649-6200 [email protected]
Cook Medical Canton Shawn Lawrence 309-740-2342shawn.lawrence@cookmedical.
comSpoon River Home Health Services Farmington Susie Platt 309-645-3829 [email protected] Cooked Farmington Paul Blackhurst 309-245-2191 [email protected] Industries Lewistown Curt Duncan 309-547-3251 NADavis Buick GMC Canton Kiley Davis 309-647-1111 [email protected] Ford Canton Kiley Davis 309-647-1111 [email protected] Foods Cuba Fred Palin 309-785-5387 NALozier Oil Company Farmington Marty Lozier 309-245-4846 [email protected] Fairview NA 309-879-2000 NAMidAmerica National Bank Canton Rick Klinedisnt 309-647-5000 [email protected] State Bank & Trust Lewistown Mike Battefeld 309-547-3006 [email protected]
Tomkins State Bank Avon Jaclyn Sheckler 309-465-3834jsheckler@tompkinsstatebank.
comIpava State Bank Ipava Kara Johnson 309-647-3288 [email protected]
Bank of Farmington Farmington Joe Higgs 309-245-2441JHiggs@bankoffarmington.
comInnovations Design Academy Canton Krysta Dilts 309-647-4224 [email protected] Hospital School of Nursing Canton Merry Kepple 309-647-4086 [email protected] Northern Santa Fe (BNSF) Fort Worth Andy Williams 817-867-6369 [email protected] Junction Railway Peoria Cathy Busch 309-697-1400 [email protected] Peoria International Airport Peoria Carol Merna 309-697-8272 [email protected]
Ingersoll Airport Canton Jahn Jahnson 309-647-1345ingersollairport@cantonpark.
org

71
A Guide to IEDC Site Selection Data Standards
Name of Organization City Contact Person Phone Number EmailCanton Post Office Canton NA 309-647-0309 NAIllinois Department of Revenue Chicago NA 217-782-3336 NAFulton County Zoning Department Lewistown Janice Emmons 309-547-3041 [email protected]]Gorsuch-Hensley Real Estate & Auctio Canton Doug Hensley 309-647-8811 [email protected] Maloof Realty Canton Jim Maloof Realty 309-647-1502 [email protected] Planning and Zoning department Canton John Kunski 309-649-5338 [email protected] Environmental Protection Agency Peoria NA 309-671-3022 NACanton Water Department Canton Greg Pollitt 309-647-0288 [email protected] Wastewater Department Canton Joseph Carruthers 309-647-1391 [email protected] Water/Wastewater Department Lewistown Amanda 309-547-4306 [email protected] Illinois Peoria NA 800.755.5000 NASpoon River Cooperative Canton Taryn Martin 309-647-2700 [email protected]&T Peoria Ellie Lee 309-689-6600 [email protected]


2015 2020 2025 2030 2035
Under - 17 8,414 7,686 7,999 8,071 8,088 8,166 8,211
18 - 34 8,300 7,651 8,620 8,694 8,615 8,629 8,627
35 - 54 10,784 10,113 10,450 10,166 10,289 10,478 10,398
55 - 74 7,068 8,250 8,890 9,754 9,908 9,668 10,177
75 - Older 3,684 3,289 2,863 2,936 3,293 4,005 4,220
Under - 17 22.0% 20.8% 20.6% 20.4% 20.1% 19.9% 19.7%
18 - 34 21.7% 20.7% 22.2% 21.9% 21.4% 21.1% 20.7%
35 - 54 28.2% 27.3% 26.9% 25.7% 25.6% 25.6% 25.0%
55 - 74 18.5% 22.3% 22.9% 24.6% 24.7% 23.6% 24.4%
75 - Older 9.6% 8.9% 7.4% 7.4% 8.2% 9.8% 10.1%
Median Age (years) 39.2 42.3
Number 14,915 14,665
Median Household Income $33,952 $43,363
Under - $35,000 7,704 5,872
$35,001 - $50,000 2,712 2,551
$50,001 - $75,000 2,713 3,121
$75,001 - Above 1,786 3,121
2013 2012 2011 2010 2009
-206 -162 5 18 -41
Workforce Education Attainment (25 - 64 Years of Age) Percentage %Under - 12 Years
12 - 15 Years
12 Years Only
Some College
Associate Degrees
Subtotal
Household Income Distribution
College Graduates
NA
85.6%
% Distribution by Age Group
Population by Age Group
NA
NA
Table 1: Demographic CharacteristicsFulton County, IL
Households
Net Migration Last Five Years Available
Five Year Projections20122000Population
14.9%
24.2%
37.5%
24.2%
9.0%

16 Years - More
16 Years Only
Total
Sources:
US Census Bureau, 2000 SF1 100% data , Table P012, Table DP-1, Table QT-P10, accessed via American FactFinder, October 18, 2014.
US Census Bureau, 2000 SF3 sample data , Table DP-3, accessed via American FactFinder, October 18, 2014.
US Census Bureau, 2008-2012 ACS 5-Year Estimate , Table B01001, Table B01002, Table S1101, Table B15002, accessed via American FactFinder,
October 18, 2014.
US Census Bureau, 2013 Population Estimates , Table PEPTCOMP, accessed via American FactFinder, October 18, 2014.
US Census Bureau, 2012 Population Estimates , Table PEPTCOMP, accessed via American FactFinder, October 18, 2014.
US Census Bureau, 2011 Population Estimate s, Table PEPTCOMP, accessed via American FactFinder, October 18, 2014.
Population Estimates. Accessed October 18, 2014. https://www.census.gov/popest/research/eval-estimates/eval-est2010.html.
"DCEO County Population Projections." State of Illinois Data Portal. Accessed October 18, 2014. https://data.illinois.gov/Economics/DCEO-County-
Population-Projections/h3bx-hbbh.
4.0%
10.4%
100.0%

Civilian Labor Force 2013 2012 2011 2010 2009
Unemployment Rate (for month & year use most
recent information available and seasonally
adjusted annual average)10.8 9.8 10.2 11.7 11.2
Non-Agricultural Employment Reported by Place
of Work
2012 2011 2001
5 Year
Projection
(2017)
2012 2011 2001
5 Year
Projection
(2017)
Mining 45 47 41 51 0.3% 0.4% 0.3% 0.4%
Construction 766 767 697 795 5.8% 5.8% 5.1% 6.0%
Manufacturing 350 300 269 386 2.6% 2.3% 2.0% 2.9%
Transportation & Public Utilities 354 357 486 268 2.7% 2.7% 3.6% 2.0%
Wholesale Trade 362 363 359 356 2.7% 2.7% 2.6% 2.7%
Retail Trade 1,659 1,720 2,013 1,502 12.5% 12.9% 14.8% 11.4%
Finance, Insurance & Real Estate 1,024 984 869 1,069 7.7% 7.4% 6.4% 8.1%
Service 4,825 4,925 4,485 5,191 36.5% 37.0% 33.1% 39.3%
Government 2,680 2,734 2,756 2,656 20.3% 20.5% 20.3% 20.1%
Total 12,330 12,419 12,309 12,476 93.2% 93.2% 90.7% 94.4%
Resident Employment Reported by Group
Occupation2012 2000
Management, business, science, and arts
occupations4,429 4,446
Service occupations 2,918 2,924
Sales and office occupations 3,400 3,688
Natural resources, construction, and
maintenance occupations1,697 1,912
Production, transportation, and material
moving occupations3,837 3,167
Employed Residents Working in 2012 Number
(#)
Percent (%)
Outside the County of Residence 6,548 43.7%
Commute Times Number
(#)
Percent (%)
Total Number Employed % of Total Employed Persons
Table 2: Labor Force CharacteristicsFulton County, IL
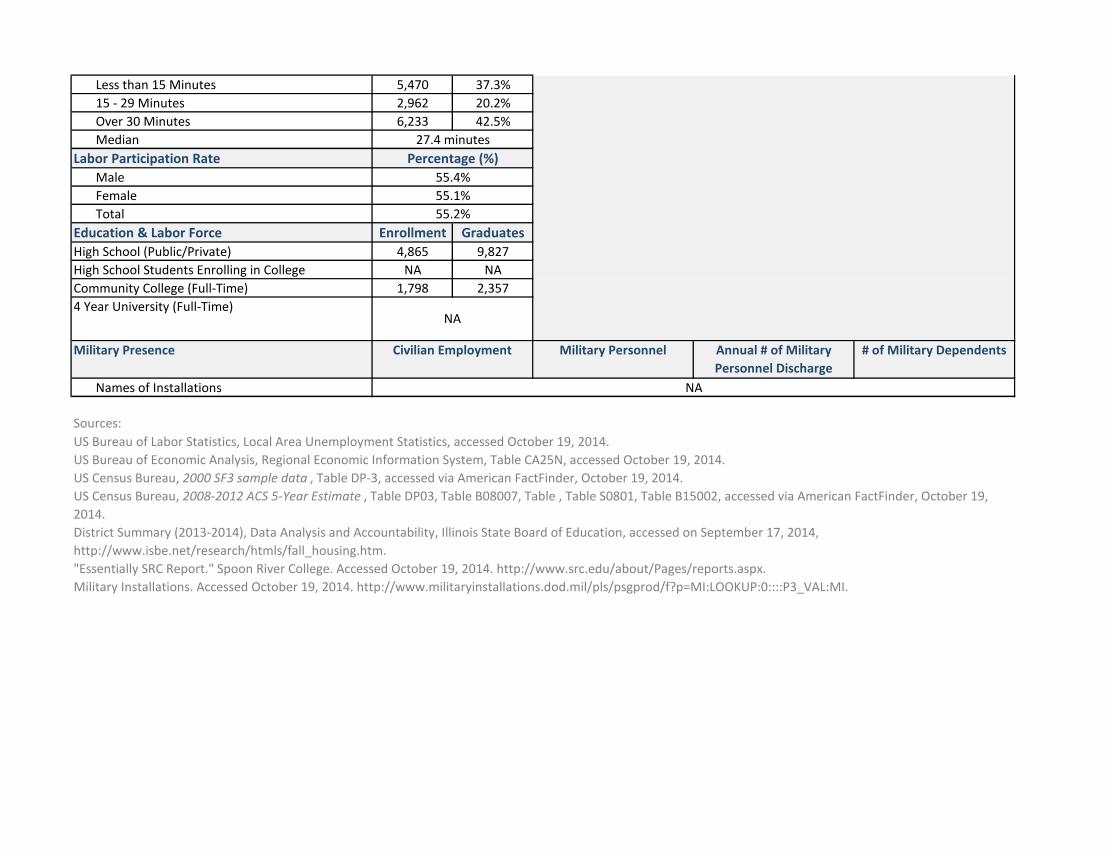
Less than 15 Minutes 5,470 37.3%
15 - 29 Minutes 2,962 20.2%
Over 30 Minutes 6,233 42.5%
Median
Labor Participation Rate
Male
Female
Total
Education & Labor Force Enrollment Graduates
High School (Public/Private) 4,865 9,827
High School Students Enrolling in College NA NA
Community College (Full-Time) 1,798 2,357
4 Year University (Full-Time)
Military Presence
Names of Installations
Sources:
NA
NA
US Bureau of Labor Statistics, Local Area Unemployment Statistics, accessed October 19, 2014.
US Bureau of Economic Analysis, Regional Economic Information System, Table CA25N, accessed October 19, 2014.
US Census Bureau, 2000 SF3 sample data , Table DP-3, accessed via American FactFinder, October 19, 2014.
US Census Bureau, 2008-2012 ACS 5-Year Estimate , Table DP03, Table B08007, Table , Table S0801, Table B15002, accessed via American FactFinder, October 19,
2014.
District Summary (2013-2014), Data Analysis and Accountability, Illinois State Board of Education, accessed on September 17, 2014,
http://www.isbe.net/research/htmls/fall_housing.htm.
"Essentially SRC Report." Spoon River College. Accessed October 19, 2014. http://www.src.edu/about/Pages/reports.aspx.
Military Installations. Accessed October 19, 2014. http://www.militaryinstallations.dod.mil/pls/psgprod/f?p=MI:LOOKUP:0::::P3_VAL:MI.
Percentage (%)
55.4%
55.1%
55.2%
Civilian Employment Military Personnel # of Military DependentsAnnual # of Military
Personnel Discharge
27.4 minutes

City County
Graham Health System Canton Fulton Hospital Headquarters 62 750 None NA
Canton Union School
District #66 Canton Fulton Public School Headquarters 61 345 CEA/IEA 94.2%
IL River Correctional
Center Canton Fulton
Correctional
Facility Headquarters 92 304 AFSME 97.0%
Fulton County Lewistown Fulton Government Headquarters 92 240 AFSCME 66.6%
Walmart Canton Fulton Retail Store Headquarters 44 160 None NA
HyVee Food Store Canton Fulton Retail Store Regional Office 44 150 None NA
Spoon River College Canton Fulton Public College Headquarters 61 140 IEA 46.4%
Cook Medical Canton Fulton
Medical
Manufacturing
Branch Manufacturing
Plant 33 130 None NA
City of Canton Canton Fulton Government Headquarters 92 127 AFSME/IAFF 68.5%
Spoon River Home Health
Care Services Farmington Fulton
Home Health Care
Services Headquarters 62 122 None NA
Cook Medical Canton Fulton
Medical
Manufacturing
Branch Manufacturing
Plant 33 130 None NA
Kitchen Cooked, Inc. Farmington Fulton
Snack Food
Manufacturing Headquarters 31 85 None NA
LTD Industries, Inc. Lewistown Fulton Machine Shop Headquarters 33 15 UAW 100.0%
Davis Buick GMC, Inc. Canton Fulton Car Dealers Headquarters 44 30 None NA
DP Foods Cuba Fulton Grocery Store Headquarters 44 33 None NA
Union
Affiliation
Distribution
% of # of
Union Workers
Manufacturing
All Sectors
Employment
NAICS
CodeProduct/Service
Table 3: Leading EmployersFulton County, IL
Sector Company Function
Location

Lozier Oil Company Inc. Farmington Fulton
Petroleum
Products Headquarters 42 25 None NA
Cen-Satt, Inc. Fairview Fulton Electronics Store Headquarters 44 25 None NA
Davis Ford, Inc. Canton Fulton Car Dealers Headquarters 44 25 None NA
MidAmerica National Bank Canton Fulton Bank Headquarters 52 70 None NA
Prairie State Bank & Trust Lewistown Fulton Bank Regional Office 52 70 None NA
Tompkins State Bank Avon Fulton Bank Regional Office 52 13 None NA
Ipava State Bank Ipava Fulton Bank Headquarters 52 35 None NA
Bank of Farmington Farmington Fulton Bank Headquarters 52 30 None NA
NA NA NA NA NA NA NA NA NA
Sources:
ESRI Business Analyst Online. Accessed September 4, 2014. https://bao.arcgis.com/.
"Employment." Fulton County. Accessed September 4, 2014. http://www.fultonco.org/work-here/fulton-county-employment/.
"North American Industry Classification System." US Census Bureau. Accessed September 4, 2014. http://www.census.gov/cgi-bin/sssd/naics/naicsrch?chart=2012.
Phone interview of employers, conducted in October 2014.
Back Offices Across all Sector
FIRE

City County
Last Year NA NA NA NA NA NA NA NA NA
Two Years Ago NA NA NA NA NA NA NA NA NA
Three Years Ago NA NA NA NA NA NA NA NA NA
Last Year NA NA NA NA NA NA NA NA NA
Two Years Ago NA NA NA NA NA NA NA NA NA
Last Year NA NA NA NA NA NA NA NA NA
Two Years Ago NA NA NA NA NA NA NA NA NA
Sources:
Table 4: New/Expanding Companies Fulton County, IL
LocationCompanyType & Year Product/Service Function
NAICS
Code Year
50 or More Employees
New to the AreaEmployment Union Affiliation
Downsizing/Closing/Layoff
Expansions/New Facilities
ESRI Business Analyst Online. Accessed September 4, 2014. https://bao.arcgis.com/.
"Archived WARN Notices." Illinois Worknet Center. Accessed October 23, 2014. http://www2.illinoisworknet.com/LayoffRecovery/Pages/ArchivedWARNReports.aspx.
"Employment." Fulton County. Accessed September 4, 2014. http://www.fultonco.org/work-here/fulton-county-employment/.
"North American Industry Classification System." US Census Bureau. Accessed September 4, 2014. http://www.census.gov/cgi-bin/sssd/naics/naicsrch?chart=2012.
Phone interview of employers, conducted in October 2014.

City County
Occupation
Category #
NA NA NA NA NA NA NA NA NA NA
Sources:
Table 5: Military Base and InstallationsFulton County, IL
Base/
Installation
Branch of
Service
Description of
Operations
Location Total
Civilian
Personnel
Total
Military
Personal
Average # of
Retiring/Separating
Military Personnel Per year Status:
Closing or
Expanding
Military Installations. Accessed October 19, 2014. http://www.militaryinstallations.dod.mil/pls/psgprod/f?p=MI:LOOKUP:0::::P3_VAL:MI.

City County
R & D
Personnel
Total
Employees
NA NA NA NA NA NA NA NA
Sources:
Phone interview with City and County Governments and Spoon River College, conducted in October 2014.
Table 6: Research BaseFulton County, IL
Affiliation (e.g. Corporate,
Non-Profit, University,
Government, etc.)
Research
Specialty
Annual
Funding (If
Available)Name of Center
Location Employment

Under
Graduate Graduate
City County Full-Time Full-Time
Engineering
Math
Medical
Dental
Pharmaceutical
Veterinary
MIS/Comp. Sci.
Business
Chemistry
Biology/Animal &
Science Botany
Physics
Other
Sources:
Phone interview with City and County Governments and Spoon River College, conducted in October 2014.
NA NA NA NA NA NA
Part-
Time Program
Under
Graduate
NA NA NA NA NA
Total Annual GraduatesEnrollment
Table 7: Four Year InstitutionsFulton County, IL
Location
Graduate TotalName of Institution Total Full-Time

City County Total Full-Time Part-Time Program Number
% Going to a 4 Year
College/UniversityAssociate of Arts & Science 22
IAI Requirement Met 135
Health Information Management 12
Agri Business Management 5
Diesel & Power System Tech 16
Digital Design & Information 1
Natural Resources & Conservation 5
Associate Degree In Nursing 28
Associate In General Studies 28
EMT 1
Basic Commercial Driver Training 8
Commercial Driver Training Certificate 13
Emergency Medical Tech 16
Medical Assistant 7
Medical Coding Certificate 9
Medical Insurance/Billing 12
Medical Records 12
Medical Transcription 14
Nursing Assistant 49
Practical Nursing 14
Web Design 1
Early Childhood Education 1
Advanced Welding 6
Welding Operator Certificate 9
Sources:
Table 8: Community CollegesFulton County, IL
Name of Institution
Location Enrollment Annual Graduate Degrees
Phone interview with City and County Governments and Spoon River College, conducted in October 2014.
"Essentially SRC Report." Spoon River College. Accessed October 19, 2014. http://www.src.edu/about/Pages/reports.aspx.
65%Spoon River College Canton Fulton 1,798 720 1,078

City County Total Full-Time Part-Time Program Certificate Degree
Machine Trades NA NA
Electronic Tech. NA NA
Medical/Lab NA NA
Engineering NA NA
Programming/ NA NA
Computer Sci. NA NA
Printing NA NA
Graphic Arts NA NA
Plastics Tech. NA NA
Cust. Service NA NA
Office Science NA NAOther: Cosmetology
and Cosmetology
Instructor (1 year
program) NA 50
Machine Trades NA NA
Electronic Tech. NA NA
Medical/Lab: Diploma
in Nursing (3 year
program) NA 18
Engineering NA NA
Programming/ NA NA
Computer Sci. NA NA
Printing NA NA
Graphic Arts NA NA
Plastics Tech. NA NA
Cust. Service NA NA
Office Science NA NA
Other NA NA
Sources:
Location Enrollment Annual # of Graduates
Excluding Community Colleges
Graham Hospital School
of NursingCanton Fulton 82 82 0
Table 9: Vocational/Training Center ResourcesFulton County, IL
Name of Institution
05252FultonCantonInnovations Design
Academy

Phone interview with City and County Governments, Spoon River College, Graham Hospital School of Nursing and Innovations Design
Academy conducted in October 2014.
Innovations Design Academy. Accessed October 26, 2014. http://idahair.com/.
Graham Hospital School of Nursing. Accessed October 26, 2014. http://grahamschoolofnursing.org/.

Average Annual Salary by Major Industry Current Year Salary
Number of
Employees
Mining 2014 $43,350 4
Construction 2014 $2,318,423 242
Manufacturing 2014 $2,090,479 324
Transportation & Public Utilities 2014 $1,627,670 172
FIRE 2014 $4,014,452 432
Wholesale Trade 2014 $3,248,805 265
Retail Trade 2014 $6,425,997 1185
Services 2014 $20,147,406 2977
Government 2014 $19,086,688 2150
$59,003,270 7751
Sources:
Total Wages Paid Divided by Number of Employees
Total
Fulton County, IL
Table 10: Available Payroll Costs by Industry
$7,612
"Quarterly Census of Employment & Wages (QCEW)." Illinois Department of Economic Security. Accessed October
26, 2014. http://www.ides.illinois.gov/LMI/Pages/Quarterly_Census_of_Employment_and_Wages.aspx.

Occupation
# of Surveyed
Firms
# of Covered
Employees
Average
Hire-In Rate
Average
Minimum
Weighted
Average
Salary
Average
Median
Salary
Average
Maximum
Salary
Accountant NA NA $16.89 $35,122 NA $50,062 $54,008
Management Trainee NA NA $20.00 $41,600 NA $58,951 $78,784
Programmer/Analyst* NA NA $23.70 $49,298 NA $66,063 $75,752
Engineer NA NA $26.10 $54,282 NA $73,707 $81,016
Retail Store Clerk NA NA $9.24 $19,224 NA $21,658 $28,354
Stock Room Clerk NA NA $8.72 $18,139 NA $19,680 $25,277
Hospitality Clerk* NA NA $8.77 $18,245 NA $22,431 $32,480
Customer Service Rep. NA NA $8.91 $18,527 NA $19,645 $36,307
Telesales Rep.* NA NA $11.97 $24,906 NA $48,904 $74,334
Data Entry Clerk* NA NA $8.81 $18,330 NA $25,086 $30,470
Executive Secretary NA NA $13.57 $28,221 NA $37,101 $47,119
Accounting Clerk NA NA $11.27 $23,448 NA $29,110 $35,249
Word Processor NA NA $9.84 $20,475 NA $23,991 $30,676
General Laborer NA NA $12.71 $26,427 NA $27,371 $28,751
Warehouse Person NA NA $12.71 $26,427 NA $27,371 $28,751
Hand Packer* NA NA $8.77 $18,251 NA $21,394 $26,082
Material Handler NA NA $12.71 $26,427 NA $27,371 $28,751
Light Assembly* NA NA $14.44 $30,044 NA $36,318 $44,819
Machine Operator** NA NA $13.16 $27,377 NA $36,865 $43,757
Fork Lift Operator* NA NA $11.52 $23,953 NA $33,667 $40,676
Machine Maintenance* NA NA $15.96 $33,193 NA $49,948 $54,573
Tool & Die* NA NA $18.49 $38,464 NA $53,905 $59,296
Machinist* NA NA $11.06 $23,010 NA $35,644 $42,914
Welder NA NA $15.44 $32,113 NA $35,442 $38,455
Numerical Control Machine Programmer** NA NA $13.16 $27,377 NA $36,865 $43,757
Table 11: Average Salary by Selected OccupationFulton County, IL
Professional
Retail
Clerical
Unskilled
Semi-Skilled
Skilled
Technical

Electronic Technician* NA NA $19.83 $41,240 NA $66,120 $75,066
Medical Laboratory Technician* NA NA $11.80 $24,547 NA $31,001 $39,812
Network Technician NA NA $18.40 $38,266 NA $43,198 $44,945
Office Manufacturing
Average Work Week in Hours 40 40
Annual Average Turnover % 1% 5%
Sources:
Notes:
"Open Occupational Employment Statistics (OES)." Department of Economic Security. Accessed October 26, 2014.
http://www.ides.illinois.gov/LMI/Pages/Occupational_Employment_Statistics.aspx.
Phone interview with manufacturing companies and bank offices conducted in October 2014.
*Wage information for Local Workforce Area 16.
** Wage information for Peoria MSA.

Average Cost for All Manufacturing per $100 Payroll $7.59
Average Rate for Office Workers (8810) $0.32
Maximum Weekly Benefit $1,341.07
Taxable Base $12,960
Rate % 0.55% to 8.55%
Average Among Existing Employers 4.15%
Average Among New Employers 3.95%
Maximum Weekly Benefit $562
Sources:
Unemployment Insurance
Workers Compensation
Table 12: Workers Compensation and Unemployment InsuranceFulton County, IL
"State Comparisons." Forward Wisconsin. Accessed October 27, 2014. http://www.forwardwi.com/category45/State-
Comparisons.
"Benefit Rates." Illinois Workers' Compensation Commission. Accessed October 27, 2014.
http://www.iwcc.il.gov/benefits.htm.
"State Unemployment Compensation." Accessed October 27, 2014. http://www.infoplease.com/business/economy/state-
unemployment-compensation.html.

Is the State Right to Work
All Workers
Manufacturing
Union Elections - Companies w/50 or more Employees, Last 5 Years Number
# and % Won by Unions in Manufacturing 0
# and % Won by Unions in Distribution 1
# and % Won by Unions in F.I.R.E. 0
# and % Won by Unions in All Sectors 1
Union Elections - Companies w/50 or more Employees
(Listing by Company, Last 5 Years)
Company Name First Student, Inc.
Union Involved
Service Employees
International Union
(SEIU)
Industry NAICS Code 485
Number of Votes For Union 31
Number of Votes Against Union 6
Strikes & Work Stoppages
Number
Average Duration
Strikes by Company (Listing by Company)
Company Name
Industry NAICS Code
Union Involved
# of Striking Workers
Duration of Strike
Strike Called by National or Local Union
Sources:
100.0%
% of Workforce Organized
Last Five Years Including 50 or More Employees
Last Five Years
% Won by Union
NA
NA
Union NAICS Code Date
Table 13: Labor Management RelationsFulton County, IL
No
16.3%
13.4%
485 Jan-09
0.0%
100.0%
0.0%
National Right to Work Legal Defense Foundation. Accessed October 29, 2014. http://www.nrtw.org/.
Union Facts. Accessed October 29, 2014. https://www.unionfacts.com/.
Union Membership and Coverage Database. Accessed October 29, 2014. http://www.unionstats.com/.
"Election Reports." National Labor Relations Board. Accessed October 29, 2014. http://www.nlrb.gov/reports-guidance/reports/election-
reports.
Phone interview of employers, conducted in October 2014.
NA
NA
NA
NA
NA
NA

Metro Area Miles
1 Peoria, IL (Peoria, Illinois metropolitan area) 32
2 Macomb, IL (Macomb, Illinois micropolitan area) 40
3 Galesburg, IL (Galesburg, Illinois micropolitan area) 40
4 Lincoln, IL ( Lincoln, Illinois micropolitan area) 64
5 Bloomington, IL (Bloomington, Illinois metropolitan area) 67
# of Common Carriers Serving the Area 22
# of Common Carriers with Local Terminals 22
Name Keokuk Junction Railway Co.
Main or Branch Line Main
Shortline or National Shortline
Nearest Switching Yard (miles) 32
Name Burlington Northern Santa Fe (BNSF)
Main or Branch Line Main
Shortline or National National
Nearest Switching Yard (miles) 41
Name General Wayne A. Downing Peoria International Airport
Hub Status N
Distance from the Community in Miles 30 miles
# of Runways 2
Runway Lengths Runway 13/31 - 10104 ft; Runway 4/22 - 8004 ft
Carriers (Names) Serving Airport
Passenger Allegiant, American, Delta, United
Charter Byerly Aviation, Peoria Aviation
Air Cargo Federal Express, UPS, Emery, DHL
Approved Capital Expansion Plan No
Major 2 or 4 Lane Highways Linking the Areas, indicate if City, County, State, US or Interstate - Fulton County is served by U.S.
Routes 24 and 136, and Illinois Routes 9, 41, 78, 95, 97, 100, and 116
Table 14: Transportation
Major 2 or 4 Lane Highways Linking the Areas, indicate if City, County, State, US or Interstate
Distance in Miles to the Five Nearest Metro Areas
Motor Carriers/Trucks
Fulton County, IL
Railroads (by Rail Carrier)
Commercial Airport

Approved New Service by Carrier (with Carrier & Start Date) No
Total # of Daily Non-Stops to All Cities Served 21
Six Largest Cities Served Number
1 - Chicago 7
2 - Dallas 2
3 - Detroit 2
4 - Denver 1
5 - Las Vegas 1
6 - Atlanta 3
# of Days Closed to Inclement Weather for the Last 3 Years 0
Name Ingersoll Airport
Location/City Canton
Driving Distance from the Community in Miles 2.5 miles
# of Runways 2
Runway Lengths Runway 18/36 - 3899 ft; Runway 9/27 - 3294 ft
Full Instrument Landing Capabilities Nonprecision Instrument
Hours of Operation Accessible for public (24 hrs); for staff 8:00 am - 4:30 pm
# of Days Closed to Inclement Weather for the Last 3 Years 0
Nearest Port (Name, City, Miles from Area) The Port of Chicago; Chicago; 200 miles
River, Lake or Ocean Lake
Channel Depth 27 ft
Turning Basin 3000 ft
Barging Facilities Yes
General Cargo Facilities Yes
Containerized Facilities Yes
Storage Facilities Yes
Highways Serving Port Three interstates
Railways Serving Port Twelve main line railroads
# of Freight Forwarders Serving Area 30+
# of Import/Export Brokers Serving Area 200+
# of International Courier Firms Serving Area 10+
Designation NA
Number NA
Distance to the Nearest General Aviation Airport
Foreign Trade Zones in Area
Ports

Site/Location NA
# of Acres NA
Operator NA
Name Peoria
Site Location (City & Street Address) 5701 W. Smithville Rd. Cargo Door 21 Bartonville, IL 61607
Indicate it at a Port, Airport, FTZ, Bridge, etc. Airport
# of Bonded Warehouses in the Area 0
# of Public Warehouses in the Area 1
Hub Classification NA
Latest Pick-Up Time NA
Earliest Delivery NA
Next Day Delivery Guarantee NA
Saturday Delivery NA
Zone Classification NA
Hub Classification NA
Latest Pick-Up Time NA
Earliest Delivery NA
Next Day Delivery Guarantee NA
Saturday Delivery NA
Zone Classification NA
Hub Classification NA
Latest Pick-Up Time NA
Earliest Delivery NA
Next Day Delivery Guarantee NA
Saturday Delivery NA
Zone Classification NA
Hub Classification NA
Latest Pick-Up Time NA
Earliest Delivery NA
DHL
Fed-Ex
Custom Port of Entry in the Area
Warehouses
Overnight Express Service Availability
UPS
Airborne

Next Day Delivery Guarantee NA
Saturday Delivery NA
Zone Classification NA
Nearest General Mail Canton Post Office
Latest Pick-Up Time 8:30 AM
Earliest Delivery Overnight
Next Day Delivery (specify States) All US states (may take up to 2 days)
Nearest Bulk Mail Facility Canton Post Office
Sources:
"Transportation." Fulton County. Accessed October 31, 2014. http://www.fultonco.org/economic-development/transportation/.
Google Maps. Accessed October 31, 2014. https://www.google.com/maps.
Office of Management and Budget. Accessed October 31, 2014.
http://www.whitehouse.gov/sites/default/files/omb/bulletins/2013/b-13-01.pdf.
"Canton Trucking Companies." Quick TSI. Accessed October 31, 2014.
http://www.quicktransportsolutions.com/carrier/illinois/canton.php.
"National Plan of Integrated Airport System (2015-2019)." Federal Aviation Administration. Accessed October 31, 2014.
http://www.faa.gov/airports/planning_capacity/npias/reports/media/npias-2015-2019-report-appendix-a.pdf.
Accessed October 31, 2014. http://www.airnav.com/.
Peoria International Airport. Accessed October 31, 2014. https://www.flypia.com/.
Illinois International Port District. Accessed October 31, 2014. http://iipd.com/.
Directory of Freight Forwarding Services. Accessed October 31, 2014. http://www.forwarders.com/StateDirectory/IL.html.
Chicago Customs Brokers and Forwarders Association. Accessed October 31, 2014. http://www.ccbfa.org/.
Danex Marketing & Business Resources. Accessed October 31, 2014. http://www.danex-exm.dk/courier-delivery-services.htm.
Enforcement and Compliance. Accessed October 31, 2014. http://enforcement.trade.gov/ftzpage/letters/ftzlist-map.html#illinois.
US Customs and Border Protection. Accessed October 31, 2014. http://www.cbp.gov/contact/ports/peoria.
Leonard’s Guide. Accessed October 31, 2014. http://www.leonardsguide.com/lgo/warehouse-companies/illinois.shtml.
FedEx. Accessed October 31, 2014. http://www.fedex.com/.
UPS. Accessed October 31, 2014. http://www.ups.com/.
Airborne. Accessed October 31, 2014. http://www.alpl.in/.
US Post Office. Accessed October 31, 2014. https://www.usps.com/.
Phone conversation with county and city governments, Keokuk Junction Railway, BNSF, Peoria International Airport, Ingersoll
Airport and Canton Post Office, conducted in October 2014.
United States Post Office

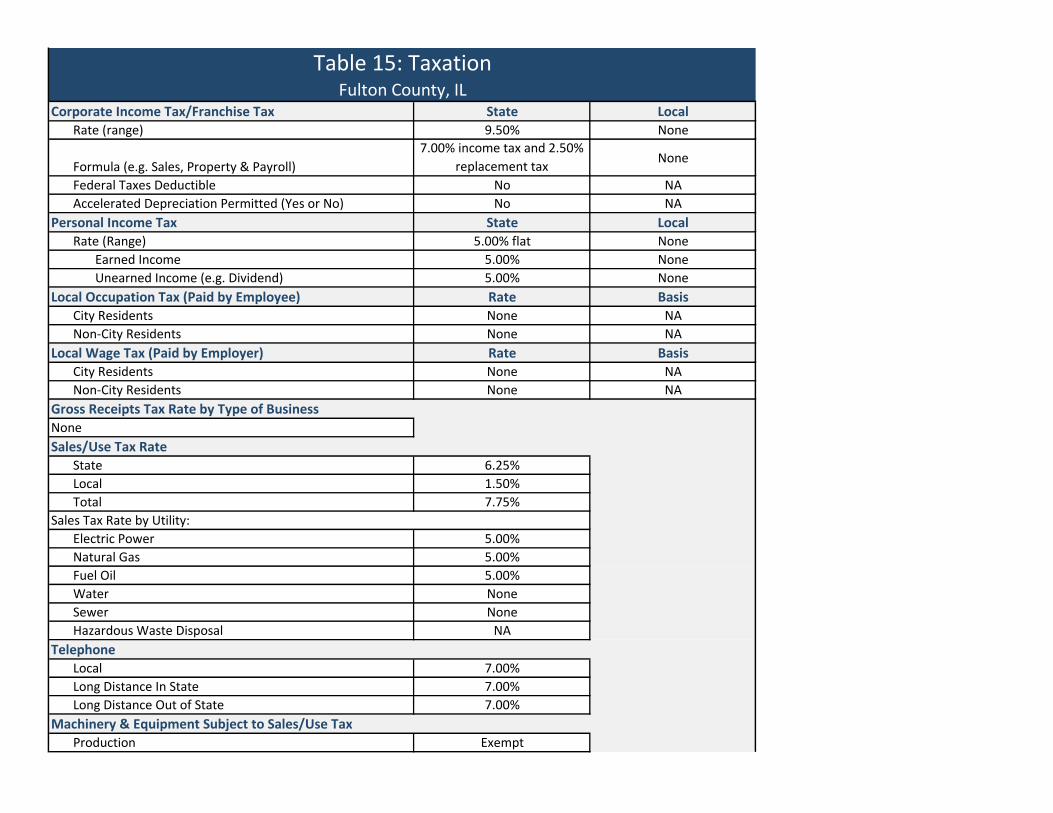
Corporate Income Tax/Franchise Tax State Local
Rate (range) 9.50% None
Formula (e.g. Sales, Property & Payroll)
7.00% income tax and 2.50%
replacement taxNone
Federal Taxes Deductible No NA
Accelerated Depreciation Permitted (Yes or No) No NA
Personal Income Tax State LocalRate (Range) 5.00% flat None
Earned Income 5.00% None
Unearned Income (e.g. Dividend) 5.00% None
Local Occupation Tax (Paid by Employee) Rate BasisCity Residents None NA
Non-City Residents None NA
Local Wage Tax (Paid by Employer) Rate BasisCity Residents None NA
Non-City Residents None NA
None
State 6.25%
Local 1.50%
Total 7.75%
Electric Power 5.00%
Natural Gas 5.00%
Fuel Oil 5.00%
Water None
Sewer None
Hazardous Waste Disposal NA
Local 7.00%
Long Distance In State 7.00%
Long Distance Out of State 7.00%
Production Exempt
Table 15: TaxationFulton County, IL
Sales/Use Tax Rate
Telephone
Sales Tax Rate by Utility:
Gross Receipts Tax Rate by Type of Business
Machinery & Equipment Subject to Sales/Use Tax

Non-Production Exempt
Pollution Control Exempt
Office Furniture/Fixtures/Equipment Not Exempt
Office Building Construction Materials No
Industrial Building Construction Materials No
Manufacturers' Raw Materials No
Standard Software Yes
Custom Software Yes
Describe What is Subject to Tax Rate (e.g. Accounts
Receivable, Capital Stock)None
Basis & Rate None
Stock Bond Transaction Fee (Yes or No & its Yes Rate) None
Major Employment Centers Canton Lewistown
City Millage 1.999% 0.951%
County Millage 1.727% 1.727%
School Millage 4.593% 5.839%
Special District Millage 1.485% 1.466%
Assessment Ratio (%) 31.650% 30.800%
Effective Rate per $100 3.103% 3.074%
City Millage None
County Millage None
School Millage None
Special District Millage None
Assessment Ratio (%) None
Effective Rate per $100 None
Real Property None
Personal Property (machinery/equipment) None
Rate None
Basis & Rate None
Taxable Items None
Rate for Each Item None
Real Property Tax Rates for Jurisdictions Featuring
Intangible Property
State Property Tax Effective Rate per $100
Property Tax After Core Income Tax & State Excise Tax
Sales/Use Tax (Yes or No) on
Property Tax After Core Income Tax
Personal Property Tax Rates per $100

Production Machinery & Equipment None
Non Production Machinery & Equipment None
Pollution Control None
Inventory None
Raw Materials None
Work in Progress None
Finished Goods None
Freeport Legislation None
Applicable to Warehousing None
Applicable to Manufacturing None
Goods Stored in a Public Warehouse None
Office Furniture-Fixtures None
Computer Equipment None
Workstations None
Telephones None
Furniture None
Company Vehicles None
Standard Software None
Custom Software None
Sources:
Illinois Department of Revenue. Accessed November 2, 2014. http://www.revenue.state.il.us/.
Phone conversation with Illinois Department of Revenue, Water and Wastewater departments of City of Canton,
conducted in October 2014.
Subject to Personal Property Tax

Business Parks Total Acreage Available Acreage
Industrial 14,106 NA
Office 2,091 NA
Research NA NA
Mixed Use NA NA
# of Fully Serviced Freestanding Sites NA NA
Ten Plus Acres of Industrial Zoned 13,379 NA
Five Plus Acres of Office Zoned 1,835 NA
Average Cost Per Acre for Fully Developed Sites City (non CBD) Suburban
Industrial $2,640,237 NA
Office $510,549 NA
Average Asking Rents (Gross Rent Per Square Foot) City (non CBD) Suburban Total Weighted Average
Class A Office
Class B Office
Class C Office
Warehouse $0.60 NA $0.60
Industrial $0.15 NA $0.15
Vacancy Rates % City (non CBD) Suburban Total Weighted Average
Class A Office
Class B Office
Class C Office
Warehouse 0% NA 0%
Industrial 0% NA 0%
City Suburban Total City Suburban Total City Suburban Total
Less than 25,000 1 0 1 0 0 0 5 0 5
25 - 49,999 0 0 0 0 0 0 0 0 0
49 - 99,999 0 0 0 0 0 0 0 0 0
100 - 149,999 0 0 0 0 0 0 0 0 0
150 - 199,999 0 0 0 0 0 0 0 0 0
200 - 249,999 0 0 0 0 0 0 0 0 0
250,000 or Higher 0 0 0 0 0 0 0 0 0
Applicable Building Code Lewistown NA Lewistown NA NA NA Canton NA Canton
Office Industrial
Average Length of Time for Local Permit Approvals
(routine projects)1 day 3 days
Certificate Occupancy 1 day 3 days
Building Permit 1 day 3 days
Environmental 1 day 1 day
Sources:
Table 16: Occupancy/SupplyFulton County, IL
Name of Buildings Available By Size of Range (in
Square Feet)
IndustrialWarehouseOffice
$0.65
Peoria Area Commercial Real Estate Property Search. Accessed October 5, 2014. http://www.paarealtors.com/search/commercial_search.asp.
Phone conversation with Canton Planning and Zoning Department, real estate agents in Fulton County and local business, conducted in October 2014.
NA
NA<5% <5%
$0.65

Major Source
% of Population Increase Served from the Source
Name of Provider
Rated Capacity (mgd)
Average Daily Demand (mgd)
Peak Demand (mgd)
Chemical Breakdown of Water
Cost per 1000 Gallons
Water Connection Fee
Name of Provider
Type of Service
Rated Capacity (mgd)
Average Daily Demand (mgd)
Peak Demand (mgd)
Cost per 1000 Gallons
Sewer Connection Fee
Major Source
% of Population Increase Served from the Source
Name of Provider
Rated Capacity (mgd)
Average Daily Demand (mgd)
Peak Demand (mgd)
Chemical Breakdown of Water
Cost per 1000 Gallons
Water Connection Fee
Name of Provider
Type of Service
Rated Capacity (mgd)
Average Daily Demand (mgd)
Peak Demand (mgd)
Table 17: UtilitiesFulton County, IL
Water & Sewer - Farmington
Water AvailabilityReverse Osmosis facility
50%
Water TreatmentCity of Farmington
0.6
0.274
0.31
NA
$5.20
$175.00
Sewer TreatmentFarmington Sanitary District
Water & Sewer - Canton
Water AvailabilityRadial collector well down near Banner
25%
Water TreatmentCity of Canton WTP
4
2 to 2.2
3
PH 9.289, Total Alkalinity 166.2, Total hardness 199.3, Nitrate 2.2, Turbidity NTU
0.044, T.D.S. 103, Plant Fluoride 1.044, Total Phosphate 2.65
$6.89 per 1000 gal. plus a $6.00 base fee per month
$537.05
Sewer TreatmentCity of Canton POTW
Municipal Wastewater Treatment
Design average flow = 3.14 mgd, Max daily flow= 8.34 mgd
NA
NA
$5.90
$150.00
Taxing Body
1.5
0.5
0.3

Cost per 1000 Gallons
Sewer Connection Fee
Major Source
% of Population Increase Served from the Source
Name of Provider
Rated Capacity (mgd)
Average Daily Demand (mgd)
Peak Demand (mgd)
Chemical Breakdown of Water
Cost per 1000 Gallons
Water Connection Fee
Name of Provider
Type of Service
Rated Capacity (mgd)
Average Daily Demand (mgd)
Peak Demand (mgd)
Cost per 1000 Gallons
Sewer Connection Fee
Name of Company
Communities Served
Company-Net Importer or Exporter of Power
% of Reserve Margin Including Generation & Net Purchases
Name of Power Pool Membership
State Electric Power Deregulated (yes or no, if yes provide date)
Average Cost per kWh (cents) Small Medium Large
50 kW & 18,000 kWh 300 kW & 140,000 kWh 750 kW & 260,000 kWh
Industrial
Name of Provider
Average Cost for Industrial Users ($ per mcf)
Firm Contract Rates
Interruptible Service Rates
Distribution Delivery Charge for general service: $3.289/kW for Primary Supply
Voltage; $0.891/kW for High Supply Voltage; $1.491/kW for +100 kV Supply
Voltage
NA
$2.92
$100 + material cost
Lewistown
Waste Water
0.6
0.4
1.5
$2.08
$80.00
Midcontinent (MISO)
Yes, 1997
Ameren Illinois
$0.75/mcf to receive gas supply from the Company, $0.40/mcf to receive gas
supply from a Retail Gas Supplier (Distribution Delivery Charge
for average daily uses of less than 19.5 mcf per day)
Variable (depends on contract)
$0.61/mcf to receive gas supply from the Company, $0.35/mcf to receive gas
supply from a Retail Gas Supplier (Distribution Delivery Charge)
Natural Gas
Water Availability
Water Treatment
Sewer Treatment
Electric Power
NA
NA
Lewistown
0.5
0.35
0.4
Water & Sewer - Lewistown
$16.39 for first 3000 gallons then $5.00 per 1000
$50.00
Ameren Illinois
1,186
Exporter
18%
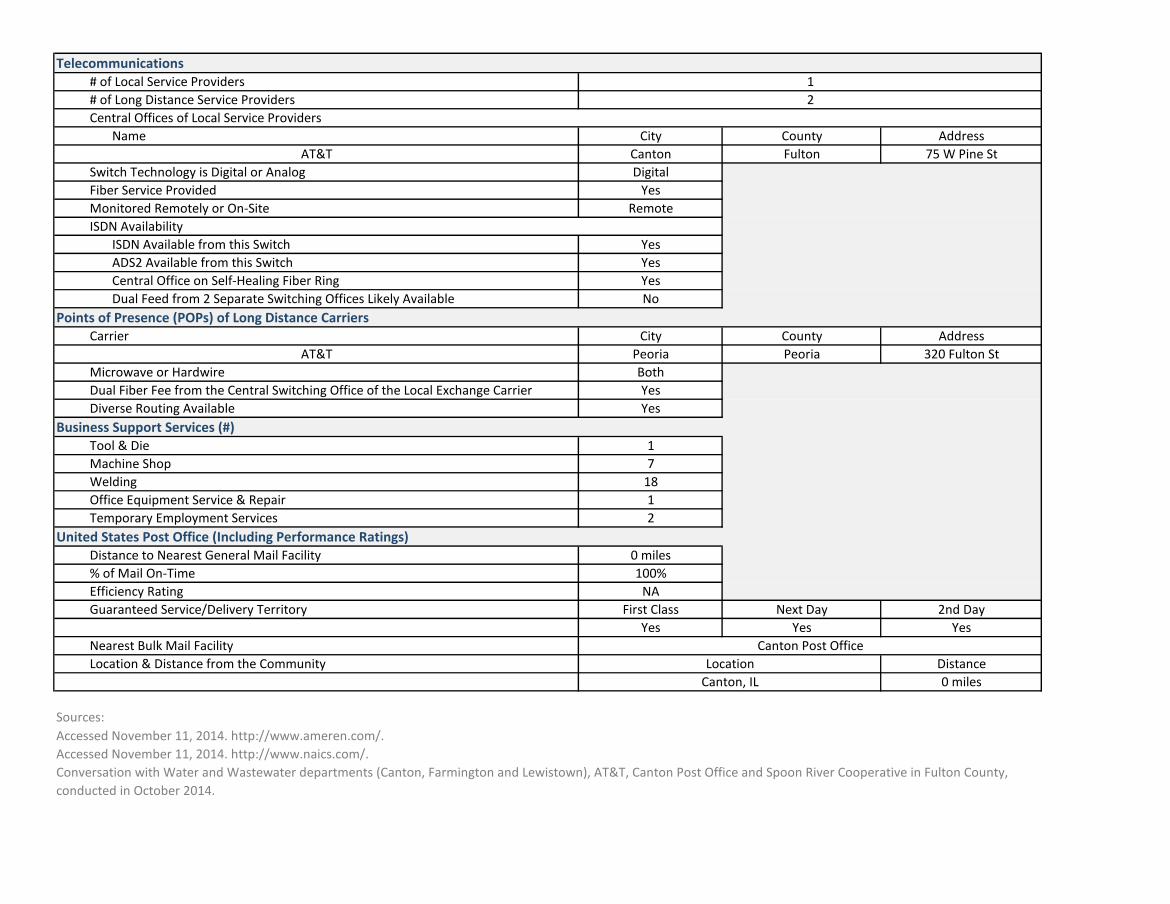
# of Local Service Providers
# of Long Distance Service Providers
Central Offices of Local Service Providers
Name City County Address
AT&T Canton Fulton 75 W Pine St
Switch Technology is Digital or Analog Digital
Fiber Service Provided Yes
Monitored Remotely or On-Site Remote
ISDN Availability
ISDN Available from this Switch Yes
ADS2 Available from this Switch Yes
Central Office on Self-Healing Fiber Ring Yes
Dual Feed from 2 Separate Switching Offices Likely Available No
Carrier City County Address
AT&T Peoria Peoria 320 Fulton St
Microwave or Hardwire Both
Dual Fiber Fee from the Central Switching Office of the Local Exchange Carrier Yes
Diverse Routing Available Yes
Tool & Die 1
Machine Shop 7
Welding 18
Office Equipment Service & Repair 1
Temporary Employment Services 2
Distance to Nearest General Mail Facility 0 miles
% of Mail On-Time 100%
Efficiency Rating NA
Guaranteed Service/Delivery Territory First Class Next Day 2nd Day
Yes Yes Yes
Nearest Bulk Mail Facility
Location & Distance from the Community Distance
0 miles
Sources:
Canton Post Office
Canton, IL
Accessed November 11, 2014. http://www.ameren.com/.
Accessed November 11, 2014. http://www.naics.com/.
Conversation with Water and Wastewater departments (Canton, Farmington and Lewistown), AT&T, Canton Post Office and Spoon River Cooperative in Fulton County,
conducted in October 2014.
Location
1
United States Post Office (Including Performance Ratings)
2
Telecommunications
Points of Presence (POPs) of Long Distance Carriers
Business Support Services (#)

Area in Attainment for Federal Air Pollution Regulations Yes No If No, Degree of Exceedence & Any Anticipated Change
Ozone Yes NA NA
Carbon Monoxide Yes NA NA
Particular Matter Yes NA NA
Lead Yes NA NA
Sulfur Dioxide Yes NA NA
Nitrogen Dioxide Yes NA NA
State Instituted a One-Stop Air & Water Quality Permitting System Yes NA NA
Average Permit Approval Time From Date of Completed Routine
Application
Average Time
Air Permit 1 year
Water Permit 6 months
Hazardous Waste Permit 6 months
Nearest Licensed Hazardous Waste Disposal Site Name of Site City Mileage from Service Area Class
Peoria Disposal Co # 1 Peoria 37 miles B
Number
4
Landfill Location (s) Capacity Left at Current Site(s) Plans for New Capacity
8 35 years NA
Contact Information Name of Agency Address Telephone # Fax #
Air Quality IEPA Peoria Office
412 SW Washington St.,
Suite D
Peoria, Illinois 61602 (309) 671-3022 (309) 671-3024
Water Quality IEPA Peoria Office
412 SW Washington St.,
Suite D
Peoria, Illinois 61602 (309) 671-3022 (309) 671-3024
Hazardous Waste IEPA Peoria Office
412 SW Washington St.,
Suite D
Peoria, Illinois 61602 (309) 671-3022 (309) 671-3024
Sources:
Illinois Environmental Protection Agency. Accessed November 4, 2014. http://www.epa.state.il.us/.
US Environmental Protection Agency. Accessed November 4, 2014. http://www.epa.gov/.
Google Maps. Accessed November 4, 2014. https://www.google.com/maps.
Phone conversation with Illinois Environmental Protection Agency , conducted in October 2014.
Table 18: EnvironmentalFulton County, IL
# of Licensed Hazardous Waste Haulers Serving the Area
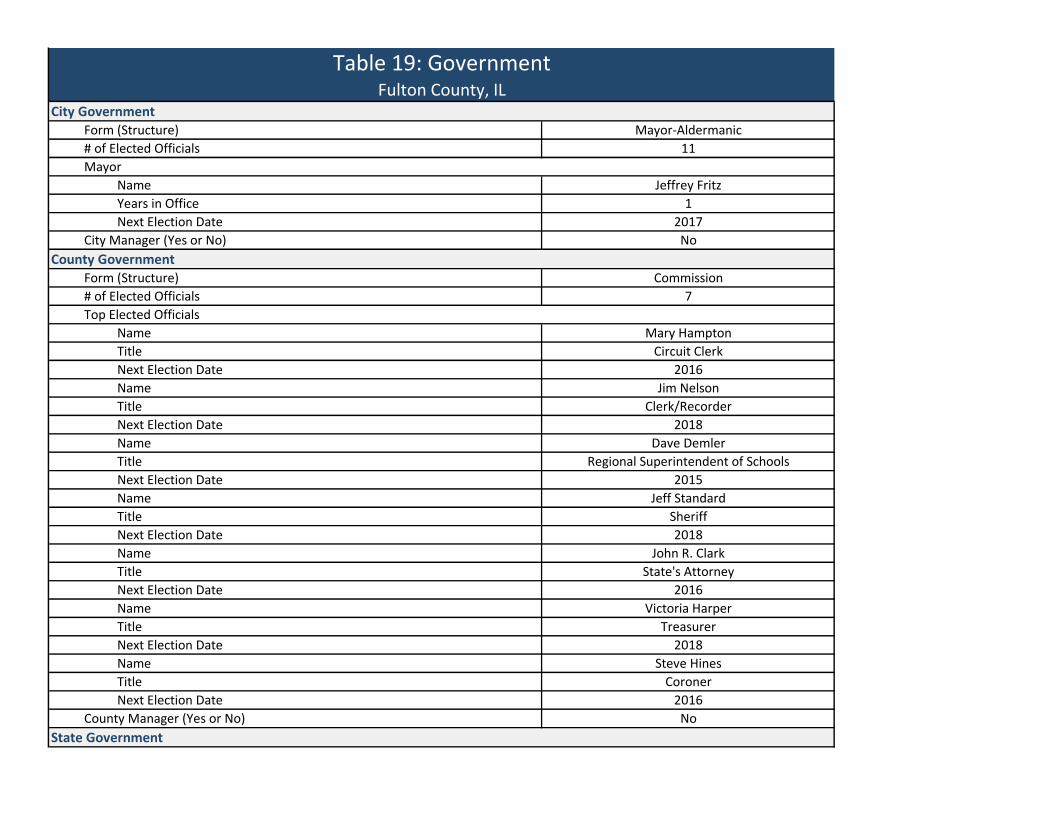
Form (Structure) Mayor-Aldermanic
# of Elected Officials 11
Mayor
Name Jeffrey Fritz
Years in Office 1
Next Election Date 2017
City Manager (Yes or No) No
Form (Structure) Commission
# of Elected Officials 7
Top Elected Officials
Name Mary Hampton
Title Circuit Clerk
Next Election Date 2016
Name Jim Nelson
Title Clerk/Recorder
Next Election Date 2018
Name Dave Demler
Title Regional Superintendent of Schools
Next Election Date 2015
Name Jeff Standard
Title Sheriff
Next Election Date 2018
Name John R. Clark
Title State's Attorney
Next Election Date 2016
Name Victoria Harper
Title Treasurer
Next Election Date 2018
Name Steve Hines
Title Coroner
Next Election Date 2016
County Manager (Yes or No) No
Table 19: GovernmentFulton County, IL
City Government
County Government
State Government

Form (Structure) Illinois Executive Branch
# of Elected Officials 177
Upper House Representing Area (Senate) Senator Dave Koehler (46th Legislative District)
Total Statewide Upper House (Senate) 59 State Representatives
Lower House Representing Area (House of Representatives) Rep. Mike Unes
Total Statewide Lower House (House of Representatives) 118 Representatives (91st District)
Name Pat Quinn
Years in Office 4
Current Term Expiration Date Nov. 2014
Allowed to Run for Another Term (Yes or No) Yes
Next Election Date Nov. 2014
Congressional Districts Listed by District # in the Service Area (by District) Illinois's 17th congressional district
Name Cheri Bustos
Years in Office 2
Current Term Expiration Date 2014
Next Election Date 2014
Name Dick Durbin
Years in Office 18
Current Term Expiration Date 2014
Next Election Date 2014
Name Mark Kirk
Years in Office 4
Current Term Expiration Date 2014
Next Election Date 2014
Sources:
Fulton County elected officials. Accessed November 4, 2014. http://www.fultonco.org/officials/elected/.
Phone conversation with City of Canton and Fulton County Government, conducted in October 2014.
US Congresspersons Serving the Area
US Senators Serving Area
Governor
US Government Representation
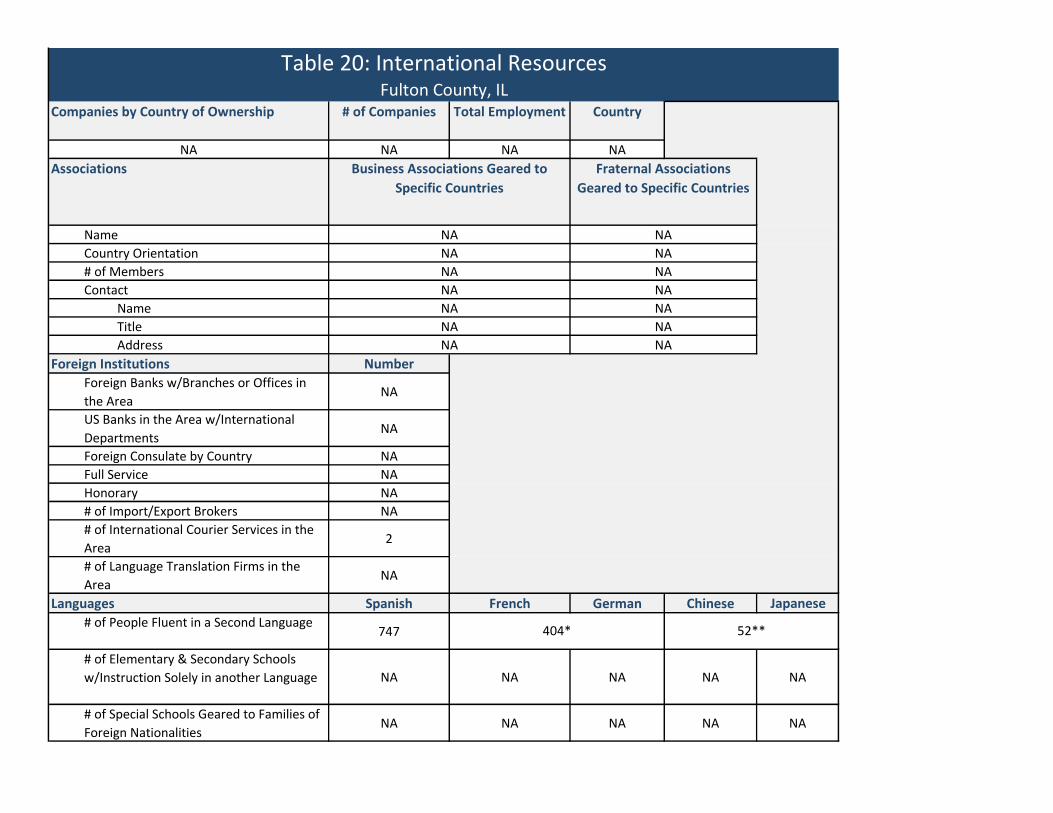
Companies by Country of Ownership # of Companies Total Employment Country
NA NA NA NA
Associations
Name
Country Orientation
# of Members
Contact
Name
Title
Address
Foreign Institutions Number
Foreign Banks w/Branches or Offices in
the AreaNA
US Banks in the Area w/International
DepartmentsNA
Foreign Consulate by Country NA
Full Service NA
Honorary NA
# of Import/Export Brokers NA
# of International Courier Services in the
Area2
# of Language Translation Firms in the
AreaNA
Languages Spanish French German Chinese Japanese
# of People Fluent in a Second Language747
# of Elementary & Secondary Schools
w/Instruction Solely in another Language NA NA NA NA NA
# of Special Schools Geared to Families of
Foreign NationalitiesNA NA NA NA NA
NA
52**404*
NA
NA
NA
Business Associations Geared to
Specific Countries
Fraternal Associations
Geared to Specific Countries
NA
NA
NA
NA
NANA
NA
NA
Table 20: International ResourcesFulton County, IL
NA
NA

International Air Transportation to: Name of Airport City Distance to
Airport
# of Weekly
Non-Stop
Flights
Canada NA NA NA
Mexico NA NA NA
South America NA NA NA
Europe NA NA NA
Asia NA NA NA
Australia NA NA NA
New Zealand NA NA NA
Dedicated Programs by Country or Region
for Each College/University
NA NA NA
Sources:
Notes:
Educational International Focus
"Transportation." Fulton County. Accessed October 31, 2014. http://www.fultonco.org/economic-development/transportation/.
Phone interview with City and County Governments, conducted in October 2014.
NA
*Speak Other Indo-European languages.
**Speak Asian and Pacific Islander languages.
Name of Airport Program Name

Average Daily Temperature High Low Average
July 86 66 76
January 33 17 25
Annual Average
Rainfall in Inches 37
Snowfall in Inches 25.1
Wind Speed in Miles per Hour (Annual
Average)
6.4
Number of Days Sunny or Partly
Sunny
193
Elevation (Mean Feet Above Sea
Level)
Range Average
440-742 662
Personal Income Tax (RATE in Ranges)
State
Local
Local Occupation Tax Rate Range Basis
City Residents None NA
Non-City Residents None NA
Sales Tax
Major Exemptions Machinery
State Rate 6.25%
Local Rate 1.50%
Housing
Single Family Townhouses Condominiums
183 0 1
Average Selling Prices New Existing
Table 21: Quality of LifeFulton County, IL
Climate
Rate Range
5%
None
Number of Homes on the Market

Single Family Home 3,500 Sq. Ft.-4
BedroomsNA $154,370
2,500 Sq. Ft. - 3 Bedrooms NA $103,747
Townhouse 1,500 Sq. Ft. -
2BedroomsNA NA
Condominiums 1,200 Sq. Ft. 2- 2
BedroomsNA $69,900
Number of Single Family Homes for
Sale by Price
Under - $150,000 155
$150,001 - $200,000 17
$200,000 - $250,000 3
$250,001 - Over 8
Rentals Average Monthly
Executive Style 3,000 Sq. Ft. - 3
Bedroom Home
$400-$1000
New 2 Bedroom Apartment $400-$1000
Apartment Vacancy % <5%
Number of School Districts 6
Central City & Selected Suburban
School Districts
Canton
Elementary School Enrollment 1,863
Secondary School Enrollment 729
Spending per Student
Total $5,271
Instructional $14,224
Student Teacher Ratios
Elementary School Enrollment 16 Students/teacher
Secondary School Enrollment 12 Students/teacher
7th Grade Standard Achievement Test
Results
Test Name ISAT
Education
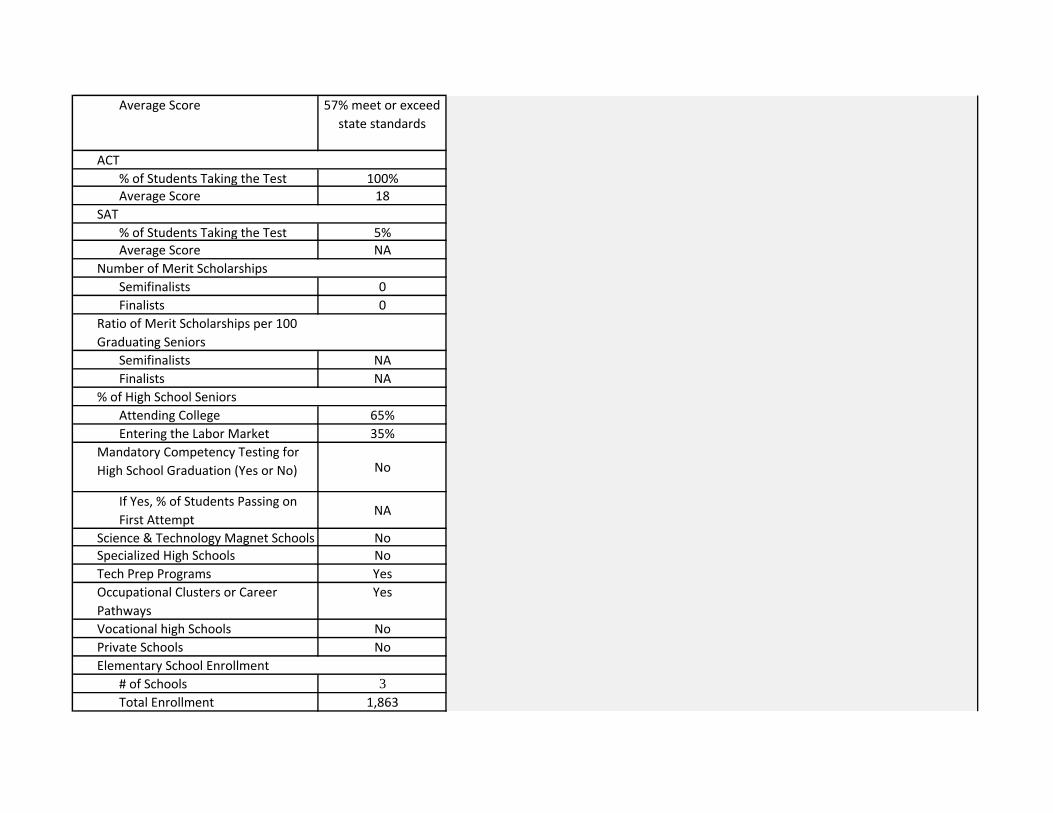
Average Score 57% meet or exceed
state standards
ACT
% of Students Taking the Test 100%Average Score 18
SAT
% of Students Taking the Test 5%Average Score NA
Number of Merit Scholarships
Semifinalists 0
Finalists 0
Ratio of Merit Scholarships per 100
Graduating Seniors
Semifinalists NA
Finalists NA
% of High School Seniors
Attending College 65%
Entering the Labor Market 35%
Mandatory Competency Testing for
High School Graduation (Yes or No) No
If Yes, % of Students Passing on
First AttemptNA
Science & Technology Magnet Schools NoSpecialized High Schools No
Tech Prep Programs Yes
Occupational Clusters or Career
Pathways
Yes
Vocational high Schools No
Private Schools No
Elementary School Enrollment
# of Schools 3
Total Enrollment 1,863

Average Annual Tuition None, $8,300 for non-
residents
Secondary School Enrollment
# of Schools 2
Total Enrollment 729
Average Annual Tuition None, $8,300 for non-
residents
Institution Name
Full-Time Enrollment
Annual Degrees Conferred
Undergraduate
Graduate
Curricula w/Masters Degrees (List)
Curricula w/Doctorate Degrees (List)
Community College(s) Name(s)
Spoon River College
Full-Time Enrollment
Annual Degrees Conferred
Hospitals # of Hospitals # of Teaching Hospitals # of Beds
1 1 93
# of Outpatient Clinics 7
Physician Dentists
Ratio per 1,000 Population
Property Violent Total
2,433 300 2,733
# of Enclosed Regional Malls 0
Protestant Catholic Synagogues Other
43 4 0 38
NA
NA
NA
Address City
NA
NA
NA
NA
Higher Education (Provide for Each Institution)
Health Care
NA
NA
Address
23235 County Highway 22, Canton, IL 61520
NA
NA
NA
2.2
Crime Rate per 100,000 Inhabitants*
# of Religious Institutions
720
424
NA
NA
# of Physicians & Dentists in the Area80
City
Canton

Major & Minor for College &
Professional Teams
Major Minor Major Minor
Football NA NA NA NA
Baseball NA NA NA NA
Basketball NA NA NA NA
Hockey NA NA NA NA
Soccer NA NA NA NA
Dates
First two weekends in
October
Friday of Father’s Day
Weekend in June
October
First Friday in
December 10, 2014
First full weekend in
June
# Of Cultural Places & Amenities Museums Dance Companies Symphony Orchestras Opera Companies Theater Companies
5 0 0 0 0
Recreational Outlets (Provide
Examples within a 2 Hour Drive)
Sources:
Sports
Culture
Canton Classic Cruisers Cruise In
Munchkin Masquerade
Old Fashioned Christmas Walk
Art on Main
College Professional
Anderson Lake State Conservation Area, Spoon River College Arboretum, Banner Marsh, Liverpool Boat Launch,
Bernadotte Park & Dam, Banner Boat Launch, Camp Emmanuel, Canton Lake, Big Creek Park, Goose Ranch, Fulton
County Camping & Recreation Area, Farmington Township Park, Lakeland Park, Mt. Pisgah Park, Rice Lake State
Conservation Area, Riverside Park and Duck Island
Top Five Annual Event
Event
Spoon River Valley Scenic Drive

Notes:
*Crime information is for City of Canton.
Accessed November 6, 2014. http://www.weather.com/.
Accessed November 6, 2014. http://www.areavibes.com/.
Accessed November 6, 2014. http://www.bestplaces.net/.
"Communities." Fulton County. Accessed November 6, 2014. http://www.fultonco.org/live-here/experience-communities/.
"Tax Rate Database." Illinois Department of Revenue. Accessed November 6, 2014. http://www.revenue.state.il.us/TaxRates/.
"Illinois Tax Rate Finder." Illinois Department of Revenue. Accessed November 6, 2014. https://www.revenue.state.il.us/app/trii/.
"Residential Real Estate Home Search." Peoria Area Association of Realtors. Accessed November 6, 2014. http://www.paarealtors.com/search/index.asp.
Illinois State Board of Education. Accessed November 6, 2014. http://www.isbe.net/research/htmls/fall_housing.htm.
"Illinois Report Card 2013-2014." Illinois State Board of Education. Accessed November 6, 2014.
http://illinoisreportcard.com/District.aspx?source=Profile&Districtid=22029066025.
Accessed November 6, 2014. http://www.teachersalaryinfo.com/.
Spoon River College. Accessed November 6, 2014. www.src.edu/.
US Health News. Accessed November 6, 2014. http://health.usnews.com/.
"Uniform Crime Reporting Statistics ." US Department of Justice. Accessed November 6, 2014.
http://www.ucrdatatool.gov/Search/Crime/Local/JurisbyJuris.cfm.
Accessed November 6, 2014. http://www.mallseeker.com/.
Accessed November 6, 2014. http://www.city-data.com/county/religion/Fulton-County-IL.html.
Accessed November 6, 2014. http://www.50states.com/.
Fulton County Tourism. Accessed November 6, 2014. http://www.fultoncountytourism.org/.
Illinois Association of Museums. Accessed November 6, 2014. http://www.illinoismuseums.org/museums/.
Illinois Dance Studios. Accessed November 6, 2014. http://www.dancelessons.net/dancestudios/page312.html.
Illinois Council of Orchestras. Accessed November 6, 2014. http://www.ilcouncilorchestras.org/.
Accessed November 6, 2014. http://opera.stanford.edu/companies.html.
Illinois Theater Association. Accessed November 6, 2014. http://www.illinoistheatre.org/MemberDirectory/tabid/502/Default.aspx.
Phone interview with real estate agents, Graham Hospital, Canton School District and Spoon River College, conducted in October 2014.

2015 2020 2025 2030 2035
Under - 17 3,096 2,828 2,943 2,853 2,834 2,855 2,844
18 - 34 3,954 3,995 4,501 4,029 3,959 4,001 3,994
35 - 54 4,187 3,887 4,017 3,781 3,934 3,958 3,857
55 - 74 2,538 2,578 2,778 2,829 2,619 2,516 2,714
75 - Older 1,513 1,411 1,228 1,447 1,583 1,716 1,487
Under - 17 20.3% 19.2% 19.0% 19.1% 19.0% 19.0% 19.1%
18 - 34 25.9% 27.2% 29.1% 27.0% 26.5% 26.6% 26.8%
35 - 54 27.4% 26.4% 26.0% 25.3% 26.4% 26.3% 25.9%
55 - 74 16.6% 17.5% 18.0% 18.9% 17.5% 16.7% 18.2%
75 - Older 9.9% 9.6% 7.9% 9.7% 10.6% 11.4% 10.0%
Median Age (years) 37.5 37.7
Number 5,646 5,576
Median Household Income $31,011 $39,387
Under - $35,000 3,199 2,602
$35,001 - $50,000 921 848
$50,001 - $75,000 914 1,089
$75,001 - Above 612 1,037
2013 2012 2011 2010 2009
-206 -162 5 18 -41
Workforce Education Attainment (25 - 64 Years of Age) Percentage %Under - 12 Years
12 - 15 Years
12 Years Only
Some College
Associate Degrees
Subtotal
Five Year Projections1
20122000Population
14.5%
20.3%
25.1%
20.3%
6.9%
% Distribution by Age Group
Population by Age Group
NA
NA
Table 1: Demographic CharacteristicsCanton, IL
Households
Net Migration Last Five Years Available2
Household Income Distribution
NA
87.2%

16 Years - More
16 Years Only
Total
Sources:
Notes:
100.0%
8.7%
1Population growth rates of Fulton County, IL (from DCEO County Population Projections) used for Canton population projections. 2Net migration data is for Fulton County, IL. Migration data is not available on city level.
College Graduates
US Census Bureau, 2000 SF1 100% data , Table P012, Table DP-1, Table QT-P10, accessed via American FactFinder, October 18, 2014.
US Census Bureau, 2000 SF3 sample data , Table DP-3, accessed via American FactFinder, October 18, 2014.
US Census Bureau, 2008-2012 ACS 5-Year Estimate , Table B01001, Table B01002, Table S1101, Table B15002, accessed via American FactFinder,
October 18, 2014.
US Census Bureau, 2013 Population Estimates , Table PEPTCOMP, accessed via American FactFinder, October 18, 2014.
US Census Bureau, 2012 Population Estimates , Table PEPTCOMP, accessed via American FactFinder, October 18, 2014.
US Census Bureau, 2011 Population Estimate s, Table PEPTCOMP, accessed via American FactFinder, October 18, 2014.
Population Estimates. Accessed October 18, 2014. https://www.census.gov/popest/research/eval-estimates/eval-est2010.html.
"DCEO County Population Projections." State of Illinois Data Portal. Accessed October 18, 2014. https://data.illinois.gov/Economics/DCEO-County-
Population-Projections/h3bx-hbbh.
4.0%
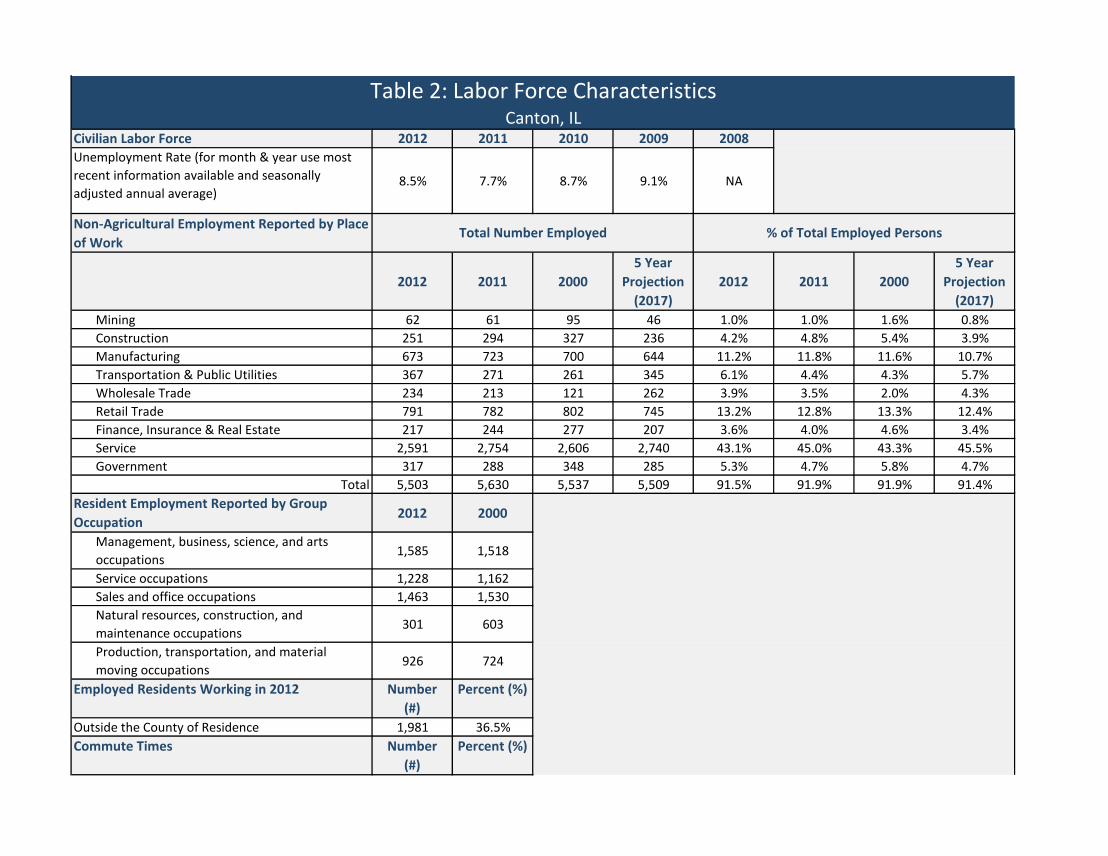
Civilian Labor Force 2012 2011 2010 2009 2008
Unemployment Rate (for month & year use most
recent information available and seasonally
adjusted annual average)8.5% 7.7% 8.7% 9.1% NA
Non-Agricultural Employment Reported by Place
of Work
2012 2011 2000
5 Year
Projection
(2017)
2012 2011 2000
5 Year
Projection
(2017)
Mining 62 61 95 46 1.0% 1.0% 1.6% 0.8%
Construction 251 294 327 236 4.2% 4.8% 5.4% 3.9%
Manufacturing 673 723 700 644 11.2% 11.8% 11.6% 10.7%
Transportation & Public Utilities 367 271 261 345 6.1% 4.4% 4.3% 5.7%
Wholesale Trade 234 213 121 262 3.9% 3.5% 2.0% 4.3%
Retail Trade 791 782 802 745 13.2% 12.8% 13.3% 12.4%
Finance, Insurance & Real Estate 217 244 277 207 3.6% 4.0% 4.6% 3.4%
Service 2,591 2,754 2,606 2,740 43.1% 45.0% 43.3% 45.5%
Government 317 288 348 285 5.3% 4.7% 5.8% 4.7%
Total 5,503 5,630 5,537 5,509 91.5% 91.9% 91.9% 91.4%
Resident Employment Reported by Group
Occupation2012 2000
Management, business, science, and arts
occupations1,585 1,518
Service occupations 1,228 1,162
Sales and office occupations 1,463 1,530
Natural resources, construction, and
maintenance occupations301 603
Production, transportation, and material
moving occupations926 724
Employed Residents Working in 2012 Number
(#)
Percent (%)
Outside the County of Residence 1,981 36.5%
Commute Times Number
(#)
Percent (%)
Total Number Employed % of Total Employed Persons
Table 2: Labor Force CharacteristicsCanton, IL

Less than 15 Minutes 2,584 48.20%
15 - 29 Minutes 616 11.50%
Over 30 Minutes 2,155 40.20%
Median
Labor Participation Rate
Male
Female
Total
Education & Labor Force Enrollment Graduates
High School (Public/Private) 2,475 3,180
High School Students Enrolling in College NA NA
Community College (Full-Time) 1,798 877
4 Year University (Full-Time)
Military Presence
Names of Installations
Sources:
Military Personnel # of Military DependentsAnnual # of Military
Personnel Discharge
24.9 minutes
NA
NA
US Bureau of Labor Statistics, Local Area Unemployment Statistics, accessed October 19, 2014.
US Bureau of Economic Analysis, Regional Economic Information System, Table CA25N, accessed October 19, 2014.
US Census Bureau, 2000 SF3 sample data , Table DP-3, accessed via American FactFinder, October 19, 2014.
US Census Bureau, 2008-2012 ACS 5-Year Estimate , Table DP03, Table B08007, Table , Table S0801, Table B15002, accessed via American FactFinder, October 19,
2014.
District Summary (2013-2014), Data Analysis and Accountability, Illinois State Board of Education, accessed on September 17, 2014,
http://www.isbe.net/research/htmls/fall_housing.htm.
"Essentially SRC Report." Spoon River College. Accessed October 19, 2014. http://www.src.edu/about/Pages/reports.aspx.
Military Installations. Accessed October 19, 2014. http://www.militaryinstallations.dod.mil/pls/psgprod/f?p=MI:LOOKUP:0::::P3_VAL:MI.
Percentage (%)
44.9%
55.3%
49.5%
Civilian Employment

City County
Graham Health System Canton Fulton Hospital Headquarters 62 750 None NA
IL River Correctional
Center Canton Fulton
Correctional
Facility Headquarters 92 304 AFSME 97.0%
Canton Union School
District #66 Canton Fulton Public School Headquarters 61 345 CEA/IEA 94.2%
Walmart Canton Fulton Retail Store Headquarters 44 160 None NA
HyVee Food Store Canton Fulton Retail Store Regional Office 44 150 None NA
Spoon River College Canton Fulton Public College Headquarters 61 140 IEA 46.4%
Cook Medical Canton Fulton
Medical
Manufacturing
Branch Manufacturing
Plant 33 130 None NA
City of Canton Canton Fulton Government Headquarters 92 127 AFSME/IAFF 68.5%
Renaissance Care Center Canton Fulton Nursing Care Headquarters 62 125 None NA
MidAmerica National Bank Canton Fulton Bank Headquarters 52 70 None NA
Cook Medical Canton Fulton
Medical
Manufacturing
Branch Manufacturing
Plant 33 130 None NA
Davis Buick GMC, Inc. Canton Fulton Car Dealers Headquarters 44 30 None NA
Davis Ford, Inc. Canton Fulton Car Dealers Headquarters 44 25 None NA
MidAmerica National Bank Canton Fulton Bank Headquarters 52 70 None NA
Location
Back Offices Across all Sector
Distribution
% of # of
Union Workers
Manufacturing
NAICS
CodeProduct/Service
Table 3: Leading EmployersCanton, IL
Sector Company
FIRE
Union
Affiliation
All Sectors
EmploymentFunction

NA NA NA NA NA NA NA NA NA
Sources:
ESRI Business Analyst Online. Accessed September 4, 2014. https://bao.arcgis.com/.
"Employment." Fulton County. Accessed September 4, 2014. http://www.fultonco.org/work-here/fulton-county-employment/.
"North American Industry Classification System." US Census Bureau. Accessed September 4, 2014. http://www.census.gov/cgi-bin/sssd/naics/naicsrch?chart=2012.
Phone interview of employers, conducted in October 2014.

City County
Last Year NA NA NA NA NA NA NA NA NA
Two Years Ago NA NA NA NA NA NA NA NA NA
Three Years Ago NA NA NA NA NA NA NA NA NA
Last Year NA NA NA NA NA NA NA NA NA
Two Years Ago NA NA NA NA NA NA NA NA NA
Last Year NA NA NA NA NA NA NA NA NA
Two Years Ago NA NA NA NA NA NA NA NA NA
Sources:
Table 4: New/Expanding Companies Canton, IL
LocationCompanyType & Year Product/Service Function
NAICS
Code Year
50 or More Employees
New to the AreaEmployment Union Affiliation
Downsizing/Closing/Layoff
Expansions/New Facilities
ESRI Business Analyst Online. Accessed September 4, 2014. https://bao.arcgis.com/.
"Archived WARN Notices." Illinois Worknet Center. Accessed October 23, 2014. http://www2.illinoisworknet.com/LayoffRecovery/Pages/ArchivedWARNReports.aspx.
"Employment." Fulton County. Accessed September 4, 2014. http://www.fultonco.org/work-here/fulton-county-employment/.
"North American Industry Classification System." US Census Bureau. Accessed September 4, 2014. http://www.census.gov/cgi-bin/sssd/naics/naicsrch?chart=2012.
Phone interview of employers, conducted in October 2014.

City County
Occupation
Category #
NA NA NA NA NA NA NA NA NA NA
Sources:
Table 5: Military Base and InstallationsCanton, IL
Base/
Installation
Branch of
Service
Description of
Operations
Location Total
Civilian
Personnel
Total
Military
Personal
Average # of
Retiring/Separating
Military Personnel Per year Status:
Closing or
Expanding
Military Installations. Accessed October 19, 2014. http://www.militaryinstallations.dod.mil/pls/psgprod/f?p=MI:LOOKUP:0::::P3_VAL:MI.

City County
R & D
Personnel
Total
Employees
NA NA NA NA NA NA NA NA
Sources:
Phone interview with City and County Governments and Spoon River College, conducted in October 2014.
Table 6: Research BaseCanton, IL
Affiliation (e.g. Corporate,
Non-Profit, University,
Government, etc.)
Research
Specialty
Annual
Funding (If
Available)Name of Center
Location Employment

Under
Graduate Graduate
City County Full-Time Full-Time
Engineering
Math
Medical
Dental
Pharmaceutical
Veterinary
MIS/Comp. Sci.
Business
Chemistry
Biology/Animal &
Science Botany
Physics
Other
Sources:
Phone interview with City and County Governments and Spoon River College, conducted in October 2014.
NA NA NA NA NA NA
Part-
Time Program
Under
Graduate
NA NA NA NA NA
Total Annual GraduatesEnrollment
Table 7: Four Year InstitutionsCanton, IL
Location
Graduate TotalName of Institution Total Full-Time
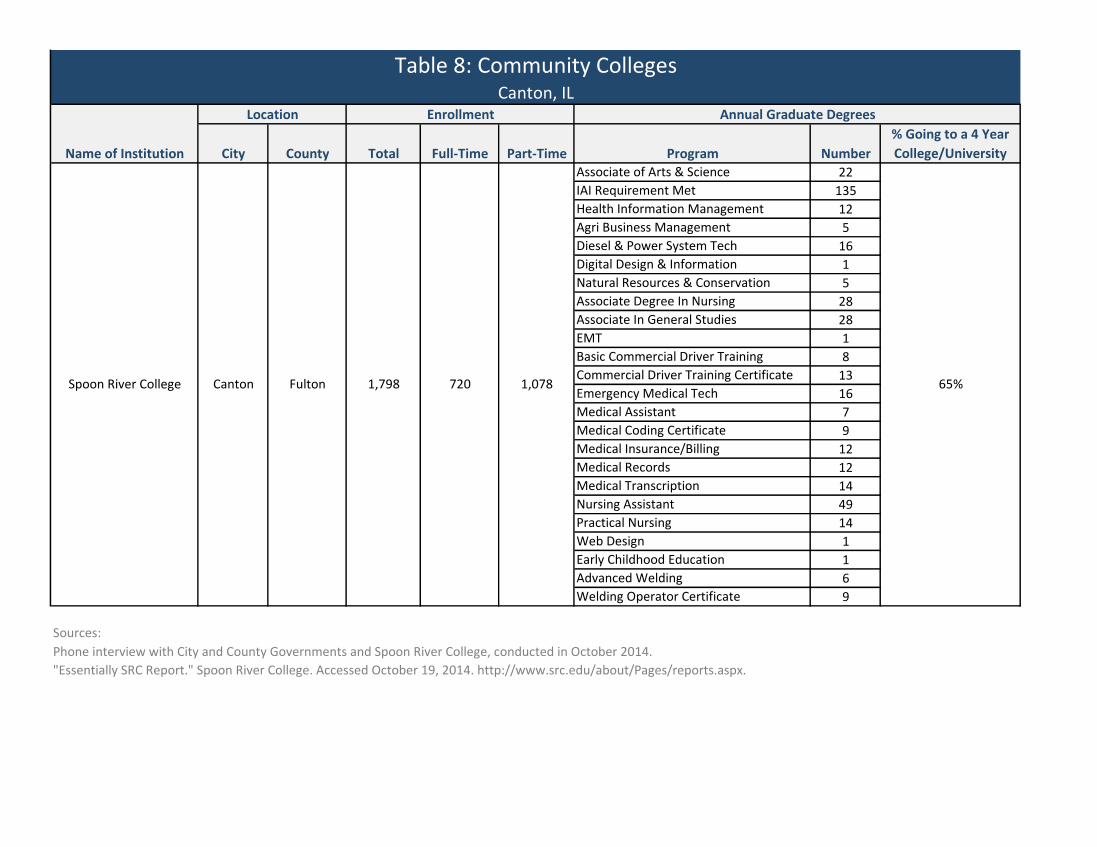
City County Total Full-Time Part-Time Program Number
% Going to a 4 Year
College/UniversityAssociate of Arts & Science 22
IAI Requirement Met 135
Health Information Management 12
Agri Business Management 5
Diesel & Power System Tech 16
Digital Design & Information 1
Natural Resources & Conservation 5
Associate Degree In Nursing 28
Associate In General Studies 28
EMT 1
Basic Commercial Driver Training 8
Commercial Driver Training Certificate 13
Emergency Medical Tech 16
Medical Assistant 7
Medical Coding Certificate 9
Medical Insurance/Billing 12
Medical Records 12
Medical Transcription 14
Nursing Assistant 49
Practical Nursing 14
Web Design 1
Early Childhood Education 1
Advanced Welding 6
Welding Operator Certificate 9
Sources:
Table 8: Community CollegesCanton, IL
Name of Institution
Location Enrollment Annual Graduate Degrees
Phone interview with City and County Governments and Spoon River College, conducted in October 2014.
"Essentially SRC Report." Spoon River College. Accessed October 19, 2014. http://www.src.edu/about/Pages/reports.aspx.
65%Spoon River College Canton Fulton 1,798 720 1,078

City County Total Full-Time Part-Time Program Certificate Degree
Machine Trades NA NA
Electronic Tech. NA NA
Medical/Lab NA NA
Engineering NA NA
Programming/ NA NA
Computer Sci. NA NA
Printing NA NA
Graphic Arts NA NA
Plastics Tech. NA NA
Cust. Service NA NA
Office Science NA NAOther: Cosmetology
and Cosmetology
Instructor (1 year
program) NA 50
Machine Trades NA NA
Electronic Tech. NA NA
Medical/Lab: Diploma
in Nursing (3 year
program) NA 18
Engineering NA NA
Programming/ NA NA
Computer Sci. NA NA
Printing NA NA
Graphic Arts NA NA
Plastics Tech. NA NA
Cust. Service NA NA
Office Science NA NA
Other NA NA
Sources:
Location Enrollment Annual # of Graduates
Excluding Community Colleges
Graham Hospital School
of NursingCanton Fulton 82 82 0
Table 9: Vocational/Training Center ResourcesCanton, IL
Name of Institution
05252FultonCantonInnovations Design
Academy

Phone interview with City and County Governments, Spoon River College, Graham Hospital School of Nursing and Innovations Design
Academy conducted in October 2014.
Innovations Design Academy. Accessed October 26, 2014. http://idahair.com/.
Graham Hospital School of Nursing. Accessed October 26, 2014. http://grahamschoolofnursing.org/.

Average Annual Salary by Major Industry1
Current Year Salary
Number of
Employees
Mining 2014 $43,350 4
Construction 2014 $2,318,423 242
Manufacturing 2014 $2,090,479 324
Transportation & Public Utilities 2014 $1,627,670 172
FIRE 2014 $4,014,452 432
Wholesale Trade 2014 $3,248,805 265
Retail Trade 2014 $6,425,997 1185
Services 2014 $20,147,406 2977
Government 2014 $19,086,688 2150
$59,003,270 7751
Sources:
Notes:1Average annual salary data is for Fulton County, IL. Average annual salary data is not available on city level.
Total Wages Paid Divided by Number of Employees
Total
Canton, IL
Table 10: Available Payroll Costs by Industry
$7,612
"Quarterly Census of Employment & Wages (QCEW)." Illinois Department of Economic Security. Accessed October
26, 2014. http://www.ides.illinois.gov/LMI/Pages/Quarterly_Census_of_Employment_and_Wages.aspx.

Occupation
# of Surveyed
Firms
# of Covered
Employees
Average
Hire-In Rate
Average
Minimum
Weighted
Average
Salary
Average
Median
Salary
Average
Maximum
Salary
Accountant1NA NA $16.89 $35,122 NA $50,062 $54,008
Management Trainee1NA NA $20.00 $41,600 NA $58,951 $78,784
Programmer/Analyst2NA NA $23.70 $49,298 NA $66,063 $75,752
Engineer1
NA NA $26.10 $54,282 NA $73,707 $81,016
Retail Store Clerk1NA NA $9.24 $19,224 NA $21,658 $28,354
Stock Room Clerk1NA NA $8.72 $18,139 NA $19,680 $25,277
Hospitality Clerk2NA NA $8.77 $18,245 NA $22,431 $32,480
Customer Service Rep.1NA NA $8.91 $18,527 NA $19,645 $36,307
Telesales Rep.2NA NA $11.97 $24,906 NA $48,904 $74,334
Data Entry Clerk2NA NA $8.81 $18,330 NA $25,086 $30,470
Executive Secretary1NA NA $13.57 $28,221 NA $37,101 $47,119
Accounting Clerk1NA NA $11.27 $23,448 NA $29,110 $35,249
Word Processor1NA NA $9.84 $20,475 NA $23,991 $30,676
General Laborer1NA NA $12.71 $26,427 NA $27,371 $28,751
Warehouse Person1NA NA $12.71 $26,427 NA $27,371 $28,751
Hand Packer2
NA NA $8.77 $18,251 NA $21,394 $26,082
Material Handler1NA NA $12.71 $26,427 NA $27,371 $28,751
Light Assembly2NA NA $14.44 $30,044 NA $36,318 $44,819
Machine Operator3
NA NA $13.16 $27,377 NA $36,865 $43,757
Fork Lift Operator2NA NA $11.52 $23,953 NA $33,667 $40,676
Machine Maintenance2NA NA $15.96 $33,193 NA $49,948 $54,573
Tool & Die2NA NA $18.49 $38,464 NA $53,905 $59,296
Machinist2NA NA $11.06 $23,010 NA $35,644 $42,914
Semi-Skilled
Skilled
Table 11: Average Salary by Selected OccupationCanton, IL
Professional
Retail
Clerical
Unskilled

Welder1NA NA $15.44 $32,113 NA $35,442 $38,455
Numerical Control Machine Programmer3NA NA $13.16 $27,377 NA $36,865 $43,757
Electronic Technician2NA NA $19.83 $41,240 NA $66,120 $75,066
Medical Laboratory Technician2NA NA $11.80 $24,547 NA $31,001 $39,812
Network Technician1NA NA $18.40 $38,266 NA $43,198 $44,945
Office Manufacturing
Average Work Week in Hours 40 40
Annual Average Turnover % 1% 5%
Sources:
Notes:
Technical
"Open Occupational Employment Statistics (OES)." Department of Economic Security. Accessed October 26, 2014.
http://www.ides.illinois.gov/LMI/Pages/Occupational_Employment_Statistics.aspx.
Phone interview with manufacturing companies and bank offices conducted in October 2014.
1Wage information for Fulton County,IL. Wage data is not available on city level.2Wage information for Local Workforce Area 16. 3Wage information for Peoria MSA.

Average Cost for All Manufacturing per $100 Payroll $7.59
Average Rate for Office Workers (8810) $0.32
Maximum Weekly Benefit $1,341.07
Taxable Base $12,960
Rate % 0.55% to 8.55%
Average Among Existing Employers 4.15%
Average Among New Employers 3.95%
Maximum Weekly Benefit $562
Sources:
Unemployment Insurance
Workers Compensation
Table 12: Workers Compensation and Unemployment InsuranceCanton, IL
"State Comparisons." Forward Wisconsin. Accessed October 27, 2014. http://www.forwardwi.com/category45/State-
Comparisons.
"Benefit Rates." Illinois Workers' Compensation Commission. Accessed October 27, 2014.
http://www.iwcc.il.gov/benefits.htm.
"State Unemployment Compensation." Accessed October 27, 2014. http://www.infoplease.com/business/economy/state-
unemployment-compensation.html.

Is the State Right to Work
All Workers
Manufacturing
Union Elections - Companies w/50 or more Employees, Last 5 Years Number
# and % Won by Unions in Manufacturing 0
# and % Won by Unions in Distribution 0
# and % Won by Unions in F.I.R.E. 0
# and % Won by Unions in All Sectors 0
Union Elections - Companies w/50 or more Employees
(Listing by Company, Last 5 Years)Company Name NA
Union Involved NA
Industry NAICS Code NA
Number of Votes For Union NA
Number of Votes Against Union NA
Strikes & Work Stoppages
Number
Average Duration
Strikes by Company (Listing by Company)
Company Name
Industry NAICS Code
Union Involved
# of Striking Workers
Duration of Strike
Strike Called by National or Local Union
Sources:
0.0%
% of Workforce Organized
Last Five Years Including 50 or More Employees
Last Five Years
% Won by Union
NA
NA
Union NAICS Code Date
Table 13: Labor Management RelationsCanton, IL
No
16.3%
13.4%
NA NA
0.0%
0.0%
0.0%
National Right to Work Legal Defense Foundation. Accessed October 29, 2014. http://www.nrtw.org/.
Union Facts. Accessed October 29, 2014. https://www.unionfacts.com/.
Union Membership and Coverage Database. Accessed October 29, 2014. http://www.unionstats.com/.
"Election Reports." National Labor Relations Board. Accessed October 29, 2014. http://www.nlrb.gov/reports-guidance/reports/election-
reports.
Phone interview of employers, conducted in October 2014.
NA
NA
NA
NA
NA
NA

Metro Area Miles
1 Peoria, IL (Peoria, Illinois metropolitan area) 32
2 Macomb, IL (Macomb, Illinois micropolitan area) 40
3 Galesburg, IL (Galesburg, Illinois micropolitan area) 40
4 Lincoln, IL ( Lincoln, Illinois micropolitan area) 64
5 Bloomington, IL (Bloomington, Illinois metropolitan area) 67
# of Common Carriers Serving the Area 22
# of Common Carriers with Local Terminals 22
Name Keokuk Junction Railway Co.
Main or Branch Line Main
Shortline or National Shortline
Nearest Switching Yard (miles) 32
Name Burlington Northern Santa Fe (BNSF)
Main or Branch Line Main
Shortline or National National
Nearest Switching Yard (miles) 41
Name General Wayne A. Downing Peoria International Airport
Hub Status N
Distance from the Community in Miles 30 miles
# of Runways 2
Runway Lengths Runway 13/31 - 10104 ft; Runway 4/22 - 8004 ft
Carriers (Names) Serving Airport
Passenger Allegiant, American, Delta, United
Charter Byerly Aviation, Peoria Aviation
Air Cargo Federal Express, UPS, Emery, DHL
Approved Capital Expansion Plan No
Major 2 or 4 Lane Highways Linking the Areas, indicate if City, County, State, US or Interstate - Canton is served by U.S. Route 24,
and Illinois Routes 9, 78, and 100
Table 14: Transportation
Major 2 or 4 Lane Highways Linking the Areas, indicate if City, County, State, US or Interstate
Distance in Miles to the Five Nearest Metro Areas
Motor Carriers/Trucks
Canton, IL
Railroads (by Rail Carrier)
Commercial Airport
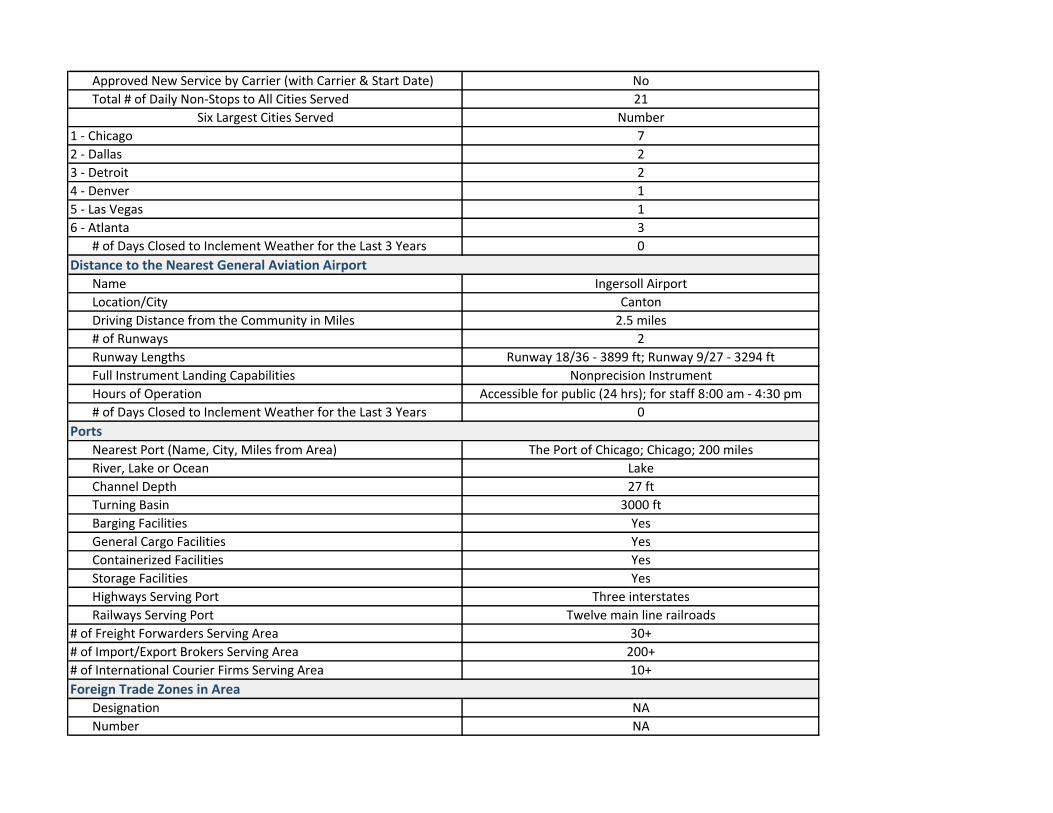
Approved New Service by Carrier (with Carrier & Start Date) No
Total # of Daily Non-Stops to All Cities Served 21
Six Largest Cities Served Number
1 - Chicago 7
2 - Dallas 2
3 - Detroit 2
4 - Denver 1
5 - Las Vegas 1
6 - Atlanta 3
# of Days Closed to Inclement Weather for the Last 3 Years 0
Name Ingersoll Airport
Location/City Canton
Driving Distance from the Community in Miles 2.5 miles
# of Runways 2
Runway Lengths Runway 18/36 - 3899 ft; Runway 9/27 - 3294 ft
Full Instrument Landing Capabilities Nonprecision Instrument
Hours of Operation Accessible for public (24 hrs); for staff 8:00 am - 4:30 pm
# of Days Closed to Inclement Weather for the Last 3 Years 0
Nearest Port (Name, City, Miles from Area) The Port of Chicago; Chicago; 200 miles
River, Lake or Ocean Lake
Channel Depth 27 ft
Turning Basin 3000 ft
Barging Facilities Yes
General Cargo Facilities Yes
Containerized Facilities Yes
Storage Facilities Yes
Highways Serving Port Three interstates
Railways Serving Port Twelve main line railroads
# of Freight Forwarders Serving Area 30+
# of Import/Export Brokers Serving Area 200+
# of International Courier Firms Serving Area 10+
Designation NA
Number NA
Distance to the Nearest General Aviation Airport
Foreign Trade Zones in Area
Ports
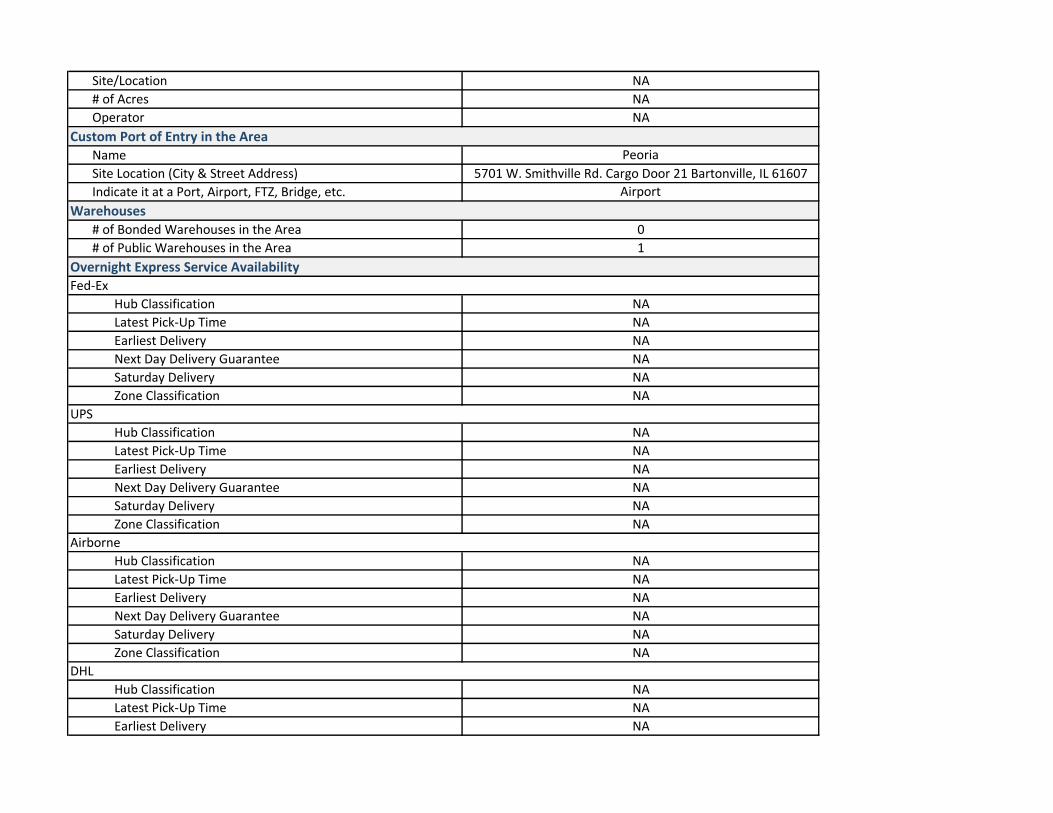
Site/Location NA
# of Acres NA
Operator NA
Name Peoria
Site Location (City & Street Address) 5701 W. Smithville Rd. Cargo Door 21 Bartonville, IL 61607
Indicate it at a Port, Airport, FTZ, Bridge, etc. Airport
# of Bonded Warehouses in the Area 0
# of Public Warehouses in the Area 1
Hub Classification NA
Latest Pick-Up Time NA
Earliest Delivery NA
Next Day Delivery Guarantee NA
Saturday Delivery NA
Zone Classification NA
Hub Classification NA
Latest Pick-Up Time NA
Earliest Delivery NA
Next Day Delivery Guarantee NA
Saturday Delivery NA
Zone Classification NA
Hub Classification NA
Latest Pick-Up Time NA
Earliest Delivery NA
Next Day Delivery Guarantee NA
Saturday Delivery NA
Zone Classification NA
Hub Classification NA
Latest Pick-Up Time NA
Earliest Delivery NA
DHL
Fed-Ex
Custom Port of Entry in the Area
Warehouses
Overnight Express Service Availability
UPS
Airborne

Next Day Delivery Guarantee NA
Saturday Delivery NA
Zone Classification NA
Nearest General Mail Canton Post Office
Latest Pick-Up Time 8:30 AM
Earliest Delivery Overnight
Next Day Delivery (specify States) All US states (may take up to 2 days)
Nearest Bulk Mail Facility Canton Post Office
Sources:
"Transportation." Fulton County. Accessed October 31, 2014. http://www.fultonco.org/economic-development/transportation/.
Google Maps. Accessed October 31, 2014. https://www.google.com/maps.
Office of Management and Budget. Accessed October 31, 2014.
http://www.whitehouse.gov/sites/default/files/omb/bulletins/2013/b-13-01.pdf.
"Canton Trucking Companies." Quick TSI. Accessed October 31, 2014.
http://www.quicktransportsolutions.com/carrier/illinois/canton.php.
"National Plan of Integrated Airport System (2015-2019)." Federal Aviation Administration. Accessed October 31, 2014.
http://www.faa.gov/airports/planning_capacity/npias/reports/media/npias-2015-2019-report-appendix-a.pdf.
Accessed October 31, 2014. http://www.airnav.com/.
Peoria International Airport. Accessed October 31, 2014. https://www.flypia.com/.
Illinois International Port District. Accessed October 31, 2014. http://iipd.com/.
Directory of Freight Forwarding Services. Accessed October 31, 2014. http://www.forwarders.com/StateDirectory/IL.html.
Chicago Customs Brokers and Forwarders Association. Accessed October 31, 2014. http://www.ccbfa.org/.
Danex Marketing & Business Resources. Accessed October 31, 2014. http://www.danex-exm.dk/courier-delivery-services.htm.
Enforcement and Compliance. Accessed October 31, 2014. http://enforcement.trade.gov/ftzpage/letters/ftzlist-map.html#illinois.
US Customs and Border Protection. Accessed October 31, 2014. http://www.cbp.gov/contact/ports/peoria.
Leonard’s Guide. Accessed October 31, 2014. http://www.leonardsguide.com/lgo/warehouse-companies/illinois.shtml.
FedEx. Accessed October 31, 2014. http://www.fedex.com/.
UPS. Accessed October 31, 2014. http://www.ups.com/.
Airborne. Accessed October 31, 2014. http://www.alpl.in/.
US Post Office. Accessed October 31, 2014. https://www.usps.com/.
Phone conversation with county and city governments, Keokuk Junction Railway, BNSF, Peoria International Airport, Ingersoll
Airport and Canton Post Office, conducted in October 2014.
United States Post Office


Corporate Income Tax/Franchise Tax State Local
Rate (range) 9.50% None
Formula (e.g. Sales, Property & Payroll)
7.00% income tax and 2.50%
replacement taxNone
Federal Taxes Deductible No NA
Accelerated Depreciation Permitted (Yes or No) No NA
Personal Income Tax State LocalRate (Range) 5.00% flat None
Earned Income 5.00% None
Unearned Income (e.g. Dividend) 5.00% None
Local Occupation Tax (Paid by Employee) Rate BasisCity Residents None NA
Non-City Residents None NA
Local Wage Tax (Paid by Employer) Rate BasisCity Residents None NA
Non-City Residents None NA
None
State 6.25%
Local 2.00%
Total 8.25%
Electric Power 5.00%
Natural Gas 5.00%
Fuel Oil 5.00%
Water None
Sewer None
Hazardous Waste Disposal NA
Local 12.00%
Long Distance In State 12.00%
Long Distance Out of State 12.00%
Production Exempt
Gross Receipts Tax Rate by Type of Business
Machinery & Equipment Subject to Sales/Use Tax
Table 15: TaxationCanton, IL
Sales/Use Tax Rate
Telephone
Sales Tax Rate by Utility:

Non-Production Exempt
Pollution Control Exempt
Office Furniture/Fixtures/Equipment Not Exempt
Office Building Construction Materials No
Industrial Building Construction Materials No
Manufacturers' Raw Materials No
Standard Software Yes
Custom Software Yes
Describe What is Subject to Tax Rate (e.g. Accounts
Receivable, Capital Stock)None
Basis & Rate None
Stock Bond Transaction Fee (Yes or No & its Yes Rate) None
Major Employment Centers Canton
City Millage 1.999%
County Millage 1.727%
School Millage 4.593%
Special District Millage 1.485%
Assessment Ratio (%) 31.650%
Effective Rate per $100 3.103%
City Millage None
County Millage None
School Millage None
Special District Millage None
Assessment Ratio (%) None
Effective Rate per $100 None
Real Property None
Personal Property (machinery/equipment) None
Rate None
Basis & Rate None
Taxable Items None
Rate for Each Item None
Real Property Tax Rates for Jurisdictions Featuring
Intangible Property
State Property Tax Effective Rate per $100
Property Tax After Core Income Tax
Personal Property Tax Rates per $100
Property Tax After Core Income Tax & State Excise Tax
Sales/Use Tax (Yes or No) on

Production Machinery & Equipment None
Non Production Machinery & Equipment None
Pollution Control None
Inventory None
Raw Materials None
Work in Progress None
Finished Goods None
Freeport Legislation None
Applicable to Warehousing None
Applicable to Manufacturing None
Goods Stored in a Public Warehouse None
Office Furniture-Fixtures None
Computer Equipment None
Workstations None
Telephones None
Furniture None
Company Vehicles None
Standard Software None
Custom Software None
Sources:
Illinois Department of Revenue. Accessed November 2, 2014. http://www.revenue.state.il.us/.
Phone conversation with Illinois Department of Revenue, Water and Wastewater departments of City of Canton,
conducted in October 2014.
Subject to Personal Property Tax

Business Parks Total Acreage Available Acreage
Industrial 796 NA
Office 337 NA
Research NA NA
Mixed Use NA NA
# of Fully Serviced Freestanding Sites NA NA
Ten Plus Acres of Industrial Zoned 780 NA
Five Plus Acres of Office Zoned 312 NA
Average Cost Per Acre for Fully Developed Sites City (non CBD) Suburban
Industrial $2,640,237 NA
Office $510,549 NA
Average Asking Rents (Gross Rent Per Square Foot) City (non CBD) Suburban Total Weighted Average
Class A Office
Class B Office
Class C Office
Warehouse $0.60 NA $0.60
Industrial $0.15 NA $0.15
Vacancy Rates % City (non CBD) Suburban Total Weighted Average
Class A Office
Class B Office
Class C Office
Warehouse 0% NA 0%
Industrial 0% NA 0%
City Suburban Total City Suburban Total City Suburban Total
Less than 25,000 0 0 0 0 0 0 5 0 5
25 - 49,999 0 0 0 0 0 0 0 0 0
49 - 99,999 0 0 0 0 0 0 0 0 0
100 - 149,999 0 0 0 0 0 0 0 0 0
150 - 199,999 0 0 0 0 0 0 0 0 0
200 - 249,999 0 0 0 0 0 0 0 0 0
250,000 or Higher 0 0 0 0 0 0 0 0 0
Applicable Building Code NA NA NA NA NA NA Canton NA Canton
Office Industrial
Average Length of Time for Local Permit Approvals
(routine projects)1 day 3 days
Certificate Occupancy 1 day 3 days
Building Permit 1 day 3 days
Environmental 1 day 1 day
Sources:
Peoria Area Commercial Real Estate Property Search. Accessed October 5, 2014. http://www.paarealtors.com/search/commercial_search.asp.
Phone conversation with Canton Planning and Zoning Department, real estate agents in Fulton County and local business, conducted in October 2014.
NA
NA<5% <5%
$0.65
Table 16: Occupancy/SupplyCanton, IL
Name of Buildings Available By Size of Range (in
Square Feet)
IndustrialWarehouseOffice
$0.65

Major Source
% of Population Increase Served from the Source
Name of Provider
Rated Capacity (mgd)
Average Daily Demand (mgd)
Peak Demand (mgd)
Chemical Breakdown of Water
Cost per 1000 Gallons
Water Connection Fee
Name of Provider
Type of Service
Rated Capacity (mgd)
Average Daily Demand (mgd)
Peak Demand (mgd)
Cost per 1000 Gallons
Sewer Connection Fee
Name of Company
Communities Served
Company-Net Importer or Exporter of Power
% of Reserve Margin Including Generation & Net Purchases
Name of Power Pool Membership
State Electric Power Deregulated (yes or no, if yes provide date)
Average Cost per kWh (cents) Small Medium Large
50 kW & 18,000 kWh 300 kW & 140,000 kWh 750 kW & 260,000 kWh
Industrial
Name of Provider
Average Cost for Industrial Users ($ per mcf)
Firm Contract Rates
Distribution Delivery Charge for general service: $3.289/kW for Primary Supply
Voltage; $0.891/kW for High Supply Voltage; $1.491/kW for +100 kV Supply
Voltage
Natural Gas
Midcontinent (MISO)
Yes, 1997
Ameren Illinois
$0.75/mcf to receive gas supply from the Company, $0.40/mcf to receive gas
supply from a Retail Gas Supplier (Distribution Delivery Charge
for average daily uses of less than 19.5 mcf per day)
Variable (depends on contract)
Electric Power
Table 17: UtilitiesCanton, IL
Water & Sewer
Water AvailabilityRadial collector well down near Banner
25%
Water TreatmentCity of Canton WTP
4
2 to 2.2
3
PH 9.289, Total Alkalinity 166.2, Total hardness 199.3, Nitrate 2.2, Turbidity NTU
0.044, T.D.S. 103, Plant Fluoride 1.044, Total Phosphate 2.65
$6.89 per 1000 gal. plus a $6.00 base fee per month
$537.05
Sewer TreatmentCity of Canton POTW
Municipal Wastewater Treatment
Design average flow = 3.14 mgd, Max daily flow= 8.34 mgd
NA
NA
$5.90
$150.00
Ameren Illinois
1,186
Exporter
18%

Interruptible Service Rates
# of Local Service Providers
# of Long Distance Service Providers
Central Offices of Local Service Providers
Name City County Address
AT&T Canton Fulton 75 W Pine St
Switch Technology is Digital or Analog Digital
Fiber Service Provided Yes
Monitored Remotely or On-Site Remote
ISDN Availability
ISDN Available from this Switch Yes
ADS2 Available from this Switch Yes
Central Office on Self-Healing Fiber Ring Yes
Dual Feed from 2 Separate Switching Offices Likely Available No
Carrier City County Address
AT&T Peoria Peoria 320 Fulton St
Microwave or Hardwire Both
Dual Fiber Fee from the Central Switching Office of the Local Exchange Carrier Yes
Diverse Routing Available Yes
Tool & Die 0
Machine Shop 1
Welding 8
Office Equipment Service & Repair 1
Temporary Employment Services 0
Distance to Nearest General Mail Facility 0 miles
% of Mail On-Time 100%
Efficiency Rating NA
Guaranteed Service/Delivery Territory First Class Next Day 2nd Day
Yes Yes Yes
Nearest Bulk Mail Facility
Location & Distance from the Community Distance
0 miles
Sources:
Canton Post Office
Canton, IL
Location
1
Telecommunications
Points of Presence (POPs) of Long Distance Carriers
United States Post Office (Including Performance Ratings)
$0.61/mcf to receive gas supply from the Company, $0.35/mcf to receive gas
supply from a Retail Gas Supplier (Distribution Delivery Charge)
2
Business Support Services (#)

Accessed November 11, 2014. http://www.ameren.com/.
Accessed November 11, 2014. http://www.naics.com/.
Conversation with Water and Wastewater departments (Canton, Farmington and Lewistown), AT&T, Canton Post Office and Spoon River Cooperative in Fulton County,
conducted in October 2014.

Area in Attainment for Federal Air Pollution Regulations Yes No If No, Degree of Exceedence & Any Anticipated Change
Ozone Yes NA NA
Carbon Monoxide Yes NA NA
Particular Matter Yes NA NA
Lead Yes NA NA
Sulfur Dioxide Yes NA NA
Nitrogen Dioxide Yes NA NA
State Instituted a One-Stop Air & Water Quality Permitting System Yes NA NA
Average Permit Approval Time From Date of Completed Routine
Application
Average Time
Air Permit 1 year
Water Permit 6 months
Hazardous Waste Permit 6 months
Nearest Licensed Hazardous Waste Disposal Site Name of Site City Mileage from Service Area Class
Peoria Disposal Co # 1 Peoria 37 miles B
Number
4
Landfill Location (s) Capacity Left at Current Site(s) Plans for New Capacity
8 35 years NA
Contact Information Name of Agency Address Telephone # Fax #
Air Quality IEPA Peoria Office
412 SW Washington St.,
Suite D
Peoria, Illinois 61602 (309) 671-3022 (309) 671-3024
Water Quality IEPA Peoria Office
412 SW Washington St.,
Suite D
Peoria, Illinois 61602 (309) 671-3022 (309) 671-3024
Hazardous Waste IEPA Peoria Office
412 SW Washington St.,
Suite D
Peoria, Illinois 61602 (309) 671-3022 (309) 671-3024
Sources:
Illinois Environmental Protection Agency. Accessed November 4, 2014. http://www.epa.state.il.us/.
US Environmental Protection Agency. Accessed November 4, 2014. http://www.epa.gov/.
Google Maps. Accessed November 4, 2014. https://www.google.com/maps.
Phone conversation with Illinois Environmental Protection Agency , conducted in October 2014.
Table 18: EnvironmentalCanton, IL
# of Licensed Hazardous Waste Haulers Serving the Area

Form (Structure) Mayor-Aldermanic
# of Elected Officials 11
Mayor
Name Jeffrey Fritz
Years in Office 1
Next Election Date 2017
City Manager (Yes or No) No
Form (Structure) Commission
# of Elected Officials 7
Top Elected Officials
Name Mary Hampton
Title Circuit Clerk
Next Election Date 2016
Name Jim Nelson
Title Clerk/Recorder
Next Election Date 2014
Name Dave Demler
Title Regional Superintendent of Schools
Next Election Date 2015
Name Jeff Standard
Title Sheriff
Next Election Date 2014
Name John R. Clark
Title State's Attorney
Next Election Date 2016
Name Victoria Harper
Title Treasurer
Next Election Date 2014
Name Steve Hines
Title Coroner
Next Election Date 2016
County Manager (Yes or No) No
Table 19: GovernmentCanton, IL
City Government
County Government
State Government

Form (Structure) Illinois Executive Branch
# of Elected Officials 177
Upper House Representing Area (Senate) Senator Dave Koehler (46th Legislative District)
Total Statewide Upper House (Senate) 59 State Representatives
Lower House Representing Area (House of Representatives) Rep. Mike Unes
Total Statewide Lower House (House of Representatives) 118 Representatives (91st District)
Name Pat Quinn
Years in Office 4
Current Term Expiration Date Nov. 2014
Allowed to Run for Another Term (Yes or No) Yes
Next Election Date Nov. 2014
Congressional Districts Listed by District # in the Service Area (by District) Illinois's 17th congressional district
Name Cheri Bustos
Years in Office 2
Current Term Expiration Date 2014
Next Election Date 2014
Name Dick Durbin
Years in Office 18
Current Term Expiration Date 2014
Next Election Date 2014
Name Mark Kirk
Years in Office 4
Current Term Expiration Date 2014
Next Election Date 2014
Sources:
Fulton County elected officials. Accessed November 4, 2014. http://www.fultonco.org/officials/elected/.
Phone conversation with City of Canton and Fulton County Government, conducted in October 2014.
US Congresspersons Serving the Area
US Senators Serving Area
Governor
US Government Representation

Companies by Country of Ownership # of Companies Total Employment Country
NA NA NA NA
Associations
Name
Country Orientation
# of Members
Contact
Name
Title
Address
Foreign Institutions Number
Foreign Banks w/Branches or Offices in
the AreaNA
US Banks in the Area w/International
DepartmentsNA
Foreign Consulate by Country NA
Full Service NA
Honorary NA
# of Import/Export Brokers NA
# of International Courier Services in the
Area2
# of Language Translation Firms in the
AreaNA
Languages Spanish French German Chinese Japanese
# of People Fluent in a Second Language473
# of Elementary & Secondary Schools
w/Instruction Solely in another Language NA NA NA NA NA
# of Special Schools Geared to Families of
Foreign NationalitiesNA NA NA NA NA
NA
11**178*
NA
NA
NA
Business Associations Geared to
Specific Countries
Fraternal Associations
Geared to Specific Countries
NA
NA
NA
NA
NANA
NA
NA
Table 20: International ResourcesCanton, IL
NA
NA

International Air Transportation to: Name of Airport City Distance to
Airport
# of Weekly
Non-Stop
Flights
Canada NA NA NA
Mexico NA NA NA
South America NA NA NA
Europe NA NA NA
Asia NA NA NA
Australia NA NA NA
New Zealand NA NA NA
Dedicated Programs by Country or Region
for Each College/University
NA NA NA
Sources:
Notes:
Educational International Focus
"Transportation." Fulton County. Accessed October 31, 2014. http://www.fultonco.org/economic-development/transportation/.
Phone interview with City and County Governments, conducted in October 2014.
NA
*Speak Other Indo-European languages.
**Speak Asian and Pacific Islander languages.
Name of Airport Program Name

Average Daily Temperature High Low Average
July 86 66 76
January 33 17 25
Annual Average
Rainfall in Inches 37
Snowfall in Inches 25.1
Wind Speed in Miles per Hour (Annual
Average)
6.4
Number of Days Sunny or Partly
Sunny
193
Elevation (Mean Feet Above Sea
Level)
Range Average
662 662
Personal Income Tax (RATE in Ranges)
State
Local
Local Occupation Tax Rate Range Basis
City Residents None NA
Non-City Residents None NA
Sales Tax
Major Exemptions Machinery
State Rate 6.25%
Local Rate 1.50%
Housing
Single Family Townhouses Condominiums
107 0 1
Average Selling Prices New Existing
Table 21: Quality of LifeCanton, IL
Climate
Rate Range
5%
None
Number of Homes on the Market

Single Family Home 3,500 Sq. Ft.-4
BedroomsNA $115,407
2,500 Sq. Ft. - 3 Bedrooms NA $104,511
Townhouse 1,500 Sq. Ft. -
2BedroomsNA NA
Condominiums 1,200 Sq. Ft. 2- 2
BedroomsNA $69,900
Number of Single Family Homes for
Sale by Price
Under - $150,000 93
$150,001 - $200,000 9
$200,000 - $250,000 2
$250,001 - Over 3
Rentals Average Monthly
Executive Style 3,000 Sq. Ft. - 3
Bedroom Home
$400-$1000
New 2 Bedroom Apartment $400-$1000
Apartment Vacancy % <5%
Number of School Districts 1
Central City & Selected Suburban
School Districts
Canton
Elementary School Enrollment 1,863
Secondary School Enrollment 729
Spending per Student
Total $5,271
Instructional $14,224
Student Teacher Ratios
Elementary School Enrollment 16 Students/teacher
Secondary School Enrollment 12 Students/teacher
7th Grade Standard Achievement Test
Results
Test Name ISAT
Education

Average Score 57% meet or exceed
state standards
ACT
% of Students Taking the Test 100%Average Score 18
SAT
% of Students Taking the Test 5%Average Score NA
Number of Merit Scholarships
Semifinalists 0
Finalists 0
Ratio of Merit Scholarships per 100
Graduating Seniors
Semifinalists NA
Finalists NA
% of High School Seniors
Attending College 65%
Entering the Labor Market 35%
Mandatory Competency Testing for
High School Graduation (Yes or No) No
If Yes, % of Students Passing on
First AttemptNA
Science & Technology Magnet Schools NoSpecialized High Schools No
Tech Prep Programs Yes
Occupational Clusters or Career
Pathways
Yes
Vocational high Schools No
Private Schools No
Elementary School Enrollment
# of Schools 3
Total Enrollment 1,863
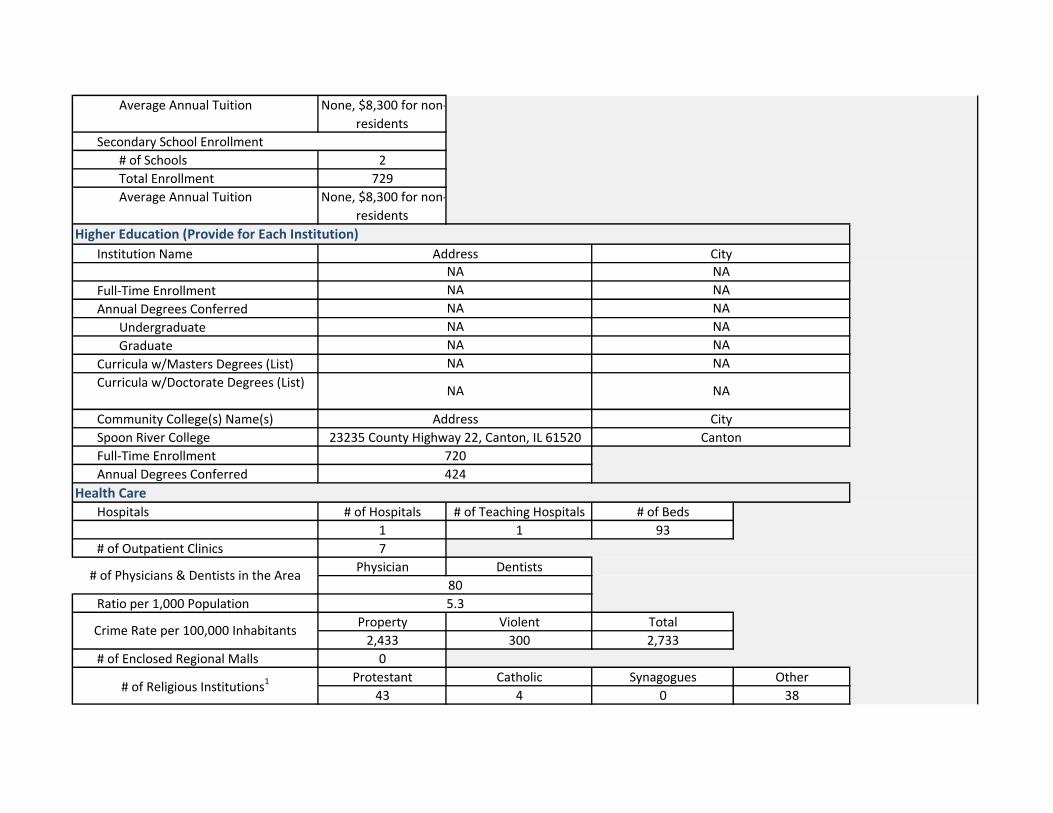
Average Annual Tuition None, $8,300 for non-
residents
Secondary School Enrollment
# of Schools 2
Total Enrollment 729
Average Annual Tuition None, $8,300 for non-
residents
Institution Name
Full-Time Enrollment
Annual Degrees Conferred
Undergraduate
Graduate
Curricula w/Masters Degrees (List)
Curricula w/Doctorate Degrees (List)
Community College(s) Name(s)
Spoon River College
Full-Time Enrollment
Annual Degrees Conferred
Hospitals # of Hospitals # of Teaching Hospitals # of Beds
1 1 93
# of Outpatient Clinics 7
Physician Dentists
Ratio per 1,000 Population
Property Violent Total
2,433 300 2,733
# of Enclosed Regional Malls 0
Protestant Catholic Synagogues Other
43 4 0 38
NA
NA
NA
Address City
NA
NA
NA
NA
Higher Education (Provide for Each Institution)
Health Care
NA
NA
Address
23235 County Highway 22, Canton, IL 61520
NA
NA
NA
5.3
Crime Rate per 100,000 Inhabitants
# of Religious Institutions1
720
424
NA
NA
# of Physicians & Dentists in the Area80
City
Canton

Major & Minor for College &
Professional Teams
Major Minor Major Minor
Football NA NA NA NA
Baseball NA NA NA NA
Basketball NA NA NA NA
Hockey NA NA NA NA
Soccer NA NA NA NA
Dates
First two weekends in
October
Friday of Father’s Day
Weekend in June
October
First Friday in
December 10, 2014
First full weekend in
June
# Of Cultural Places & Amenities Museums Dance Companies Symphony Orchestras Opera Companies Theater Companies
1 0 0 0 0
Recreational Outlets (Provide
Examples within a 2 Hour Drive)
Sources:
Sports
Culture
Canton Classic Cruisers Cruise In
Munchkin Masquerade
Old Fashioned Christmas Walk
Art on Main
College Professional
Anderson Lake State Conservation Area, Spoon River College Arboretum, Banner Marsh, Liverpool Boat Launch,
Bernadotte Park & Dam, Banner Boat Launch, Camp Emmanuel, Canton Lake, Big Creek Park, Goose Ranch, Fulton
County Camping & Recreation Area, Farmington Township Park, Lakeland Park, Mt. Pisgah Park, Rice Lake State
Conservation Area, Riverside Park and Duck Island
Top Five Annual Event
Event
Spoon River Valley Scenic Drive

Notes:1 Religious Institution Data is for Fulton County, IL.
Accessed November 6, 2014. http://www.weather.com/.
Accessed November 6, 2014. http://www.areavibes.com/.
Accessed November 6, 2014. http://www.bestplaces.net/.
"Communities." Fulton County. Accessed November 6, 2014. http://www.fultonco.org/live-here/experience-communities/.
"Tax Rate Database." Illinois Department of Revenue. Accessed November 6, 2014. http://www.revenue.state.il.us/TaxRates/.
"Illinois Tax Rate Finder." Illinois Department of Revenue. Accessed November 6, 2014. https://www.revenue.state.il.us/app/trii/.
"Residential Real Estate Home Search." Peoria Area Association of Realtors. Accessed November 6, 2014. http://www.paarealtors.com/search/index.asp.
Illinois State Board of Education. Accessed November 6, 2014. http://www.isbe.net/research/htmls/fall_housing.htm.
"Illinois Report Card 2013-2014." Illinois State Board of Education. Accessed November 6, 2014.
http://illinoisreportcard.com/District.aspx?source=Profile&Districtid=22029066025.
Accessed November 6, 2014. http://www.teachersalaryinfo.com/.
Spoon River College. Accessed November 6, 2014. www.src.edu/.
US Health News. Accessed November 6, 2014. http://health.usnews.com/.
"Uniform Crime Reporting Statistics ." US Department of Justice. Accessed November 6, 2014.
http://www.ucrdatatool.gov/Search/Crime/Local/JurisbyJuris.cfm.
Accessed November 6, 2014. http://www.mallseeker.com/.
Accessed November 6, 2014. http://www.city-data.com/county/religion/Fulton-County-IL.html.
Accessed November 6, 2014. http://www.50states.com/.
Fulton County Tourism. Accessed November 6, 2014. http://www.fultoncountytourism.org/.
Illinois Association of Museums. Accessed November 6, 2014. http://www.illinoismuseums.org/museums/.
Illinois Dance Studios. Accessed November 6, 2014. http://www.dancelessons.net/dancestudios/page312.html.
Illinois Council of Orchestras. Accessed November 6, 2014. http://www.ilcouncilorchestras.org/.
Accessed November 6, 2014. http://opera.stanford.edu/companies.html.
Illinois Theater Association. Accessed November 6, 2014. http://www.illinoistheatre.org/MemberDirectory/tabid/502/Default.aspx.
Phone interview with real estate agents, Graham Hospital, Canton School District and Spoon River College, conducted in October 2014.