a high-resolution, wave and current resource assessment … · a high-resolution, wave and current...
TRANSCRIPT
A High-Resolution, Wave and Current ResourceAssessment of Japan: The Web GIS Dataset
Adrean Webb∗, Takuji Waseda∗, Wataru Fujimoto∗, Kazutoshi Horiuchi‡, Keiji Kiyomatsu‡,Kazuhiro Matsuda§, Yasumasa Miyazawa†, Sergey Varlamov†, and Jun Yoshikawa§
∗Department of Ocean Technology, Policy, and EnvironmentThe University of Tokyo, 5-1-5 Kashiwanoha, Kashiwa, Chiba, Japan
[email protected], [email protected], [email protected]
†JAMSTEC-APL, 3173-25 Showa-machi, Kanazawa-ku, Yokohama-city, Kanagawa, [email protected], [email protected]
§Web-Brain, 2-3-6 Sotokanda, Chiyoda-ku, Tokyo, [email protected], [email protected]
‡Forecast Ocean Plus, 2-2-5 Kudanminami, Chiyoda-ku, Tokyo, [email protected], [email protected]
Abstract—The University of Tokyo and JAMSTEC have con-ducted state-of-the-art wave and current resource assessments toassist with generator site identification and construction in Japan.These assessments are publicly-available and accessible via aweb GIS service designed by WebBrain that utilizes TDS andGeoServer software with Leaflet libraries. The web GIS datasetcontains statistical analyses of wave power, ocean and tidalcurrent power, ocean temperature power, and other basic physicalvariables. The data (2D maps, time charts, depth profiles, etc.) isaccessed through interactive browser sessions and downloadablefiles.
Index Terms—wave resource assessment, ocean and tidal cur-rent resource assessment, ocean temperature resource assessment,web GIS, NOAA WAVEWATCH III, JCOPE-T
I. INTRODUCTION
With an extensive coastline and close proximity of theKuroshio current, Japan is an ideal candidate for wave andocean current energy extraction. Supported by New En-ergy and Industrial Technology Development Organization(NEDO), The University of Tokyo and JAMSTEC have con-ducted state-of-the-art wave and current resource assessmentsto assist with generator site identification and constructionin Japan. These marine renewable energy assessments arenow publicly-available and accessible via a web GIS servicedesigned by WebBrain and maintained by The University ofTokyo.
An English interface of the web GIS dataset is located athttp://www.todaiww3.k.u-tokyo.ac.jp/nedo p/en. The resourceassessments are located within the ‘webgis’ subdirectory,which can be accessed via the ‘Marine Energy Web GIS’menu button on the left side (http://www.todaiww3.k.u-tokyo.ac.jp/nedo p/en/webgis/). Useful information and referencescan also be found within the menu button categories ‘Manual’,‘FAQ’, and ‘Papers’.
TABLE ILIST OF RELEVANT VARIABLES AND DEFINITIONS.
Terminology Unit Long name
hm0 m Spectral significant wave heightfp Hz Peak frequencyt−1 s Wave energy period (inverse moment)θw deg Mean wave direction (meteorological)U10, U10, V10 m s−1 10 m wind vector and componentsPw1 kW m−1 Deep-water wave power densityPw3 kW m−1 Doppler-shifted wave power density
u, u, v m s−1 Current vector and componentsθc deg Current direction (oceanographic)mc % Current flow direction stabilityPc W/m2 Ocean current power density
T ◦C Water temperature∆T20
◦C Water temperature difference with20 m depth
PT W/m2 Ocean thermal power density
J [X,Y ] % Discrete joint probability distributionof X and Y
F [X] % Discrete frequency distribution of XFc [X ≥ x] % Relative cumulative frequency of X
greater than or equal to x
II. RESOURCE ASSESSMENTS
For full details of the resource assessments, please see [2]and [3], and other references listed under the ‘Papers’ category(http://www.todaiww3.k.u-tokyo.ac.jp/nedo p/en/papers/). Tofacilitate easy reference, relevant variables and definitionsfrom the assessments are tabulated in Table I.
arX
iv:1
607.
0225
1v1
[ph
ysic
s.ao
-ph]
8 J
ul 2
016

(a) Interactive map of NOWPHAS observation locations (b) Interactive map of a test site (Kamaishi)
(c) Sample download of J [hm0, t−1]
Zoom 12h 1d 1w 1m 6m 1y 3y All
wave
pow
er d
ensit
y : D
opple
r-sh
ifted
[kw/m
]
wave power density : Doppler-shifted釜石市,39.2900,142.0375
2010-07 2010-09 2010-11 2011-01 2011-03 2011-05
2000 2010
0
100
200
300
Highcharts.com
(d) Sample download of an interactive wave time series (Pw3)
Fig. 1. Sample of TodaiWW3 time series data available for 21 years (1994–2014). Screenshots of interactive maps are shown in (a) and (b) for the 82NOWPHAS locations and 11 test sites (respectively). Sample file downloads (for the selected sites) are shown in (c) joint probability distribution of significantwave height and wave energy period and (d) interactive time series of Pw3.
A. Wave resource assessment
The wave resource assessment (University of Tokyo) isbased on a large-scale NOAA WAVEWATCH III (ver-sion 4.18) simulation that includes several key componentsto improve model skill, such as a four-nested-layer approachfor high resolution and the addition of current effects in allwave power density calculations. The nearshore resolution ofeach model grid (24 on the lowest nest) is approximately 1 km,with a latitude-longitude grid cell size of 0.010◦ × 0.0125◦.Data from all the grids are post-processed and assembledinto a single grid, referred to as TodaiWW3 here. The mainsimulation covers a 21-year period (1994/01/0 to 2014/12/31)to reduce aleatory uncertainty [1] and required approximately3 million parallel process hours to run on The University ofTokyo FX10 supercomputer.
B. Current and temperature resource assessments
The ocean and tidal current and ocean temperature resourceassessments (JAMSTEC) are based on a high-resolution sim-ulation using JCOPE-T – a regional, 1/36◦ tide-resolving
model with 47 sigma levels (approximately 3 km in thehorizontal) that is nested within the data-assimilating, 1/12◦
non-tidal JCOPE2 model. The simulation covers a 10-yearperiod (2002/01/01 to 2011/12/31) and required approximately25 thousand parallel process hours to run on a JAMSTECNEC SX-9 supercomputer. Both assessments are referred toas JCOPE-T here.
III. DATA DISTRIBUTION
The marine renewable energy resource assessments aredistributed using web GIS, a newly-developed web map-ping service. The web GIS engine is a THREDDS DataServer (TDS) that provides remote access to the datasets(http://doi.org/10.5065/D6N014KG). Topographical data ishandled using GeoServer, an open geospatial informa-tion server (http://geoserver.org), and the user interfaceutilizes ‘Leaflet’, a browser and mobile mapping library(http://leafletjs.com/). The server comprises a 12-Core 2.5GHzCPU (Xeon E5-2680v3), 64GB RAM, 800GB SSD, and5×4TB HD (RAID5) hardware unit running CentOS 6.6; itis projected to handle a 10 concurrent user load.
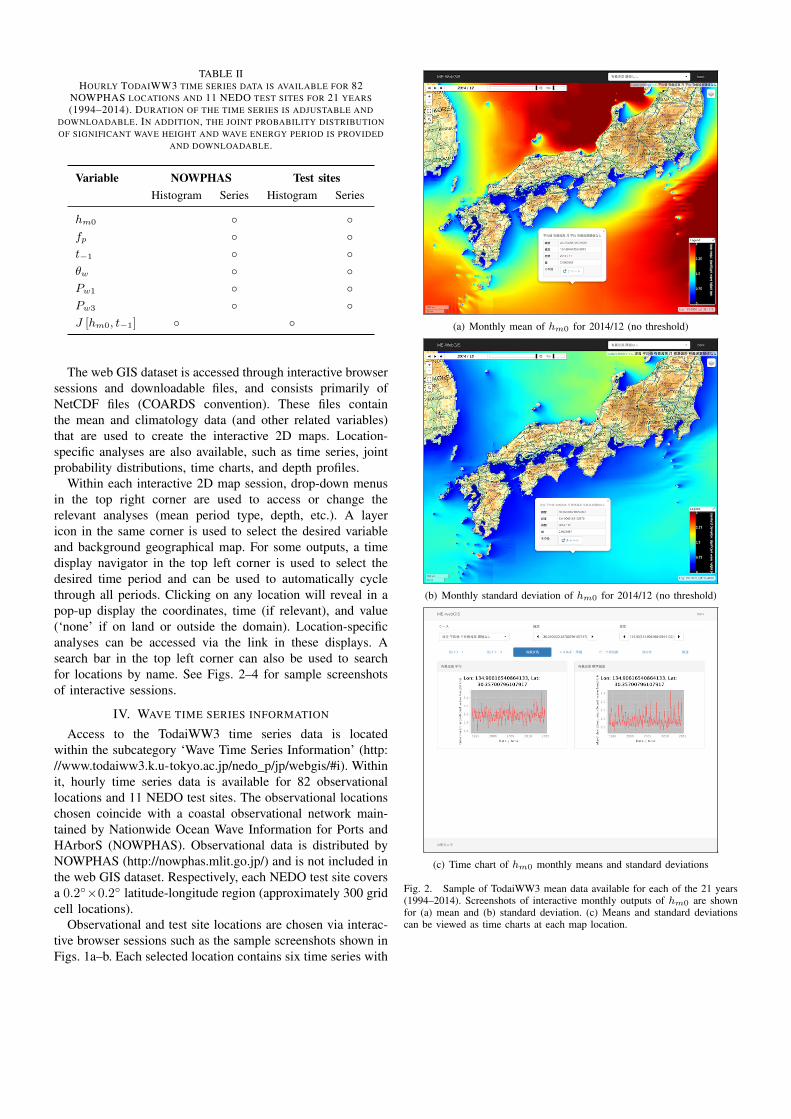
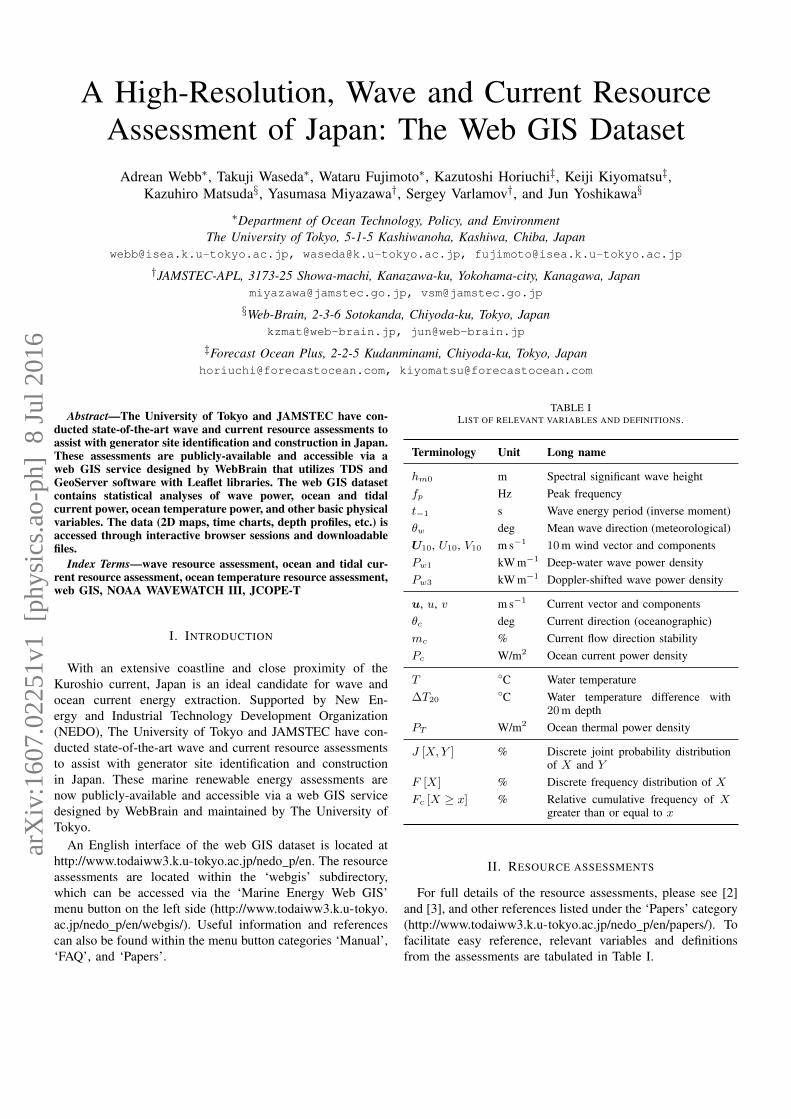
TABLE IIHOURLY TODAIWW3 TIME SERIES DATA IS AVAILABLE FOR 82
NOWPHAS LOCATIONS AND 11 NEDO TEST SITES FOR 21 YEARS(1994–2014). DURATION OF THE TIME SERIES IS ADJUSTABLE AND
DOWNLOADABLE. IN ADDITION, THE JOINT PROBABILITY DISTRIBUTIONOF SIGNIFICANT WAVE HEIGHT AND WAVE ENERGY PERIOD IS PROVIDED
AND DOWNLOADABLE.
Variable NOWPHAS Test sitesHistogram Series Histogram Series
hm0 ◦ ◦fp ◦ ◦t−1 ◦ ◦θw ◦ ◦Pw1 ◦ ◦Pw3 ◦ ◦J [hm0, t−1] ◦ ◦
The web GIS dataset is accessed through interactive browsersessions and downloadable files, and consists primarily ofNetCDF files (COARDS convention). These files containthe mean and climatology data (and other related variables)that are used to create the interactive 2D maps. Location-specific analyses are also available, such as time series, jointprobability distributions, time charts, and depth profiles.
Within each interactive 2D map session, drop-down menusin the top right corner are used to access or change therelevant analyses (mean period type, depth, etc.). A layericon in the same corner is used to select the desired variableand background geographical map. For some outputs, a timedisplay navigator in the top left corner is used to select thedesired time period and can be used to automatically cyclethrough all periods. Clicking on any location will reveal in apop-up display the coordinates, time (if relevant), and value(‘none’ if on land or outside the domain). Location-specificanalyses can be accessed via the link in these displays. Asearch bar in the top left corner can also be used to searchfor locations by name. See Figs. 2–4 for sample screenshotsof interactive sessions.
IV. WAVE TIME SERIES INFORMATION
Access to the TodaiWW3 time series data is locatedwithin the subcategory ‘Wave Time Series Information’ (http://www.todaiww3.k.u-tokyo.ac.jp/nedo p/jp/webgis/#i). Withinit, hourly time series data is available for 82 observationallocations and 11 NEDO test sites. The observational locationschosen coincide with a coastal observational network main-tained by Nationwide Ocean Wave Information for Ports andHArborS (NOWPHAS). Observational data is distributed byNOWPHAS (http://nowphas.mlit.go.jp/) and is not included inthe web GIS dataset. Respectively, each NEDO test site coversa 0.2◦×0.2◦ latitude-longitude region (approximately 300 gridcell locations).
Observational and test site locations are chosen via interac-tive browser sessions such as the sample screenshots shown inFigs. 1a–b. Each selected location contains six time series with
(a) Monthly mean of hm0 for 2014/12 (no threshold)
(b) Monthly standard deviation of hm0 for 2014/12 (no threshold)
(c) Time chart of hm0 monthly means and standard deviations
Fig. 2. Sample of TodaiWW3 mean data available for each of the 21 years(1994–2014). Screenshots of interactive monthly outputs of hm0 are shownfor (a) mean and (b) standard deviation. (c) Means and standard deviationscan be viewed as time charts at each map location.
TABLE III2D MAPS AND TIME CHARTS (AT EVERY MAP LOCATION) OF TODAIWW3
DATA ARE CALCULATED FOR SELECT PERIOD TYPES AND SIGNIFICANTWAVE HEIGHT THRESHOLDS. DIFFERENT MEAN/CLIMATOLOGY TYPES
(YEAR/SEASON/MONTH) ARE CALCULATED FOR EACH/ALL OF THE21 YEARS (1994–2014). MEAN/CLIMATOLOGY OF U10 REFERS TO
(〈U10〉, 〈V10〉). SEE SECTION V FOR DETAILS.
Variable Mean / ClimatologyType Threshold (hm0; m)
Year Season Month None 3 5 7 9
hm0 ◦ ◦ ◦ ◦ ◦ ◦ ◦ ◦fp ◦ ◦ ◦ ◦ ◦ ◦ ◦ ◦t−1 ◦ ◦ ◦ ◦ ◦ ◦ ◦ ◦θw ◦ ◦ ◦ ◦ ◦ ◦ ◦ ◦U10 ◦ ◦ ◦ ◦U10 ◦ ◦ ◦ ◦V10 ◦ ◦ ◦ ◦Pw1 ◦ ◦ ◦ ◦ ◦ ◦ ◦ ◦Pw3 ◦ ◦ ◦ ◦ ◦ ◦ ◦ ◦
adjustable durations in UTC format. See Table II for a full listof variables and Fig. 1d for a sample download. The 21-yearjoint probability distributions of significant wave height andthe wave energy period are also provided; see Fig. 1c for asample download. The time series data can be downloadedas a ‘png’, ‘jpeg’, ‘pdf’, ‘svg’, and ‘csv’ files while the jointprobability distributions can be downloaded as ‘png’ and ‘csv’files.
V. WAVE MAP INFORMATION
Access to the TodaiWW3 mean and climatology data is lo-cated within the subcategory ‘Wave Map Information’ (http://www.todaiww3.k.u-tokyo.ac.jp/nedo p/jp/webgis/#i-2) and isfurther subdivided by means and climatologies. Nine variablesare chosen and analyzed for online distribution; see Table IIIfor a full list. Since there is a high variability in wave powerdensity near Japan, five significant wave height thresholds –3m, 5m, 7m, 9m, and none – are applied when calculatingeach statistic and any corresponding value above this limit isignored (see Table III for applicability). As an example, winterclimatologies of the Doppler-shifted wave power density areshown both with a 5m threshold and without in Figs. 3a–b.
For each variable and threshold in Table III, three dif-ferent types of means or climatologies – annual, seasonal,and monthly (referred to as year, season, and month here-after) – are calculated for each or all of the 21 years.Winter, spring, summer, and autumn seasons are classifiedas months December–February, March–May, June–August,and September–November respectively. Means and standarddeviations (for select variables) are available both as 2Dmaps and time charts (at map locations); see Table IV fora list and Figs. 2a–c for examples. The 21-year climatologiesare available as 2D maps. In addition, mean maximums orminimums (at each map location) are available (for selectvariables) for their respective period type (year/season/month);
(a) Winter climatology of Pw3 with no hm0 threshold
(b) Winter climatology of Pw3 with a 5 m hm0 threshold
(c) Winter mean minimum of Pw3 with a 5 m hm0 threshold
Fig. 3. Sample of TodaiWW3 climatology map data available for a 21-yearperiod (1994–2014). Screenshots of interactive seasonal outputs of Pw3 areshown for two thresholds for (a) climatology (none), (b) climatology (5 m),and (c) mean maximum (5 m).

TABLE IVLIST OF 2D MAPS AND TIME CHARTS (AT EVERY MAP LOCATION)
AVAILABLE FOR TODAIWW3 MEAN AND CLIMATOLOGY DATA. ‘STD’ AND‘CLIM’ ARE SHORTHAND FOR STANDARD DEVIATION AND CLIMATOLOGY;
‘MAX’ AND ‘MIN’ REFER TO THE MEAN MAXIMUM AND MINIMUM ATEACH LOCATION. SEE SECTION V AND TABLE III FOR FURTHER DETAILS.
Variable Mean ClimatologyMap Chart Map
Mean Std Mean Std Clim Max Min
hm0 ◦ ◦ ◦ ◦ ◦ ◦ ◦fp ◦ ◦ ◦ ◦ ◦ ◦ ◦t−1 ◦ ◦ ◦ ◦ ◦ ◦ ◦θw ◦ ◦ ◦ ◦ ◦U10 ◦ ◦ ◦U10 ◦ ◦ ◦V10 ◦ ◦ ◦Pw1 ◦ ◦ ◦ ◦ ◦ ◦ ◦Pw3 ◦ ◦ ◦ ◦ ◦ ◦ ◦
see Table IV for a list and Fig. 3c for a mean maximumexample.
VI. CURRENT AND TEMPERATURE MAP INFORMATION
The ocean and tidal current and ocean temperatureresource assessments are accessible within the subcate-gory ‘Current and Temperature Map Information’ (http://www.todaiww3.k.u-tokyo.ac.jp/nedo p/jp/webgis/#i-3). Sixand three variables from each resource assessment (re-spectively) are chosen and analyzed for online distribution.In each assessment, each statistic is calculated for ninedepths, given by Dc=[1, 50, 100, 200, 400, 500, 700, 1000] andDT=[5, 50, 100, 200, 400, 500, 700, 1000] (respectively). SeeTable V for a full list of variables.
For each variable and depth in Table V, climatologies arecalculated for four different periods – year, season, LM, andNLM. As previously, ‘year’ and ‘season’ refer to annual andseasonal climatologies and cover the 10-year simulation. ‘LM’is shorthand for the large-meander Kuroshio path and coversthe period 2004/07/01 to 2005/07/31; ‘NLM’ is shorthand forthe non-large-meander Kuroshio path and covers the simula-tion period 2002/01/01 to 2011/12/31 which excludes LM.
The four different ocean current and temperature clima-tologies are accessible as interactive 2D maps and depthprofiles (at map locations); examples are shown in Figs. 4a–cand Fig. 5a. In addition, standard deviations, maximum andminimum values (within the different periods), and relativecumulative frequencies (greater than or equal) are availablefor select variables; see Table VI for a list and the values usedfor Fc. And finally, frequency distribution histograms are alsoavailable for select variables and can be downloaded as ‘png’and ‘csv’ files. See also Table VI for a list and Fig. 5b for asample download.
VII. SUMMARY
Marine renewable resource assessments conducted by TheUniversity of Tokyo and JAMSTEC are now publicly-available
(a) Spring climatology of Pc at a 1 m depth
(b) Large-meander climatology of u at a 1 m depth
(c) Annual climatology of PT at a 200 m depth
Fig. 4. Sample of JCOPE-T climatology map data available, covering upto a 10-year period (2002-2011). Screenshots of interactive climatologies areshown in (a) and (b) at 1 m depths for Pc (10-year-seasonal) and u (large-meander) respectively, and (c) at a 200 m depth for PT (10-year-annual).

TABLE V2D MAPS AND DEPTH PROFILES OF JCOPE-T DATA ARE CALCULATEDFOR SELECT PERIOD TYPES AND DEPTHS. DIFFERENT CLIMATOLOGYTYPES (YEAR/SEASON/LM/NLM) COVER UP TO A 10-YEAR PERIOD
(2002–2011); ‘LM’ AND ‘NLM’ ARE SHORTHAND FOR THELARGE-MEANDER AND NON-LARGE-MEANDER KUROSHIO PATHS.
SELECTED DEPTHS ARE REPRESENTED BY ‘Dc’ AND ‘DT ’.CLIMATOLOGY OF u REFERS TO (〈u〉, 〈v〉). SEE SECTION VI FOR
DETAILS.
Variable ClimatologyType Depth
Year Season LM NLM Dc DT
|u| ◦ ◦ ◦ ◦ ◦u ◦ ◦ ◦ ◦ ◦u ◦ ◦ ◦ ◦ ◦v ◦ ◦ ◦ ◦ ◦mc ◦ ◦ ◦ ◦ ◦Pc ◦ ◦ ◦ ◦ ◦
T ◦ ◦ ◦ ◦ ◦∆T20 ◦ ◦ ◦ ◦ ◦PT ◦ ◦ ◦ ◦ ◦
TABLE VILIST OF 2D MAPS, DEPTH PROFILES, AND HISTOGRAMS AVAILABLE FOR
JCOPE-T DATA. ‘CLIM’ AND ‘STD’ ARE SHORTHAND FOR CLIMATOLOGYAND STANDARD DEVIATION; ‘MAX’ AND ‘MIN’ REFER TO THE MAXIMUMAND MINIMUM VALUES WITHIN THE DIFFERENT PERIODS. VALUES USED
FOR Fc ARE LISTED IN THE TABLE AND FREQUENCY DISTRIBUTIONHISTOGRAMS ARE DOWNLOADABLE. SEE SECTION VI AND TABLE V FOR
FURTHER DETAILS.
Variable Climatology FrequencyMap / Profile Histogram
Clim Std Max Min Fc F
|u| ◦ ◦ ◦ ◦ 1, 1.5
u ◦u ◦ ◦ ◦v ◦ ◦ ◦mc ◦θc ◦Pc ◦ ◦ ◦ ◦
T ◦ ◦ ◦ ◦ ◦∆T20 ◦ ◦ ◦ ◦ 20 ◦PT ◦ ◦ ◦ ◦
online at http://www.todaiww3.k.u-tokyo.ac.jp/nedo p/en. Thedata is distributed by a web GIS service that utilizes TDSand GeoServer software with Leaflet libraries. The web GISdataset contains statistical analyses of wave power (21 years),ocean and tidal current power (10 years), and ocean temper-ature power (10 years) that are accessed through interactivebrowser sessions and downloadable files.
ACKNOWLEDGMENT
This work was supported by the NEDO project titled,“Research on the Framework and Infrastructure of Marine
(a) Spring depth profiles of Pc
(b) Spring frequency distribution of ∆T20
Fig. 5. Sample of JCOPE-T climatology profile and histogram data availableat map locations for a 10-year period (2002–2011). Screenshot of depthprofiles is shown in (a) for seasonal Pc. Sample file download is shown in (b)of the seasonal ∆T20 frequency distribution histograms at specific depths.
Renewable Energy; an Energy Potential Assessment.” Allsample screenshots utilize Geographical Survey Institute (GSI)English tile maps (http://www.gsi.go.jp/).
REFERENCES
[1] Y. Kidoura, R. Wada, and T. Waseda, “On the aleatory and epistemicuncertainty of the wave resource assessment in the Northwest Pacific,”in ASME 2014 33rd Int. Conference, American Society of MechanicalEngineers, 2014.
[2] T. Waseda, A. Webb, K. Kiyomatsu, W. Fujimoto, Y. Miyazawa, S.Varlamov, K. Horiuchi, T. Fujiwara, T. Taniguchi, K. Matsuda, and J.Yoshikawa, “Marine energy resource assessment at reconnaissance tofeasibility study stages; wave power, ocean and tidal current power, andocean thermal power” (in Japanese), Journal of the Japan Society ofNaval Architects and Ocean Engineers, in press, 2016.
[3] A. Webb, T. Waseda, and K. Kiyomatsu, “A 21-year high-resolutionwave resource assessment of Japan: Model setup and validation”, OceanDynamics, in preparation, 2016.