a. - home page | california state water resources … that govern apportionment in cercla cases, and...
TRANSCRIPT

1
2
3
4
5
6
7
8
9
10
11
12
13
14
15
16
17
18
19
20
21
22
23
24
25
26
27
28
a. Joint & Several Liability after the Burlington Northern case.
The United States Supreme Court recently held that divisibility is
appropriate where a party can show a reasonable basis for apportionment.
(Burlington Northern & Santa Fe Railway Co. et al. v. United States, (2009) 129 S.
Ct. 1870.) In Burlington, neither the parties nor the lower courts disputed the
principles that govern apportionment in CERCLA cases, and both the District
Court and Court of Appeals agreed that the harm created by the contamination of
the Arvin facility, although singular, was theoretically capable of apportionment.
(Id. at 1881.) Thus, the issue before the Court was whether the record provided a
"reasonable basis" for the District Court's conclusion that the railroad defendants
were liable for only 9% of the harm caused by contamination at the Arvin facility.
(Id.) Despite the parties' failure to assist the District Court in linking the evidence
supporting apportionment to the proper allocation of liability, the District Court
ultimately concluded that this was "a classic `divisible in terms of degree' case,
both as to the time period in which defendants' conduct occurred, and ownership
existed, and as to the estimated maximum contribution of each party's activities
that released hazardous substances that caused Mine Site contamination." (Id. at
1882; emphasis added.)
Consequently, the District Court apportioned liability, assigning the railroad
defendants 9% of the total remediation costs. (Id.) The Supreme Court concluded
that the facts contained in the record reasonably supported the apportionment of
liability, because the District Court's detailed findings made it abundantly clear
that the primary pollution at the Arvin facility was contained in an unlined sump
and an unlined pond in the southeastern portion of the facility most distant from
the railroads' parcel and that the spills of hazardous chemicals that occurred on the
railroad parcel contributed to no more than 10% of the total Mine Site
contamination, some of which did not require remediation. (Id. at 1882 -3) Thus,
{00004698.DOCX -1 } 21
SUNOCO, INC.'S PETITION FOR REVIEW AND RESCISSION OF REVISED TECHNICAL REPORTING ORDER NO. R5- 2009 -0869

2
3
4
5
6
7
8
9
10
11
12
13
14
15
16
17
18
19
20
21
22
23
24
25
26
27
28
the Supreme Court recognized that "... if adequate information is available,
divisibility may be established by `volumetric, chronological, or other types of
evidence,' including appropriate geographic considerations" (Id. at 1883;
emphasis added.) Although the evidence adduced by the parties did not allow the
court to calculate precisely the amount of hazardous chemicals contributed by the
railroad parcel to the total Mine Site contamination, or the exact percentage of
harm caused by each chemical, the evidence did show that fewer spills occurred on
the railroad parcel and that of those spills that occurred, not all were carried across
the railroad parcel to the sump and pond from which most of the contamination
originated. (Id.) Because the District Court's ultimate allocation of liability was
supported by the evidence and comported with general apportionment principles,
the Supreme Court reversed the Court of Appeals' conclusion that the railroads are
subject to joint and several liability for all response costs arising out of the
contamination of the Arvin facility. (Id.)
b. The Regional Board may not circumvent Burlington Northern.
It is well -established that "litigants may not invoke state statutes in order to
escape the application of C;BRCLA's provisions in the midst of hazardous waste
litigation." (Fireman's Fund Insurance Company v. City of Lodi, 303 F.3d 928,
947 n. 15 (9th Cir. 2002).) Similarly, because "[ feederal conflict preemption
[exists] where `compliance with both the federal and state regulations is a physical
impossibility,' or when the state law stands as an `obstacle to the accomplishment
and execution of the full purposes and objectives of Congress ' (Id. at 943), the
Regional Board may not - in an attempt to assess joint and several liability - apply
any state law provisions in a manner that conflict with Burlington. Applying the
Burlington holding to the facts outlined herein concerning Cordero's operations
compel the conclusion that apportionment, not joint and several liability, is
appropriate at this Site.
{00004698.DOCX -1 } 22
SUNOCO, INC.'S PETITION FOR REVIEW AND RESCISSION OF REVISED TECHNICAL REPORTING ORDERNO. R5- 2009 -0869

1
2
3
4
5
6
7
8
9
10
11
12
13
14
15
16
17
18
19
20
21
22
23
24
25
26
27
28
Here, Sunoco has shown adequate evidence to support divisibility "by
volumetric, chronological, or other types of evidence, including appropriate
geographic considerations," and that a reasonable basis exists for dividing liability
because: (1) Cordero is only responsible for 1% of the total volume of mine related
waste at the Site; (2) Cordero dumped its waste mine rock adjacent to or to the
north of the DMEA Shaft, away from the Bradley Mining waste rock and tailings
on the eastern side of the Mine Site; (3) Cordero's operations did not result in the
processing of any mercury ore, meaning it generated no tailings, unlike the
extensive tailings generated by Bradley Mining and others; (4) Cordero discharged
or otherwise treated its extracted mine water to the satisfaction of the State Water
Pollution Control Board (which specifically did not find any nuisance) and
disposed of it to the west of the Mine Site, an area not hydraulically connected to
the "[e]xtensive waste rock piles and mine tailings [that] cover the hill slope below
the open cut," from which "several springs and seeps discharge" that are the
primary concern of the Rev. Order. (Chapman Decl., Exh. 1, at p. 1; Exh. 4, pp. 5-
4); and (5) there is no evidence that any groundwater exists in the former Cordero
underground workings, or that if it does, it is contaminated, and even if it is, that it
migrated 200' vertically upwards in the Main Winze before exiting several
hundred feet away at 165' level adit.
Sunoco has shown a reasonable basis for apportionment, and the Regional
Board cannot require it under state or federal law to investigate or remediate any
continuing nuisance caused by other PRPs.
VI. THE MANNER IN WHICH PETITIONER HAS BEEN
AGGRIEVED
The Regional Board's actions have aggrieved Sunoco because the Rev.
Order is arbitrary and capricious, vague and ambiguous, and unsupported by the
facts or law. Absent a better Site definition, Sunoco cannot reasonably comply,
{00004698.DOCX -1 } 23
SUNOCO, INC.'S PETPITON FOR REVIEW AND RESCISSION OF REVISED TECHNICAL REPORTING ORDER NO. R5-2009J0869

1
2
3
4
5
6
7.
8
9
10
11
12
13
14
15
16
17
18
19
20
21
22
23
24
25
26
27
28
resulting in potentially unwarranted enforcement of the Rev. Order. The Rev.
Order's subjective Mine Site description relegates Sunoco's uncertain obligations
thereunder to a guessinggame in violation of Sunoco's due process rights.
(Connally v. General Construction Co., 269 U.S. 385, 391 (1926) ( "[A] statute
which either forbids or requires the doing of an act in terms so vague that men of
common intelligence must necessarily guess at its meaning and differ as to its
application, violates the first essential of due process of law"); Gatto v. County of
Sonoma, 98 Cal. App. 4th 744, 773 -774 (2002); Papachristou v. City of
Jacksonville, 405 U.S. 156, 162 (1972) (law was unconstitutionally vague for
failure to give fair notice of what constituted a violation; "all persons are entitled to
be informed as to what the State commands or forbids ").)
Also, despite Sunoco's strong divisibility argument, by naming Sunoco a
discharger purportedly jointly and severally liable for conducting the Work over
the entire Site required by the Rev. Order, the Regional Board attempts to impose
on Sunoco significant and unjustified compliance costs.
VII. STATE BOARD ACTION REQUESTED BY PETITIONER
Sunoco requests that the State Board immediately stay enforcement of the
Rev. Order and determine that the Rev. Order is arbitrary and capricious or
otherwise without factual or legal bases, and rescind it on the following grounds:
(1) it violates Sunoco's due process by providing an inaccurate description of the
"Mine Site" boundaries, making compliance impossible; (2) it violates state and
federal law by imposing joint and several liability and thus failing to limit
Sunoco's liability to areas where Sunoco operated the Site; and (3) it violates CWC
§ 13267(b)(1) by failing to provide Sunoco "with a written explanation with regard
to the need for the reports, and [fails to] identify the evidence that supports
requiring [Sunoco] to provide the reports.
{00004698.DOCX -1 } 24
SUNOCO, INC.'S PETITION FOR REVIEW AND RESCISSION OF REVISED TECIINICAL REPORTING ORDERNO. R5- 2009 -0869

1
2
3
4
5
6
7
8
9
10
11
12
13
14
15
16
17
18
19
20
21
22
23
24
25
26
27
28
VIII. STATEMENT OF POINTS AND AUTHORITIES IN SUPPORT OF LEGAL ISSUES RAISED IN THE PETITION
For purposes of this protective filing, the Statement of Points and
Authorities is subsumed in Sections V and VI of this Petition. Sunoco reserves the
right to file a Supplemental Statement of Points and Authorities, including
references to the complete administrative record and other legal authorities and
factual documents and testimony, as well as to supplement its evidentiary
submission.
IX. STATEMENT REGARDING SERVICE OF THE PETITION ON THE REGIONAL BOARD AND NAMED DISCHARGERS
A copy of this Petition is being sent to the Regional Board, to the
attention of Pamela C. Creedon, Executive Officer, by email and U.S. Mail. By
copy of this Petition, Sunoco is also notifying the Regional Board of Sunoco' s
Petition and the concurrently filed Petition for Stay of Action. A copy of this
Petition is also being sent by U.S. Mail to the three other dischargers named in the
Rev. Order.
X. STATEMENT REGARDING ISSUES PRESENTED TO THE REGIONAL BOARD/REQUEST FOR HEARING
Sunoco raised the substantive issues and objections raised in this Petition
before the Regional Board in both a the prior petition filed in abeyance and served
on the Regional Board, and in Sunoco's Divisibility Report. The Regional Board
provided no notice that it was issuing the Rev. Order, did not provide Sunoco with
a draft of the Rev. Order, and provided no comment period for a draft version of
the Rev. Order or opportunity to discuss it with the Regional Board.
Sunoco requests a hearing in connection with this Petition.
For all the foregoing reasons, Sunoco respectfully requests that the State
Board review the Revised Order and grant the relief as set forth above.
{00004698.DOCX -1 } 25
SUNOCO, INC.'S PETITION FOR REVIEW AND RESCISSION OF REVISED TECHNICAL REPORTING ORDERNO. R5- 2009 -0869

1
2
3
4
5
6
7
8
9
10
11
12
13
14
15
16
17
18
19
20
21
22
23
24
25
26
27
28
Respectfully submitted,
DA'T'ED: January 29, 2010 EDGCOMB LAW GROUP
By: Davis Chapman
dchapman @edgcomb -law. corn Attorneys for Petitioner
SUNOCO, INC.
{00004698.DOCX -1) 26 SUNOCO, INC.'S PETITION FOR REVIEW AND RESCISSION OF REVISED TECHNICAL REPORTING ORDER NO. R5- 2009 -0869

Edgcomb Law Group JOHN D. EDGCOMB (SBN 112275) DAVID T. CHAPMAN (SBN 207900) 115 Sansome Street, Suite 700 San Francisco California 94104 Telephone: (415) 399 -1555 Facsimile: (415) 399 -1885 [email protected]
Attorneys for Petitioner SUNOCO, INC.
STATE WA1'BR RESOURCES CONTROL BOARD
STATE OF CALIFORNIA
In the Matter of PETITION NO.
SUNOCO, INC.,
Petitioner,
For Stay of Revised Order To Submit Investigative Reports Pursuant To Water Code Section 13267, Mount Diablo Mine, Contra Costa County, dated December 30, 2009
SUNOCO, INC.'S PETITION FOR STAY OF REVISED TECHNICAL REPORTING ORDER NO. R5- 2009 -0869
Pursuant to California Water Code § 13321 and 23 Cal. Code of Regs. §
2053, Sunoco, Inc. ( "Sunoco" or "Petitioner ") hereby petitions the State Water
Resources Control Board ( "State Board ") to stay implementation of the "Revised
Technical Reporting Order R5- 2009 -0869 issued pursuant to Section 13267 of the
California Water Code regarding the Mount Diablo Mine, Contra Costa County,"
originally issued on December 1, 2009, and revised and reissued on December 30,
2009 ( "Rev. Order "), by the Regional Water Quality Control Board, Central
Valley Region ( "Regional Board ").
Petitioner has concurrently filed a Petition for Review and Rescission of the
Rev. Order with this Petition for Stay of Action.
(00004682.DOC -1 )
SUNOCO INC.'S PETITION FOR STAY OF REVISED TECHNICAL REPORTING ORDER NO. R5- 2009 -0869

1
2
3
4
5
6
7
8
9
10
11
12
13
14
15
16
17
18
19
20
21
22
23
24
25
26
27
28
I. STANDARD OF REVIEW
Water Code section 13321 authorizes the State Board to stay the effect of
Regional Board decisions. Title 23, CCR § 2053 requires that a stay shall be
granted if a petitioner alleges facts and produces proof of:
(1) Substantial harm to petitioner or to the public interest if a stay is
not granted;
(2) A lack of substantial harm to other interested persons and to the
public if a stay is granted; and,
3) Substantial questions of fact or law regarding the disputed action.
(23 CCR § 2053(a).)
The State Board's granting of a stay is equivalent to a preliminary
injunction. The California Supreme Court has stated that the standard for a
preliminary injunction is as follows:
In deciding whether to issue a preliminary injunction, a court must weigh
two "interrelated" factors: (1) the likelihood that the moving party will ultimately
prevail on the merits and (2) the relative interim harm to the parties from issuance
or non -issuance of the injunction. (Butt v. California (1992) 4 Cal. 4th 668, 678
(citation omitted).) The trial court's determination must be guided by a "mix" of
the potential -merit and interim -harm factors; the greater the plaintiff's showing on
one, the less must be shown on the other to support an injunction. (Id.; citation
omitted). Sunoco, as detailed below, has satisfied the requirements of both tests.
Therefore, the State Board should grant a stay of the Rev. Order.
II. ARGUMENT
The Regional Board's adoption of the Rev. Order was an erroneous action
that poses substantial harm to Petitioner and the public interest for the following
reasons: (1) it requires Petitioner to prepare work plans and an investigation report
related to the Mount Diablo Mercury Mine ( "Mine Site "), but has provided only a
{00004682.DOC -1 } 2
SUNOCO INC.'S PETITION FOR STAY OF REVISED TECHNICAL REPORTING ORDER NO. R5- 2009 -0869

1
2
3
4
5
6
7
8
9
10
11
12
13
14
15
16
17
18
19
20
21
22
23
24
25
26
27
28
vague and ambiguous description of the Mine Site, making compliance with
certainty impossible and unnecessary compliance efforts likely. Secondly, the
Rev. Order incorrectly assumes Petitioner operated the entire Mine Site identified,
which is false, requires the Petitioner to furnish work plans, conduct an
investigation and provide a technical report covering the entire Mine Site, which is
unjustified, and fails to identify the evidence on which it relies to make the
unjustified demands as required by CWC § 13267. Thus, Sunoco has a high
likelihood of success on the merits of its appeal.
A. Substantial and Irreparable Harm to Petitioner and the Public Interest Will Result if the Rev. Order is Implemented Without Modification.
The public interest and Petitioner will be substantially harmed by
implementation of the Rev. Order. Because Sunoco cannot be forced to investigate
or remediate discharges to which it has no nexus at the Mine Site, a failure to stay
pending State Board review would unfairly and illegally burden Petitioner by
forcing it to conduct the extensive and expensive work required under the Rev.
Order that may be vacated upon judicial review. Further, having had these costs
unfairly imposed upon it, Sunoco may have no means of recovering such costs
since many of the parties having actual legal liability for the discharges to which
the work Sunoco is being required to undertake appear to be without sufficient
financial resources to reimburse Sunoco.
Furthermore, a stay is proper because there is a lack of substantial harm to
other interested persons and the public interest if it is granted. First, while a stay
would prevent enforcement of the overly broad Rev. Order against Sunoco, the
Regional Board could focus on preparing properly tailored orders to the parties
having legal responsibility for operations and discharges on various sub -areas of
the Mine Site that are of concern to the Regional Board. The Regional Board
could thereby avoid protracted litigation and move closer to achieving the response {00004682.DOC -1 } 3
SUNOCO INC.'S PETITION FOR STAY OF REVISED TECHNICAL REPORTING ORDER NO. R5- 2009 -0869
1
2
3
4
5
6
7
8
9
10
11
12
13
14
15
16
17
18
19
20
21
22
23
24
25
26
27
28
actions it seeks over the entire Mine Site much sooner than it can by attempting to
illegally require Sunoco to perfoim all such work, when Sunoco is not legally
responsible for the entire Mine Site.
B. A Stay of the Rev. Order Will Not Result in Substantial Harm to Other Interested Persons or the Public.
While there may be some delay to the performance of the investigations
sought by the Regional Board as a result of the requested stay, that delay and any
resulting harm are not substantial given that: (1) the Regional Board can issue
orders to other, actually responsible parties to perform the studies sought to be
furnished; (2) the Regional Board has been generally aware of the site conditions it
now seeks to address for 50 years or more, without issuing any similar orders to
Sunoco's knowledge; (3) any ongoing environmental harm is substantially
outweighed by the harm to be suffered by Sunoco in the absence of a stay as a
result of the Rev. Order improperly requiring Sunoco to prepare work plans,
perform an investigation, and furnish a report on the entire Mine Site area, for
much of which Sunoco is not responsible; and (4) the public interest is well -served
by insuring that only fair and just orders, supported by facts and law, are issued by
the Regional Board.
The record on file with the State Board in relation to the concurrently filed
Petition for Review contains the relevant supporting documents to this Petition for
Stay of Action, which Sunoco reserves the right to - and will - supplement.
As set forth more fully in Sunoco's Petition for Review and the
Declaration of David T. Chapman in Support of Petition for Review and Petition
for Stay ( "Chapman Declaration ") being filed herewith, a stay is appropriate
because the action of the Regional Board with respect to Sunoco is illegal and
should be revoked or amended in that the Rev. Order: (1) is improperly vague and
ambiguous in its description of the Site, making Sunoco's compliance impossible
{00004682.DOC -1 ) 4
SUNOCO INC.'S PETITION FOR STAY OF REVISED TECHNICAL REPORTING ORDER NO. R5- 2009 -0869

1
2
3
4
5
6
7
8
9
10
11
12
13
14
15
16
17
18
19
20
21
22
23
24
25
26
27
28
and unnecessary compliance efforts likely; and (2) requires Sunoco to prepare a
mine waste investigation work plan, conduct the mine waste investigation, prepare
a mine waste investigation report, and then prepare a proposed remediation work
plan, for large areas of a Mine Site where it was not - and is not -a "discharger,"
and without providing the required reference to the evidence supporting those
requirements, inconsistent with and beyond the scope of its cited statutory
authority. Sunoco hereby incorporates all of the facts and arguments set forth in
that Petition for Review and the accompanying Chapman Declaration and Horton
Declaration, including any and all supplemental submissions made by Sunoco in
support of that Petition.
C. The Regional Board's Action Raises Substantial Questions of Law on Which Petitioners are Likely to Prevail.
The Petition for Review of the Rev. Order has been filed contemporaneously
with this Petition and delineates Sunoco's arguments regarding the legal questions
on which Sunoco is likely to prevail. The Rev. Order clearly violates requirements
set forth in the Porter- Cologne Water Quality Act and is wholly unsupported by
existing law and the factual record. The State Board should therefore stay the Rev.
Order and prevent the implementation of a decision that is illegal and sets an
inappropriate precedent. (The Petition for Review is hereby incorporated by
reference.)
M. CONCLUSION
Sunoco and the public interest will be substantially and irreparably harmed if
Sunoco is required to fully implement the Rev. Order, while other potentially
responsible parties ( "PRPs ") and the public interest will not significantly suffer
from a stay and, in fact, may benefit by a clarification of the vague requirements in
the Revised Order, which may otherwise result in their involvement in litigation
and delay issuance of orders to other, more appropriate PRPs. Thus, the balance of
{00004682.DOC -1 } 5
SUNOCO INC.'S PETITION FOR STAY OF REVISED TECHNICAL REPORTING ORDER NO. R5- 2009 -0869

1
2
3
4
5
6
7
8
9
10
11
12
13
14
15
16
17
18
19
20
21
22
23
24
25
26
27
28
harms at issue in the Petition favors the granting of a stay. In addition, the Rev.
Order has raised substantial questions of fact and law, which, upon review in
accordance with the historical record and provisions of the California Water Code,
are highly likely to be resolved in favor of Sunoco. Therefore, the State Board
should issue a stay of the Rev. Order.
Respectfully submitted,
DATED: January 29, 2010 EDGCOMB LAW GROUP
By: David T. Chapman dchapman @edgcomb -law. corn
Attorneys for Petitioner SUNOCO, INC.
{00004682.DOC -1) 6
SUNOCO INC.'S PETITION FOR STAY OF REVISED TECHNICAL REPORTING ORDER NO. R5- 2009 -0869
EXHIBIT 32

CHARACTERIZATION REPORT
Mount Diablo Mercury Mine 2430 Morgan Territory Road
Contra Costa County, California
Project No. 01- SUN -050
Prepared For:
10 Industrial Highway, MS4 Lester, PA 19029
SGI environmental
Prepared By:
THE
SOURCE GROUP, INC. 3451 -C Vincent Road
Pleasant Hill, California 94523
August 2, 2010

CHARACTERIZATION REPORT
Mount Diablo Mercury Mine
2430 Morgan Territory Road Contra Costa County, California
01 -SUN -050
Prepared For:
SUNOCO
10 Industrial Highway, MS4 Lester, PA 19029
f SGI enw(pnmenlAl
Prepared By:
THE
SOURCE GROUP, INC.
3451C Vincent Road Pleasant Hill, CA 94619
Prepared By:
R. Philipp, P.G.; C.Hg. Senior Hydrogeologist
August 2, 2010
vie ed By:
i Paul D. Horton, P.G., C.Hg. Principal Hydro,g_eologist
.kNI QRO O oc`.
cr)

Characterization Report Mount Diablo Mercury Mine, Contra Costa County, California August 2, 2010
TABLE OF CONTENTS
LIST OF FIGURES LIST OF TABLES LIST OF APPENDICES
1.0 INTRODUCTION
2.0 SITE BACKGROUND
PAGE ii
1 -1
2 -1 2.1 Location and Current Use 2 -1 2.2 Ownership and Operational History 2 -1 2.3 Cordero Work Areas 2 -3 2.4 Cordero Mining Activity 2 -4
2.4.1 Cordero Materials Disposition 2-4 2.5 Previous Investigations 2 -5
2.5.1 State Water Pollution Control Board / California Regional Water Quality Control Board Investigations 2 -6
2.5.2 J.L. lovenitti, Weiss Associates, and J. Wessman Mount Diablo Mine Surface Impoundment Technical Report 2 -6
2.5.3 Prof. DareII G. Slotton, Marsh Creek Watershed Mercury Assessment Project 2 -7
2.6 Previous Remedial Actions 2 -8
3.0 FIELD INVESTIGATION AND SAMPLING 3 -1 3.1 Objective 3 -1 3.2 Field Surveys 3 -1 3.3 Surface Water Sampling 3 -2
3.3.1 Sample Collection Procedures 3 -3 3.3.2 Equipment Decontamination 3 -3 3.3.3 Laboratory Analysis 3 -3
4.0 INVESTIGATION RESULTS 4 -1 4.1 Field Survey Results 4 -1
4.1.1 Materials Mapping 4 -1 4.1.2 Surface Flow Mapping 4 -2 4.1.3 Spring Flows 4 -2 4.1.4 Pond Histories and Flow 4-4
4.2 Development of Surface Water Sampling Locations 4-4 4.3 Surface Water Sampling Results 4 -6
4.3.1 Background Water Quality 4 -8 4.3.2 Spring Water Quality 4 -9 4.3.3 Pond Water Quality 4 -9 4.3.4 Northern Waste Dump Area Water Quality 4 -10 4.3.5 Mine Waste Runoff Water Quality 4 -10 4.3.6 Downstream Water Quality 4 -11
Mining Waste Characterization Rpt Final 8- 2- 10.doc The Source Group, Inc.
Characterization Report Mount Diablo Mercury Mine, Contra Costa County, California August 2, 2010
TABLE OF CONTENTS
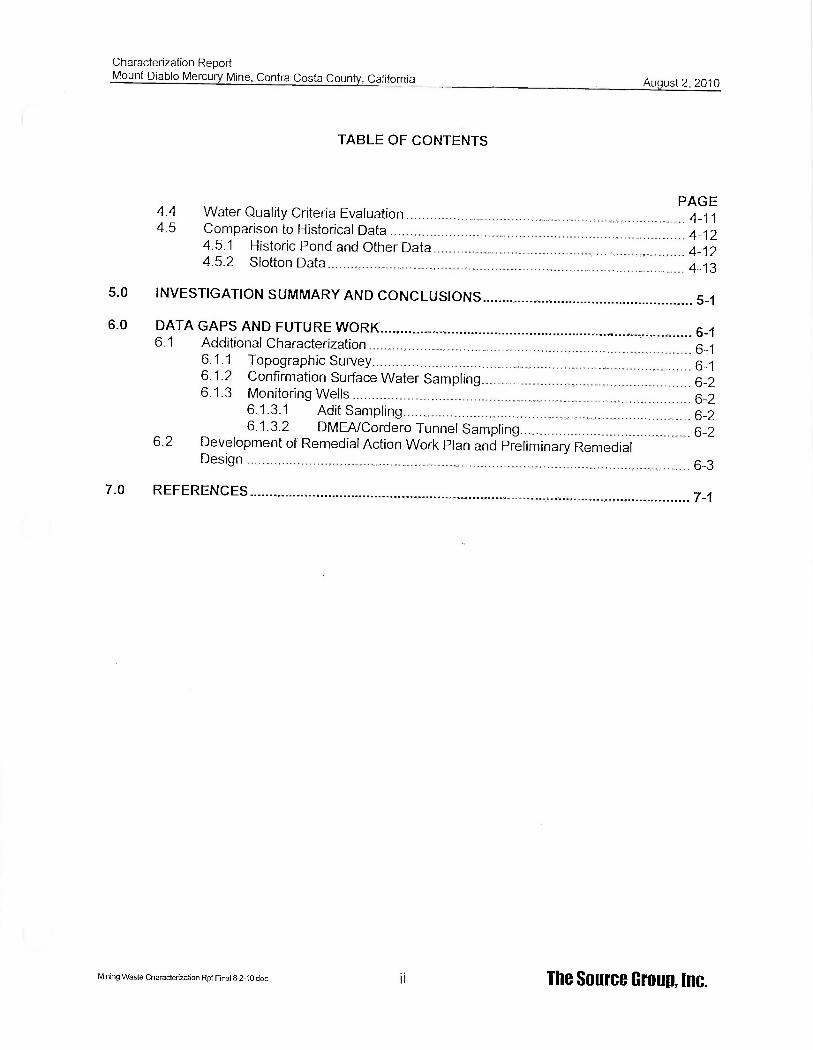
4.4 4.5
Water Quality Criteria Evaluation Comparison to Historical Data 4.5.1 Historic Pond and Other Data 4.5.2 Slotton Data
PAGE 4 -11 4 -12 4 -12 4 -13
5.0 INVESTIGATION SUMMARY AND CONCLUSIONS 5 -1
6.0 DATA GAPS AND FUTURE WORK 6 -1 6.1 Additional Characterization 6 -1
6.1.1 Topographic Survey 6 -1 6.1.2 Confirmation Surface Water Sampling 6 -2 6.1.3 Monitoring Wells 6 -2
6.1.3.1 Adit Sampling 6 -2 6.1.3.2 DMEA/Cordero Tunnel Sampling 6 -2
6.2 Development of Remedial Action Work Plan and Preliminary Remedial Design
6 -3
7.0 REFERENCES 7 -1
Mining Waste Characterization Rpt Final 8- 2- 10.doc ii The Source Group, Inc.

Characterization Report Mount Diablo Mercury Mine, Contra Costa County, California August 2, 2010
LIST OF FIGURES Figure 1 -1 Site Location Map
Figure 2 -1 Aerial Photograph of Mine with Features
Figure 2 -2 2004 Aerial Photo Showing Features and Lease Boundary Figure 2 -3 DMEA Map Showing Pre- and Post- DMEA/Cordero Mine Features Figure 2-4 Plan View of DMEA/Cordero Tunnel System
Figure 2 -5 Plan View of DMEA/Cordero Tunnel System With Pre -Cordero Tunnels Figure 2 -6 Cross Section of Pre -Cordero Tunnel System
Figure 2 -7 2004 Aerial Photo With Pre- and Post DMEA/Cordero Mine Features Figure 2 -8 USGS DMEA Map Showing Proposed DMEA Shaft Location Figure 2 -9 DMEA Waste Pile Comparison Close Up View
Figure 2 -10 Pre- DMEA/Cordero Condition 1952 Aerial Photograph
Figure 2 -11 Post DMEA/Cordero Condition 1957 Aerial Photograph Figure 3 -1 2010 Surface Water Sampling Locations
Figure 4 -1 Mapped Mine Waste Materials
Figure 4 -2 Mapped Mine Waste with USGS Site Features Overlay Figure 4 -3 Site Drainage and Surface Flow Interpretation
Figure 4-4 2010.Surface Water Sampling Results, Mercury and pH
Figure 4 -5 Surface Water Data Piper Diagram
Figure 4 -6 Surface Water Data Durov Diagram
Figure 4 -7 Characteristic Stiff Diagrams
Figure 4 -8 Comparison of Historical Data Stiff Diagrams
Mining Waste Characterization Rpt Final 8- 2- 10.doc iii The Source Group, Inc.

Characterization Report Mount Diablo Mercury Mine, Contra Costa County, California August 2, 2010
Table 2 -1
Table 2 -2
Table 4 -1
Table 4 -2
Table 4 -3
Table 4 -4
Table 4 -5
Appendix A
Appendix B
Appendix C
Appendix D
Appendix E
LIST OF TABLES Production Statistics
Summary of 1995 Mercury Data Collected by Slotton
2010 Surface Water Sample Location Key
Summary of Chemical Analyses Results - 2010 Surface Water Sampling Summary of Field Parameters -2010 Surface Water Sampling Select Historical Data Matched to Current Sample Collection Locations Summary Comparison of Surface Water Data
LIST OF APPENDICES Summary of Historic Water Quality Data with Location Key Map and Notes Selected Site Photographs
2010 Sampling Program Chain of Custody and Laboratory Reports
Statistical Report on Methyl Mercury Data Analysis
Water Quality Stiff Diagrams for 2010 Sampling
Mining Waste Characterization Rpt Final8- 2- 10.doc iv The Source Group, Inc.

Characterization Report Mount Diablo Mercury Mine, Contra Costa County, California August 2, 2010
1.0 INTRODUCTION
The Source Group, Inc. (SGI) has conducted a characterization of conditions at the former Mount Diablo Mercury Mine in Contra Costa County, California (the Site, Figure 1 -1) on behalf of Sunoco Inc. (Sunoco). This characterization was conducted in order to satisfy, in part, the requirements of the California Regional Water Quality Control Board (CRWQCB) in their Revised Technical Reporting Order R5- 2009 -0869 (Rev. Order) of December 30, 2009.
This Characterization Report (Report) provides details (including the results) of the work conducted by SGI on behalf of Sunoco that included a comprehensive review of existing site data and conditions, field surveys, and two surface water sampling events across the Mine Site and the Dunn Creek drainage.
The Report presents a complete discussion of current site conditions, field sampling and analyses, a discussion of data gaps and future work, and is organized into the following sections:
Section 2.0 Site Background;
Section 3.0 Field Investigation and Sampling;
Section 4.0 Investigation Results;
Section 5.0 Investigation Summary and Conclusions; and
Section 6.0 Data Gaps and Future Work.
A list of references is provided in Section 7.0.
Mining Waste Characterization Rpt Final 8- 2- 10.doc 1 -1 The Source Group, Inc.

Characterization Report Mount Diablo Mercury Mine, Contra Costa County, California August 2, 2010
2.0 SITE BACKGROUND
2.1 Location and Current Use
The former Mount Diablo Mercury Mine (Mine or Site) is located in an unincorporated area of Contra Costa County, California at the northeastern base of Mount Diablo. The Mine and the historic working areas of the Mine are generally described as the 80 acres of land on the southwest quadrant of the intersection of Marsh Creek Road and Morgan Territory Road as shown on Figure 1 -1. The Mine is adjoined to the south and west by lands of Mount Diablo State Park and to the north and east by Marsh Creek Road and Morgan Territory Road.
We understand the Mine has been closed since around 1969. Most assay and process equipment have been removed from the Site. The Site still retains some abandoned wood structures that were part of the facility operations (Figure 2 -1, aerial photograph of Mine). The Site is situated at an elevation of approximately 700 to 1100 feet above mean sea level (msl). Currently the property is used by Site owners Jack & Carolyn Wessman and their lessees for residential purposes and cattle ranching.
2.2 Ownership and Operational History
The first shaft on what became the Mount Diablo Mine Site was sunk by a Mr. Welch in about 1863. Mr. Welch encountered ore at 37 feet below ground where "both cinnabar and native mercury could be obtained by panning the soil removed ". After a short period of commercial production between 1875 and 1877, the Mine was relatively idle until 1930 when Mr. Vic Blomberg organized the Mt. Diablo Quicksilver Co., Ltd. (Mt. Diablo Quicksilver), which operated the Mine between 1930 until 1936 producing an estimated 739 flasks of mercury. Mt. Diablo Quicksilver then leased the property to the Bradley Mining Company (Bradley) from 1936 to 1951, during which time Bradley conducted surface and underground mining and produced over 10,000 flasks of mercury. At the end of Bradley's operations, the underground mine workings consisted of four levels in a steeply dipping shear zone. The Bradley workings were accessed by a main shaft and had a drain or "adit" tunnel that exited to the surface on the 165 foot level (the 165 foot Adit; Pampeyan, 1963).
The Bradley Mining Company operated the Mine for a period of fifteen years generating a total of 78,188 cubic yards of milled tailings and 24,815 cubic yards of waste rock from the mine tunnels (Ross 1958). The material generated by Bradley Mining Company represents 97.3 percent of all material generated as documented in the attached Table 2 -1. In addition to the materials generated from the Mercury Mine, Bradley Mining Company also operated a rock quarry to the west of the Mine. Waste rock generated from the Quarry operation is reported to have been placed in the Area called the "Waste Dump" on maps produced by the California Division of Mines
Mining Waste Characterization Rpt Final 8- 2- 10.doc 2 -1 The Source Group, Inc.

Characterization Report Mount Diablo Mercury Mine, Contra Costa County, California August 2, 2010
and Geology (Pampeyan, 1963). As a result of the mining and milling conducted by the Bradley Mining Company, records indicate that all or nearly all of the currently existing waste and tailings piles at the Mine can be attributed to generation by the Bradley Mining company as their configuration matches the mapped site conditions as documented by Site mapping conducted in 1953 by the California Division of Mines and Geology (Pampeyan, 1963). Figure 2 -2 provides a map depicting the locations of the tailings and waste rock piles on the site as generated by the Bradley Mining Company. Field confirmed locations of Mercury mine tailings and waste rock are depicted in blue hatched outline and can be readily discerned as bare looking areas on the aerial photographs. The waste dump that received Quarry waste rock is north (northern waste dump) and is circled in a dashed green outline. The northern waste dump area is physically different from the other Bradley waste areas as it has an extensive tree cover as can be seen on Figure 2 -2.
Following the period of extensive Bradley Mining Company operations, Mt. Diablo Quicksilver next leased the Mine to Ronnie B. Smith and partners (Smith, et al.) in 1951. Using surface (open pit) mining methods, Smith, et. al. produced an estimated 125 flasks of mercury in a rotary furnace. In 1953, the United States Defense Minerals Exploration Agency (DMEA) granted Smith, et al. a loan to explore the deeper parts of the shear zone. With DMEA's grant money, and under the DMEA's supervision, Smith, et. al. constructed a 300 -foot -deep shaft (historically referred to as the DMEA Shaft) during the period from August 15, 1953 to January 16, 1954. After completing the DMEA Shaft, Smith, et. al. turned southeast with a 77- foot -long crosscut in dry shale, in the direction of the shear zone mined by Bradley. At the surface, Smith, et. al. constructed dump tracks to the north and across the road (away from the pre- existing Bradley waste piles at the southeast portion of the Site) to an "unlimited location" (Schuette, 1954), presumably on the north facing slope in the Dunn Creek Watershed, where a large waste rock dump is located, as mapped by Pampeyan (1963). Smith, et. al. assigned their lease and DMEA contract to J. L. Jonas and J. E. Johnson in January 1954. Jonas and Johnson extended the lateral drift to 120 feet, but stopped after encountering water and gas. The DMEA Shaft and workings flooded on February 18, 1954 and, subsequently, Jonas and Johnson abandoned the project.
Cordero Mining Company (Cordero) acquired a lease for the Mine Site from Mt. Diablo Quicksilver dated November 1, 1954 and in January 1955 began reconditioning the DMEA Shaft. Cordero replaced failed lagging, mucked out and dewatered the DMEA Shaft bypassing the Jonas and Johnson lateral tunnel, and drove a series of crosscut and drift tunnels a total of 790 feet from the DMEA Shaft to the shear zone. Intense rain storms during December 1955 increased the normal flow of mine water beyond pumping capacity and resulted in re- flooding of the DMEA/Cordero mine workings (Pampeyan and Sheahan, 1957), at which point Cordero suspended operations. The total period of active mining operations by Cordero at the Mine are documented to be just 12 months.
Following the work by Cordero, the Mine remained idle until March 1956, when the Cordero lease was transferred to Nevada Scheelite, Inc., which began dewatering with a 500 gallon per minute (gpm) pump. Nevada Scheelite apparently operated an unidentified portion of the Mine Site from
Mining Waste Characterization Rpt Final 8- 2- 10.doc 2 -2 The Source Group, Inc.

Characterization Report Mount Diablo Mercury Mine, Contra Costa County, California August 2, 2010
1956 to 1958. Downstream ranchers objected to Nevada Scheelite's discharge of acid mine waters to the creek and the operation was suspended. Nevada Scheelite relinquished its lease after developing an unknown tonnage of ore from the open pit. The disposition of materials generated by Nevada Scheelite is not documented, but can be inferred based on site surveys to either supplement or slightly expand tailings and waste rock piles created by Bradley Mining Company.
In June 1958, a State Water Pollution Control Board (WPCB) inspection report states the Mine was leased to John E. Johnson and that he was operating it, but he apparently died later that year and the Mine again ceased operation. Subsequent operations on an unidentified portion of the Mine Site were conducted by Welty and Randall Mining Co. from approximately 1965 to 1969. They apparently re- worked mine tailings at the Mine Site, under a lease from Victoria Resources Company (Victoria Resources), which purchased the Mine from Mt. Diablo Quicksilver in May 1962. On or about December 9, 1969, Guadalupe Mining Co. (Guadalupe) purchased the Mine from Victoria Resources. It is unclear whether any operations were conducted by Guadalupe. In June 1974, the current owners, Jack and Carolyn Wessman and the Wessman Family Trust purchased the Mine Site from Guadalupe. In 1977, the Wessmans sold the portion of the Mine Site containing the settlement pond to Ellen and Frank Meyer, but subsequently repurchased it in 1989.
2.3 Cordero Work Areas
The Cordero lease area within the Mine Site is graphically presented on Figure 2 -2 (Aerial Photograph) and on Figure 2 -3 which is overlain on the map of mining produced by the California Division of Mines and Geology (CDMG) in 1963. The lease area excludes a significant portion of the easterly areas of Bradley Mining Company's exposed waste rock, the spring outflow area emanating from the 165' Level Adit from which Bradley operated and the current waste and settlement pond below the Mine adjacent to Morgan Territory Road.
Cordero conducted its underground mining efforts from the pre- existing DMEA Shaft (Pampeyan and Sheahan, 1957). The area of this shaft and the interpreted potential surface work area (no surface mining was conducted, however) is highlighted on Figure 2 -3. Additional documentation indicates that Cordero conducted water handling and treatment operations extending from the DMEA Shaft to a location 1,350 feet to the west within the lease area (Sheahan, 1956 and WPCB, 1955a).
The areas depicted on Figure 2 -3 showing the DMEA Shaft and the waste rock dump area, and the water disposal area west of the DMEA Shaft, are the only documented potential Cordero work areas and represent the extent of known operations by Cordero.
Mining Waste Characterization Rpt Final 8- 2- 10.doc 2 -3 The Source Group, Inc.

Characterization Report Mount Diablo Mercury Mine, Contra Costa County, California August 2, 2010
2.4 Cordero Mining Activity
Cordero mining activity consisted of repairing lagging, and mucking out and de- watering of the existing DMEA Shaft, beginning in January 1955, followed by driving a new crosscut and drifts from the DMEA Shaft on the 360 foot level (360 Level). Cordero's workings totaled 790 feet and extended south from the existing DMEA Shaft (Pampeyan and Sheahan, 1957).
The DMEA/Cordero tunnel system was mapped by investigators for the DMEA as documented in the Report of Examination by Field Team Region Il, Final Report, and dated January 30, 1957 (Pampeyan and Sheahan, 1957). Figure 2-4 depicts the Cordero mine tunnels in plan view and their relationship to the DMEA Shaft and the originally flooded DMEA crosscut that was abandoned by Jonas and Johnson. Figure 2 -5 shows the same plan view of the Cordero tunnel system and includes the Plan view of the entire pre -Cordero tunnel system located to the south. A cross section produced by the DMEA demonstrates the pre -Cordero tunnel system as presented on Figure 2 -6. The Cordero tunnels were advanced at the 360 Level, below the extensive Bradley underground mine workings depicted on Figure 2 -6, but were ultimately connected to the bottom of Bradley's Main Winze shaft via a 15 foot raise (Sheahan, 1956). The Figure 2 -7 plan view outlines of the pre -Cordero and the Cordero workings are transposed on a current aerial photograph for perspective with the current condition of the Mine.
2.4.1 Cordero Materials Disposition
The tunnels advanced by Cordero on the 360 Level totaled 790 feet as documented by Pampeyan and Sheahan (1957). The total volume of waste rock generated by Cordero during its 12 months of operation is calculated using a 20- percent ( %) bulking factor to be approximately 1,228 cubic yards (Table 2 -1). Near the end of Cordero's operational period, Cordero encountered small zones of low- grade ore. Cordero stockpiled that ore for sampling and assay. The DMEA field team inspected the Mine and sampled the Cordero ore stockpile. The total ore generated by Cordero was estimated to be between 100 to 200 tons of ore with a grade of 3 to 10 pounds of mercury per ton (Pampeyan and Sheahan, 1957). This tonnage of ore translates to approximately 50 to 100 cubic yards of ore material.
The calculated total ore and waste rock generated by all documented mining activities prior to and including Cordero is calculated to be approximately 105,848 cubic yards as noted and referenced on Table 2 -1. Based on these material calculations, waste rock and ore generated by the Cordero activities represents less than 1.2% of the estimated total volume of mined material at the entire Mine Site.
The final disposition of the Cordero mined ore and waste rock was ascertained through a review of "before and after" maps of the Mine created by Pampeyan for the CDMG in 1954 and 1963, and a review of aerial photographs before and after the Cordero operational period. Pampeyan (1963) prepared maps of the underground mine workings, waste rock dumps and general mine
Mining Waste Characterization Rpt Final 8- 2- 10.doc 2-4 The Source Group, Inc.

Characterization Report Mount Diablo Mercury Mine, Contra Costa County, California August 2, 2010
information. Figure 2 -8 illustrates the proposed location of the DMEA Shaft. In 1956/57, following mining by the DMEA and Cordero, Pampeyan updated this map as published in the document "CDMG, Special Report 80, Plate 3" dated 1963. The updated map is shown as Figure 2 -3. A comparison of the maps shows the location of the DMEA Shaft and the addition of waste rock adjacent to the DMEA Shaft that did not exist on the 1954 map as demonstrated on Figure 2 -9. The map clearly shows that material generated by DMEA and Smith, et al. during the sinking of the DMEA Shaft was located immediately adjacent to the DMEA Shaft. Site inspections in 2008 confirmed that the pile of waste rock adjacent to the DMEA Shaft on the 1956 map no longer exists (Figures 2 -3 and 2 -9). Based on interviews with the current property owner Jack Wessman, he stated that he used the waste rock adjacent to the DMEA Shaft to re -fill the DMEA Shaft.
Additionally, the Pampeyan 1963 map depicts a large "waste dump" located to the north of the DMEA Shaft (Figure 2 -3). This waste rock dump is clearly seen in an aerial photograph from 1952, indicating that it appeared active at that time as shown on Figure 2 -10. Dump tracks were extended north and across the road to an "unspecified location" (Schuette, 1954) by Smith, et al., presumably on the north- facing slope in the Dunn Creek Watershed where the large waste rock dump is mapped by Pampeyan (1963). Review of an aerial photograph from 1957 (Figure 2 -11) also confirms the location of the large waste dump to the north of the DMEA Shaft, although the clarity of this photograph does not allow determination of changes as compared to the 1952 photo. The large waste dump north of the DMEA Shaft was inspected in 2008. The waste dump is on a
that are now densely covered with vegetation. The condition of the waste dump in 2008 can be seen on the aerial photo presented as Figure 2 -2.
In summary, maps and aerial photos combined with anecdotal information from the current property owner indicate that material generated by Cordero in 1955 was hoisted out of the DMEA Shaft and placed adjacent to the Shaft in a waste pile that has subsequently been placed back into the Shaft. Additionally, most or all of any remaining waste rock, if any, generated by Cordero was likely disposed of in the large waste rock dump located immediately north of the DMEA Shaft via the rail tracks installed by Smith, et al. in 1954 expressly for this purpose (Schuette, 1954).
2.5 Previous Investigations
The potential for contamination of Marsh Creek has long been of concern, resulting in considerable sampling of Marsh Creek, Dunn Creek, Horse Creek, pond effluent, etc., over the past 50+ years (WPCB Document Log). Sampling events have been conducted by the following entities or persons:
CRWQCB and its predecessor, the WPCB, as part of inspection visits to the Mine that have occurred since the late 1930's;
J.L. lovenitti, Weiss Associates, and J. Wessman, as part of Mount Diablo Mine Surface Impoundment Technical Report dated June 30, 1989; and
Mining Waste Characterization Rpt Final 8- 2- 10.doc 2 -5 The Source Group, Inc.

Characterization Report Mount Diablo Mercury Mine, Contra Costa County, California August 2, 2010
Prof.Darell G. Slotton, U.C. Davis, as part of the Marsh Creek Watershed Mercury Assessment Project conducted in March 1996, July 1997, and June 1998.
These previous investigations are summarized in the following sections.
2.5.1 State Water Pollution Control Board / California Regional Water Quality Control Board Investigations
Since the late 1930's, the CRWQCB and its predecessor, the WPCB, conducted inspection visits to the Mine. During these inspections, surface water grab samples were collected under varying conditions (ranging from high runoff periods, to periods of little or no runoff). The surface water samples were collected from the following sampling locations:
Dunn Creek (at various locations);
Horse Creek (upstream of pond outlet);
Perkins Creek (above the confluence with Marsh Creek);
Curry Creek (above the confluence with Marsh Creek);
Marsh Creek (at various locations);
Drainage from Mine/Tailings on Wessman Property;
Drainage from ponded area, north of tailings;
Springs on State Park Land;
Alkali Spring below and east of pond /dam;
Mine pond;
Zuur well;
Prison Farm well; and
Marsh Creek Springs Resort well.
These samples were analyzed for general water quality parameters and metals. A summary of these water sample results has been compiled into an Excel table format and is included as Appendix A.
2.5.2 J.L. lovenitti, Weiss Associates, and J. Wessman Mount Diablo Mine Surface Impoundment Technical Report
In 1989, a technical report was prepared as part of the application to qualify for an exemption authorized by the Amendment to the Toxic Pits Cleanup Act of 1984 (lovenitti, 1989). This investigation focused on characterizing the surface impoundment located at the Mine. This report evaluated the geohydrochemical setting of the surface impoundment, the source of contaminants in the surface impoundment, and waste control alternatives and preliminary cost estimates for
Mining Waste Charaderization Rpt Final 8- 2- 10.doc 2 -6 The Source Group, Inc.

Characterization Report Mount Diablo Mercury Mine, Contra Costa County, California August 2, 2010
these alternatives. This report characterized the contaminants in the surface impoundment based on historical data. From 1953 through 1988, eleven water samples were collected from the surface impoundment. The surface water samples were analyzed for general water quality parameters and metals. The results indicated that the metals concentrations detected in the water within the surface impoundment exceeded the primary drinking water standards. As summarized in the table in Appendix A of this report, in April and May of 1989, nine surface water samples were collected by J.L. lovenitti, a consulting geoscientist in Pleasant Hill, California. These surface water samples were collected from Dunn Creek (various locations), Ore House Spring, the creek above the Northern Pond, the Northern Pond, and the surface impoundment (two locations).
2.5.3 Prof. Darell G. Slotton, Marsh Creek Watershed Mercury Assessment Project
A three year study (1995, 1996, and 1997) of the Marsh Creek Watershed was conducted by Contra Costa County to comprehensively determine the sources of mercury in the Marsh Creek Watershed, both natural and anthropogenic. These studies were also used to document mercury concentrations in indicator species, surface water, and sediment to evaluate mercury bioavailability within the Marsh Creek Watershed. These studies were designed to characterize baseline conditions of the Marsh Creek Watershed and to evaluate the relative effectiveness of potential future remedial actions at the Mount Diablo Mine.
The results of the 1995 study are summarized in a March 1996 report titled "Marsh Creek Watershed 1995 Mercury Assessment Project - Final Report" prepared by Darell G. Slotton, Shaun M. Ayers, and John E. Reuter (Slotton, et. al, 1996). The 1995 study evaluated all aspects of mercury loading within the Marsh Creek Watershed. As part of this Mercury Assessment Project, sampling was conducted at the Mine area, including the Lower Pond, the spring on State Park property, the spring emanating from the tailings pile, and other locations upstream in Dunn Creek and downstream along Marsh Creek. The chemical results of the Slotton et. al. 1996 study in the Mine area are summarized in Table 2 -2.
The results of the 1996 study are summarized in a July 1997, report titled "Marsh Creek Watershed Mercury Assessment Project - Second Year (1996) Baseline Data Report" prepared by Darell G. Slotton, Shaun M. Ayers, and John E. Reuter (Slotton, et. al, 1997). In this second year of a three - year baseline study, the 1996 study focused on evaluating mercury availability in indicator species and sediment within stream sites and the Marsh Creek Reservoir. 175 individual and composite samples of invertebrates, sediment, and young fish from 13 stream sites and the Marsh Creek Reservoir were collected for this study (Slotton, et. al., 1997).
The results of the 1997 study are summarized in a June 1998 report titled "Marsh Creek Watershed Mercury Assessment Project - Third Year (1997) Baseline Data Report with 3 -Year Review of Selected Data" prepared by Darell G. Slotton, Shaun M. Ayers, and John E. Reuter (Slotton, et. al, 1998). In this final year of a three year baseline study, similar to the 1996 study, the study focused on evaluating mercury availability in indicator species and sediments within stream
Mining Waste Characterization Rpt Final 8- 2- 10.doc 2 -7 The Source Group, Inc.

Characterization Report Mount Diablo Mercury Mine, Contra Costa County, California August 2, 2010
sites and the Marsh Creek Reservoir. 137 individual and composite samples of invertebrates, sediment, and young fish from 12 stream sites and the Marsh Creek Reservoir were collected for this study (Slotton et. al., 1998).
Based on the results of the 3 -year study and extensive sampling of the entire Marsh Creek Watershed, the Slotton report concluded that the Mount Diablo Mercury Mine, and specifically the exposed tailings and waste rock (Bradley Mining Company's waste) above the existing pond was the dominant source of mercury in the watershed. Sampling of Dunn Creek above the Lower Ponds indicated minimal sourcing of mercury was occurring from the watershed immediately above the Lower Pond.
2.6 Previous Remedial Actions
Since the operations of Cordero in 1955, multiple operators and property owners have been involved in actions that have modified some of the physical features of the general Mine area. Most notably, the current property owner, Jack Wessman, over the period of his ownership since 1974, has conducted work in an effort to minimize the impact of exposed mine waste material to surface water runoff. This work has included earth moving at the Mine involving the importation of a large quantity of fill material (reported by Jack Wessman to be on the order of 50,000 cubic yards) and the movement and grading of this fill material around the Mine Site to cap Mine waste.
Based on discussions with Jack Wessman conducted during Site inspections in 2008, this work has specifically included: 1) infilling and capping of the original collapsed mine workings located to the north of the DMEA Shaft and Cordero work area, 2) filling of the DMEA Shaft and filling and capping of waste rock below the shaft toward the furnace, 3) filling and capping of a small pond located west of the DMEA Shaft, 4) grading of waste rock and tailings piles located to the east of and overlying the mine workings as part of surface drainage control actions, 5) re- configuring, enhancing and maintaining impoundments around the lower waste ponds, and 6) installing drains and drainage pipe for the purpose of redirecting surface rainfall runoff in the upper Mine area around the exposed tailings and waste rock into Dunn Creek directly bypassing flow through the Lower Pond.
Current surface drainage for the upper Mine areas, including the Cordero operations around the DMEA Shaft area, is captured and routed around the exposed tailings and waste rock and around the Lower Pond emptying directly into Dunn Creek at a location up- gradient of the Lower Pond.
In response to an Order from the United State environmental Protection Agency, work at the Site was conducted by Sunoco in 2008/2009 involving the emergency stabilization of the southeastern wall of the Lower Pond's impoundment dam to prevent continued storm flow erosion of the impoundment. This work was documented in the SGI report titled "Final Summary Report For Removal Action to Stabilize The Impoundment Berm, January 28, 2009 ".
Mining Waste Characterization Rpt Final 8- 2- 10.doc 2 -8 The Source Group, Inc.

Characterization Report Mount Diablo Mercury Mine, Contra Costa County, California August 2, 2010
3.0 FIELD INVESTIGATION AND SAMPLING
3.1 Objective
Work conducted by SGI on behalf of Sunoco has included research, acquisition, review and analysis of existing published information and data related to the former Mine and attendant water quality impacts, field surveys of the Mine conducted over a period of two years, property owner interviews, and two surface water sampling events at the Mine Site. This work, and the additional work proposed to be conducted in this Report, provides a basis for Sunoco to comply with the CRWQCB requirement to investigate both the nature and extent of mining waste at the Mine Site and the nature of attendant impacts as requested by the CRWQCB in its Revised Technical Reporting Order R5- 2009 -0869 (Rev. Order) of December 30, 2009.
The research conducted has uncovered more than 50 years of chemical monitoring data and two previous investigations as discussed in Section 2.6. Based on the results of this long history of data collection and analysis, and upon our initial research, analysis and field surveys, we have reached the following conclusions relevant to implementation of potential remedial actions to control the primary sources of mercury loading from the Mine Site to Marsh Creek and environs:
The majority (93% of loading from the Mine area calculated by Slotton, 1995) of mercury loading to Marsh Creek is derived from surface water runoff moving over the exposed Bradley Mining Company -generated tailings along the eastern edge of the Mine; Generation of methyl mercury within existing pond sediments appears insignificant; and Remedial actions focused on the Bradley Mining Company tailings would result in a 93% (Slotton 1995) reduction in mine waste related impacts to Marsh Creek.
The surface water sampling events conducted in April and May of 2010 were focused on the objective of more fully establishing the credibility of these initial conclusions. The following sections detail the work conducted and the results of this work.
3.2 Field Surveys
Over the last two years, SGI on behalf of Sunoco has conducted numerous field surveys of the Mine Site, including two rounds of surface water sampling in 2010. Initial field surveys of the Mine Site focused on visual analysis of current conditions and how they relate to the extensive body of historical documentation that exists for the Site such as United States Geological Survey (USGS) mine and topographic mapping surveys, geologic maps, corporate documentation of mining activities, and regulatory agency assessment documentation. Using the historical topographic and mining survey maps, the geographic coordinates of current Site features that exist on the historical maps were identified using a hand -held GPS- device. These coordinates allowed for the geo- referencing of Site features found on historical maps that are no longer in existence, such as mine
Mining Waste Characterization Rpt Final 8- 2- 10.doc 3 -1 The Source Group, Inc.
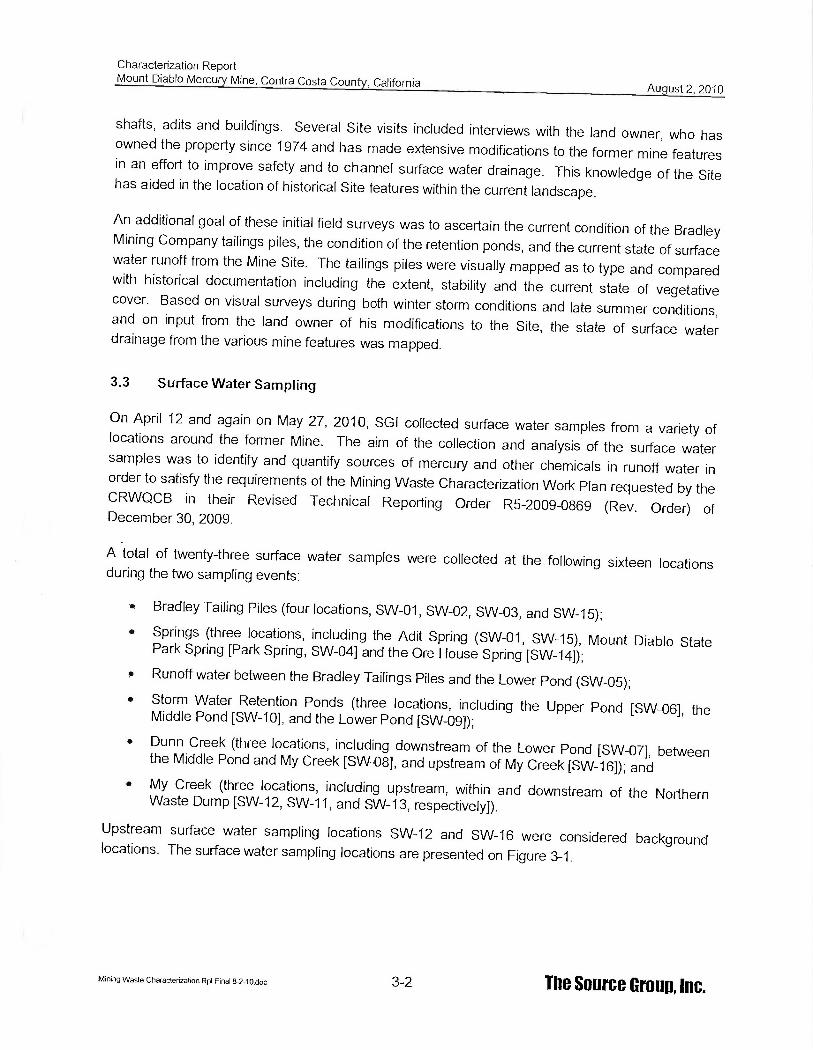
Characterization Report Mount Diablo Mercury Mine, Contra Costa County, California August 2, 2010
shafts, adits and buildings. Several Site visits included interviews with the land owner, who has owned the property since 1974 and has made extensive modifications to the former mine features in an effort to improve safety and to channel surface water drainage. This knowledge of the Site has aided in the location of historical Site features within the current landscape.
An additional goal of these initial field surveys was to ascertain the current condition of the Bradley Mining Company tailings piles, the condition of the retention ponds, and the current state of surface water runoff from the Mine Site. The tailings piles were visually mapped as to type and compared with historical documentation including the extent, stability and the current state of vegetative cover. Based on visual surveys during both winter storm conditions and late summer conditions, and on input from the land owner of his modifications to the Site, the state of surface water drainage from the various mine features was mapped.
3.3 Surface Water Sampling
On April 12 and again on May 27, 2010, SGI collected surface water samples from a variety of locations around the former Mine. The aim of the collection and analysis of the surface water samples was to identify and quantify sources of mercury and other chemicals in runoff water in order to satisfy the requirements of the Mining Waste Characterization Work Plan requested by the CRWQCB in their Revised Technical Reporting Order R5- 2009 -0869 (Rev. Order) of December 30, 2009.
A total of twenty -three surface water samples were collected at the following sixteen locations during the two sampling events:
Bradley Tailing Piles (four locations, SW -01, SW -02, SW -03, and SW -15); Springs (three locations, including the Adit Spring (SW -01, SW -15), Mount Diablo State Park Spring [Park Spring, SW -04] and the Ore House Spring [SW -14]); Runoff water between the Bradley Tailings Piles and the Lower Pond (SW -05); Storm Water Retention Ponds (three locations, including the Upper Pond [SW -06], the Middle Pond [SW -10], and the Lower Pond [SW -09]);
Dunn Creek (three locations, including downstream of the Lower Pond [SW -07], between the Middle Pond and My Creek [SW -08], and upstream of My Creek [SW -161); and My Creek (three locations, including upstream, within and downstream of the Northern Waste Dump [SW -12, SW -11, and SW -13, respectively]).
Upstream surface water sampling locations SW -12 and SW -16 were considered background locations. The surface water sampling locations are presented on Figure 3 -1.
Mining Waste Charaderization Rpt Final 8- 2- 10.doc 3 -2 The Source Group, Inc.

Characterization Report Mount Diablo Mercury Mine, Contra Costa County, California August 2, 2010
3.3.1 Sample Collection Procedures
Samples were collected in clean laboratory supplied containers by allowing flowing surface water to enter into the container. In some cases (generally resulting from a lack of access), a clean glass jar was used to initially capture the water sample, which was then subsequently decanted into the appropriate container. If water was observed emerging from the wet area, the sample was collected as close to the origin as possible. Field parameters including temperature, dissolved oxygen, and conductivity were measured with equipment pre -calibrated, according to the manufacturer's instructions. Each sample collected was placed on ice and transported to California -certified Accutest Laboratory located in San Jose, California. Chain -of- custody procedures were followed at all times. Chain -of- custody documentation is included with the laboratory reports in Appendix C.
3.3.2 Equipment Decontamination
No reusable sampling equipment was employed during the collection of the samples. Following the collection of each sample, all sampling equipment, such as gloves, was properly disposed of and not reused for any subsequent sample collection.
3.3.3 Laboratory Analysis
In addition to field parameters, the surface water samples were analyzed for the following parameters:
Total Mercury;
Dissolved Mercury;
Methyl Mercury;
pH;
Alkalinity (Bicarbonate, Carbonate and total);
Dissolved Organic Carbon;
Specific Conductivity;
Total Dissolved Solids;
Hardness (as CaCO3);
Turbidity;
Dissolved Silica;
Cations -B, K, Fe, Mn, Mg, Ca, Na, Si.;
Anions - CI, F, SO4, Br, NO3, Zn, As.; and
Remaining Priority Pollutant Metals- Sb, Be, Cd, Cr, Cu, Pb, Ni, Se, Ag, TI.
Mining Waste Characterization Rpt Final 8- 2- 10.doc 3 -3 The Source Group, Inc.

Characterization Report Mount Diablo Mercury Mine, Contra Costa County, California August 2, 2010
4.0 INVESTIGATION RESULTS
4.1 Field Survey Results
Field surveys were conducted over a period of two years. These surveys included inspection of waste materials and tailings piles, assessment of general material types, inspections of springs, inspections of ponds, inspections of historic mine features that remain, and inspections of remedial actions conducted by Site owner Jack Wessman. These inspections also included observing and mapping of surface water flow patterns during and after storm events over the course of two winters.
4.1.1 Materials Mapping
Figure 4 -1 presents a Site aerial photo depicting mine waste and features mapped at the Site. Features noted include areas capped by Jack Wessman, areas of exposed mine waste rock, areas of well -sorted processed mine tailings (Calcine), areas of general waste dumping including waste rock generated by a rock quarry that was located west of the Mine Site and operated by Bradley Mining Company, and the locations of the three surface water collection ponds.
Figure 4 -2 includes these same material features with an overlay of historic mine features depicting mine tunnels and waste piles mapped by the USGS (Pampeyan, 1963). Photographs of these different materials and features at the Site are included in Appendix B.
An example of a capped area is depicted on photograph B -1 in Appendix B showing the capped area located at the top area of the Bradley tailings piles and waste rock. Photograph B -2 depicts the capped area overlying the historic collapsed main mine workings area. These caps are composed of clean -imported fill and reported by Jack Wessman to range in thickness from 10 to 20 feet.
Materials mapped in the northern waste dump include two main types. Near the DMEA shaft location at the central southern boundary of the northern waste dump, a relatively small area of materials was identified as indicated on Figure 4 -1 to consist of material similar to non -ore related waste rock seen in other parts of the Mine. The majority of material in the remainder of the northern waste dump appears to be composed of large boulder -sized waste rock derived from a former Bradley Mining Corporation quarry operation. The location of the quarry is to the west of the Mine area.
Bradley waste rock and tailings present in the eastern portion of the Mine Site remain exposed above the location of the Lower Pond, and due to their chemistry, are devoid of vegetation. These materials are noted based on historic and current sampling data to be acid -generating materials
Mining Waste Characterization Rpt Final 8- 2- 10.doc 4 -1 The Source Group, Inc.

Characterization Report Mount Diablo Mercury Mine, Contra Costa County, California August 2, 2010
(Figure 4 -2). Field observations of the exposed waste rock in these areas confirm the presence of sulfate -type waste rock material consistent with the ability to generate acidic surface water runoff.
Fully processed ore rock (tailings) is a well sorted granular material called Calcine and is also mapped on Figures 4 -1 and 4 -2. At this Mine, the Calcine is reddish in color and the exposed piles of Calcine are devoid of vegetation. The amount of Calcine present in this area appears to be significantly less than that which was produced by the Bradley Mining Company based on the volume of mercury produced. As a result, it can be assumed that additional Calcine like material may be incorporated within other waste rock/tailings at the Mine Site.
4.1.2 Surface Flow Mapping
Surface flow assessment was focused on identifying areas of surface water runoff into the three ponds located to the east of all the Mine working areas. Based on the field surveys, an interpreted surface drainage map was developed as presented on Figure 4 -3. Three main areas of surface flow drainage are highlighted on Figure 4 -3. These include uncontrolled surface runoff over exposed Bradley tailings that moves directly into the Lower Pond (depicted in red on Figure 4 -3), surface flow moving from potential Cordero work areas at the Mine (depicted in yellow on Figure 4- 3), and surface flow from the remaining mine workings area (depicted in green on Figure 4 -3). Remedial efforts conducted by Jack Wessman included the capping of areas in the old mine workings and on top of the Bradley tailings piles. As part of this capping work by Wessman, surface drainage controls were installed that capture water from the upper workings area to re- direct it around the exposed acid generating Bradley tailings. This captured flow is directed into the Upper Pond which then flows into the Middle Pond, and hence flows directly into Dunn Creek (photograph B -3 in Appendix B).
Surface flow over the northern waste dump and the northern part of the former potential Cordero work areas drains to the north into My Creek which then empties into Dunn creek above the location of the three ponds as shown on Figure 4 -3. This flow moves through the Wessman- created pond that straddles My Creek in the area below the northern waste dump.
Surface flow moving over the exposed Bradley tailings piles moves directly into the Lower Pond. When this pond fills, water moves out of the overflow ditch located on the southwest corner. This flow then combines with flow emanating from the Park Spring and moves into Dunn Creek below the pond impoundment. Inspections and observations of the Lower Pond indicate that seepage of pond water through the toe of the impoundment represents a likely steady flow of water derived from Bradley mine waste material into Dunn Creek.
4.1.3 Spring Flows
Three springs have been identified historically and inspected as part of the field survey. These include the Park Spring, the Adit spring, and the Ore House spring. The Park Spring (photograph
Mining Waste Charaderization Rpt Final 8- 2- 10.doc 4 -2 The Source Group, Inc.

Characterization Report Mount Diablo Mercury Mine, Contra Costa County, California August 2, 2010
B -4 in Appendix B) is located on the southern perimeter of the Mine working area as depicted on Figure 4 -3. The Park Spring is perennially flowing as observed during our surveys and corroborated by property owner Jack Wessman. The Park Spring flows into what has been called Horse Creek, then moves directly adjacent and below the impoundment of the Lower Pond, entering Dunn Creek below the Lower Pond. Some surface flow runoff from the extreme southern area of the Bradley tailings piles comingles with the Park Spring water in the area just above the Lower Pond during rain events. The only known measurement of flow rate for the Park Spring was conducted by Slotton (1995) and was measured at 0.32 cubic feet per second (cfs) in late March of 1995 following an extensive period of storms (Slotton, 1995). As a result of the timing of measurement by Slotton, this flow rate likely can be considered on the high side of the range for spring base flow from this location.
The Adit spring location coincides generally with the location of the former 165 foot level Adit which was the only lateral entrance to the historic underground mine workings of Bradley Mining Company (Figure 2 -3). This coincident location was confirmed based on geo- referencing of Site features based on the USGS mine and topographic mapping survey (Pampeyan, 1963). The Adit spring is perennially flowing as observed during our surveys and corroborated by property owner Jack Wessman over his period of ownership since 1974. Between our April and May 2010 sampling events, the first emanation point of what is interpreted as the Adit spring moved down - slope. Thus, sampling locations for the Adit spring plot at different locations for the April data (SW- 01) and the May data (SW -15). The SW -01 location plots very near the geo- referenced location of the former 165 foot level Adit that is currently buried beneath waste rock and tailings. The SW -15 location plots immediately downgradient of this location where the emanation point has been previously noted in summer conditions during these field surveys. The higher emanation point for the SW -1 sample location is interpreted to be a result of higher saturation conditions within the waste rock and tailings as a result of extensive storms and total precipitation prior to the April sampling event.
Flow from the Adit spring flows directly down -gradient over Bradley Mining Company tailings piles and enters the Lower Pond on its southeast bank as sheet flow. As this flow approaches the area to the south of the Lower Pond, it passes over /through material mapped by the USGS as travertine deposit (calcium carbonate) as can be seen on the excerpted USGS map presented as Figure 2 -3. The location of this travertine deposit below the current emanation point of the Adit spring indicates that a spring has been located here historically prior to mining of the ore body.
The only known measurement of flow rate for the Adit spring was conducted by Slotton (1995) and was measured at 0.03 cfs in late March of 1995 following an extensive period of storms (Slotton, 1995). As a result of the timing of measurement by Slotton, this flow rate can also likely can be considered on the high side of the range for spring base flow from this location. Evaluation of flow from the Adit spring in summer and late fall based on field observation estimates conducted by SGI are on the order of 5 to 10 gallons per minute (0.011- 0.022 cfs).
Mining Waste Characterization Rpt Final 8- 2- 10.doc 4 -3 The Source Group, Inc.

Characterization Report Mount Diablo Mercury Mine, Contra Costa County, California August 2, 2010
The Ore House spring is located near the historic mine Furnace Plant and can be seen in
photograph B -5 in appendix B. The Ore House spring is a low flow spring and was not observed to have enough flow during the May sampling event to cause notable overland flow from the spring's emanation point. Flow from this spring currently moves into a drainage ditch and would be
channeled with other surface water in the area that ultimately flows into the Upper Pond. The only known measurement of flow rate for the Ore House spring was made by Slotton (1995) and was measured at 0.01 cfs in late March of 1995 following an extensive period of storms (Slotton, 1995). As a result of the timing of measurement by Slotton, this flow rate can likely be considered on the high side of the range for spring base flow at this location.
4.1.4 Pond Histories and Flow
During the period of mining activities, aerial photographs indicate that the Lower Pond and the Middle Pond were historically merged as one pond (Figure 2 -10). Remedial actions conducted by Jack Wessman to re- direct storm water around mine waste included a re- configuration of the Lower Pond as discussed in Section 2.7. As a result of this work, storm water surface flow from the upper mine workings that would normally mix with the water in the Lower Pond is routed around the Lower Pond to Dunn creek as indicated on Figure 4 -3 (Photograph B -6 in appendix B
demonstrates this flow bypass).
4.2 Development of Surface Water Sampling Locations
Sixteen surface water sampling locations were identified to collect data for one of six categories of surface water quality at the Mine Site, including:
Background Water Quality;
Spring Water Quality;
Pond Water Quality;
Northern Waste Dump Area Runoff Water Quality;
Bradley Mine Waste Runoff Water Quality; and
Downstream Water Quality.
Two sampling locations were identified which would be representative of background water quality (i.e., from areas unaffected by current or former operations at the Mine Site). One of the points was on My Creek while the other was on Dunn Creek. Both of these locations sampled water directly from the respective creeks upgradient of historical operations at the Mine Site. The My Creek sample location was identified as SW -12 while the Dunn Creek sample location was identified as SW -16. Table 4 -1 provides a surface water sample key correlating sample names with locations. Figure 3 -1 depicts all SGI surface water sample locations noted in Table 4 -1.
Mining Waste Characterization Rpt Final 8- 2- 10.doc 4-4 The Source Group, Inc.

Characterization Report Mount Diablo Mercury Mine, Contra Costa County, California August 2, 2010
Photographs the depict various surface water sampling locations and mine waste are included in
Appendix B.
As discussed above, there are three known springs within the Mine Site, the surface water emanations from which are derived from a groundwater source. It is unknown if the groundwater sources of the springs are related to or otherwise connected to former mining operations (such as
underground workings). The first two springs sampled were the Park Spring, located to the south of the Bradley tailings piles, and the Ore House Spring, located adjacent to the former Mine furnace plant building. These spring sample locations are identified as SW -04 and SW -14, respectively. The Adit Spring is the third location, which is interpreted to be spring water derived from where the now buried 165 foot Adit formerly day -lighted. The two sample locations from this area are SW -01 and SW -15
All three main ponds on the Mine Site were sampled. The largest pond on the Mine Site is the Lower Pond. Most of the surface water runoff from the Mine Site, including those from the Bradley tailings piles, is funneled into this pond. The Lower Pond drains directly into Dunn Creek. The Middle Pond is located just to the north of the Lower Pond and receives overflow water from the Upper Pond. The middle pond drains directly into Dunn Creek. Storm water has been channeled from the upper mine workings area into the Upper Pond via the installation of an assortment of culverts and drainage piping. Each pond was sampled near its overflow outlet point, with the Upper Pond identified as SW -06, the Middle Pond identified as SW -10 and the Lower Pond identified as SW -09 (Figure 3 -1).
The northern waste dump area is on a north facing slope which drains into My Creek. Water quality samples were collected at two points along My Creek, including sampling locations SW -11
and SW -13.
Bradley Mining Company waste runoff water quality was sampled from three points on or downgradient from the Bradley tailings piles. Sampling locations SW -02 and SW -03 collected surface water runoff from the upper reaches of the Bradley tailings and the middle of the Bradley tailings, respectively. Sample location SW -05 captures runoff water from the Bradley tailings just prior to entering the Lower Pond.
The downstream water quality sample location was designed to test surface water downgradient of potential significant surface water inputs. Sample location SW -08 is on Dunn Creek downgradient from the contribution from My Creek though still upgradient from the Middle and Lower Ponds. This point was sampled as it should intercept water quality inputs from known Cordero working areas while still upgradient from Bradley work area inputs. Sample location SW -07 is on Dunn Creek downgradient from the contribution from both the Lower Pond and the Mount Diablo State Park Spring. This sample location was designed to determine surface water quality of the combined outflow from all Mine Site sources.
Mining Waste Charadenzation Rpt Final 8- 2- 10.dos 4 -5 The Source Group, Inc.

Characterization Report Mount Diablo Mercury Mine, Contra Costa County, California August 2, 2010
4.3 Surface Water Sampling Results
The April 12 sampling event experienced different environmental conditions relative to the May 27
sampling event. The day of the April sampling event and the day leading up to it combined to
produce approximately 1.5 inches of rainfall. Significant quantities of surface water runoff had
resulted in outflow from all three ponds and Dunn Creek overflowing its banks. The majority of the
flow downstream of the ponds came from the overflowing Dunn Creek.
The day of the May 27 sampling event and the two days leading up to it combined to produce only
approximately 0.5 inches of rainfall. There was no outflow from any of the ponds and Dunn Creek
was well within its established banks. The volume of surface water runoff was minimal in
comparison to the April event with adequate overland flow sampling locations being less abundant.
The results of the sampling allowed for the characterization of each surface water collection
location both chemically by analyzing concentrations and ratios of certain cations and anions, and
as a source for mercury loading by comparing concentrations.
Table 4 -1 provides a sample location key to correlate sample names with sample locations. All of
the water quality data collected by SGI in 2010 is summarized on Table 4 -2. Complete laboratory
reports for both sampling events are included as Appendix C. Figure 4-4 depicts the surface water
sampling locations with mercury (including total and dissolved) and methyl mercury sampling
results posted for ease of review.
No detectable concentrations of mercury were found in any of the samples from My Creek (SW -11,
SW -12, and SW -13) or in the Dunn Creek background sample (SW -16). The Dunn Creek sample
below the My Creek drainage (SW -08) had a detectible concentration of total mercury in the April
sample, but none in the May sample. All three of the ponds had detectable concentrations of
mercury, though the concentrations in the Lower Pond were distinctly higher than those in the
Middle Pond and the Upper Pond. The Park Spring and the Ore House Spring samples both
contained low but detectable concentrations of mercury. Two samples were collected near the Adit Spring location, with the one higher in elevation (SW -01) showing low mercury concentrations
(similar to the other springs) while the lower elevation sample location (SW -15) shows significantly
elevated concentrations. The highest concentrations of mercury in surface water samples were
found in those from the Bradley tailings piles (SW -02, 03), with sample location SW -03 being the
highest on the Mine Site.
During the April and May 2010 sampling events methyl mercury was detected at all sample
locations including background locations (Table 4 -2). The total /dissolved mercury and methyl
mercury concentrations were elevated in areas directly downstream of mine waste areas (Adit
Spring, Ponds, Mine Water Runoff). Based on field data collected at the Mine in May 2010
(Table 4 -3), dissolved oxygen ranged from 6.0 to 9.5 milligrams per liter (mg /L). My Creek runoff
samples were collected freefalling from a pipe or weir within a running creek, which resulted in high
Mining Waste Characterization Rpt Final 8- 2- 10.doc 4 -6 The Source Group, Inc.

Characterization Report Mount Diablo Mercury Mine, Contra Costa County, California August 2, 2010
dissolved oxygen levels of 16 to 18.7 mg /L. Although these moderate dissolved oxygen levels do not suggest a significant anoxic environment, the detection of methyl mercury in all the surface water samples indicates limited biomethylation is occurring at the Mine.
The methyl mercury concentrations detected in the mine waste areas (Adit Spring, Ponds, Mine Water Runoff) were above the CRWQCB - San Francisco Bay water quality criteria for methyl mercury in freshwater of 3 nanograms per liter (ng /L; CRWQCB, 2008a). Water quality criteria for methyl mercury was not available in the CRWQCB Central Valley compilation of water quality goals (CRWQCB, 2008b) or USEPA National Recommended Water Quality Criteria (USEPA, 2009). Methyl mercury concentrations did not exceed the water quality criteria at any other sampling locations, including background samples. Statistical analysis of the methyl mercury data for all of the surface water data with the exception of the two background sample locations was conducted to determine the 95- percent upper confidence limit of the mean (95UCL), using a USEPA software package called ProUCL Version 4.00.04. ProUCL and USEPA (2009b) guidance make recommendations for estimating 95UCLs and were developed as tools to support risk assessment. Based on this analysis, the 95UCL for methyl mercury sampled is 2.8 ng /L, which is less than the applicable water quality criteria. The ProUCL output spreadsheet that summarizes this statistical analysis is presented in Appendix D.
Although methyl mercury concentrations immediately downstream of mine waste areas were elevated, methyl mercury was detected at 0.736 and 1.47 ng /L (below water quality criteria) in the furthest downstream sample (SW -07). Once mercury is converted to methyl mercury it is readily absorbed by biota in aquatic ecosystems and concentrates in tissue of fish and other aquatic organisms. Based on the 1995 Slotton study, no benthic invertebrate bioindicators or fish were sampled in the surface water sample locations at or near the Mine because of insufficient concentrations of organisms. In the Slotton studies, aquatic organisms were only collected from areas further downstream from the Mine. The data collected in 2010 indicate that methyl mercury concentrations immediately downstream of the Mine (SW -07) are below water quality criteria and suggest that without the introduction of other sources of mercury, methyl mercury concentrations would continue to decrease further downgradient due to dilution. Consequently, in areas downstream of the Mine Site where there is enough surface water to support aquatic organisms, the methyl mercury concentrations are below water quality criteria.
General water quality parameter data detailed in Table 4 -2 were analyzed to evaluate total water quality signatures relevant to the variable locations of the samples. Through the use of Piper and Durov diagrams (Figure 4 -5 and Figure 4 -6), a graphical representation of the chemical signature of each water sample is plotted relative to the entire set of water samples. In each case, the water chemistry results plotted on the center shape (a diamond in the case of the Piper diagram and a square in the case of the Durov diagram) is a matrix transformation of the ternary graph (the triangle shapes in both diagrams) of select anions (SO4, CI, and HCO3) and the ternary graph of select cations (Ca, Mg, and Na +K). On both diagrams (Figure 4 -5 and Figure 4 -6), there are
Mining Waste Characterization Rpt Final 8- 2- 10.doc 4 -7 The Source Group, Inc.

Characterization Report Mount Diablo Mercury Mine, Contra Costa County, California August 2, 2010
distinct groupings of sample locations suggesting that the waters from the sixteen sampling locations fall into four primary groups as follows:
Mine Waste Source Water, surface flow water that has come into contact with mining waste;
Altered Mine Waste Water, a chemical alteration of mine waste source water after having flowed over travertine deposits;
Park Spring Water, surface flow water with Park Spring as its source; and
Background Water, surface flow water that has not contacted mine tailings at the Site.
Focusing on the Piper diagram on Figure 4 -5, background water quality is characterized by the highest concentrations of both calcium and bicarbonate. The Park Spring water has a balance of cations and anions, thus plotting in the middle of the Piper diagram. The mine waste water is nearly devoid of bicarbonate and has lower concentrations of calcium than the background or Park Spring water. The altered mine waste water is differentiated by a higher concentration of sodium, potassium and chloride (salts).
A Stiff diagram is a graphical representation of the major ion composition of a water sample. A polygonal shape is created from three parallel horizontal axes extending on either side of a vertical axis. They show the relative ratios of cations (plotted on the left hand side) and anions (plotted on the right hand side) plotted in milliequivalents per liter. These diagrams are useful in making rapid visual comparisons between water samples. Stiff diagrams were created for each of the twenty - three collected samples analyzed and are found in Appendix E. For each of the four characteristic water types identified on the Piper diagram, a characteristic Stiff diagram was selected and displayed on Figure 4 -7. For the background sample, the Stiff diagram shows a high ratio of bicarbonate relative to chloride and sulfate, and elevated calcium and magnesium relative to sodium, resulting in an amorphous shape. The Park Spring sample indicates a unique water quality signature in the Stiff diagram with a near balance of both cations and anions, though slightly more bicarbonate and slightly less calcium. Water that has been modified by contact with Mine waste shows a low ratio of sodium and chloride relative to magnesium and especially sulfate, and contains no bicarbonate, with the entire picture looking almost like a boot with the toe pointing to the right (SW -3). Additionally altered mine waste water is similar to the mine waste water above but with a higher ratio of sodium and chloride (SW -5). The boot shape is less pronounced and, in some cases, almost takes on the appearance of two triangles joined at the center of the diagram (Figure 4 -7). The following sections provide additional discussion regarding data relevant to the various water types identified based on the water quality signatures discussed above.
4.3.1 Background Water Quality
The Stiff diagrams for the SW -12 and SW -16 samples define the characteristic amorphous shape of the background samples Stiff diagrams as shown on Figure 4 -7. In both cases, no mercury was
Mining Waste Characterization Rpt Final 8- 2- 10.doc 4 -8 The Source Group, Inc.

Characterization Report Mount Diablo Mercury Mine, Contra Costa County, California August 2, 2010
detected in either sample and pH levels were similar (7.75 in Dunn Creek and 8.20 in My Creek). However, methyl mercury was an order of magnitude higher in Dunn Creek relative to My Creek.
4.3.2 Spring Water Quality
The water quality of the three springs varies in water type. The Park Spring (SW -04) shows a unique signature as demonstrated in its Stiff diagram (Figure 4 -7) However, samples from the Ore House Spring (SW -14) and the Adit Spring (SW -01) exhibit boot shaped Stiff diagrams characteristic of mine waste source water (Appendix E). The pH of the three locations is different ranging from the acidic Adit Spring (pH of 3.95) to the nearly neutral Park Spring (pH of 7.69). Mercury concentrations from all three springs were relatively low with the Ore House Spring, the Adit Spring, and the Park Spring showing total concentrations of 1.3, 2.2 and 0.45 micrograms per liter (pg /L), respectively.
Sample SW -15 is also considered to be an Adit Spring sample, though it was collected approximately 50 -feet downgradient of the SW -01 Adit Spring sample described above. However, the water chemistry and mercury concentrations found in SW -15 are significantly different from those of the SW -01 sample. The SW -15 Stiff diagram resembles that of altered mine waste water. Additionally, the concentration of mercury in SW -15 is 107 pg /L which is significantly higher than that found in SW -01. This leads to the conclusion that the SW -15 water sample may have originated in the Adit Spring, but it was significantly altered by the tailings prior to collection and analysis.
4.3.3 Pond Water Quality
The chemistry of the Upper Pond (SW -06) and the Middle Pond (SW -10) show boot shaped Stiff diagrams (Appendix E) characteristic of mining waste source water. Both contain elevated concentrations of mercury ranging between 18 and 32 pg /L (Table 4 -2). However, the sample from the Middle Pond (SW -10) collected in May shows the Stiff diagram with an amorphous shape typical of background water quality, and contained only 0.21 pg /L of mercury. This suggests that, in the absence of significant amounts of surface runoff, the Middle Pond may receive a significant subterranean inflow of water from Dunn Creek altering the chemistry to near that of the Creek water and diluting the mercury.
The chemistry of the Lower Pond is distinct from that of the Upper and Middle Ponds. The Stiff diagram for the Lower Pond indicates a character that is consistent with that of altered mine waste water and the mercury content ranges from between 88 and 94 pg /L. The Lower Pond is also acidic (pH of 4.5) when compared to the adjacent Middle Pond, which has a nearly neutral pH. This data is consistent with the fact that the Lower Pond receives direct runoff from the Bradley waste rock and tailings piles to the east, and receives direct flow originating from the Adit spring.
Mining Waste Characterization Rpt Final 8- 2- 10.doc 4 -9 The Source Group, hic.

Characterization Report Mount Diablo Mercury Mine, Contra Costa County, California August 2, 2010
The difference in chemistry and of mercury content between the Lower Pond compared to both the Middle and Upper Ponds suggests different histories (and potentially different sources) of the water in each with the Lower Pond clearly receiving altered mine waste water from the Bradley tailings piles. This is consistent with the recent surface water drainage modifications completed by the current landowner. Surface water runoff from the upper part of the Mine Site (the working area) and from the land above the Mine Site has been directed into the Upper Pond by means of drains and culverts. With the exception of the small area of un- capped Calcine piles, this channeled surface water does not have the opportunity to have significant interaction with uncapped mining waste piles, and thus has a different chemical signature and mercury content relative to the water found in the Lower Pond.
4.3.4 Northern Waste Dump Area Water Quality
The two Northern Waste Dump Area samples, SW -11 and SW -13, exhibit amorphous shaped Stiff diagrams characteristic of background water samples (Figure 4 -7). The characterization of these samples as comparable to background water quality is supported by the lack of detected mercury in both samples and the nearly neutral pH readings. These data for the SW -11 and SW -13 samples (Table 4 -2) suggest that the Northern Waste Dump is not a significant source of mining waste impacts to surface water.
4.3.5 Mine Waste Runoff Water Quality
Samples of runoff collected from the Bradley tailings piles, SW -02 and SW -03 (Appendix E),
demonstrate the characteristic shaped Stiff diagrams indicative of water that has been modified by contact with mining waste, which we have designated as mining waste source water (Figure 4 -7). Both samples exhibit high mercury concentrations of 179 and 74 pg /L, respectively for SW -02 and SW -03. Additionally, both exhibit acidic pH ranging from 2.23 to 3.13 indicative of contact with exposed mine waste of acid generating potential.
Sample SW -05 was taken from surface water runoff from the Bradley tailings piles just before it
enters the Lower Pond directly down -gradient of the Adit spring source emanation. Thus, the water has had a significant run down the slope from the tailings including travel over the travertine coated rocks located just east of the Lower Pond. This trip through the tailings and over the travertine area has altered the water chemistry, which is reflected in its Stiff diagram which is characteristic of altered mine waste water (Figure 4 -8). Additionally, the buffering capacity of the travertine (calcium carbonate deposit) has had the effect of raising the pH of the water from the acidic levels found in
SW -02 and SW -03 to nearly neutral. Mercury concentrations are less in sample SW -05 relative to SW -02 and SW -03 suggesting that low mercury water from the Adit Spring might be diluting the runoff water from the Bradley tailings.
Mining Waste Characterization Rpt Final 8- 2- 10.doc 4 -10 The Source Group, Inc.

Characterization Report Mount Diablo Mercury Mine, Contra Costa County, California August 2, 2010
4.3.6 Downstream Water Quality
The samples from Dunn Creek located downstream of the confluence with My Creek but upstream of the ponds (SW -08) has a Stiff diagram that is characteristic of background water. The pH at this location is nearly neutral and mercury content ranged from 0.6 pg /L to non -detect.
The samples from Dunn Creek (SW -07) located downstream of the Lower Pond and downstream of the confluence with the water from the Park Spring exhibit two different characteristic Stiff diagram shapes (Figure 4 -7). The Stiff diagram for the April data showed a background water sample signature reflective of the large flow volumes in Dunn Creek (which had background water chemistry) resulting from the high amount of recent rain (1.5 inches in less than 2 days). This high flow of background quality runoff overwhelmed all of the other chemical signatures that contributed to the outflow to Dunn Creek in April. The Stiff diagram for the May sample data showed signature more indicative of a higher content of water sourced from the Park Spring. This is reflective of the greatly reduced flows in Dunn Creek and that of all the combined outflows down Dunn Creek from the Mine Site, the Park Spring water was the most abundant, thus, dominating the chemical signal. Data from both sampling events showed that pH was nearly neutral and that mercury ranged from 0.74 to 0.64 pg /L.
4.4 Water Quality Criteria Evaluation
The analytical results of the surface water samples collected during the April and May events were also compared to water quality criteria developed for bodies of fresh water by the California CRWQCB (2008) and the US Environmental Protection Agency (2009). Freshwater water quality criteria values exist for many of the tested constituents including mercury (total and dissolved), methyl mercury, pH, and an assortment of water quality parameters and metals. Additionally, there are an alternate set of criteria related to human health for the consumption of water and organism and for the consumption of organisms only. These water quality criteria are found on Table 4 -2 along with the analytical results from the April and May 2010 sampling events. The table has been coded to identify the analytical results that exceed one or more of the water quality criteria.
The criteria for mercury is 0.91 pg /L, which was exceeded by samples obtained from the Ore House Spring (SW -14), the Adit Spring (SW -01 and SW -15), all three ponds (SW -06, SW -09, and SW -10), and runoff from the mining waste tailings piles (SW -02, SW -03 and SW -05). The water quality criteria for consumption related to human health were much lower than the analytical method used was able to resolve (i.e. analytical results for total mercury less than 0.20 pg /L was not resolved, while the human health consumption criteria was 0.05 for water plus organism and 0.051 for organism only). The criteria and sample exceedances for methyl mercury was discussed in Section 4.3.
The criteria for arsenic in freshwater is 250 pg /L, which was exceeded by samples from the Adit Spring (SW -15) and from runoff from the mine tailings (SW -03). It is likely that there is naturally
Mining Waste Characterization Rpt Final8- 2- 10.doc 4 -11 The Source Group, Inc.

Characterization Report Mount Diablo Mercury Mine, Contra Costa County, California August 2, 2010
occurring arsenic in the local rocks, and that the pulverized tailings have exacerbated their release into the environment. The water quality criteria for consumption related to human health were much lower than the analytical method used was able to resolve (i.e. analytical results for arsenic less than 10 pg /L was not resolved, while the human health consumption criteria was 0.018 for water plus organism and 0.14 for organism only).
Freshwater water quality criteria additionally exist for tested constituents including pH, alkalinity, total dissolved solids, cadmium, chloride, chromium, iron, lead, nickel, selenium, and zinc. With the possible exceptions of cadmium, lead, and selenium (based on their elevated detection limit thresholds relative to the water quality criteria), all of these constituents exceeded their water quality criteria for one or more samples collected during the April and May sampling events. As the downstream sample (SW -07) represents the combined runoff from the Mine Site, the only freshwater water quality criteria exceeded from this location include alkalinity, total dissolved solids, iron, nickel, and potentially cadmium, lead and selenium. None of the downstream samples exceeded the criteria for mercury, methyl mercury or arsenic.
4.5 Comparison to Historical Data
The sampling results from April and May of 2010 painted a coherent picture of the current state of the surface water flow, the four chemically distinct types of surface water, and of the sources of mercury from the Mine Site. The CRWQCB has been collecting historical water quality data dating back to 1939 from the Mine Site and the surrounding area. In 1995, Slotton collected a round of surface water chemical and flow data from the Mine Site and published his results including mercury loading calculations. The availability of the CRWQCB and the Slotton data allows for the comparison of historic Mine Site conditions to those based on the 2010 data set.
4.5.1 Historic Pond and Other Data
An extensive set of surface water data for the Mine Site and surrounding area, collected by the CRWQCB and other unidentified parties was compiled by Weiss and Wessman (J.L. lovenitti, Weiss Associates, and J. Wessman, 1989) and can be found in its entirety summarized in Table form in Appendix A. Also included in Appendix A are sample keys indicating the locations of samples detailed in the Table 4 -1. Matching historical sample location descriptions with current sampling locations allows for the comparison of the two sets of data. Table 4-4 show historic surface water total mercury and pH results and their dates of collection matched with the best approximate current sampling location equivalent (Figure 4-4). Six sampling locations were identified at which historical data could be compared to the current data set. These locations included:
The Ore House Spring (SW -14);
Surface water runoff from tailings above the Lower Pond (SW -05);
Mining Waste Characterization Rpt Final 8- 2- 10.doc 4 -12 The Source Group, Inc.

Characterization Report Mount Diablo Mercury Mine, Contra Costa County, California August 2, 2010
Dunn Creek downstream of the Lower Pond (SW -07);
Dunn Creek upstream of the Lower Pond (SW -08);
The Lower Pond outlet to Dunn Creek (SW -09); and
Park Spring uphill from the mine tailings (SW -04).
Table 4 -5 shows the comparison of mercury results between the historical data and the data collected by SGI. Historically, concentrations of mercury have ranged higher than what was collected in 2010. Significant fluctuations in mercury concentrations were found in the data from Dunn Creek (SW -07) which ranged from 4 pg /L in 1978 to 72 pg /L in 1975, and from the Lower Pond Outlet (SW -09) which ranged from 1.8 pg /L in 1978 to 152 pg /L in 1984. However, the consistency lies in the fact that the highest historic concentrations of mercury have been found emanating from mine tailings runoff water.
Figure 4 -8 shows the visual comparison of water chemistry results via the use of Stiff diagrams between the historical data and the SGI collected data. In some cases, there is a significant difference between the water chemistry. These differences could indicate that there have been historical changes in drainage or alterations to the chemistry of the springs. However, it is most likely due to differences in sampling locations and runoff conditions during sampling events.
4.5.2 Slotton Data
A three year study of the Marsh Creek Watershed was conducted by Contra Costa County to comprehensively determine the sources of mercury in the Marsh Creek Watershed, both natural and anthropogenic. The results of the 1995 study are summarized in a March 1996, report titled "Marsh Creek Watershed 1995 Mercury Assessment Project - Final Report" prepared by Darell G. Slotton, Shaun M. Ayers, and John E. Reuter (Slotton et. al, 1996). The Slotton report analyzed select water chemistry, sediment loading and flow at eighteen different locations within the Marsh Creek Watershed, with eight of them within the Mine Site itself. Based on the analysis of the data collected, Slotton came to the following conclusions:
The Lower Pond is not acting to "settle out" a significant portion, if any, of the aqueous mercury flowing into it from the mine tailings;
Dunn Creek, below the Mine Site, contributes the vast majority of mercury to the downstream reaches of Marsh Creek;
The great majority of the Dunn Creek mercury load derives specifically from the tailings piles;
The sampling of Dunn Creek above the ponds indicated minimal sourcing of mercury; and The major mitigation focus should be directed toward source reduction from the tailings piles themselves, with subsequent containment of the remaining mercury fraction being a secondary consideration.
Mining Waste Characterization Rpt Final 6- 2- 10.doc 4 -13 The Source Group, Inc.

Characterization Report Mount Diablo Mercury Mine, Contra Costa County, California August 2, 2010
Table 2 -2 summarizes the data collected by Slotton in the Mine area. Table 4 -5 compares the Slotton mercury data with the SGI collected mercury data at the six contemporaneous sampling locations outlined in Section 4.5.1. The comparison between the two datasets show reasonable agreement in mercury concentrations by location. Though source water chemistry comparisons are not possible, the very reasonable agreement between SGI mercury data and that of Slotton adds support to his conclusions.
Mining Waste Characterization Rpt Final 8- 2- 10.doc 4 -14 The Source Group, Inc.
Characterization Report Mount Diablo Mercury Mine, Contra Costa County, California August 2, 2010
5.0 INVESTIGATION SUMMARY AND CONCLUSIONS
The exhaustive review of historical data (including scientific studies, corporate records and regulatory reports), the georeferencing of historical features with the current physical disposition of the Mine Site, the physical mapping of site features such as tailings piles and surface water drainage, and the collection of surface water samples, including the comparison to historical data set, combine to paint a detailed physical picture of current Mine Site conditions. With the exception of some specific data requirements, the collection of which is outlined in the following Section 6.0, all the necessary information needed to formulate a presumptive remedial design and for the preparation of a Remedial Action Plan for the Mine Site is available.
Both historical documentation and surface water analytical data collected in 2010 support the conclusion that the majority (93% based on Slotton, 1995 Calculations) of the mercury mass loading from the Mine Tailings into the Marsh Creek Watershed originates via runoff over and through Bradley Mining Company operation derived waste rock and tailings piles that flows into the Lower Pond and then into Dunn Creek. The primary path from the mining waste is through overland flow into nearby creeks which subsequently leads into the greater Marsh Creek Watershed. The works of Slotton (Slotton, 1995) and of SGI's surface water sampling in 2010 have quantified the concentrations of mercury and other chemical constituents emanating from the various Mine Site features via overland water flow. The water from My Creek, along with the Dunn Creek water above the retention ponds, have no detectable mercury concentrations and have a chemical signature distinct from the water that had come in contact with the Bradley tailings piles. My Creek collects drainage water from the Northern Waste Dump, an area where potentially some of waste rock from Cordero operations has been deposited. The lack of detectable mercury concentrations in My Creek supports the assertion that Cordero operations in that area did not produce waste rock with significant quantities of mercury ore.
Mining Waste Characterization Rpt Final 8- 2- 10.doc 5 -1 The Source Group, Inc.

Characterization Report Mount Diablo Mercury Mine, Contra Costa County, California August 2, 2010
6.0 DATA GAPS AND FUTURE WORK
Information collected over the last fifty years at and around the Mine allow for development of a presumptive remedy. Based on the investigation work conducted to date, the following data gaps are indicated that should be filled prior to development of a RAWP and Preliminary Design:
A topographic survey of the Site that represents the current land configuration; The character of water believed to be discharging from the Adit prior to encountering waste rock, tailings or atmosphere;
The character and potential flow pathway of water present in the DMEA/Cordero workings; and
Confirmation surface water sampling is needed for some sampling points that, due to variable rainfall and runoff conditions, have only been sampled once in the past.
Collection of data and information to fill these data gaps will allow for development of a RAWP and Preliminary Design for the Mine. The following sections detail the work proposed to address these data gaps.
6.1 Additional Characterization
Additional characterization planned by Sunoco includes the following additional work elements that will fill the data gaps' identified above allowing development of a RAWP and Preliminary Design Document. These include:
A detailed topographic survey of the Mine Site;
Sampling of mine waters present in the Adit prior to mixing with the atmosphere or mine waste via installation of a monitoring well;
Sampling of mine waters present in the former Cordero tunnels via installation of a monitoring well;
Measuring and evaluation of gradients between Cordero mine tunnels and the Adit water via transducer monitoring of installed monitoring wells; and
Confirmation surface water sampling when conditions allow.
The following sections provide detailed descriptions of these scope items to be conducted by Sunoco.
6.1.1 Topographic Survey
A topographic map of the Mine Site with a two -foot contour resolution will be prepared by an aerial mapping service. Significant features such as buildings, mine workings, and other property features will also be surveyed. This map will be used to aid in determining surface slope angles
Mining Waste Characterization Rpt Final 8- 2- 10.doc 6 -1 The Source Group, Inc.

Characterization Report Mount Diablo Mercury Mine, Contra Costa County, California August 2, 2010
and volumes of the existing tailings piles. Additionally, the topographic map will be used to confirm the georeferenced historical site features with their current locations, which will be used in the placement of two groundwater wells, and should optimize the chances for intercepting mine features at depth.
6.1.2 Confirmation Surface Water Sampling
Two confirmation surface water sampling events will be conducted between now and the first winter rains of 2010. Initial sample collection activities will be limited to the ponds and the flowing springs and creeks as practical. Additional surface water sampling events will occur during the winter of 2010 -2011 following the first significant rainfall event, and will include sampling from all sixteen sampling locations as is practical based on field conditions. These sampling events will be used to confirm the data collected in April and May of 2010, and to quantify surface water runoff from the Mine Site during different times of the year, including the end of the dry season and first runoff at the beginning of the winter rainy season. The surface water samples will be collected and analyzed in an identical fashion to the samples collected in April and May of 2010 as described in Section 3.0 of this report.
6.1.3 Monitoring Wells
6.1.3.1 Adit Sampling
The Adit Spring has been so named as it has been postulated that the source of the water is from the Bradley Mining Company underground mine workings 165 -foot Adit that extends more than 300 -feet from the main underground complex to its outlet on the hill slope above the Lower Pond. This Adit opening has long been covered by mine tailings, but still serves as a conduit for water in the Mine to surface and then free flow into the Lower Pond.
It is proposed to install a well that will intersect the buried Adit at depth in order to obtain a representative water sample of Adit water prior to its interaction with mine waste and the atmosphere. Additionally, the well will be used to install a pressure transducer to monitor water levels /flow through the Adit. Ideally, this well will extend through to the floor of the Adit and into a sump which would allow for the collection of water samples via a small submersible pump. The exact placement of the well will be aided by the topographic survey data described in Section 6.1.1.
6.1.3.2 DMEA/Cordero Tunnel Sampling
Cordero only operated at the 360 Level of the underground mine workings, which are currently presumed to be flooded. Collecting a water sample from the 360 -foot workings could help identify the quality of the water that is sourced from this level of the Mine. This data could then be compared to the data collected from the 165 -foot Adit to determine the relative contribution of
Mining Waste Characterization Rpt Final 8- 2- 10.doc 6 -2 The Source Group, Inc.

Characterization Report Mount Diablo Mercury Mine, Contra Costa County, California August 2, 2010
mercury loading from the 360 Level, if any, emanating from the Adit Spring (it is presumed that the Cordero workings at the 360 Level are connected to the Bradley underground workings via a sloped tunnel called the `Main Winze'). The well would be placed near the original DMEA Shaft (the entrance to the 360 -foot underground workings level) to maximize the opportunity to intersect one of the former 360 Level tunnels. Once the well is complete, it will be equipped with a pressure transducer to monitor water levels and a submersible pump for the collection of groundwater samples. The exact placement of the well will be aided by the topographic survey data described in Section 6.1.1.
6.2 Development of Remedial Action Work Plan and Preliminary Remedial Design
Based on the results presented in this report, combined with data collected as outlined in Section 6.1 above, Sunoco will develop a Remedial Action Workplan and Preliminary Design Document compliant with the conditions in CRWQCB Order R5- 2009 -0869. This document will be of sufficient depth and detail to allow competent development of remedial action costs, and allow eventual preparation of detailed implementation plans for the parties eventually conducting the work.
Scope elements to be included are as follows:
Capping Plan for Waste Rock and Tailings;
Drainage and Capping Plan for Ponds;
Storm and Spring Water Drainage Design Plan;
Adit Water Discharge Capture and Re- routing Plan; and
Conceptual Adit Water Discharge Treatment Preliminary Design.
Mining Waste Characterization Rpt Final 8- 2- 10.doc 6 -3 The Source Group, Inc.
Characterization Report Mount Diablo Mercury Mine, Contra Costa County, California August 2, 2010
7.0 REFERENCES
Blomberg, Vic, 1955, Letter to Joseph S. Gorlinski, Central Valley Water Pollution Control Board, August 10, 1954.
Blomberg, Vic, 1955, Letter to Joseph S. Gorlinski, Central Valley Water Pollution Control Board, April 4, 1955.
California Division of Mines, 1958, California Journal of Mines and Geology, Mercury in Contra Costa County, Vol. 54, No. 4, October 1958, pp.530 -535.
California Regional Water Quality Control Board (CRWQCB). 2008a. Screening for Environmental Concerns at Sites with Contaminated Soil and Groundwater. Interim Final. May.
CRWQCB. 2008b. Central Valley Regional Water Quality Control Board, A Compilation of Water Quality Goals. July.
CRWQCB. 2009. Revised Order to Sunoco Inc. To Submit Investigative Reports Pursuant to Water Code Section 13267, Mount Diablo Mine, Contra Costa County. December 30.
Cordero Mining Company. 1954. Lease Document with Mt. Diablo Quicksilver Company. Executed November 1.
lovenitti, J.L., Weiss Associates, and Wessman, J. 1989. Mount Diablo Mine Surface Impoundment Technical Report. June 30.
Knox, Newton Booth, May, 1938, University of California Thesis, The Geology of the Mt. Diablo Mine.
Pampeyan, E. H. and Sheahan B. H. 1957. Final Report DMEA- 2448, Idm -E544 (Mercury), Mt. Diablo Quicksilver Mine, Contra Costa County, California.
Pampeyan, E. H. 1963. Geology and Mineral Deposits of Mount Diablo, Contra Costa County, California, Unites States Geological Survey, Special Report 80, California Division of Mines and Geology.
Schuette, C. N. 1954. Letter to DMEA dated March 5, 1954.
Sheahan, B. H. 1956. Interim Report DMEA -2448 (Mercury), Mt. Diablo Quicksilver Mine, Contra Costa County, California. March 6.
Slotton, Darell G., Ayers, Shaun M., and Reuter, John E. 1996. Marsh Creek Watershed 1995 Mercury Assessment Project, Final Report, 66 pgs. March
Slotton, Darell G., Ayers, Shaun M., and Reuter, John E. 1997. Marsh Creek Watershed Mercury Assessment Project - Second Year (1996) Baseline Data Report, 31 pgs. July.
Mining Waste Characterization Rpt Final 8- 2- 10.doc 7 -1 The Source Group, Inc.

Characterization Report Mount Diablo Mercury Mine, Contra Costa County, California August 2, 2010
Slotton, Darell G., Ayers, Shaun M., and Reuter, John E. 1998. Marsh Creek Watershed Mercury Assessment Project - Third Year (1997) Baseline Data Report with 3 -Year Review of Selected Data, 62 pgs. June.
Smith, Ronnie B., 1951, Letter to Arthur J. Inerfield, Assistant Executive Officer, Central Valley Water Pollution Control Board, December 8, 1951.
The Source Group, Inc. (SGI). 2009. Final Summary Report For Removal Action to Stabilize The Impoundment Berm. January 28.
Ross C. P. 1940. Quicksilver Deposits of the Mount Diablo District, Contra Costa County, California .U.S. Geo. Survey Bull. 922 -B.
U.S. Environmental Protection Agency (USEPA). 2009a. National Recommended Water Quality Criteria. Office of Water. Office of Science and Technology.
USEPA. 2009b. ProUCL Version 4.00.04 [Software, accompanied by "ProUCL User's Guide. "]. Draft. Prepared for USEPA by Lockheed Martin Environmental Services. February.
Water Pollution Control Board (WPCB). 1954. Activity Report - Mt. Diablo Mine, Arthur J. Inerfield (A.J.I.). November 3.
WPCB. 1954. Activity Report - Mt. Diablo Mine, Arthur J. Inerfield (A.J.I.). March 12.
Inerfield (A.J.I.). May 25.
WPCB. 1955. Activity Report - Mt. Diablo Mine, Arthur J. Inerfield (A.J.I.) and W.D.B. April 8.
WPCB. 1955. Activity Report - Mt. Diablo Mine, CTC. July 18.
Mining Waste Characterization Rpt Final 8- 2- 10.doc 7 -2 The Source Group, Inc.

FIGURES

FIGURES

SGI environmental
THE
SOURCE GROUP, INC. 3451 C VINCENT ROAD PLEASANT HILL, CA 94523
MAP SOURCE: U. S. G. S.
SCALE:
0 MILES 0.5 SITE LOCATION MAP
SITE: SUNOCO
MT. DIABLO MERCURY MINE
DATE:
12/05/08 LocaroN:2430
MORGAN TERRITORY ROAD CLAYTON, CALIFORNIA
FIGURE:
1 -1

a ,
. . Y
-F
..i
} iy
: .y
, k
.`S
.,
1 .
y ty
,..
° A
1`
*
~S
V
>(
' '
h S
'
^Me
.t4
Y ic
.; ñ
.7
' ~
I
1 }
.1I
i/ '.
1 . j
M
i f 1
,
7 ;
( .;'
, / '
4,
' r,
.S
,
'1y"
p
5.a!
..
Yt
¡ Iÿ
,
f r{
e`
`:
'.,r
: 1,
4. 4..
yi
i .K``
J4';`
µ
r r'
r
`T1
7K.,
3 yt
.r
1 !
* ,
{,'.
.
L..
tiPi
l'r.N
,l , 1
.',14
.,,
.. k
1 4.
' ''
'kV
t
t ;
I -
',r 1
-
VyY
l
Yd
g r
,,Jj
. ..
a yr
y
h
' -
J a
y{-
. i
,, 1,
,1
1 -,
1n
,\ M
,4y]
!
, ,
. .y
; +
, ta
T
;'
/ R '
\ R
.. I ,
, ,
;: t
s. r
4,
A
, !"
j1
{ IS
Y
h
- f
y }
, 1
O
OId
.S{A
k `.
d
. +
ÿ r
Á`t
-
i. ,
i. ,
I j
w
r
1.'
r F
ound
atio
n O
ME
A S
h ny
y9
i ic
+
tiN
j ( '
,t.,-
'4.
¡
f1
1i
,,'
;4
F .y
ty
w
', JF
tiy
f `
+
!
i r,}
``
la
` ",
`f
Syi
i, ~
ti ^
. `
; "
ti'
°
/ Y
4 '
, ..
.
.! ''
Ne
rJt
.4
p ,T
/.-'1
-
:7
1,
tl ' ;K
' 't
.
,
R
`E
fáci
`r
`{
, .
O'
, ,t
4%`+
i I
'á
;4
r Ç
, _ w
. ,,
. ¡¡
r5
}
T
{{ .
ú-i1
. .:
'' ..
, ,'F
UR
NA
CE
..4
' t,L
1L
,' 'i
.w
\ixÿ
..
r'wY
d'
. S
{}
tL
_
¡-C
Y
!
. -,
. ..
,
' .
..
' P
LAN
M
'
-"A
ll'
yy{
t
N..?
' y
rY'
. O
. .-
_ ÿ"
tM
Upp
er P
ond
:,,
{
, +
`.'.
a,'Y
^
Ar
*:
. .e
.
r -
' a
y*
..,
-
í c
a »
x
, ^.
i A
.,..4
`,
N
Y
lt..:
" ,;
101°
11.*
L ',
y v.
\
I. r4
7
.
r
r
.14'
A
y :5
:`F
kZ5
'
^a3'
i. .'M
\'l
F
:. f
; ri
.'...f
it p}
4-.¡
p -
- M
1
il.
. 1
'
V
j ,
ÿ. ¿
m
-y
.5
' -
'1-^
- '.
.
. ,
yh.i"
,1
»
as
` rt
M
i
. 1.
`
! s'
- ',
4
\; ,r
.y
i u
y ?
.
, E
! `
,ta.
' p
m
` ra
+
4i
;
î .?
./
' .-
:
' ,:`
M
1WR
I°P°
,!q
,A X
I á5
"' '
. ,
d k
á y,
..4
if
{ ¡
y ;.1
, '
`,
,
I .
, y.
,.l
.
.n¡A
!y '
.
ry
y V
^ 1,
. y
i 1,
.
t '
...y:
' t. 1'
4 4V
.5
.
44,
k4...
..'
ÿ¡t
.y
y.
"' yy
) i
.>a+
F
Z 6
Y
r.+
A
t 'Í
.
! ,.R
' ^l
fl .t
j.W
.. fy
l . _L
y S
.
. i
J'
,.e};
i
.f,
'
><
a,
, ..+
'Z,
.1,
V1
h,
1
W'._
C
+'
`-
(R+
,}°
. "
.. . y
. ,h
t V
P rK
. .:
+,q
p i
' '
' '
:...,;
,141
M
y 1
1} Ä
pyr ..?
.5
lkié
lí ÌP
.s
. ,
,'t
It ti
. .
J1C
+5
. +
orrr
M
..
^^1I
1 la
y r¡
y
A
r ni
i t
, i
/~i
., w
. na
il ,
..,,
ÿ í,.
yq,P
t. y
Tit`
Y
i44 ¡ .Nt
, i
, ...
i :'
': .
y'
:'.p
eAdn
, t
' hrL
,Y
9~
Lá4$
l;.y.
`ï
` 5
r 5
9 y
ç ,
.J ...
' 1
a+r
' ,.
wG
,
:. -:
+jR
, j'R
` i
tfJY
J 1
w''
) ¡
1
Min
e '
, 1
.'.
4s 3
(.f
fryy
\ `
(1
Y.
,
F
- 1
° i
,',.i5
'.
_ Lo
wer
Pon
d a.
á [
l. ur
¡
k 1y
an
mye
+
4 í
,y,
ry a
f
ot
ÿ i
`ti
'
r e
n b
°g
.i' i
f 1
. A
n 4
Zti1
, i
4 .
a
1 e
.. ,1
.}.M
'
'. +
r'v
i "i
1 C
{
y +
+ry
.
'
. J
na
* r'L
. !f
Y
r4
,. ..
}
At.
+
r,"
,y
,..li
., .4
._.h
.
,i;5s
"
,.y
'
'I J
{áÀ
..
( 7
4.
>á4y
1
(
,y44
rra
y`!R
* 1
Y...
4iF
44rk
.., Ip
t..t
T'
A:
^ tp
!}i1
5r
.y
, {
, ',t
`*
.S
R
! J
.t -I
Y
P_'.,
Íq
'S
.. 1.
'
A
j`.S
r:
*.r1
t4 ti
v
1 w
-
` .
,.h.
: `a
w
'4;
r 1
.. 1
,' w
k.
51
: +
+ S
' '+
R
.
d
4+r v
r ,
a
i g`
_I `
{h
*^yr
(s
g,,
- 7
1 -
-i 17
I{
``
,
1 ,
,',
M,
' .. v
''' L
'
'a
` 1
',.''
`, I
4 R
5.
`
/ Y
5 '
4 ^ Ii
r ,
P A
T
p y
úCy'
,y
tf C
J.
'
i S
$,', 'Sr
.! }y
. I
'
'
ij {
" \ .
Y
Y
r
,. F
M
ra
5,
.n T
.
'
y;
.
;' w
iy,
1t
jd
F?r
'..:1
,
J R
j 1
, ,1
hL.
` i;l
+
-
1
1 ,ìy
V
y
H
.,
<
+%
}
.
' f
1 ^y
M
'
r
;i ^
` '`j
5
.r 1r
V p'
,+ß.
Y
} }:
'P
IA.
- :1
''t
q . .i . ,,1
a A
.rJH
r
.. [
t11,
Y a
( t
Y/jY
r .
r,
y.. :
+
7 ' r
{1
Y
4'
1 i
. 1
T`
py
y .
/ 1
1 {
Y
! c
' t,_
._-y
7_
u c
/.,y,
ç , ,1
4,
; .:Í
h1
s >
1r.D
: .s4t
' 11
0..
Ñ V
.e
ri ia
ti,
,r; ]
R ~
.!'. ,:
1
. ,'I
:iy
. Ik
ñ»
., l
:
F:+
J..e
.» y4
p
..,
Y
,!S1J
v,.t
., ,:
. I
«-'
v .
r.
.., `
,44.
,.M.
_
,..
V
Ka
1
...
e
x . r:s
.
A
1
' ,q
'
..
,' ..
l9'
, `°
..
..
' ...
LEG
EN
D M
ine
Str
uctu
re
(195
3)
Spr
ing
Pon
d (2
004
Out
line)
ix[
SO
UR
CE
G
RO
UP
, IN
C.
3451
C
VIN
CE
NT
R
OA
D
PLE
AS
AN
T
HIL
L,
CA
94
523
SC
ALE
O
150
300
MT
. D
IAB
LO
ME
RC
UR
Y
MIN
E
CO
NT
RA
C
OS
TA
C
OU
NT
Y,
CA
LIF
OR
NIA
(200
4 A
ER
IAL)
2004
AE
RIA
L P
HO
TO
OF
M
T D
IAB
LO M
INE
SIT
E
SGI
envi
ronm
enta
l SC
AL
E
IN
FE
ET
FIL
E
NA
ME
Min
e F
eatu
res
Map
.dw
g
DA
TE
D
R.
BY
A
PP
. B
Y
5/4/
09
JP
PH
P
RO
JEC
T N
O.
FIG
UR
E
NO
r
01-S
UN
-050
7_
1

LEG
EN
D Min
e S
truc
ture
(1
953)
1 .
1F-
. e
40
Und
ergr
ound
W
orki
ngs
Adi
t Le
vel
80 -f
t Le
vel
165 -f
t Le
vel
- 27
0 -f
t Le
vel
360 -f
t Le
vel
(Cor
daro
)
50.f1
WE
ST
OF
D
ME
A $
HA
I I
CO
RD
ER
O W
AT
ER
D
ISP
OS
AL
VIC
INIT
Y
_3 i
C4.
.-
.~
PR
OJE
CT
NO
01- S
UN
-050
o
DA
TE
: D
RA
WN
BY
07/1
7/09
300
AP
P.
BY
:
600
HO
RIZ
ON
TA
L S
CA
LE IN
FE
ET
PH
2004
AE
RIA
L P
HO
TO
SH
OW
ING
FE
AT
UR
ES
LE
AS
E B
OU
ND
AR
IES
SG' T
HE
nviro
nmen
G
SO
UR
CE
GR
OU
P,
INC
. 34
51 -C
VIN
CE
NT
RO
AD
P
LEA
SA
NT
HIL
L, C
A 9
4523
FI
GU
RE
:
2 -2

TH
. R
ES
OU
RC
ES
A
GE
NC
Y
OE
PA
VM
EN
T O
F
CO
NS
ER
VA
TIO
N
e. te
goe.
... o
ne l
ode
I ite
til.a
01
..
HIG
HLY
PO
RO
US
C
ALC
-SIL
ICA
TE
RO
CK
(TS
C)
Ives
, au
ot.
1C01
.....
10
1011
.....
.1t
LJ
Olo
cay
.... tr
:v41
:161
r al
...
...
0.
.0
tool
. Wes
,. t0
00hl
b
Re.
4,
O0
C ..
.... g
The
ona
000.
101w
11
0. n
a flo
g 1,
10
0001
01 P
.101
010
000
th.n
ly In
a 00
1. g
rog.
..m.1
oz..
oegg
.....
......
. on
e
At.
......
. on
er t
nttl
.....
......
Ha.
W
I. W
oes
eitl1
1.0
Sho
ot lo
.
WO
O
AA
A,
Vow
.. lo
wl1
4 ,
\ \ ..,
..,""
'-" 1
Ns
\ 1
LEG
EN
D
OLI
. M
ine
Str
uctu
re
(195
3)
fise
pgi3
n ro
/rye
arso
ff R
ock
rDcg
a/C
oocr
iCle
ro)
sod
si
moo
'
09
Goa
do.
90
en.
V ...
.. 10
0.01
1011
100
1001
01.1
1,
7 A
Und
ergr
ound
W
orki
ngs
Adi
t Le
vel
80-f
t Le
vel
165-
ft Le
vel
270-
ft Le
vel
360-
ft Le
vel
(Cor
dero
)
SGI
envi
ronm
enta
l
TM
E
SO
UR
CE
GR
OU
P,
INC
. 34
51C
V
INC
EN
T
RO
AD
P
LEA
SA
NT
H
ILL,
C
A
9452
3
SC
ALE
o 20
0 40
0
SC
ALE
IN
F
EE
T
MT
. D
IAB
LO
ME
RC
UR
Y
MIN
E
CO
NT
RA
CO
ST
A
CO
UN
TY
, C
ALI
FO
RN
IA
(200
4 A
ER
IAL)
DM
EA
MA
P S
HO
WIN
G P
RE
- A
ND
PO
ST
- D
ME
A/C
OR
DE
RO
M
INE
FE
AT
UR
ES
FIL
E
NA
ME
Min
e F
eatu
res
Map
.dw
g D
AT
E
4/14
/09
DR
. B
Y
JP
AP
P.
BY
PH
PR
OJE
CT
N
O.
01-S
UN
-050
E
XH
IBIT
2-3

UN%t ED STATES DEPARTMEN, THE INTERIOR GEOLOGICAL SURVEY
450C N
Mock swops* round lQ'Ng/IYn
I round 6 Hp/ta Block, nord, apoll/ed,eg9Y. F 3 4/ton pnd red and hlle e -c
o o
VIOLA 2446 'MEnCUaYI
o. E-544
LOCATION OF DMEA SHAFT
Most,' 14,1:4,t0
Wafer and pos lare :ems ?I encoutered here
Sibs/f4/3 serosMìfe
Woks ..-4,1? wr tourist
eC sC
Slbede ¡Vote/camel?)
Stacco wale same sorc0SRe
oM .,Teloclnp*o
Wolle caee sr
-s-e
r r rro ç á`r' !"
EXPIANATiON
Sondflone
Shale
Solos. carbonate rOCk
MelaUnnabar, clnnObor
- s<
Ereccb of bdrd St Iropinetds
1e r s^' 4- ` i ''
Md/count
\ \
Con MCI tdCed .obre aIWOtrneole located) -
;owl, shoring 010 Meshed her 000r04,4'OlelT Located)
5 hew/ tone
Sterc o
St Sv-te cod drJ 0. beds
or nne0 Yutkmpe
Eigele 3 GEOLOGIC AN OF CONTRA
Sneered as ono sn
Cmrwbos,
Svenite s c
o o W
G rittal
l
éÒ and - preen meut
x
w
60 Feel
Given, by M W Cot, Demote/ 1955 .115 00411100* by E. I PomOeYon, U SGSOrcemarr'9%
360 LEVEL, MT 0 A?.-0 CUICKSlLVER MINE COSTA COGrvTY. CAL FORN:A
SGI environmental
THE
SOURCE GROUP, INC. 3451 -C VINCENT ROAD PLEASANT HILL, CA 94523
PROJECT NO DATE
07/16/09
DR.BY
JP
APP. BY
PH
o 60 120
HORIZONTAL SCALE IN FEET
PLAN VIEW OF CORDERO TUNNEL SYSTEM FIGURE:
2-4

MA
IN W
INZ
E
OC
AT
ION
OF
DM
EA
SH
AF
T
CO
RD
ER
O T
UN
NE
LS
'JVL
, 'r
]
,/ »
./ /f
Ati,
F.g
u=^
mM
po,r
F
y^,
o,
,.0
~o^
".,m
*/
,.^vm
MIN
E
'ov'
o^
CO
ST
A.,
Cav
x,.
w.°
n"n.
^
LEG
EN
D /Cor
dero
Wor
king
s
PR
OJE
CT
NO
. D
AT
E
DR
AW
N B
Y:
AP
P.
BY
:
07/1
6/09
JP
P
H
60
`20
HO
RIZ
ON
TA
L S
CA
LE IN
FE
ET
PLA
N V
IEW
OF
CO
RD
ER
O T
UN
NE
L S
YS
TE
M
WIT
H P
RE
-CO
RD
ER
O T
UN
NE
LS
SGI
envI
ronm
enla
l
TH
E
SO
UR
CE
GR
OU
P,
INC
. 34
51-C
VIN
CE
NT
RO
AD
P
LEA
SA
NT
HIL
L, C
A 9
4523
FI
GU
RE
:

-
/' i
°
i
I
r i,,
-
- I
í Y
.. .-
al
`.
e
\\ .YI O
W
- ...
..A\ ; \á\
bl "
:SS
4iw
, A
st..
<..y
.
-^
.._ Ì
tis
I
Sy
rop
y``v
.`.ti
- =
l e.
.
ITC
\ L
1 e
; \
, "\
\`
\ \\\
\\\
- \
\I S
f lr al
",.44
:-
i .
_.
..
O.
.\ &
\
\\\
, ,
\ \\
\ i.
\ -.
'\ .
.
'\ \
\a
; 9 .
\\ r
e F
_i
. _.
--
\ ,C
`
` y
"e
, r.
._r
1rL
-{
raw
.h%
...
/ \t
, rh
\ /
/ /g``
/X` ,
I \
I .
N..
e>..
..'...
T.
.
.
I
F^
d.
A
r,.á
to ./
CO
RD
ER
O W
OR
KIN
GS
B
RA
D[ E
M
IN/N
G
CO
MPA
NY
M
T 0
/AB
L O
/N
W E
C
n/ro
CO
SIe
C un
lT
Co/
/arn
ro
P.M
/LC
/WIN
Ol /
R/N
(I)A
L
N.R
LrN
r O
NV
LL
T/C
Rt
/LA
NE
.iT
RC
X/N
C
NC
E^N
lneu
.ry
I)1E
C
MC
/in
A
f/./.:
/'.1
G
°°"°
°°°
/'"
BE
LOW
TH
IS L
EV
EL
n i
....
a
PR
OJE
CT
NO
. D
AT
E:
DR
AW
N B
Y:
APP
. B
Y:
CR
OS
S S
EC
TIO
N O
F P
RE
-CO
RD
ER
O T
UN
NE
L S
YS
TE
M
01-S
UN
-050
07
/27/
09
JP
PH
NA
N
A
NA
C
OI
SGI1
TH
E
l/1
envi
ronm
enta
l S
OU
RC
E G
RO
UP
, IN
C.
HO
RIZ
ON
TA
L S
CA
LE IN
FE
ET
34
51-C
VIN
CE
NT
RO
AD
P
LEA
SA
NT
HIL
L, C
A 9
4523
F
IGU
RE
: 2-
6

,
¡.-.
i<
4h
a8
1..
Lr`
j: ,;.
'l.
,
4 l.
.4
{ L
^
°1 J
, .
' .'
L
e
G,g
} t`
lv
}T
4 .,`
_ ..q
,1
' .+d1
.f
,
F`
Y
4 ^°
}I
l S
,T.{
(
1 ,
, {
x w
, «k
, rt
i+ '.
,
+ y:
ç ih
e fi
a 's
;'
7 +
i+
atb
j,}
t; t
_,;
ar S
;k
« i
'I ,,.
. _
i y
" r
.!.S
f IS
Y
Tj,y
.R
ë'
.,..
}1: '
r .L
`t
,1
1¡
- ,,
'
4 .1
.,
Y r.
W IR
M.
.irli
!7
' ^í
`t+
+
1',
b 1
1.
'I,
.(.
r..1
,a
y,
.. ~
'
..
. ..
" 1.
y
Ï .
..,
k ..;
'.,
..,
. ..
,R_
, E
+
fiß
` l
/
,.; .
°'.§
i "t
y ,C
t.. i.l
!h
tt
tks ;
'
..}~
il ,'.
Li.:
...
, i'
old .0
A,
{ !!'
' .Y
,_
yj
0
.. ;
, Fo
unde
llo
E
Shan
kYyí
l +-
qY
ïi`
`!
- 3y
'i R
A
, +
.,
}ÿ
,kt
. .
DM
EA
. .
1 {S
i
f
' .
.R
P6 i ,
: ..
.
r,
R
l a
.y
1^\
7
J
P
('
?,
y ty
r
gZ, y
9 :'?
!: ,
': 1a
,,.
A
l y,
//r
' ..}
. .3
S
í'X
. .
J ..
..y
' r
. .
. ,
y 1
p if
Y
.¡
.7-,
V
. .,
, ,
. .r
.,,
. 4'
. .,.
P'ew
St
ar}
.(4'
t
, ;
'T,
f iI
^ Y
, "Y
X
V
L!
,
°+
rtt,
xaf:
i«
.
. tir
.;+
..
y1sa
P
. ..'
FU
gNA
CE
.
{' ,h
k
4i
' ' A
. .
! 1
6 `
fl ¡
. b
.,'.P
LAN
T.
3.
[ r
,7'`f
T
..
+
AS
r
fi a^
raliq
, 'j
. "
q '
`.._
,. ,«
-
},
.
.^1'
.
X
H
j} «4
h r
4
,
' f
aw'-
,l ,
6W'
v" uï
. ti0
1 '
A
4
4
.. L-
; ;
¡ M
4'
' a
'` m
k =
'.#,
,; 5
2 }i
Y
: ,..
. .
'' .
y '
_ -
'K,y
G
a
F;W
4 í
'.}
,. a
, ...
.-. ,
, ..i
ï.
,
+'{
" '},
._
1
Ay
C
.,.
4 {I
a,
* '',
t N
r
.
i:;.
_
` 1
, (
\. ar
',.Y
s
T,.
/l k
5'
` 7
` ' c ,54R .' '
. L
L4'
''t
t',
LL,,
. r-
7
» ,
'
ti
, rt.,
a f4
.y
. f
.5L`
. ..n
14
a..
y.
.i "'
'1rv
P
f .0
.a
rC.
l ib
a J
.. ^
J^,
1 .,
1 .`
t A
`
' l
r Z.
>
tx +
i c , a,
'
:4
i 4`
,a
., t
.. ' A
l
i #t
ie#.
, L,
I.
a r1
1
~
.' i
+'y
el
r
i w
+
4'
r1r
1 .
1
.rt
a M
,.a.w
...
3, . w
r '
' g`
í1t,r
., ' ,
a ,+
¡,Y
.
}pp.
{ _
,a
k 76
S s
.'ft
i , qT
e!1
1 ' }
P4R
,ÿ
,4kL
K
1,n2
",
Leve
l A
N
ti t
""
` .
....
>,
t :..
..
,f'
./ 4
'n¡,
Y,
.
. j
sp
. ,
z Y
LL
'.i
.,
f y
ks T
1
.4'ti
,Ya
f i
w
4t
ta%
` * tiF
. ...
sw*.
. -
' $p
as.
t(' +
Nb
r '
; +
n
e1r . jA
R
xK -,
-;
f, i',
ra -M
.°'I
, Y
+
n ,w
,i7
" r
,
TM
3 ¿
. -
,.. .
. 4R
A
('R _`y A
`
, ,
r.. .I
^ti
Y'
; ,i
b °
r``I
.+O
` t
1 A
ha
s*dt
1
r f;,
. <
.t',
yr
tk
':1
1 c
. ..t
; ^
..,
...
OS
.- $
.410
.
I -{
á 5
l .
.
., .
4 ,
`
, 4.
..-f
J
á ^.
7// '
S. ,..
, . . 4 y j ; v h . Y
- :1 ,
> ' . ,ç
. , l
s v t bM
,1' .f-
l ,
. , .o .` , `
a 1 R
y`.,y
$
. .
'1'1
6
i'e :
.
.: .
t ; ,e
r
+
fi
* rt
Y
'
1 F
{ 1
. Y
°t
gs "
1 }
d
a.fr
'
:`te
K
1 '
K
` '
h. -
f 1
re 4: 4
: ..
r ¡
r l `
x }
.h
i, y.
`A',
i. 4,
^ a
., )(
f 1
^ f4
ip
rF
..
..
y i,,
` l y`
` r `'
. a*
p.
n r
4.
t M
1 s
e 4
r N
7`
A
; , :
. 1 .
A :s
t1.
It-
2YM
_/*
A
é..
_
I ,
, ^
x..
..:.
,k'
. .,
e ..
d
' '
o
1 .
~
` t '
A1
!l i
.y
,..
' .c
. .`
,. ,
1 _
a..
r.
s...
.. y)
x
.r
y 7.F
9
. , "
,,-
LEG
EN
D
C:',
1 M
ine
Str
uctu
re
(195
3)
Spr
ing
Pon
d (2
004
Out
line)
(
)
orde
ro
Was
te
Roc
k
/ Main
W
inze
, S
ub-V
ertic
al
Con
nect
or
n1E
SO
UR
CE
GR
OU
P,
INC
. R
N4
3451C VINCENT ROAD
PLE
AS
AN
T
HIL
L,
CA
94
523
SC
ALE
os0
300 . MT.
DIA
BLO
M
ER
CU
RY
M
INE
C
ON
TR
A
CO
ST
A
CO
UN
TY
, C
ALI
FO
RN
IA
(200
4 A
ER
IAL)
i
2004
AE
RIA
L P
HO
TO
WIT
H
PR
E-
AN
D P
OS
T-
DM
EA
/CO
RD
ER
O
MIN
E F
EA
TU
RE
S
eew
,onr
nen'
--
- S
CA
Lf :
FEE
T
FIL
E
NA
ME
Min
e F
eatu
res
Map
.dw
g
DA
TE
D
R.
BY
A
PP
. B
Y
5/4/
09
JP
PH
P
RO
JEC
T
NO
FI
GU
RE
N
O. r
01 -
SU
N-0
50
L-/
7

/0,.
OS
ED
DM
EA
/ T
LOC
AT
IGN
NM
I *A
7(
4-
1
/94,
4/
,
/e;',
.1
\ "-
\, 1
4211
454
-4/
0 C
O N
.150
0 N
- )?/
\'k'
/ G
adro
t or
rit ...
......
. or
dr
Po.
.....
rid
erttr
. dr
r.11
rr
riorr
...
..
LEG
EN
D
PR
OJE
CT
NO
. D
AT
E:
DR
AW
N B
Y:
AP
P.
BY
.
Min
e S
truc
ture
U
nder
grou
nd W
orki
ngs
(Pre
C
orde
ro)
01-S
UN
-050
07
/16/
09
JP
PH
A
dit
Leve
l
Pre
-Cor
dero
T
ailin
gs
80-f
t Le
vel
and
Was
te
Roc
k 16
5-ft
Leve
l
270-
ft Le
vel
250
500
HO
RIZ
ON
TA
L S
CA
LE I
N F
EE
T
US
GS
DM
EA
MA
P S
HO
WIN
G P
RO
PO
SE
D D
ME
A
SH
AF
T L
OC
AT
ION
SGI
envi
ronm
enta
l
TH
E
SO
UR
CE
GR
OU
P,
INC
. 34
51-C
VIN
CE
NT
RO
AD
P
LEA
SA
NT
HIL
L, C
A 9
4523
F
IGU
RE
: 2-
8

Pre
-DM
EA
Sha
ft
Gho
st o
utlin
e of
D
ME
A w
aste
pile
ta
ken
from
fin
al
map
adj
acen
t
Pos
t -D
ME
A S
haft
,,, r'
20
Was
te p
ile m
appe
d af
ter
Cor
dero
O
pera
tions
A
IL s
' i
DM
A
5ho
f f
M ~
New
sta
ck
AC
1(
Qi
- f
SGI
envi
ronm
enta
l
TH
E
SO
UR
CE
GR
OU
P,
INC
. 34
51C
VIN
CE
NT
R
OA
D
PLE
AS
AN
T
HIL
L,
CA
94
523
SC
ALE
o 50
10
0
SC
ALE
IN
F
EE
T
MT
. D
IAB
LO
ME
RC
UR
Y
MIN
E
CO
NT
RA
C
OS
TA
C
OU
NT
Y,
CA
LIF
OR
NIA
D
ME
A W
AS
TE
PIL
E C
OM
PA
RIS
ON
C
LOS
E U
P V
IEW
FIL
E
NA
ME
Min
e F
eatu
res
Map
.dw
g
DA
TE
5/4/
09
DR
. B
Y
JP
AP
P.
BY
PH
R
OJE
CT
N
O.
01 -
SUN
-050
E
XH
IBIT
2_9

11' p
.
_...'
w .
L'
LEG
EN
D
Min
e S
truc
ture
Pre
-Cor
dero
T
ailin
gs
and
Was
te
Roc
k
Und
ergr
ound
W
orki
ngs
(Pre
C
orde
ro)
Adi
t Le
vel
80 -f
t Le
vel
165 -f
t Le
vel
Y®
27
0 -f
t Le
vel
PR
OJE
CT
NO
. D
AT
E:
DR
AW
N B
V:
AP
P. B
Y:
01- S
UN
-050
07
/16/
09
JP
PH
o 25
0 50
0
HO
RIZ
ON
TA
L S
CA
LE I
N F
EE
T
PR
E -C
OR
DE
RO
CO
ND
ITIO
N
1952
AE
RIA
L P
HO
TO
GR
AP
H
SGI
envi
ronm
enta
l
TH
E
SOU
RC
E G
RO
UP,
IN
C.
3451
-C
VIN
CE
NT
RO
AD
P
LEA
SA
NT
HIL
L, C
A 9
4523
FI
GU
RE
:
2 -1
0

LEG
EN
D
C:1
M
ine
Str
uctu
re
(195
3)
gilia
s W
f F
re
Lo
rdea
srs)
e R
ock
S
e oc
k (D
MA
/Cor
dero
)
. ,
,,.,
Und
ergr
ound
W
orki
ngs
Adi
f Le
vel
80 -f
t Le
vel
165 -f
t Le
vel
. -
270 -f
t Le
vel
360 -f
t Le
vel
(Cor
dero
)
7-
T
- .'
`.xy
ï 41
1_
PR
OJE
CT
NO
.
01- S
UN
-050
07
/16/
09
JP
PH
PO
ST
CO
RD
ER
O C
ON
DIT
ION
19
57 A
ER
IAL
PH
OT
OG
RA
PH
250
500
HO
RIZ
ON
TA
L S
CA
LE IN
FE
ET
SGI
envi
ronm
enta
l
TH
E
SOU
RC
E G
RO
UP,
IN
C.
3451
-C
VIN
CE
NT
RO
AD
P
LEA
SA
NT
HIL
L, C
A 9
4523
F
IGU
RE
: 2
-11