a hybrid expert decision support system based on
TRANSCRIPT

HAL Id: hal-01629563https://hal.inria.fr/hal-01629563
Submitted on 6 Nov 2017
HAL is a multi-disciplinary open accessarchive for the deposit and dissemination of sci-entific research documents, whether they are pub-lished or not. The documents may come fromteaching and research institutions in France orabroad, or from public or private research centers.
L’archive ouverte pluridisciplinaire HAL, estdestinée au dépôt et à la diffusion de documentsscientifiques de niveau recherche, publiés ou non,émanant des établissements d’enseignement et derecherche français ou étrangers, des laboratoirespublics ou privés.
Distributed under a Creative Commons Attribution| 4.0 International License
A Hybrid Expert Decision Support System Based onArtificial Neural Networks in Process Control of Plaster
Production – An Industry 4.0 PerspectiveJavaneh Ramezani, Javad Jassbi
To cite this version:Javaneh Ramezani, Javad Jassbi. A Hybrid Expert Decision Support System Based on ArtificialNeural Networks in Process Control of Plaster Production – An Industry 4.0 Perspective. 8th DoctoralConference on Computing, Electrical and Industrial Systems (DoCEIS), May 2017, Costa de Caparica,Portugal. pp.55-71, �10.1007/978-3-319-56077-9_5�. �hal-01629563�

A Hybrid Expert Decision Support System Based on
Artificial Neural Networks in Process Control of Plaster
Production – An Industry 4.0 Perspective
Javaneh Ramezani1, Javad Jassbi2
1 Faculty of Sciences and Technology, NOVA University of Lisbon, Campus da Caparica,
2829-516 Monte Caparica, Portugal, [email protected] 2UNINOVA-CTS, FCT-UNL, Caparica, Portugal
Abstract. Emerging technologies could affect future of factories and smartness
is the main trend to receive that points. Quality was important and will be
crucial in future but the question is how to build Smart Systems to guaranty
quality in workshop level. This is an important challenge in Industry 4.0
paradigm. In this paper the main objective is to present practical solution under
the light of Industry 4.0. The aim of this study is to presents propose a Hybrid
Expert Decision Support System (EDSS) model, which integrates Neural
Network (NN) and Expert System (ES) to detect unnatural CCPs and to
estimate the corresponding parameters and starting point of the detected CCP.
For this purpose, Learning Vector Quantization (LVQ) and Multi-Layer
Perceptron (MLP) networks architecture have been designed to identify
unnatural CCPs. Moreover, a rule based ES has been developed for diagnosing
causes of process variations and subsequently recommending corrective action.
The proposed model was successfully implemented in Construction Plaster
producing company to demonstrate the capabilities and applicability of the
model.
Keywords: Expert Decision Support System Neural Network Statistical
Process Control FMEA Control Chart Pattern
1 Introduction
Minute variations or/and differences always exist in any production process,
regardless of the quality of design and maintenance. SPC is a powerful and capable
set of solving problem tools, which is very useful in stabilizing the process and
improving its efficiency by reducing variability [1]. One of the main objectives of
SPC is quickly realizing the existence of assignable causes and any change in the
process to investigate the reason of the diversions and applying corrective actions to
avoid more defective products in lines. The most essential process of implementing
SPC is control charting. Control charts are useful in determining the process

56 J. Ramezani and J.Jassbi
behaviour [2]. Usually existence of the non-randomness trend in the control chart has
significant impact on process performance. In the meantime, control chart patterns
such as Cycle, Trend, Shift, and Systematic as the basic patterns, have the process
roots and usually appear in the most control charts of qualitative characteristics. As
control charts consider only the current sample data, are not capable of presenting any
pattern-related information. On the other hand, applying the accessible run rules can
lead to increase false alarms [1]. Since the analysis of control charts is difficult,
because it requires statistical knowledge and also experience of process, the main
motivation of this study is to deal with the challenge of developing intelligent system
which could identify defects, detect resources of deviations and recommend
corrective actions automatically. Our investigation shows there is no existing model
capable of handling mentioned challenge. To address this specific challenge, the
main research question would be:
What would be a suitable intelligent methodology to describe and analyze control
charts for the fault diagnosis of the process in order to advise decision makers?
Considering the fact that neural networks are well used alternatives for pattern
recognition, and expert systems are effective in identifying causes of deviations and
also recommending corrective action, we will try to answer the research question
merging mentioned models using current successful experiences in both areas. The
rest of paper is organized as follows: section 2 is devoted to the literature review.
Research methodology is discussed in section 3. In section 4 EDSS model is
presented and in section 5 conclusions are provided.
2 Contribution to Smart Systems
Smartness is the heart of Industry 4.0. Smart systems refer to diverse range of
technological systems that can perform autonomously or in collaboration with other
systems. These systems are capable to combine functionalities including sensing and
controlling a particular situation in order to describe and analyze it. Smart systems
have the ability to predict, decide and communicate with the user through a user
interfaces. Smart systems have been also used in different areas, such as energy,
transportation, security, ICT, industrial manufacturing, control, etc. [3]. The
intelligence of smart systems is associated whit autonomous operation based on
adaptability and learn-ability. This idea carries a sense of evolution and refers to
process of modification and improvement over time. Neural networks with the ability
of learning and expert systems with the command and rule-based features are perfect
examples of smart systems [4]. In control process area, the main purpose of utilizing
smart systems is to develop an intelligent system for real time control and monitoring
the process. This work intends to contribute with the issues related to supervisory
aspects of smart systems, considering the data acquisition, information transmitting,
command-and-control and cognitive features of NNs and ESs. The main objective is
to provide a model to support more intelligent and adaptive monitoring of smart
system.

A Hybrid Expert Decision Support System 57
3 State of the Art
In this section related works that have used ESs and NNs to interpret SPC charts,
were reviewed.
3.1 Application of ESs in SPC
In order to be competitive in the global market, more attention should be paid to
extracting quality engineering knowledge in a systematic manner. Availability,
consistency, extensibility and testability are the major advantages of ESs for SPC
users [5]. In the following application of ES in SPC shall be briefly described. Evans
[6] designed an ES for interpretation of x-bar and R charts using three sets of rules.
[7] proposed a knowledge-based SPC system based on general knowledge of the
process, which is capable of monitoring variations in a process. In another study [8]
they proposed a hybrid system for SPC implementation. This system used ANN
models to analyze control charts and an ES to diagnose the plausible causes. Their
system can only recognize patterns that have full features. Reference [9] developed a
knowledge based assistance for monitoring the process. Walter [10] integrated a
model of decision support system (DSS), ANN, SPC and ICT to facilitate making
decisions in production line. Reference [11] employed image processing and
multivariate SPC to develop a visual detection ES. [12] has focused on ES and SPC,
for selecting collaborative commerce system. And [13] developed an ES, based on
multivariate control charts, to fault detection in induction motors.
3.2 Application of ANNs in SPC
The principle reason for applying NNs in SPC is to automate SPC chart interpretation
[14]. This author has divided the literature of this area into structural change
identification (changes in the average or variance of process) and pattern recognition.
Most of the early research focused on detecting mean and variance shifts using similar
approaches to [15] including [16, 17 and 18]. Cheng [18, 19] designed multi-layer
networks to simulate variance change. [24] presents a NN-based approach for
detecting bivariate process variance shifts. NNs in the issues of pattern recognition are
used to determinate random and non-random patterns. For example, [20] used LVQ to
detect normal patterns, trends, sudden shifts and cycles. [21] proposed a hybrid-
learning model using back propagation networks (BPN) and decision trees. [22]
proposed a selective NN ensemble approach for CCP identifications. [23] proposed a
NN to address the problem of monitoring a multivariate–multistage process. [24]
using the method of Fourier descriptors and NNs identifies the CCPs. In the [25] the
hybrid model of Recurrent Neural Network (RNN) and regression were utilized to
recognize the CCPs. [26] developed a NN classifier for CCPs by Generalized
Autoregressive Conditional Heteroskedasticity (GARH) Model. [27] Applies
multivariate exponentially weighted moving average (MEWMA) and NNs for
identifying the start point of the variations. [28] presents combination of intelligent
model of ANN and support vector machine (SVM) learning methods for CCP

58 J. Ramezani and J.Jassbi
recognition. [29] is an attempt to separate basic and mixture CCPs using NN and
Independent Component Analysis (ICA). [30] is an example of using Paraconsistent
ANN (PANnet) and SPC in electrical power System.
4 Research Methodology
As the conceptual model is observed in the Fig.1, in this study the structure of EDSS
model based on ANNs has been presented to control the plaster manufacturing
process. In order to describe the implementation steps of the model and validate it, the
case study has been done in Semnan Noor plaster factory, which is producer of
construction plaster and micronized plaster, according to Iran National Standard No.
1-12015 in the field of construction plaster production. The investigated product in
this study is POP (Plaster of Paris) or construction plaster that is produced through
calcinations process at the temperature of 150℃ in a closed reactor system called
baking kiln while gypsum loses 1.5 mole of molecule water and converts to the
construction plaster. In this study, order to improve the quality of the process, after
identifying all parameters of each control station in the plaster production process, the
interview was done with the experts focusing on the importance of each variable in
the process. Then, according to the existing records, the causes of defect occurrence
in the construction plaster production that were associated with quality features of the
plaster were examined. Finally, initial setting time of the plaster was diagnosed as the
critical parameter of the process that should take at least 7 minutes and at most 15
minutes. This parameter is dependent on the plaster’s crystal of water after baking
while the acceptance range in the investigated factory is between LSL = 5.0 to USL =
5.08 weight percentage and the process works under control with the basic limits of
about LCL=5.26 to UCL=5.56. This parameter as a CW index has been analyzed by
“Failure Modes and Effects Analysis” (FMEA) and “SPC” methodologies. The
statistical population of this study included baked plaster of Low Burn kiln in the
plaster production process that has been produced in a specified time period by
stratified random sampling method from the baking tail silo, at random times,
different shifts and operators. According to previous research on quality control
issues, 25 subgroups of 5 samples (n =125) were found suitable. Due to the nature of
plaster production process, 8 times per shift and each time, five 25 grams’ sample
from a random point of the silo was taken to measure.

A Hybrid Expert Decision Support System 59
Fig. 1. Conceptual Model
5 Model Design Construction
EDSS is composed of 3 subsystems. The first subsystem using statistical formulas,
determines control chart limits for sampled data (weight percentage of CW),
calculates process capability (Cpk) and gives warning if any of the points is out of
control limits. The second subsystem is responsible for identifying unnatural patterns
and the purpose of third subsystem is interpreting the causes of deviations and
recommending preventative or corrective action.
5.1 Developing an ANN
In this section first the procedure of pattern simulation and then the development steps
of NN will be explained.
Simulating Different Patterns of the Process Control Charts. In statistical
issues any natural deviations could be determined according to probability
distribution function of the corresponding random variable. This is the base of natural
behaviors simulation in different charts of process control [31]. In this study, due to
lack of large volume of data for unnatural patterns, it is tried to simulate the data,
according to the original data of process.
Input: Weight percentage of CW parameter in Sampled
of POP
),...XX,Min(X-),...XX,Max(X=X :chartRFor
5
),...XX,(XX:chartXbarFor
521521i
2521
i
2521IX,...,X,XX
Expert Decision Support System (EDSS)
Output:
1 CpK IF capable) is (Process 1
1CpK IF )inacapable is (Process 01
Y
3CL 3-CL IF control)under is (Process 1
3σCLXOR3σCLX IF control) ofout is (Process 0
XY
2
,...00010000, 00100000, 01000000, 10000000
,...SystematicCycle,Trend,Shift,Natural,Patterns:
3Y
...0.1σ~0.3σ 0.3σ~0.1σs, 1σ~3σ 3σ~1σb
Tremd,...Shift,Parameters:4Y
Otherwise 12X0
Natural isPattern IF 0PointStarting:
5Y
Y6: Causes of deviation’s Table
Y7: Corrective or preventative action’s Table
60 J. Ramezani and J.Jassbi
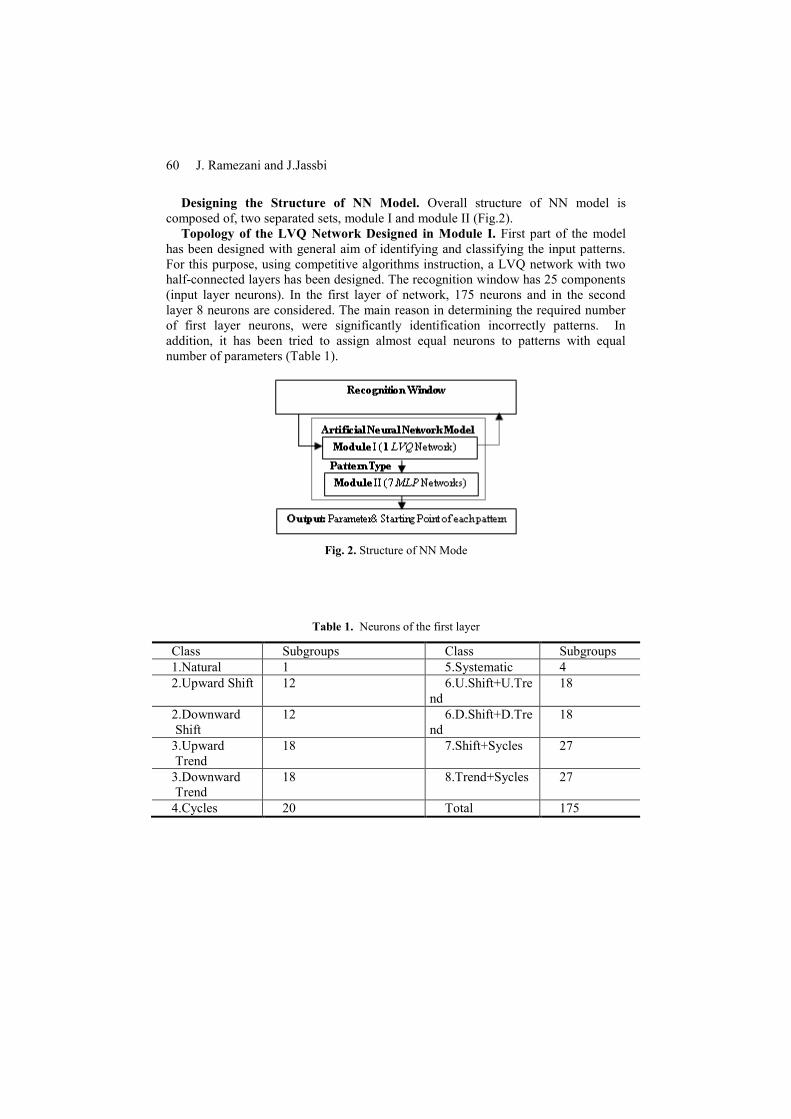
Designing the Structure of NN Model. Overall structure of NN model is
composed of, two separated sets, module I and module II (Fig.2).
Topology of the LVQ Network Designed in Module I. First part of the model
has been designed with general aim of identifying and classifying the input patterns.
For this purpose, using competitive algorithms instruction, a LVQ network with two
half-connected layers has been designed. The recognition window has 25 components
(input layer neurons). In the first layer of network, 175 neurons and in the second
layer 8 neurons are considered. The main reason in determining the required number
of first layer neurons, were significantly identification incorrectly patterns. In
addition, it has been tried to assign almost equal neurons to patterns with equal
number of parameters (Table 1).
Fig. 2. Structure of NN Mode
Table 1. Neurons of the first layer
Class Subgroups Class Subgroups
1.Natural 1 5.Systematic 4
2.Upward Shift 12 6.U.Shift+U.Tre
nd
18
2.Downward
Shift
12 6.D.Shift+D.Tre
nd
18
3.Upward
Trend
18 7.Shift+Sycles 27
3.Downward
Trend
18 8.Trend+Sycles 27
4.Cycles 20 Total 175

A Hybrid Expert Decision Support System 61
Table 2. Range of changes in unnatural patterns parameters
Pattern type X(t) Range of parameters
changes
Descriptions
Shift(Sh.) x(t) = n(t)+u.b b =[ [0.1,0.3]
b =[ [-0.3,-0.1]
parameter of
Sh.(Ascending)
parameter of Sh.
(Descending)
Trend(Tr.) x(t) = n(t)+ s.t s =[ [0.01, 0.03]
s =[ [-0.03,-
0.01]
parameter of Tr.
(Ascending)
parameter of Tr.
(Descending)
Cycles (Cyc.) x(t) = n(t)+ l
*sin(
l =[ [0.1,0.3]
T =8,12, …
T is considered
variable
Systematic
(Sys.)
x(t)= n(t)+ g
*cos( g =[ [0.1,0.3]
Concurrent
combination
Sh. (Ascending)
and Tr. (Ascending)
Shift+Trend
(Sh. + Tr.)
x(t) = n(t) )+u. b+s.t b =[ [0.1,0.3]
s =[ [0.01, 0.03]
b =[ [-0.3,-0.1]
s=[ [-0.03,-
0.01]
Concurrent
combination
Sh.(Descending)
and
Tr.(Descending)
Shift+Cycle
(Sh. +Cyc.)
x(t)=n(t)+u.b+l*sin(
b =[ [0.1,0.3]
l =[ [0.1,0.3]
T=8,12,…
Concurrent
combination
Sh. and Cyc
Ascending
Trend+Cycle
(Tr. + Cyc.)
x(t)=n(t)+s.t+l*sin(
s =[ [0.01, 0.03]
l =[ [0.1,0.3]
=8,12,…
Concurrent
combination
Tr. And
Cyc.Ascending
Topology of MLP Networks Designed in Module II: The second part of the
model has been developed with the aim of estimating the parameters of each
unnatural CCP, based on determined definitions (Table 2), and also estimating the
starting point of the unnatural patterns. For this purpose, 7 two-layer perceptron
networks, analyze the basis and simultaneous patterns. Because different directions of
changes in process (upward or downward pattern) should be well recognized, so due
to considering the output values in the range [-1, 1] the activation function has been
considered bipolar sigmoid with a constant A = 0.1. Total input of all MLP networks
in module II is 26 that one of them is for bias and is considered equivalent to one. In
all MLP networks for a special error value of the network, the number of required
iterations to reach the desired error is calculated and the lowest repeated number until
reaching to the considered error, is selected as the number of hidden layer neurons
(Table 3). In output layer of each MLP, the number of neuron is selected according to
the number of corresponding parameters of each pattern.
62 J. Ramezani and J.Jassbi
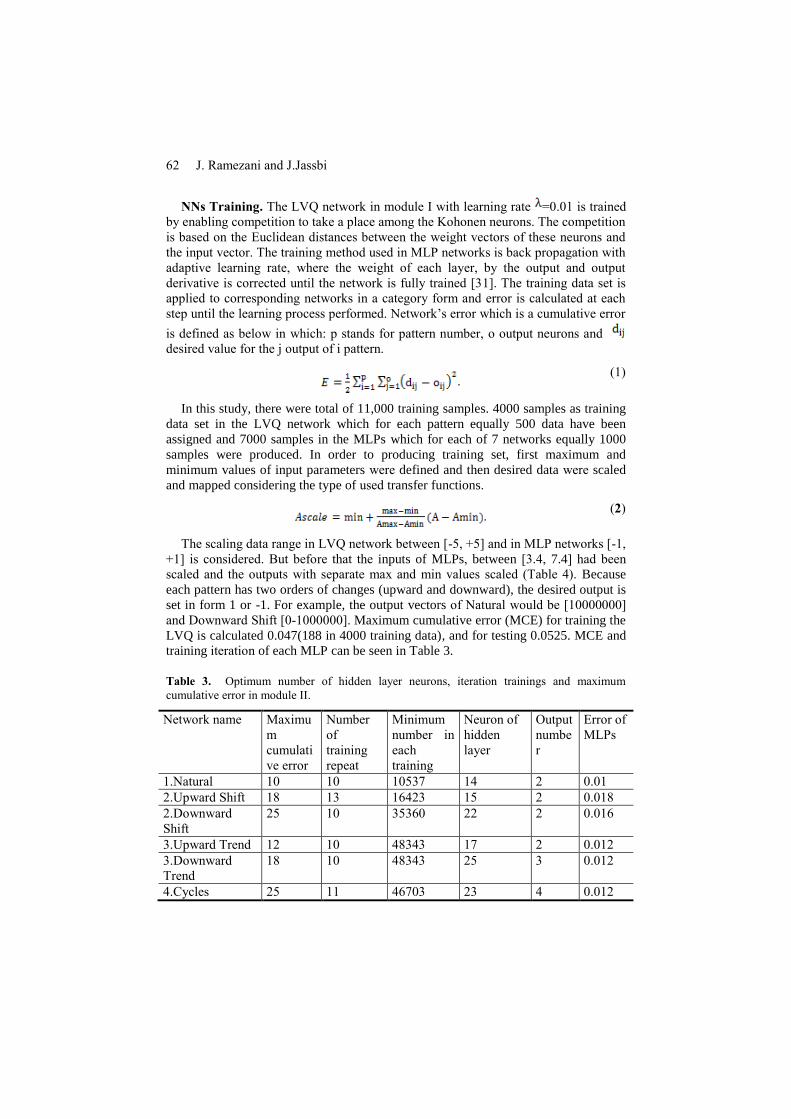
NNs Training. The LVQ network in module I with learning rate =0.01 is trained
by enabling competition to take a place among the Kohonen neurons. The competition
is based on the Euclidean distances between the weight vectors of these neurons and
the input vector. The training method used in MLP networks is back propagation with
adaptive learning rate, where the weight of each layer, by the output and output
derivative is corrected until the network is fully trained [31]. The training data set is
applied to corresponding networks in a category form and error is calculated at each
step until the learning process performed. Network’s error which is a cumulative error
is defined as below in which: p stands for pattern number, o output neurons and
desired value for the j output of i pattern.
. (1)
In this study, there were total of 11,000 training samples. 4000 samples as training
data set in the LVQ network which for each pattern equally 500 data have been
assigned and 7000 samples in the MLPs which for each of 7 networks equally 1000
samples were produced. In order to producing training set, first maximum and
minimum values of input parameters were defined and then desired data were scaled
and mapped considering the type of used transfer functions.
. (2)
The scaling data range in LVQ network between [-5, +5] and in MLP networks [-1,
+1] is considered. But before that the inputs of MLPs, between [3.4, 7.4] had been
scaled and the outputs with separate max and min values scaled (Table 4). Because
each pattern has two orders of changes (upward and downward), the desired output is
set in form 1 or -1. For example, the output vectors of Natural would be [10000000]
and Downward Shift [0-1000000]. Maximum cumulative error (MCE) for training the
LVQ is calculated 0.047(188 in 4000 training data), and for testing 0.0525. MCE and
training iteration of each MLP can be seen in Table 3.
Table 3. Optimum number of hidden layer neurons, iteration trainings and maximum
cumulative error in module II.
Network name Maximu
m
cumulati
ve error
Number
of
training
repeat
Minimum
number in
each
training
Neuron of
hidden
layer
Output
numbe
r
Error of
MLPs
1.Natural 10 10 10537 14 2 0.01
2.Upward Shift 18 13 16423 15 2 0.018
2.Downward
Shift
25 10 35360 22 2 0.016
3.Upward Trend 12 10 48343 17 2 0.012
3.Downward
Trend
18 10 48343 25 3 0.012
4.Cycles 25 11 46703 23 4 0.012

A Hybrid Expert Decision Support System 63
Test the NN Model. In the training stage, the network’s efficiency increases by
minimizing the error between real outputs and in the testing step only the input data
are given to the network, which are validated through the response prediction,
between input and output variables.
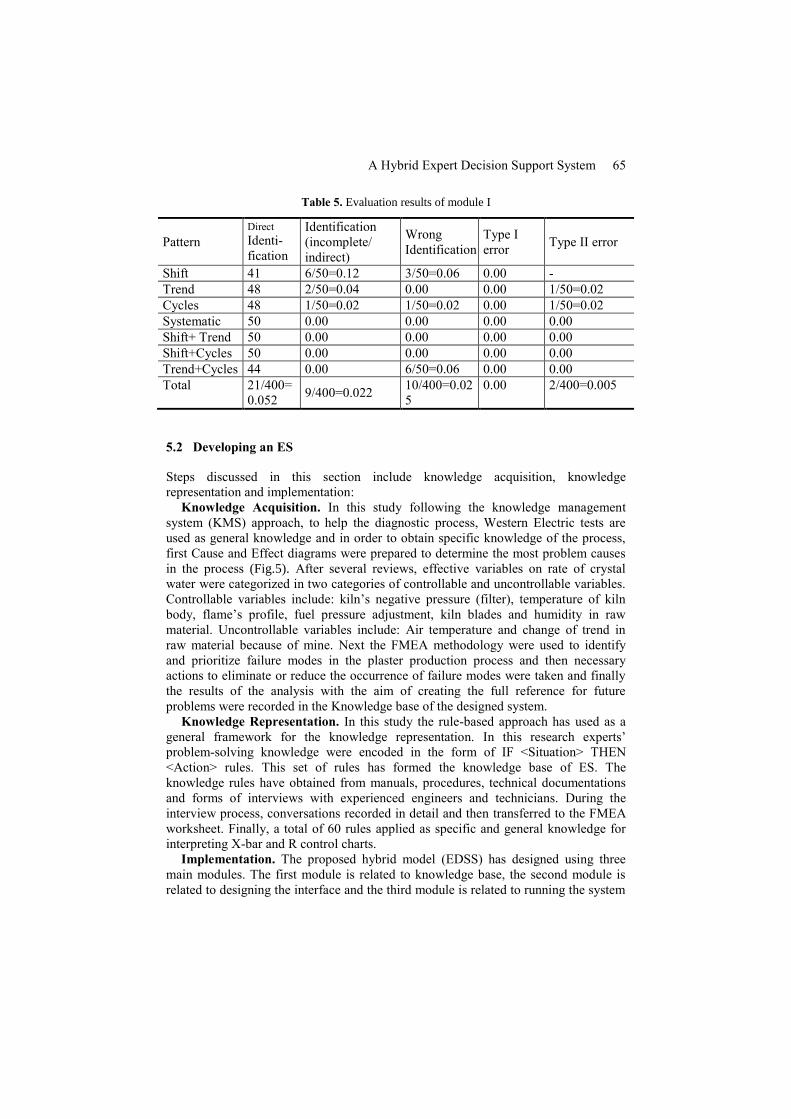
Evaluation of LVQ Network in Module I. One of the major criteria in the
development of LVQ network in purposed model has been the reduction of possibility
of incorrect identification. Considering the diversity of trained patterns, the model
shows a good response in this problem and also in indirect detection of individual
patterns and incomplete diagnosis of mixed behaviors (Table 5). Moreover, for each
identification window (input vector) network makes a decision on the process status.
Hence the occurrence possibility of errors related to the decision making topics will
be discussed. If the network detects by mistake the behavior of the under control
process as unnatural, type I error and if the unnatural pattern in the process could not
be detect, type II error has taken placed. Performance of module I and LVQ network
by 400 test vectors were measured. Each of 400 test vectors is a sample of 25 Pieces
that represents one of the 8 identified patterns. Amount of LVQ error is calculated
0.052 and the results of 400 experimental vectors is integrated in Table 5.
Test and Evaluation the MLP Networks in Module II. One of the critical
problems in NNs training is the over- adaption problem of training data. Topics
"generalization" and "training" in NNs have the same significance [32]. For solving
this problem, part of the training vectors is considered as validation data. In this way
training data follow the flow of parameters modification and validity data will follow
error during the learning process. The validity data set error such as training data set
error naturally decreases but as soon as there is over learning in the network, despite
fixing or decreasing error of validity data set, the amount of training data error will
increase. In this time the training process stops and the parameters according to the
minimum errors of validity data, will be considered as an algorithm ultimate answer.
After the training process, performance of the network was tested by several
examples. Results show, module II in identification and analysis of defined
parameters, acts successfully and efficiently (Table 3).
Verification of the NN Model. After evaluating the NN model by the test data set,
in order to determine the accuracy, repeatability and the amount of results stability in
the test repetition, the verification of the model by comparing the amount of NN error
and discriminant analysis (DA) error has been done. It should be noted that DA is a
similar statistical method in classification and in this study the statistical software
SAS was used for this purpose. Fig.3 shows related errors to any classes in the Rate
row, and in the Priors row the weight of each class is shown. 0.3325 represents the
total error in using DA for the test data set. As it is seen in Fig.4, neural networks
compared to DA method, has much better performance and precision.

64 J. Ramezani and J.Jassbi
Fig. 3. DA error in the test data set classification
Table 4. Scaled values range corresponding output of MLP networks
Output1 Output2 Output3 Output4
Pattern min max min max min max min max
Shift -0.4 0.4 0 12
Trend -0.04 0.04 0 12
Cycle 0.01 0.4 6 14 0 12
Systemati
c 0.01 0.4 0 12
ShiftTren
d -0.4 0.4 -0.04 0.04 0 12
ShiftCycl
e 0.01 0.4 0.01 0.4 6 14 0 0
TrendCyc
le 0.001 0.04 0.01 0.4 6 14 0 0
Fig. 4. Comparing the error of NN and DA for each pattern
A Hybrid Expert Decision Support System 65
Table 5. Evaluation results of module I
Pattern
Direct
Identi-
fication
Identification
(incomplete/
indirect)
Wrong
Identification
Type I
error Type II error
Shift 41 6/50=0.12 3/50=0.06 0.00 -
Trend 48 2/50=0.04 0.00 0.00 1/50=0.02
Cycles 48 1/50=0.02 1/50=0.02 0.00 1/50=0.02
Systematic 50 0.00 0.00 0.00 0.00
Shift+ Trend 50 0.00 0.00 0.00 0.00
Shift+Cycles 50 0.00 0.00 0.00 0.00
Trend+Cycles 44 0.00 6/50=0.06 0.00 0.00
Total 21/400=
0.052 9/400=0.022
10/400=0.02
5
0.00 2/400=0.005
5.2 Developing an ES
Steps discussed in this section include knowledge acquisition, knowledge
representation and implementation:
Knowledge Acquisition. In this study following the knowledge management
system (KMS) approach, to help the diagnostic process, Western Electric tests are
used as general knowledge and in order to obtain specific knowledge of the process,
first Cause and Effect diagrams were prepared to determine the most problem causes
in the process (Fig.5). After several reviews, effective variables on rate of crystal
water were categorized in two categories of controllable and uncontrollable variables.
Controllable variables include: kiln’s negative pressure (filter), temperature of kiln
body, flame’s profile, fuel pressure adjustment, kiln blades and humidity in raw
material. Uncontrollable variables include: Air temperature and change of trend in
raw material because of mine. Next the FMEA methodology were used to identify
and prioritize failure modes in the plaster production process and then necessary
actions to eliminate or reduce the occurrence of failure modes were taken and finally
the results of the analysis with the aim of creating the full reference for future
problems were recorded in the Knowledge base of the designed system.
Knowledge Representation. In this study the rule-based approach has used as a
general framework for the knowledge representation. In this research experts’
problem-solving knowledge were encoded in the form of IF <Situation> THEN
<Action> rules. This set of rules has formed the knowledge base of ES. The
knowledge rules have obtained from manuals, procedures, technical documentations
and forms of interviews with experienced engineers and technicians. During the
interview process, conversations recorded in detail and then transferred to the FMEA
worksheet. Finally, a total of 60 rules applied as specific and general knowledge for
interpreting X-bar and R control charts.
Implementation. The proposed hybrid model (EDSS) has designed using three
main modules. The first module is related to knowledge base, the second module is
related to designing the interface and the third module is related to running the system

66 J. Ramezani and J.Jassbi
and dialogue to the user. EDSS which can be called intelligent statistical process
control (ISPC), its components are as follows:
(1) Knowledge base, which is composed of three main parts below:
(a) Events, which extracts from the records of ISO, preventive maintenance,
calibration, brainstorming sessions and FMEA forms.
(b) Procedures, which Includes technical instructions, plaster production standard,
ISPC manual and etc.
(c) Rules, which consists of 60 rules extracting from experts and documents such as
Western Electric tests, statistical formulas and NN’s analysis, has presented in
the form of IF-THEN statement.
Western Electric tests which are using general knowledge of process to control
charts interpretation is including: points out of control limits (1 point more than +3σ
or -3σ), gradual changes in levels (9 points larger or smaller than CL), trends (6 points
in a row steadily increasing or decreasing), Systematic variations (14 points in a row
alternating up and down), cycles (4 of 5 points more than +2σ or -2σ), and mixtures (8
points in a row more than +1σ or -1σ).
Increase of crystal water
Change of trend
in raw material
Cool shock
because of climate change
Human failure
in data collection
Uncalibrated thermometer
for the hot air kiln
Erosion of kiln blades
Rise of humidity in
raw material
Uncalibrated scale
Fuel nozzel chocking
Fuel pressure falling
Fig. 5. Cause and effect diagram for increasing of Crystal Water

A Hybrid Expert Decision Support System 67
Table 6. FMEA form for the critical parameter (Crystal Water)
Example. The Following example represents a kind of typical rule, based on
specific knowledge of process:
IF interpretation is “Upward Trend”
AND Failure Mode is “Increase of Crystal Water”
AND Process Index is “Decrease of kiln’s temperature”
THEN Special Cause can be “Fuel nozzle Chocking”
AND Corrective Actions can be either “Cleaning the fuel nozzle, establishment of
PM for the burner or installing fuel filter”.
(2) Inference Engine, which backward-chain inference engine has used in this
study in order to troubleshooting. This means, the written program has performed
with two sets of rules. The first group define goals for the properties and if it is unable
to determine the value of the properties with the existing rules, the user is asked to
identify them. The second group updates actions like modifying the rules and
transmitting the satisfied goals.

68 J. Ramezani and J.Jassbi
(3) Working Memory, which Consists of events and facts to be applied by the
rules. This memory is used to store temporary data that is provided during problem-
solving process. This data includes the user’s answers to the system’s questions and
also deriving facts from reasoning process like unnatural patterns, the starting point
and corresponding parameters of patterns that are identified by the NN.
(4) User Interface, which works with the inference engine and the knowledge base
in order to two-way communication between user and the EDSS. Users can answer a
question by selecting Yes or No or select one item from a menu on the screen.
5.3 Integration of NN and ES
To develop ISPC, capabilities of NNs and ES are used in automatic interpretation of
control charts. The purposed system is able to do most of traditional SPC operations
including calculation of control limits (LCL, CL and UCL), calculation of Cpk, data
normalization test and checking for X-bar and R charts being under control. In SPC
first the based charts must be prepared. For this purpose, after initial sampling, control
limits and Cpk must be calculated in control mode. In this study according to the
plaster factory experts’ opinion if “Cpk >1” the chart is accepted as the basis (Fig.6).
Experimental Result of EDSS Model. Using real data from the current process of
plaster producing and interface software, a practical example is presented (Fig.7). As
shown in figure 6 although there is no any out of control mode in the R-chart but the
process is not capable of meeting specifications because the “Cpk <1” and equal to
0.81. On the other hand, by selecting x-bar chart, the user has faced with the message
of “X-bar chart is out of control”. Then, the ES using Western Electric tests has
announced that points falling outside the control limits may be the result of:
carelessness in the measurement, machinery stop or off spec materials. Later, ES
suggests the user to check the unnatural patterns by NN. As you can see, the NN has
not only has identified downward shift pattern in X-bar chart but it has also estimated
the starting point of unnatural pattern (point 6) and the displacement parameter (-
0.161). After that, ES asks the user to explain the defect to find causes of potential
failure modes in the process. If the answer is not in the options, ES says: “refer to the
experts!”. In this example according to the appearance of downward shift pattern and
as the user observation was “kiln body scarlet”, the cause of defect has announced
“temperature exchange of kiln with environment due to the loss refractory and
thickness” and “establishment of maintenance and inspection of refractory” have
proposed as corrective or preventive actions. In this practical example, after doing
corrective action and re-sampling the process, the control charts did not show any out
of control mode and also process capability improved from Cpk=0.81 to Cpk=1.15.
Ultimately, the designed system examined by several examples and the results were
considered satisfactory. However, the system performance needs to be improved more
so it is important that the long-term use of the model be identified as part of the
objectives of the study because the model design is highly influenced by it.

A Hybrid Expert Decision Support System 69
Fig. 6. SPC operations
Fig. 7. Results of EDSS for a practical example

70 J. Ramezani and J.Jassbi
6 Conclusions
The main goal of this work was to present the capabilities of emerging technologies
and algorithms, dealing with quality issues in shop floor. In this work a hybrid EDSS
was designed to support the operators in troubleshooting of plaster production
process. For this purpose, ES and NN were integrated via designed interface software
for reasoning of deviation sources and recommending corrective actions. The ES tries
to determine the fault area as far as possible until the serviceman focuses on the point.
On the other hand, in the structure of current model, features of LVQ and MLP
networks are used in two modules. Therefore, the competitive power of LVQ network
in pattern classification and the interoperability of multi-layer perceptron networks for
parameter estimation of abnormal patterns in different process control chart were used
simultaneously. This integrated approach has provided an appropriate condition for
implementing desired thoughts. Considering the training of the network for
identifying basic and mixed significant behaviors, the numerical results in table 5
shows output of module I in diagnosis of behavioral patterns, which is acceptable.
The results also show that module II who is estimating the parameters of
corresponding patterns, is effective and reliable (Table 3). The work has many
contributions and was covering multi tasks including: production, delivery and
encryption of NN input, using a wide range of data in training the NNs, and doing
most of SPC required via integrated system such as drawing of basis chart, checking
X-bar and R charts for being under control and also calculating Cpk. Smartness is key
criteria in Industry 4.0 and the case study shows the capability of proposed model to
bring more intelligence to the production lines.
References
1. Western Electric Company: Statistical Quality Control Handbook. Western Electric
Company, New Jersey (1956)
2. Montgomery, D.C.: Introduction to Statistical Quality Control. Wiley, John & Sons, New
York (1996)
3. CORDIS Archive: European Commission: Smart components and smart systems integration.
EXTRACT FROM WORK PROGRAMME 2011. Available
from: http://cordis.europa.eu/fp7/ict/micro-nanosystems/calls_en.html
4. Moshnyaga, v.: Guidelines for developers of smart systems. In: 8th International Conference
on Intelligent Systems (IS), pp.455—460, IEEE (2016)
5. Feigenbaum, Edward A.: The rise of the expert company: How visionary companies are
using artificial intelligence to achieve higher productivity and profits. Macmillan, London,
(1983)
6. Evans, J.R., Lindsay, W.M.: A framework for expert system development in statistical
quality control. Computers & Industrial Engineering, 335--343 (1988)
7. Pham,D.T,. Oztemel. E.: control chart pattern recognition using multi-layer perceptrons and
learning vector quantization networks. J Systems Control Engineering, 207, 113--118 (1993)
8. Pham, D.T., Oztemel, E.: control chart pattern recognition using learning vector quantization
networks. International Journal of Production Research, 32, 721-729 (1994)
9. MASUD, A.S.M.: A Knowledge-based advisory system for statistical quality control.
International Journal of Production Research, 31, 1891--1900 (1993)
A Hybrid Expert Decision Support System 71
10. Chung, W.C., Wong, K.C.M.: An ANN-based DSS system for quality assurance in
production network. J Manufacturing Technology Management, 18, 836--857 (2007)
11. Lyu, J., Chen, M..: Automated visual inspection expert system for multivariate statistical
process control chart. Expert Systems with Applications, 36, 5113--5118, (2009)
12. Chang, D.S., Liao, C.C.: Expert system for multi-criteria decision
making to assess the collaboration commerce systems. In: The 2nd International Conference
on Next Generation Information Technology, pp.68--71, IEEE (2011)
13. Garcia-Escudero, L., Duque-Perez, O., Morinigo-Sotelo, D., Perez.Alonso,M.: Robust
multivariate control charts for early detection of broken rotor bars in an induction motors fed
by a voltage source inverte. In: International Conference on Power Engineering, Energy and
Electrical Drives, pp. 1--6, IEEE (2011)
14. Jacob, D.A.: Training Artificial Neural Networks for Statistical process control. In: The
10th Biennial Univ. Govern. Industry Microelecrtronics Symp., pp. 235 – 239, IEEE (1993)
15. Pugh,G.A.: Synthetic Neural Networks for Process Control. Computers and Industrial
Engineering, 17, 24--26 (1989)
16. Pugh,G.A,: A Comparison of Neural Networks to SPC Charts. Computers and Industrial
Engineering, 21, 253--255 (1991)
17. Guo, Y.: Identification of Change Structure in Statistical Process Control. Journal of
Production Research, 7, 1655--1669 (1992)
18.Cheng, C.S.: A Multi-Layer Network Model for Detecting Changes in The Process.
Computers & Industrial Engineering, 28, 51--61 (1995)
19. Cheng, C.S.: A Neural Network Model Approach for The Analysis of Control Chart
Patterns. International Journal of Production Research, 35, 667--697 (1997)
20. Cheng, CH.: Using neural networks to detect the bivariate process variance shifts pattern.
Computers & Industrial Engineering, 60, 269-278, (2011)
21. Guh, R.S., Hsieh, Y.: Neural network based model for abnormal pattern recognition of
control charts. Computers & Industrial Engineering, 36, 97--108, (1999)
22. Guh, R. S.: Optimizing feed forward neural networks for control chart pattern recognition
through genetic algorithms. International Journal of Pattern Recognition, 18, 75--99 (2005)
23. Jianbo Yu and Bin Wu, A Neural Network Ensemble Approach for Recognition of SPC
Patterns. In: 3rd Int. Conference on Natural Computation, 2, 575 --579, IEEE (2007)
24. Niaki, S., Designing a multivariate–multistage quality control system using artificial neural
networks. Journal of Production Research, 47, 251-271, (2009)
25. Phokharatkul,P., Phaiboon,S.: Control chart pattern classification using fourier descriptors
and neural networks. In: 2nd International Conference on Artificial Intelligence,
Management Science and Electronic Commerce (AIMSEC), pp. 4587--4590, IEEE (2011)
26. Behmanesh, R., RahimI, I.: Control chart forecasting: A hybrid model using recurrent
neural network, design of experiments and regression. In: IEEE Business, Engineering &
Industrial Applications Colloquium (BEIAC), pp.435 – 439, IEEE (2012)
27. Lavangnananda, K., SawasdimongkoL,P.: Neural network classifier of time series:
A case study of symbolic representation preprocessing for Control Chart Patterns. In: 8th
International Conference on Natural Computation, pp.344--349, IEEE (2012)
28. Ebrahimzadeh,A., Addeh, J., Ranaee,V.: Recognition of control chart patterns using
an intelligent technique. Applied Soft Computing, 13, 2970--2980 (2013)
29. Thaiupathump,T., Chompu-inwai,R.,: lmpact of kurtosis onperformance of mixture control
chart patterns recognition using independent component Analysis and neural networks. In:
4th Int. Conf. on Advanced Logistics and Transport (ICALT), pp.94--99, IEEE (2015)
30. Misseno da Cruz,C., Rocco,A., Conceição Mario,M., ; Vilanova Garcia,D., Lambert-
Torres,G., Minoro Abe.J., Rodrigo Torres,C.:
Application of Paraconsistent Artificial Neural Network in StatisticalProcess Control acting
on voltage level monitoring in Electrical Power System. In: 18th International Conference
on Intelligent System Application to Power Systems (ISAP), pp.1--6 IEEE (2015)

72 J. Ramezani and J.Jassbi
31. Fatemi Ghomi,M., lesani ,A.: Design a model based on Neural Networks to pattern
identification, Tehran university, Tehran (1385)
32. Menhaj,M.: Computatianal Intelligence. Amirkabir university, Tehran (1387).