a hybrid fuzzy ahp -dea approach for assessing university ... · a hybrid fuzzy ahp -dea approach...
TRANSCRIPT

A Hybrid Fuzzy AHP-DEA Approach for Assessing University Performance
QUANG HUNG DO1,2 JENG-FUNG CHEN1,*
1Department of Industrial Engineering and Systems Management, Feng Chia University, Taichung, Taiwan 2Department of Electrical and Electronic Engineering, University of Transport Technology, Hanoi, Vietnam
[email protected], *[email protected] Abstract: -In recent years, with the expansion of existing institutions as well as the establishment of new ones, higher education institutions have suffered the problem of declining available resources. Each university must assess the performance of its critical business units to measure effectiveness and efficiency. The purpose of this study is to assess university performance. In this study, we apply the fuzzy analytic hierarchy process (Fuzzy AHP) and the Data Envelopment Analysis (DEA) model with an assurance region (AR) for measuring the efficiency scores of universities. In the first phase, the fuzzy AHP is employed to get the weights of output indicators. The derived weight ranges are then used for the AR to allow weights varying within a region determined by lower bounds and upper bounds. In the second phase, the DEA with AR approach measures the performance of Vietnamese universities to illustrate the approach. The framework may be a useful tool by which institution managers may improve their performance levels and effectively allocate resources. Key Words: - Data envelopment analysis, Higher education, Fuzzy theory, Analytic hierarchy process, Higher education institutions, Performance assessment, Vietnamese institutions 1 Introduction In the past ten years, new universities have been founded and existing universities have expanded. As a result, higher education has become more and more competitive. To operate universities with a high degree of efficiency, the institution managers continue to pursue all the opportunities and resources available to enhance competitiveness. Consequently, performance analysis in the institutions has become a standard management practice and always plays a key role in the improvement process. Saad [1] indicated that performance analysis allows resources to be allocated with efficiency and effectiveness. Performance analysis also helps higher education planners identify the universities with the highest level of performance. The focus of this paper is the assessment of performance efficiency at higher education institutions.
When assessing the performance efficiency of one organization, there is a need to recognize the fact that at least some of the variations in outputs produced are a consequence of variations in the quantity and quality of inputs available. Data Envelopment Analysis (DEA) is an evaluation tool used in conjunction with decision-making units (DMUs) that effectively solves many decision-making problems by simultaneously integrating multiple inputs and outputs using a ratio of the limited weight sum of outputs to the limited weight sum of inputs. The DEA method has been applied to
a wide range of fields since its introduction. It is applied to assess the service efficiency and productivity of hospitals [2, 3], insurance companies [4, 5], banks [6, 7]. Recently, many researchers have applied the DEA method to evaluate university performance. Antreas and Estelle [8] used DEA to examine the comparative efficiency of higher education in the UK. Ying and Li [9] examined the research performance of higher education institutions in China. Their study addressed the regional differences in research performance in the educational sector of China. Johns [10, 11] provided an overview of methods which might be used to assess higher education, and he concluded that DEA had the advantage over alternative methods. His study also presented an application of DEA to a data set of universities in England. Abbott and Doucouliagos [12] used DEA to estimate technical and scale efficiencies for Australian public universities. Kong and Fu [13] constructed a student-based performance evaluation model for business schools in Taiwan. They incorporated weights from an Analytic Hierarchy Process (AHP) survey in the assurance region (AR) of DEA to prevent impractical indicator weights. Kao and Hung [14] applied DEA to assess the relative efficiency of academic departments. In their study, an assurance region was constructed by the top administrators of the university.
In this paper, we employ a DEA method to assess the performance of Vietnamese universities. Unlike
WSEAS TRANSACTIONS on BUSINESS and ECONOMICS Quang Hung Do, Jeng-Fung Chen
E-ISSN: 2224-2899 386 Volume 11, 2014

previous studies, we integrate the fuzzy AHP with the DEA model to establish the AR for each output weight. Determining the AR for weights of output indicators is related to multiple criteria decision making problem. Decision makers usually feel more confident when using linguistic variables than they feel when expressing their judgments in the form of numeric values. Fuzzy AHP is a useful tool to deal with imprecise and uncertain data. Being an extension of AHP, fuzzy AHP can be applied to solve hierarchical fuzzy decision-making problems. Fuzzy AHP can tackle vague problems more efficiently by using fuzzy scales. The fuzzy AHP method has been widely used by various researchers to solve different decision-making problems. Chan and Niraj [15] used fuzzy AHP to identify some important decision criteria for global supplier selection. Metin et al. [16] proposed a practical decision support mechanism based on fuzzy AHP to model shipping registry selection. Chou et al. [17] employed fuzzy AHP to evaluate the weighting for each criterion in the management of human resources for science and technology. Apart from the above mentioned applications, many other studies of fuzzy AHP have solved different managerial problems. Therefore, fuzzy AHP is appropriate for integrating managerial preferences by setting ARs in DEA models. In this paper, Chang’s extent analysis fuzzy AHP method [18, 19] is utilized to obtain the weights of output indicators.
In our study, the chosen input and output indicators were adapted to the Vietnamese higher education system. The data on the performance with regard to six indicators for 18 universities was used for empirical analysis. As mentioned above, an AR can prevent one output indicator from throwing off the entire comparison, and therefore, we employed the assurance region (AR) in our research. A survey of the relative importance levels of output indicators was conducted; the fuzzy AHP method was then applied to get the experts’ appraisals of fuzziness and ambiguity and to get pairwise comparisons of output indicators. Finally, these preparations were used to integrate AR into DEA.
The paper is organized in six sections, of which this is the first. Section 2 introduces the CCR model, AR. Theoretical background of the extended analysis fuzzy AHP method is in Section 3. Section 4 presents proposed steps of how we adopt fuzzy AHP to determine the AR for DEA model. Section 5 deals with the integrated framework used to assess the efficiency of Vietnamese university performance. The choice of input and output indicators for undertaking the analysis and a brief overview of the Vietnamese higher education
system with emphasis on its features are also described in this section; finally, the conclusion of the paper is drawn in Section 6. 2 The Data Envelopment Analysis In this section, the DEA model and AR are briefly introduced. 2.1 The DEA Model The Data Envelopment Analysis (DEA) is an analytical technique that has been widely used to assess the performance in the use of resources. The DEA ration form, developed by Charnes et al. [20], is designed to measure the relative efficiency of productivity of a specific decision making unit (DMU). The DEA formulation is given as follows. There are n units with s outputs denoted by Yrk, r=1...s, and m inputs denoted by Xik, i=1...m, the efficiency measure for DMUk is
∑
∑m
=iiki
s
r=rkr
k
Xv
Yu=h
1
1max (1)
where the weights, ur and vi, are non-negative. A set of constraints requires that the same weights, when applied to all DMUs, do not provide any unit with an efficiency greater than one.
1
1
1 ≤
∑
∑m
=iiji
s
=rrjr
Xv
Yu, for n,=j 1,... (2)
0≥ru for s,=r 1,... (3) 0≥iv for m,=i 1,... (4)
The efficiency ratio ranges from zero to one, with DMUk being considered relatively efficient if it receives a score of one. When the efficiency score of hk is one, DMU is regarded as an efficient frontier. The formulation described above can be transformed into a linear program (LP), which can be solved relatively easily and a complete DEA solves n linear programs, one for each DMU.
∑s
=rrkrk Yu=h
1
max (5)
subject to:
01 1
≥−∑ ∑m
=i
s
=rrjriji YuXv for n,=j 1,... (6)
∑m
=iiki =Xv
1
1 (7)
0≥ru for s,=r 1,... (8)
WSEAS TRANSACTIONS on BUSINESS and ECONOMICS Quang Hung Do, Jeng-Fung Chen
E-ISSN: 2224-2899 387 Volume 11, 2014

0≥iv for m,=i 1,... (9) The model, referred to as the CCR model,
assumes that the production function exhibits constant returns-to-scale. In this paper, we employed the CCR model for performance analysis. 2.2 Assurance Region In DEA model, large differences in weights from indicator to indicator may also be of concern and indicators with zero weights have no influence on the efficiency score, in spite of the alleged importance of the indicators [21]. The assurance region (AR) model [22] could allow weights varying within a region by imposing constraints on the relative magnitude of the weights for special items. For example, we may add a constraint on the ratio of weights for output indicators Y1 and Y2 as follows:
2,12
12,1 U
uu
Lj
j ≤≤ (10)
where L1,2 and U1,2 are lower and upper bounds of the ratio; uj1 and uj2 present the weight achieved by DMUj of indicator Y1 and Y2.
By adding the constraint in Eq. (10) into CCR model, we have AR-CCR model, which limits the region of weights to some special area. In our paper, we determine the lower bounds and upper bounds based on expert opinions and fuzzy AHP method approach. 3 Fuzzy Analytic Hierarchy Process In this section, the fuzzy theory is briefly introduced and then the extended analysis fuzzy AHP method is presented. 3.1 Fuzzy Theory Fuzzy set theory was first introduced by Zadeh [23] in 1965 to deal with the uncertainty due to imprecision or vagueness. A fuzzy set
( )( ){ }Xx|xμx,=A A ∈~~ is a set of ordered pairs and X
is a subset of real number R, where ( )xμA~ is called the membership function which assigns to each object x a grade of membership ranging from zero to one. Because of its intuitive appeal and computational efficiency, the triangular fuzzy number (TFN) is the most widely used membership function in many application fields. TFN is usually employed to capture the vagueness of the parameters related to the decision-making process. In order to reflect the fuzziness which surrounds the decision makers when they conduct a pairwise comparison matrix, TFN is expressed with boundaries instead of crisp numbers. A triangular
fuzzy number, denoted as ( )um,l,=A~ , has the following membership function:
( )
≤≤−−
≤≤−−
otherwise
uxm,muxu
mxl,lmlx=xμA
0,
~ (11)
The parameter “m” is the maximal grade of ( )xμA~ , the parameters “u” and “l” are the upper and
lower bound, which limit the field of possible evaluation (see Figure 1).
Fig. 1: A triangular fuzzy number, ( )umlA ,,~
= .
Consider two TFNs 1~A and 2
~A , ( )1111~ u,m,l=A
and ( )2222~ u,m,l=A . Their operation laws are as
follows: ( ) ( ) ( )212121222111 ⊕ u+u,m+m,l+l=u,m,lu,m,l (12) ( ) ( ) ( )212121222111 uu,mm,ll=u,m,lu,m,l −−−− (13) ( ) ( ) ( )212121222111 uu,mm,ll=u,m,lu,m,l ××× ,
00,0, >u>m>l iii (14) ( ) ( ) ( )212121222111 l÷u,m÷m,u÷l=u,m,l÷u,m,l ,
00,0, >u>m>l iii (15) ( ) ( )111
1111 /1/1/1 l,m,u=u,m,l − , 00,0, >u>m>l iii (16)
3.2 The Extended Analysis Fuzzy AHP Method The AHP method, the decision-making process, uses pairwise comparison judgments and matrix algebra to identify and estimate the relative importance of criteria and alternatives. It is a powerful method to solve complex decision problem. However, the pure AHP method has some shortcomings. AHP is ineffective when applied to deal with the ambiguous problem. The fuzzy AHP, an extension of the AHP model, has been applied to the fuzzy decision-making problems. In the fuzzy AHP, by using fuzzy arithmetic operation laws, the weights of evaluative elements are determined. There are several fuzzy AHP methods reported in the literature. Buyukozkan
WSEAS TRANSACTIONS on BUSINESS and ECONOMICS Quang Hung Do, Jeng-Fung Chen
E-ISSN: 2224-2899 388 Volume 11, 2014

et al. [24] gave a comparison of different fuzzy AHP methods. The comparison included the advantages and disadvantages of each method. Since the Chang method [19] is similar to the conventional AHP and relatively easier than the other approaches when implementing, we employed this method to get the weights for output indicators from expert’s opinion as making pairwise comparisons.
Let ( )nxmija=A ~~ be a fuzzy pairwise comparison
matrix, where ( )ijijijij u,m,l=a~ . The steps used for the Chang method are as follows:
Initially, pairwise comparison is made using fuzzy numbers
Secondly, the value of the fuzzy synthetic extent with respect to the ith object is defined as:
∑ ∑∑−
m
=j
n
i=
m
=jijiji MM=S
1
1
1 1
(17)
with
∑ ∑∑∑
m
=j
m
=jij
m
=jij
m
=jijij u,m,l=M
1 111
, n,=i 1,2,3,... (18)
∑∑ ∑∑∑∑∑∑
n
i=
m
=j
n
i=
m
=jij
n
i=
m
=jij
n
i=
m
=jijij u,m,l=M
1 1 1 11 11 1
(19)
∑∑∑∑∑∑∑∑
−
n
=i
m
=jij
n
=i
m
=jij
n
=i
m
=jij
n
=i
m
=jij
l,
m,
u=M
1 11 11 1
1
1 1
111 (20)
The values of Si are then compared and the degree of possibility of ( ) ( )iiiijjjj u,m,l=Su,m,l=S ≥ is calculated. This can be equivalently expressed as follows: ( ) ( )
( ) ( )
−−−−
≥
≥
∩≥
otherwiselmum
ul
ulif
mmif
=SSheight=SSV
iijj
ji
ji
ij
jiij
0,
1,
(21)
We need both the values ( )ij SSV ≥ and ( )ji SSV ≥ to compare iS and jS . The minimum degree possibility d(i) of ( )ij SSV ≥ for k,=ji, 1,2,... is calculated. ( )kS,,S,S,SSV ...321≥ , for k,=i 1,2,3,... (22)
( ) ( ) ( )[ ]kSSandSSandSSV= ≥≥≥ ...21 ( )iSSV= ≥min for k,=i 1,2,3,...
Assume that ( ) ( )ii SSV=Ad' ≥min , for k,=i 1,2,3,...
Then the weight vector is defined as ( ) ( ) ( )( )TnAd',,Ad',Ad'=W' ...21 (23)
where iA ( )n,=i 1,2,3,... are the n elements. Finally, the weight vectors are then normalized as follows.
( ) ( ) ( )( )TnAd,,Ad,Ad=W ...21 (24) where W is a non-fuzzy number and this gives the importance weights of one indicator over other. 4 Determining AR for DEA Model The following steps have been considered to set the AR for DEA model. 4.1 Establishing a Group of Decision-makers First of all, a group of decision-makers is formed. The members of the group are experienced lecturers and managers in universities. The decision-makers have to determine the relative weights of each output indicator. 4.2 Determining the Linguistic Variables and Fuzzy Conversion Scale Weights are determined by using a pairwise comparison of the importance or preference between each pair of indicators. The comparison of one indicator over another can be done with the help of questionnaire. In this paper, TFNs are used to represent subjective pairwise comparisons of decision-makers namely “just equal”, “equally important”, “weakly more important”, “strongly more important”, “very strongly more important” and “absolutely more important”. The triangular fuzzy conversion scales and linguistic scales, which is proposed by Kahraman et al. [25], is used to convert such linguistic values into fuzzy scales is demonstrated in Figure 2 and Table 1.
Fig. 2: Linguistic scale for relative importance
WSEAS TRANSACTIONS on BUSINESS and ECONOMICS Quang Hung Do, Jeng-Fung Chen
E-ISSN: 2224-2899 389 Volume 11, 2014

Table 1: Linguistic scales and fuzzy scales for importance
Linguistic scale for importance Triangular
fuzzy scale
Triangular fuzzy
reciprocal scale
Just equal (1,1,1) (1,1,1) Equally important (EI) (1/2,1,3/2) (2/3,1,2) Weakly more important (WMI) (1,3/2,2) (1/2,2/3,1) Strongly more important (SMI) (3/2,2,5/2) (2/5,1/2,2/3) Very strongly more important (VSMI) (2,5/2,3) (1/3,2/5,1/2) Absolutely more important (AMI) (5/2,3,7/2) (2/7,1/3,2/5) 4.3 Constructing the Fuzzy Comparison Matrix Let us consider a problem with n indicators, where the relative importance of indicator i to j is represented by fuzzy triangular numbers
ija~ =(lij,mij,uij) As in the traditional AHP, the
comparison matrix { }ijaA ~~= can be constructed,
such that
=
=
1...~/1~/1............
~...1~/1~...~1
1...~~ ............~...1~~...~1
~
21
212
112
21
221
112
nn
n
n
nn
n
n
aa
aaaa
aa
aaaa
A
(25) 4.4 Calculating the Consistency Index and Consistency Ratio of Fuzzy Comparison Matrix To assure a certain quality level of a decision, the consistency of an evaluation has to be analyzed. Saaty [26] proposed a consistency index to measure consistency. This index can be used to indicate how consistent the pairwise comparison matrices are. To investigate the consistency, the fuzzy comparison matrices need to be converted into crisp matrices [27]. There are some defuzzification methods [28] are for obtaining a crisp number from the triangular fuzzy number. In this paper, we select the fuzzy mean and spread method [29] to defuzzify the fuzzy numbers. A triangular fuzzy number denoted as
( )umla ,,~ = can be defuzzified to a crisp number as follows.
( ) 3_ umlcrispa ++= (26) The consistence index, CI, for a comparison matrix can be computed with the use of following equation.
1max
−−
=n
nCI λ (27)
where maxλ is the largest eigenvalue of the comparison matrix, n is the dimension of the matrix. The consistency ratio [26] is defined as a ratio between the consistency of a given evaluation
matrix and consistency of a random matrix.
( )nRICICR = (28)
where RI(n) is a random index [30] that depends on n, as shown in Table 2.
Table 2: Random index (RI) of random matrices N 3 4 5 6 7 8 9 RI(n) 0.58 0.9 1.12 1.24 1.32 1.41 1.45
If the consistency ratio (CR) of a comparison
matrix is equal or less than 0.1, it can be acceptable. When the CR is unacceptable, the decision maker is encouraged to repeat the pairwise comparisons.
In this step, the MATLAB package is employed to calculate the eigenvalues for all comparison matrices. 4.5 Calculating the Weights When the consistency in the comparison matrix is accepted, the extended analysis fuzzy AHP method is then employed to identify the weights of output indicators. These weights are used to determine the assurance regions for each output indicator in the AR-CCR model. 4.6 Defining the AR constraints The AR constraints are done by defining upper and lower bounds for each weight indicator. These bounds are now ranges for preference weights for each of the indicators as defined by the decision-makers. 5 An application of the approach to assess the efficiency of university performance in Vietnam In order to illustrate the applicability of the proposed method, an application related in the context of Vietnam is presented in this section. 5.1 Brief Overview of the Vietnamese Higher Education System Higher education in Vietnam has had a long tradition. Quoc Tu Giam - Vietnam’s first university, was established in the 11th century. The current system dates from 1904, when a branch of the University of Indochina was established in Hanoi. During the past ten years, higher education in Vietnam has experienced many changes. The number of universities and colleges has increased – from 153 universities and colleges in 2000 to the present total of 376. Besides public higher education institutions, mainly funded and managed by the
WSEAS TRANSACTIONS on BUSINESS and ECONOMICS Quang Hung Do, Jeng-Fung Chen
E-ISSN: 2224-2899 390 Volume 11, 2014

government, there exist other non-public higher education institutions in the education system. These are namely semi-public, foreign related, and private universities. All public institutions are managed by a particular ministry, specialized agency, or provincial government. In parallel with the growth in number, the diversification in types of institutions, the Vietnamese higher education system still faces lots of major challenges such as low educational quality and efficiency [31]. Universities have little experience in managing themselves or pursuing their own goals. A severe lack of close links between universities and scientific research, business, and industries has limited the ability of the higher education system to respond to the need of the growing market economy.
Vietnamese higher education has some its own characteristics when compared to other systems. Some of them are as follows. One is the availability of data. Due to several reasons, the data regarding the performance of the Vietnamese institutions are hard to acquire and determine. The responsibility for the activities, which in many countries are conducted within a unified system of higher education, is fragmented in Vietnam. Among the 376 institutions, the Ministry of Education and Training (MOET) governs just 14.5%. Other ministries and sectors govern the rest. Because of this fragmentation, information about the higher education system is disjointed and incomplete. Although institutions are required to send annual reports to MOET, only 54% did so in the 2008/09 academic year. Consequently, there are no systematic higher education institutions’ statistics. The other feature is the measurement of research capacity of one university. Scientific research is governed by the Ministry of Science and Technology. Due to the isolation between universities and research activities, the efficiency of performance and the quality of teaching and research have suffered as a result. Research conducted at universities is limited to only a few. Moreover, these researches have weak linkage with the industry and the funding sources for higher education are limited. These limitations lead to out-of-date equipment for teaching and research activities.
The Vietnam Socio-Economic development plan recognizes that it is essential to have reform to bridge the development gap between Vietnam’s higher education and that of regional and international countries. The aim is to create favorable conditions for future development and national competitiveness and the government has clear goals for higher education. The higher
education reform agenda (HERA) for 2006-2020 represents an important commitment by the government to higher education in Vietnam. The higher education system that is envisaged for 2020 will be more research-oriented, with focus on attracting more qualified staff and generating income from research and technology activities. In the HERA, improving external quality assurance and accreditation is also a major goal of the government. In most developed countries, the accreditation of institutions is overseen by an independent agency. This agency is responsible for quality assurance and makes the evaluations available to the public. However, there is not an independent agency like that in Vietnam. While the government is establishing an independent agency, the institutions are required to build and maintain an aim of continuous improvement and enhanced performance and qualities.
In short, accompanying economic growth, Vietnam has accomplished notable progress in the field of higher education. However, there are still concerns regarding the governing, quality and other relevant factors. Currently, the government is advocating a policy on basic and comprehensive reform of Vietnamese higher education during the period of 2010-2020, which is determined to build universities with international rankings and encourage every educational institution to improve its performance. 5.2 The Choice of Input and Output Indicators Teaching and research are considered the two major tasks of a university. To assess the performance, we need indicators that can represent the achievement of teaching and research tasks. The issue of devising and using effective and useful performance indicators in higher education has been discussed and described in several previous studies [8, 10-12, 14, 32, 33] As mentioned in the above section, the Vietnamese higher education system has its own specific characteristics and there will be difficulties in applying some of these sets of indicators to Vietnamese higher education institutions. Since the objective of this paper is to assess the performance of universities in a Vietnamese higher education system context, only obtainable and quantifiable input and output indicators were considered. For the above reason, the input and output indicators, which were proposed by Kao and Hung [14], are used in this paper.
To perform teaching and research activities, the university has to utilize some scarce resources. The first important resource is personnel (full-time
WSEAS TRANSACTIONS on BUSINESS and ECONOMICS Quang Hung Do, Jeng-Fung Chen
E-ISSN: 2224-2899 391 Volume 11, 2014

equivalent). This includes lecturer as well as administrative staff. The second important resource is the annual funding allocated for operating expenses to each university from the government and other organizations. This expense covers the cost of operating the university including the procurement and maintenance of the equipment and facilities, salaries paid to lecturers and staff, and all other expenditures. In addition to personnel and operating expenses, another resource considered as one of the important input indicators is the amount of space. The space owned by the university includes buildings, grounds, libraries and other. Universities with more space are expected to achieve more in teaching and research activities. In sum, three input indicators are used in this paper to assess the performance of universities. They are personnel, expressed in the number of academic staff (X1), annual operating expenses in billion VND (X2), and floor area in square meters (X3).
To examine the performance of teaching, total credit-hours is used as an output indicator, since this indicates the teaching loads and effort devoted to teaching. Regarding research, there are many indicators that have been used to measure its achievement, of which the number of publications is the most widely accepted. This indicator is also used in this paper. Publications consist of books, refereed journals, conference proceedings, etc. However, Vietnamese academics tend to publish in Vietnamese journals that are not widely cited in SSCI-listed journal [34]. Therefore, it is likely that there are few highly cited researchers from Vietnamese universities, which limits the usefulness of this indicator in the Vietnamese case. In Vietnam, universities are pressured to increase their research activities and are ultimately expected to increase
their grants through scientific research, technology transfer and other research related services. One of the targets for the higher education sector set by the Vietnamese government is that external grants from science and technology activities should be increased to 25 percent of total university income by 2020 [35]. Hence, another indicator used in this paper as a measure for the performance of research achievement is the grant from science and technology activities. In brief, there are three output indicators to measure the efficiency of university performance, namely total credit-hours (Y1), the number of publications (Y2), and the grants from science and technology activities in billions VND (Y3).
To form the basis of the empirical analysis, we collected quantitative data on inputs and outputs for Vietnamese universities in the academic year 2010-2011. As mentioned above in the previous section, since availability of data and the differences in management mechanisms and structures, we limited our study to public institutions. In addition, the focus of this paper is only on the performance assessment of large-scale universities in Vietnam. Hence, there were 18 public institutions in the analysis. These major universities include key universities, regional universities, and several universities offering programs according to their specialties. The data used in this study were obtained from two sources. The first was from the public annual report provided by the universities. The input and output indicator values in Table 3 were the ones in the report of the academic year 2010/11. The second source of the data was based on the number of publications found in the journals and conference proceedings. Table 3 exhibits the quantitative data of universities in the analysis.
WSEAS TRANSACTIONS on BUSINESS and ECONOMICS Quang Hung Do, Jeng-Fung Chen
E-ISSN: 2224-2899 392 Volume 11, 2014

Table 3: Input and output measures of the 18 universities in Vietnam
No Institution Personnel Expenses (in billion
VND)
Space (in square
meter)
Total credit-hours
Publications Grants
(in billion VND)
X1 X2 X3 Y1 Y2 Y3 1 Banking Academy 496.00 27.70 18695.50 10856.32 1.00 0.55 2 Cantho University 1182.00 140.17 173525.40 19709.85 139.00 0.68 3 Dalat University 318.00 55.72 50565.00 8028.29 2.00 0.00 4 Danang University 1336.00 96.66 201430.00 62173.10 13.00 42.38 5 Foreign Trade University 490.00 30.79 45132.00 8135.23 4.00 3.68 6 Hanoi Pharmacy University 184.00 51.90 18575.00 3748.98 3.00 2.90 7 Hanoi University of agriculture 692.00 47.49 193371.40 6452.50 43.00 0.68 8 Hanoi University of Technology 1261.00 81.60 121724.00 13804.80 120.00 62.00 9 Ho Chi Minh City University of Medicine and Pharmacy 1035.00 119.00 11016.00 5905.13 7.00 0.90
10 Hochiminh city University of Technology 1038.00 129.00 42081.00 14366.17 83.00 2.00 11 National Economics University, Hanoi 728.00 79.31 45385.20 9848.75 4.00 0.13 12 Posts and Telecommunications Institute of Technology 663.00 3.10 53100.00 7364.26 7.00 65.92 13 Thainguyen University of Education 404.00 33.06 72245.00 1464.50 4.00 2.35 14 University of economics – Hue University 195.00 14.60 10058.00 3939.65 0.00 0.43 15 University of Transport Technology 456.00 39.09 33262.62 8265.00 0.00 6.70 16 Vinh University 933.00 60.00 59469.00 14407.93 116.00 1.50 17 VNU University of Science 374.00 80.62 36421.37 3253.80 183.00 37.84 18 VNU-University of Engineering and Technology 162.00 22.99 7352.00 2211.61 39.00 7.37
Average 663.72 61.82 66300.47 11329.77 42.67 13.22
The raw data collected are given in Table 3. Note that the input and output indicator values in Table 3 have different units. For the ratio relationships in output indicator weight ratios to be meaningful, the
values were normalized. The respective output indicator values when normalized to an average of 100 in each indicator are shown in Table 4.
Table 4: Normalized input and output measures of the 18 universities in Vietnam
No Institution Personnel Expenses Space Total
credit-hours
Publications Grants
X1 X2 X3 Y1 Y2 Y3 1 Banking Academy 74.7301 44.8066 28.1981 95.8212 2.3438 4.1220 2 Cantho University 178.0865 226.7409 261.7257 173.9652 325.7813 5.1658 3 Dalat University 47.9116 90.1309 76.2664 70.8601 4.6875 0.0000 4 Danang University 201.2890 156.3476 303.8138 548.7588 30.4688 320.5193 5 Foreign Trade University 73.8261 49.7968 68.0719 71.8040 9.3750 27.8028 6 Hanoi Pharmacy University 27.7224 83.9518 28.0164 33.0896 7.0313 21.9337 7 Hanoi University of agriculture 104.2605 76.8150 291.6592 56.9517 100.7813 5.1053 8 Hanoi University of Technology 189.9891 131.9935 183.5945 121.8454 281.2500 468.9273 9 Ho Chi Minh City University of Medicine and Pharmacy 155.9387 192.4905 16.6153 52.1204 16.4063 6.8070
10 Hochiminh city University of Technology 156.3907 208.6662 63.4701 126.8002 194.5313 15.1267 11 National Economics University, Hanoi 109.6844 128.2812 68.4538 86.9281 9.3750 0.9757 12 Posts and Telecommunications Institute of Technology 99.8912 5.0112 80.0899 64.9992 16.4063 498.5453 13 Thainguyen University of Education 60.8688 53.4768 108.9660 12.9261 9.3750 17.7739 14 University of economics – Hue University 29.3798 23.6165 15.1703 34.7726 0.0000 3.2522 15 University of Transport Technology 68.7034 63.2226 50.1695 72.9494 0.0000 50.6744 16 Vinh University 140.5709 97.0541 89.6962 127.1687 271.8750 11.3450 17 VNU University of Science 56.3489 130.4083 54.9338 28.7190 428.9063 286.1969 18 VNU-University of Engineering and Technology 24.4078 37.1895 11.0889 19.5204 91.4063 55.7267 Average 100 100 100 100 100 100
5.3 The AR of Output Indicators from Applying the Fuzzy AHP Method To get the reasonable weight regions for each output indicator in the model, we conducted a survey on the relative importance between output indicators to experienced lecturers, top administrators and experts from universities in Vietnam. The subjective pairwise comparisons of the decision-makers among their opinions are in the linguistic form. The fuzzy AHP was then employed to quantify their judgments. The derived results were used for setting the upper and lower bounds of assurance regions.
The survey process, consisting of 17 decision-makers, was conducted. Using the above steps in the previous section, we determined the weights attached to the output indicators. Taking the data entered by one member of decision-maker group as an example, via pairwise comparison and the use of Table 1, the fuzzy pairwise comparison matrix was constructed as Table 5.
WSEAS TRANSACTIONS on BUSINESS and ECONOMICS Quang Hung Do, Jeng-Fung Chen
E-ISSN: 2224-2899 393 Volume 11, 2014

Table 5: The fuzzy pairwise comparison matrix Y1 Y2 Y3
Y1 (1,1,1) (3/2,2,5/2) (3/2,2,5/2) Y2 (2/5,1/2,2/3) (1,1,1) (1/2,1,3/2) Y3 (2/5,1/2,2/3) (2/3,1,2) (1,1,1)
By employing Eq. (26) – Eq. (28), we got the
value of CR = 0.0843. It was found that it is less than 10%. Therefore, the consistency in this comparison matrix is acceptable.
Using Eq. (17) through Eq. (20), we determined the TFN values of the three output indicators to be the following: S1 = (4, 5, 6).(1/12.833, 1/10, 1/7.967) = (0.312, 0.5, 0.753) S2 = (1.9, 2.5, 3.167).(1/12.833, 1/10, 1/7.967) = (0.148, 0.25, 0. 397) S3 = (2.067, 2.5 , 3.667).(1/12.833, 1/10, 1/7.967) = (0.161, 0.25, 0.46)
We compared the value of Si individually and identified the degree of possibility of
( ) ( )jjjjiiii u,m,l=Su,m,l=S ≥ using Eq. (21). Table 6 shows the values of V(Si ≥ Sj).
Table 6: Values of V(Si ≥ Sj) V(S1≥Sj) Value V(S2≥Sj) Value V(S3≥Sj) Value
V(S1≥S2) 1.000 V(S2≥S1) 0.256 V(S3≥S1) 0.373
V (S1≥S3) 1.000 V(S2≥S3) 1.000 V(S3≥S2) 1
Thereafter, we determined the minimum degree
of possibility d’(i) of V(Si≥ Sj) for i, j=1,2,3 using Eq. (22). ( ) ( ) 1min1 321 =S,SSV=d' ≥ ( ) ( ) 0.256min2 312 =S,SSV=d' ≥ ( ) ( ) 0.373min3 213 =S,SSV=d' ≥
Therefore, the weight vector was found to be as below using Eq. (23). W’= (1, 0.256, 0.373)T
We then normalized the weight vectors using Eq. (24) and obtained the relative weights of the three output indicators W= (0.614, 0.157, 0.229)T, where W is a non-fuzzy number.
Since some decision-makers have the same opinion on the importance level of output indicators, the derived weights from all decision-makers were gathered in three groups as in Table 7.
Table 7: Fuzzy AHP weights of outputs u1 u2 u3 Group 1 0.614 0.157 0.229 Group 2 0.333 0.333 0.333 Group 3 0.545 0.227 0.227
To incorporate these weights in the CCR model,
we made pairwise divisions between weights. We could find the largest and smallest values of each weight ratio and constructed the upper and lower bounds values of such weight ratio. For example, the ratio u1/u2 takes on a value of 0.614/0.157=3.911 for the group 1 and 0.333/0.333=1 for the group 2. We can also calculate the ratio u1/u2 for the group 3. Thus, we have used the highest u1/u2=3.911 from the group 1 as the upper bound of the ratio 21 /uu , and the smallest u1/u2=1 from the group 2 as the lower bound. Therefore, the range of u1/u2 is
3.911/1.000 21 ≤≤ uu . This ratio weight constraint will be incorporated in the AR-CCR model. Other ranges of ratio weights can be found in Table 8. Table 8: Upper and lower bounds of output weight
ratios Output weight ratio Lower bound Upper bound
u1/u2 1.000 3.911 u1/u3 1.000 2.681 u2/u3 0.686 1.000
Empirical results The data with six indicators from 18 universities in Table 3 were used for empirical analysis. The weight ratios from the fuzzy-AHP in Table 8 were incorporated into the assurance region of CCR model. Table 9 exhibits the benefit of using the AR-CCR to avoid extreme weight distribution of output indicators. The weight distributions of output for the CCR and AR-CCR model are shown in this table. We can easily find that there are many zero output indicator weights when using the CCR model, which is unreasonable for assessing their performance. This unreasonable situation disappears in the AR-CCR model, in which all of the output weights are larger than zero. For this reason, the AR-CCR model makes the DEA results more precise as then reflect the real decision making situation and integrates managerial preference into the DEA approach.
The results of the AR-CCR model are shown in Table 10. It represents the university rankings based on the average efficiency scores. We find that, with the efficiency score of 1, Danang University, Posts and Telecommunications Institute of Technology, VNU University of Science, and VNU-University of Engineering and Technology performed the best among universities in the analysis. They are the most competitive universities and efficient frontier group. The runner up was the Banking Academy with 0.7947. Meanwhile, Thainguyen University of Education finished in 18th place with the efficiency score of 0.1077.
WSEAS TRANSACTIONS on BUSINESS and ECONOMICS Quang Hung Do, Jeng-Fung Chen
E-ISSN: 2224-2899 394 Volume 11, 2014
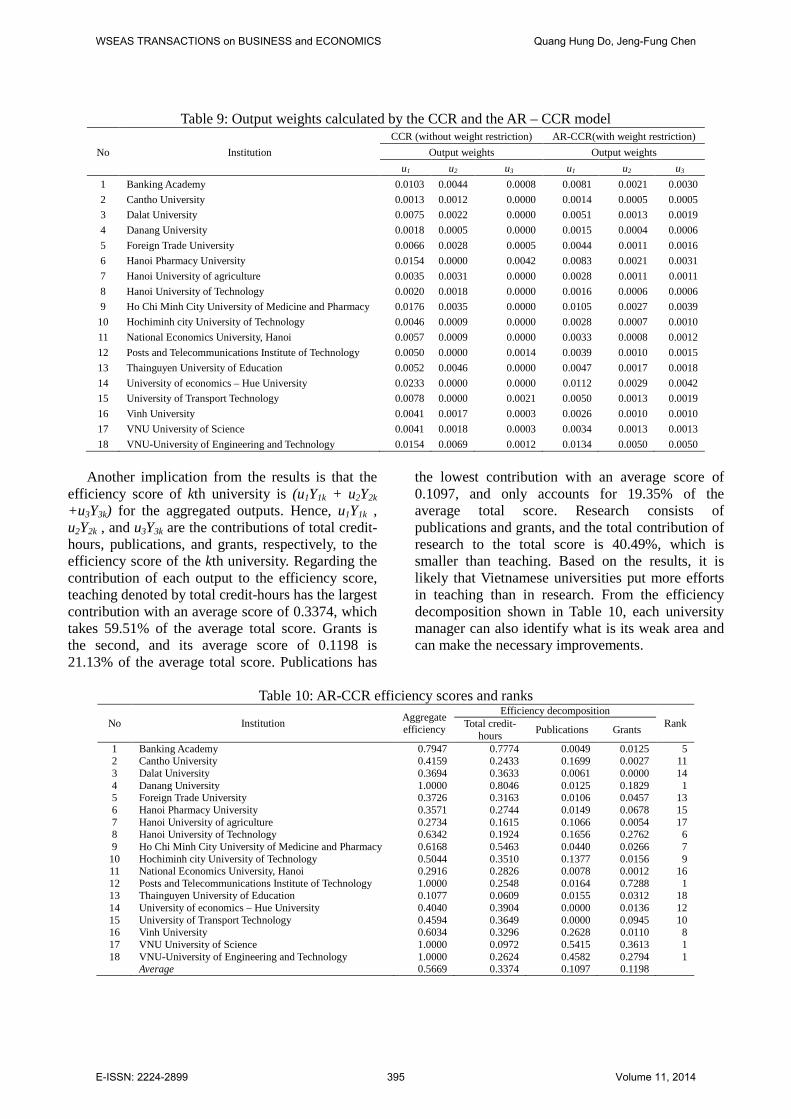
Table 9: Output weights calculated by the CCR and the AR – CCR model
No Institution CCR (without weight restriction) AR-CCR(with weight restriction)
Output weights Output weights u1 u2 u3 u1 u2 u3
1 Banking Academy 0.0103 0.0044 0.0008 0.0081 0.0021 0.0030 2 Cantho University 0.0013 0.0012 0.0000 0.0014 0.0005 0.0005 3 Dalat University 0.0075 0.0022 0.0000 0.0051 0.0013 0.0019 4 Danang University 0.0018 0.0005 0.0000 0.0015 0.0004 0.0006 5 Foreign Trade University 0.0066 0.0028 0.0005 0.0044 0.0011 0.0016 6 Hanoi Pharmacy University 0.0154 0.0000 0.0042 0.0083 0.0021 0.0031 7 Hanoi University of agriculture 0.0035 0.0031 0.0000 0.0028 0.0011 0.0011 8 Hanoi University of Technology 0.0020 0.0018 0.0000 0.0016 0.0006 0.0006 9 Ho Chi Minh City University of Medicine and Pharmacy 0.0176 0.0035 0.0000 0.0105 0.0027 0.0039
10 Hochiminh city University of Technology 0.0046 0.0009 0.0000 0.0028 0.0007 0.0010 11 National Economics University, Hanoi 0.0057 0.0009 0.0000 0.0033 0.0008 0.0012 12 Posts and Telecommunications Institute of Technology 0.0050 0.0000 0.0014 0.0039 0.0010 0.0015 13 Thainguyen University of Education 0.0052 0.0046 0.0000 0.0047 0.0017 0.0018 14 University of economics – Hue University 0.0233 0.0000 0.0000 0.0112 0.0029 0.0042 15 University of Transport Technology 0.0078 0.0000 0.0021 0.0050 0.0013 0.0019 16 Vinh University 0.0041 0.0017 0.0003 0.0026 0.0010 0.0010 17 VNU University of Science 0.0041 0.0018 0.0003 0.0034 0.0013 0.0013 18 VNU-University of Engineering and Technology 0.0154 0.0069 0.0012 0.0134 0.0050 0.0050
Another implication from the results is that the
efficiency score of kth university is (u1Y1k + u2Y2k +u3Y3k) for the aggregated outputs. Hence, u1Y1k , u2Y2k , and u3Y3k are the contributions of total credit-hours, publications, and grants, respectively, to the efficiency score of the kth university. Regarding the contribution of each output to the efficiency score, teaching denoted by total credit-hours has the largest contribution with an average score of 0.3374, which takes 59.51% of the average total score. Grants is the second, and its average score of 0.1198 is 21.13% of the average total score. Publications has
the lowest contribution with an average score of 0.1097, and only accounts for 19.35% of the average total score. Research consists of publications and grants, and the total contribution of research to the total score is 40.49%, which is smaller than teaching. Based on the results, it is likely that Vietnamese universities put more efforts in teaching than in research. From the efficiency decomposition shown in Table 10, each university manager can also identify what is its weak area and can make the necessary improvements.
Table 10: AR-CCR efficiency scores and ranks
No Institution Aggregate efficiency
Efficiency decomposition Rank Total credit-
hours Publications Grants
1 Banking Academy 0.7947 0.7774 0.0049 0.0125 5 2 Cantho University 0.4159 0.2433 0.1699 0.0027 11 3 Dalat University 0.3694 0.3633 0.0061 0.0000 14 4 Danang University 1.0000 0.8046 0.0125 0.1829 1 5 Foreign Trade University 0.3726 0.3163 0.0106 0.0457 13 6 Hanoi Pharmacy University 0.3571 0.2744 0.0149 0.0678 15 7 Hanoi University of agriculture 0.2734 0.1615 0.1066 0.0054 17 8 Hanoi University of Technology 0.6342 0.1924 0.1656 0.2762 6 9 Ho Chi Minh City University of Medicine and Pharmacy 0.6168 0.5463 0.0440 0.0266 7
10 Hochiminh city University of Technology 0.5044 0.3510 0.1377 0.0156 9 11 National Economics University, Hanoi 0.2916 0.2826 0.0078 0.0012 16 12 Posts and Telecommunications Institute of Technology 1.0000 0.2548 0.0164 0.7288 1 13 Thainguyen University of Education 0.1077 0.0609 0.0155 0.0312 18 14 University of economics – Hue University 0.4040 0.3904 0.0000 0.0136 12 15 University of Transport Technology 0.4594 0.3649 0.0000 0.0945 10 16 Vinh University 0.6034 0.3296 0.2628 0.0110 8 17 VNU University of Science 1.0000 0.0972 0.5415 0.3613 1 18 VNU-University of Engineering and Technology 1.0000 0.2624 0.4582 0.2794 1
Average 0.5669 0.3374 0.1097 0.1198
WSEAS TRANSACTIONS on BUSINESS and ECONOMICS Quang Hung Do, Jeng-Fung Chen
E-ISSN: 2224-2899 395 Volume 11, 2014

6 Conclusions In this paper, we applied the fuzzy AHP/AR-CCR integrated approach to develop a framework for assessing the efficiency of university performance. The use of AR for restriction of weights is one way to integrate managerial preferences into the DEA and it helped to get rid of zero weights that frequently appeared in the solution. These, combined with experts’ opinions in fuzzy AHP make the DEA method more reasonable when assessing the efficiency of performance. When using the proposed approach, we identified the universities with the best efficiency performance and vice verse. The analysis of the university performance efficiency is valuable not only from the point of higher education planners, who are concerned with expanding higher education and allocating resources, but is also of interest to university managers that wish to improve their university’s competitiveness. Hence, such findings are important management information for universities in improving their performances in the future. The framework also may be a useful tool for other universities to improve their performances. For further study, we are planning to measure the relative efficiency of university performance from other viewpoints and will extend our research with more universities in the analysis. Acknowledgment This research was funded by the National Science Council of Taiwan under Grant No. NSC 102-2221-E-035-040. References: [1] G. Saad, Strategic performance evaluation:
descriptive and prescriptive analysis, Industrial management and Data system, Vol.101, No.8, 2001, pp. 390–399.
[2] H.H. Chang, Determinants of hospital efficiency: the case of Central Government–owned hospitals in Taiwan, Omega, Vol.26, No.2, 1998, pp. 307-317.
[3] G.D. Ferrier and J.S. Trivitt, Incorporating quality into the measurement of hospital efficiency: a double DEA approach, Journal of Productivity Analysis, 2012.
[4] J.D. Cummins and X. Xie, Efficiency, productivity, and scale economies in the U.S.property-liability insurance industry, Journal of Productivity Analysis, 2012.
[5] J. Mahajan, A data envelopment analytic model for assessing the relative efficiency of the selling function, European Journal of
Operational Research, Vol.53, No.2, 1991, pp. 189-205.
[6] C. Schaffnit, D. Rosen, and J.C. Paradi, Best practice analysis of bank branches: an application of DEA in a large Canadian bank, European Journal of Operational Research, Vol.98, No.2, 1997, pp. 269-289.
[7] D. Wu, Z. Yang, and L. Liang, Efficiency analysis of cross-region bank branches using fuzzy data envelopment analysis, Applied Mathematics and Computation, Vol.181, No.1, 2006, pp. 271-281.
[8] D.A. Antreas and S. Estelle, Assessing the comparative efficiency of Higher Education Institutions in the UK by means of Data Envelopment Analysis, Education Economics, Vol.5, No.2, 1997, pp. 117-134.
[9] C.Ng. Ying and S.K. Li, Measuring the research performance of Chinese Higher education institutions: an application of Data Envelopment Analysis, Education Economics, Vol.8, No.2, 2000, pp. 139-156.
[10] J. Johnes, Performance assessment in higher education in Britain, European Journal of Operational Research, Vol.89, No.1, 1996, pp. 18-33.
[11] J. Johnes, Data envelopment analysis and its application to the measurement of efficiency in higher education, Economics of Education Review, Vol.25, No.3, 2006, pp. 273-288.
[12] M. Abbott and C. Doucouliagos, The efficiency of Australian universities: A data envelopment analysis, Economics of Education Review, Vol.22, No.1, 2003, pp. 89-97.
[13] W.H. Kong and T.T. Fu, Assessing the performance of business colleges in Taiwan using data envelopment analysis and student based value-added performance indicators, Omega, Vol.40, No.5, 2012, pp. 541-549.
[14] C. Kao and H.T. Hung, Efficiency analysis of university departments: An empirical study, Omega, Vol.36, No.4, 2008, pp. 653–664.
[15] Felix T.S. Chan and K. Niraj, Global supplier development considering risk factors using fuzzy extended AHP-based approach, Omega, Vol.35, No.4, 2007, pp. 417-431.
[16] I.Deha Er Metin Celik and A. Fahri Ozok, Application of fuzzy extended AHP methodology on shipping registry selection: The case of Turkish maritime industry, Expert Systems with Applications, Vol.36, No.1, 2009, pp. 190-198.
[17] Y.C. Chou, C.C. Sun, and H.Y. Yen, Evaluating the criteria for human resource for
WSEAS TRANSACTIONS on BUSINESS and ECONOMICS Quang Hung Do, Jeng-Fung Chen
E-ISSN: 2224-2899 396 Volume 11, 2014

science and technology (HRST) based on an integrated fuzzy AHP and fuzzy DEMATEL approach, Applied Soft Computing, Vol.12, No.1, 2012, pp. 64-71.
[18] D.Y. Chang, Extent analysis and synthetic decision optimization techniques and applications, World Scientific, Vol.1, 1992, pp. 352.
[19] D.Y. Chang, Applications of the extent analysis method on fuzzy AHP, European Journal of Operation Research, Vol.95, No.3, 1996, pp. 649-655.
[20] A.Charnes, W.W. Cooper, and E. Rhodes, Measuring the efficiency of decision making units, European Journal of Operational Research, Vol.2, No.6, 1978, pp. 493-497.
[21] F.R. Førsund, Weight restrictions in DEA: misplaced emphasis?, Journal of Productivity Analysis, 2012
[22] R.G. Thompson, F.D. Singleton, R.M. Thrall, and B.A. Smith, Comparative Site Evaluations for Locating a High-Energy Physics Lab in Texas, Interfaces, Vol.16, No.6, 1986, pp. 35-49.
[23] L.A. Zadeh, Fuzzy set, Information and Control, Vol.8, 1965, pp. 338-353.
[24] G. Buyukozkan, C. Kahraman, and D. Ruan, A fuzzy multi-criteria decision approach for software development strategy selection, International Journal of General Systems, Vol.33, No.2-3, 2004, pp.259-280.
[25] C. Kahraman, T. Ertay and G. Buyukozkan, A fuzzy optimization model for QFD planning process using analytic network approach, European Journal of Operational Research, Vol.171, No.2, 2006, pp. 390-411.
[26] T.L. Saaty, The analytic hierarchy process: planning, priority setting, resource allocation McGraw-Hill, New York, pp. 28-36, 1980.
[27] C.F. Chen, Determining the attribute weights of professional conference organizer selection: an application of the fuzzy AHP approach, Tourism Economics, Vol.17, No.5, 2011, pp. 1129-1139.
[28] W.B. Lee, H. Lau, Z.Z. Lau, and S. Tam, A fuzzy analytic hierarchy process approach in modular product design, Expert Systems, Vol.18, No.1, 2001, pp. 32-42.
[29] E.S. Lee and R.J. Li, Comparison of fuzzy numbers based on the probability measure of fuzzy events, Computers & Mathematics with Applications, Vol.15, No.10, 1988, pp. 887-896.
[30] B.L. Golden, The Analytic hierarchy process: applications and studies, Springer-Verlag,
New York, pp 28-28, 1989. [31] J.V. Thomas and W. Ben, Vietnamese Higher
Education: Crisis and Response, 2008, http://www.ash.harvard.edu/ash/Home/Programs/Institute-for-Asia, accessed 18 October 2012.
[32] F. Azma, Qualitative Indicators for the evaluation of universities performance, Procedia Social and Behavioral Sciences, Vol.2, No.2, 2010, pp. 5408-5411.
[33] R. Ball and J. Halwachi, Performance indicators in higher education, Higher Education, Vol. 16, 1987, pp. 393-405.
[34] S.E. Khoo and G. Hugo, Trades Skills Formation, Skilled Migration and Temporary Labour Flows, Asia-Pacific Skilled Migration to Australia workshop, 2007.
[35] Government of Vietnam, Resolution No 14/2005/NQ-CP, 2 November 2005, on “the Substantial and Comprehensive Renewal of Vietnam’s Tertiary Education in the 2006-2010 Period” (usually referred to as the Higher Education Reform Agenda, (HERA). Higher Education, Vietnam-Sector Analysis 2010.
WSEAS TRANSACTIONS on BUSINESS and ECONOMICS Quang Hung Do, Jeng-Fung Chen
E-ISSN: 2224-2899 397 Volume 11, 2014