a hydromechanical biomimetic cochlea:...
TRANSCRIPT
A hydromechanical biomimetic cochlea: Experimentsand models
Fangyi Chena!
Department of Electrical and Computer Engineering, Hearing Research Center, Boston University,Boston, Massachusetts 02215
Howard I. CohenDepartment of Physiology and Biophysics, Boston University, School of Medicine, Boston,Massachusetts 02118
Thomas G. BifanoDepartment of Manufacturing Engineering, Boston University, Boston, Massachusetts 02215
Jason Castle, Jeffrey Fortin, and Christopher KapustaGeneral Electric Global Research Center, Niskayuna, New York 12309
David C. Mountain and Aleks ZosulsDepartment of Biomedical Engineering, Hearing Research Center, Boston University, Boston,Massachusetts 02215
Allyn E. Hubbardb!
Department of Electrical and Computer Engineering, Department of Biomedical Engineering,Hearing Research Center, Boston University, Boston, Massachusetts 02215
!Received 11 May 2005; revised 1 November 2005; accepted 3 November 2005"
The construction, measurement, and modeling of an artificial cochlea !ACochlea" are presented inthis paper. An artificial basilar membrane !ABM" was made by depositing discrete Cu beams on apiezomembrane substrate. Rather than two fluid channels, as in the mammalian cochlea, a singlefluid channel was implemented on one side of the ABM, facilitating the use of a laser to detect theABM vibration on the other side. Measurements were performed on both the ABM and theACochlea. The measurement results on the ABM show that the longitudinal coupling on the ABMis very strong. Reduced longitudinal coupling was achieved by cutting the membrane betweenadjacent beams using a laser. The measured results from the ACochlea with a laser-cut ABMdemonstrate cochlear-like features, including traveling waves, sharp high-frequency rolloffs, andplace-specific frequency selectivity. Companion computational models of the mechanical deviceswere formulated and implemented using a circuit simulator. Experimental data were comparedwith simulation results. The simulation results from the computational models of the ABMand the ACochlea are similar to their experimental counterparts. © 2006 Acoustical Society ofAmerica. #DOI: 10.1121/1.2141296$
PACS number!s": 43.64.Bt, 43.64.Kc, 43.60.Qv #BLM$ Pages: 394–405
I. INTRODUCTION
The cochlea, which is highly frequency selective,handles acoustic phenomena hydromechanically, resulting inan audible frequency range of typically 20 Hz to 20 kHz forhumans. Although the biological cochlea is an active mecha-nism, in which amplification takes place !Dallos, 1996", thepassive !aged or slightly damaged" cochlea is still a valuablehearing asset. A passive artificial hydromechanical imple-mentation of a cochlea, therefore, should be able to mimic at
least some useful aspects of cochlear signal processing func-tionality. Modern micromachining technology offers thetechnology with which to build such a device. In this paper,we describe the construction and characterization of a hydro-mechanical artificial cochlea !ACochlea". Our goal in thispaper is twofold. One is to demonstrate cochlea-like featuresin the experimental results taken from a prototype device.The other is to use mathematical models1 to understand thebehavior of the prototype and investigate ways to improve itsperformance.
To mimic salient cochlear signal processing features,electronic chips have been built using both analog !for areview see Yang, 2004" and digital circuits !for a review seeLeong et al., 2003". Most of the analog implementations areimproved versions of the electronic cochlea originally pro-posed by Lyon and Mead !1988". In these implementations, acascade of second-order filters was built using subthreshold
a"Current address: Oregon Hearing Research Center, Oregon Health & Sci-ence University, Portland, Oregon 97239-3098. Electronic mail:[email protected]
b"Author to whom correspondence should be addressed: Allyn E. Hubbard,Boston University, Department of Electrical and Computer Engineering, 8Saint Mary’s Street, Boston, Massachusetts 02215. Electronic mail:[email protected]
394 J. Acoust. Soc. Am. 119 "1!, January 2006 © 2006 Acoustical Society of America0001-4966/2006/119"1!/394/12/$22.50
MOSFET technology. This implementation, however, suffersstability and accuracy problems from transistor mismatchingand temperature sensitivity.
The digital implementations to approximate the cochlearfrequency response are built as digital filters, either codedinto a field programmable gate array !FPGA", designed intoan application-specific integrated circuit !ASIC", or pro-grammed on a digital signal processing !DSP" chip. The digi-tal implementation typically requires more transistors than acomparable analog implementation, so the number of outputchannels from a single digital chip is likely to be more lim-ited. Another problem is that, while a larger number of out-put channels can be achieved with increasingly potent chips,or by using multiple chips, the power consumption can be-come unattractively high.
A mechanical implementation of an artificial cochleashould be able to mimic cochlear signal processing function-ality in a more natural way. The desired behavior should bethe result of material properties and construction geometry,not circuit behavior. In theory, the mechanical signal proces-sor does not require external power other than the acousticpower from the impinging sound, although electrical powerwill be needed for instrumentation and post-processing.
The history of building a mechanical structure for simu-lating cochlear behavior can be divided into two periods.During the first period, mechanical cochleae were built tostudy and help understand cochlear behavior. Because of thedifficulties building and driving such a small device, theseearly mechanical cochleae were typically one or two ordersof magnitude larger than a human cochlea. A scaling tech-nique was adopted in those designs, wherein all the dimen-sions of the human cochlea were multiplied by a scale factor.However, the material properties of these artificial cochleaewere usually not scaled properly due to the lack of materialswith the required properties. Some of the important works ofthis period are as follows. von Bekesy !1960" built a me-chanical cochlea to study the traveling wave. Tonndorf!1959" adopted a similar structure to study beats in the co-chlea. Chadwick and Adler !1975" constructed a mechanicalcochlear model to examine their theory of the cochlea. Muchlater, Lechner !1993" implemented an ACochlea with a Poly-vinylidene Fluoride !PVF2 or PVDF" bending transducer,which is mounted on beams on the artificial basilar mem-brane !ABM" to obtain an electrical output from the vibra-tional activity. Lechner also added actuators to a beam tosimulate the active response in the cochlea. About the sametime, Zhou et al. !1993", proposed the first life-sized physicalmechanical cochlea. In this device, an isotropic polymermembrane was put on a steel template to build the ABM.Two plastic chambers were constructed to mimic the co-chlear scalae.
The second period begins in the mid-1990s. With im-proved micromachining technology, efforts to build practicaldevices to mimic the cochlear function were carried out andreported. Haronian and Macdonald !1996" proposed a micro-electromechanically based frequency signature sensor!MEM-FSS". An array of beams of gradually varying lengthswas etched on a silicon substrate. However, no fluid couplingexists in this structure. Thus, the structure can only mimic
the basilar membrane !BM", since the fluid coupling is a keyelement for the cochlea mechanical signal processing. Al-though they did model the squeezed air between beams as acoupling spring and dashpot, they treated this coupling as alocal factor to influence the adjacent beam resonating quality,but not a longitudinal energy coupling mechanism. Tanaka etal. !1998" described a fish-boned structure, where differentlengths of silicon beams lie on a core backbone of the samematerial. This core backbone was used to transfer vibrationsalong the device, simulating the fluid channel’s function. Theinput to the device is at the end of the core backbone, whichis too stiff to match it properly to the acoustic input signal.Lim et al. !2000" published their work on a mechanical co-chlea made by laying an isotropic film over a slotted siliconwafer and surrounding it with fluid channels. They demon-strated the traveling-wave feature by showing the phase plotat two locations along their ACochlea. The magnitude re-sponse shown is rather irregular and does not show the ex-pected high-frequency roll off. The author offered the isot-ropy of the ABM as the major reason for this problem.Hemmert et al. !2003" proposed a fluid-filled MEMS-basedmechanical cochlea. In this model, the BM is built using anepoxy-based photoresist, which possesses stiffness close tothe biological material. The authors used the impulse re-sponse at two very closely spaced locations to demonstratethe existence of a traveling wave.
Recently, Wittbrodt et al. !2004" proposed a new designcontinuing Lim’s effort !Lim et al., 2000". Aluminum fiberswere deposited on a soft membrane to produce the aniso-tropic ABM. In 2002, White and Grosh !2002" reported theirmicroelectromechanical-system !MEMS" cochlea, whichused a single fluid channel and a BM made of silicon beams.Silicon-nitride beams were used in a newer version of thiswork to reduce the residue tension on the beams !White andGrosh, 2005". Both the silicon and silicon-nitride beams aremuch stiffer than their biological counterpart. White andGrosh !2005" presented the measurement results from theirACochlea. The phase response from measurements on thisdevice demonstrated the traveling wave delay. However, themagnitude response shows very shallow high-frequencyrolloff with ripples. The authors cited the difficulty in achiev-ing strong enough anisotropy on the ABM as a reason for theshallow high-frequency rolloff. To obtain an electrical outputfrom the beam vibration, White and Grosh !2002" used pi-ezoresistive material and later !White and Grosh, 2005" useda capacitive sensing technique.
The above review demonstrates some of the challengesin building an ACochlea. The first challenge is the fabrica-tion. Here the key is to build an anisotropic BM with stiff-ness similar to the biological material. The second challengeis to properly drive the small device and demonstrate thecochlea-like features in the experimental results. Those fea-tures include a slow traveling wave, sharp rolloff at the high-frequency end of the beam vibration spectrum, and thegradually decreasing cutoff frequency of the beam vibrationspectrum along the length of the ACochlea.
The passive hydromechanical cochlea is typically sim-plified to be an elongated box with two fluid channels and amembrane partition between them !Peterson and Bogert,
J. Acoust. Soc. Am., Vol. 119, No. 1, January 2006 Chen et al.: A hydro-mechanical biomimetic cochlea 395

1950; Zwislocki, 1950". The membrane partition is some-times simply called the “basilar membrane”. It is the BM, infact, whose stiffness is critical to cochlear frequency sensi-tivity !von Bekesy, 1960". Zwislocki !1950" proposed atransmission-line-based model for his simplified cochlearmechanical structure. His theory explained the presence of atraveling wave as well as the tonotopicity of the cochlea.These two important features of cochlear behavior wereoriginally measured by von Bekesy !1960". Zwislocki !1950"noted that the stiffness gradient on the BM, and the presenceof the fluid channel, are keys to the hydromechanical signalprocessing in the cochlea. The interaction of the fluid massand the BM stiffness results in the passive cochlear response,which present a series of low-pass filters with graduallyvarying cutoff frequencies.
Two devices are described in this paper: One is an ABMand the other is an ACochlea built around the ABM. TheABM is the most important functional part of the ACochlea,since it provides tonotopicity, i.e., positional frequency selec-tivity. We also provide computational models of the devices.Results from those devices are presented to characterize theirperformance and to help us to understand their behavior. Themeasured results on our ACochlea demonstrate somecochlea-like features, such as the slow traveling wave, tono-topicity, and the sharp high frequency roll-off. The modelresults mimic the performance of the devices.
II. METHODS
A. Device design and fabrication
We constructed our ACochlea with our ABM and a fluidchannel. The constituents of the ABM include a membranesubstrate with beams and the frame supporting it. On themembrane substrate, a Cu beam array with gradually increas-ing length is designed to produce the stiffness gradient,which is a key component for the cochlear mechanical signalprocessing. The beam array has a trapezoidal profile. Framessupport the membrane. The frames have a slotted window ofthe same shape as the profile of the Cu beam array. When themembrane is sandwiched by the frame, the edge of the slot-ted window clamps the beams and forms an open channel oneach side of the membrane. This open channel is covered bya Plexiglas structure to form the ACochlear fluid channel.Two windows on this Plexiglas structure provide accessibil-ity to the fluid channel, one for providing mechanical inputand the other for fluid filling.
1. ABM materials and structure
The fabrication and assembling of the ABM took placein General Electric’s Global Research Center !GE-GRC" fa-cility in Niskayuna, NY. The membrane substrate is made ofpiezofilm procured from Measurement Specialties, Inc. ofHampton, VA. The piezo film at the beam serves as a me-chanical transducer. The current design uses a 9 !m thickPVDF film premetalized with %1500 angstroms Ni/Cu onboth sides.
During the fabrication, a 100 mm diameter sheet of thepiezofilm was first attached to a hoop around the outside,using a laminating process. This process induces a slight
pretension in the film, which achieves a smooth surface sothat standard photolithography can be used to form the beamarray and the circuitry to connect the piezosensors. Thesmooth surface is also needed in assembling the ABM.
AZ1512, a positive photoresist, is then spun onto bothsides of the stretched film. Next, vias are drilled through thestretched frame using the ESI laser system. These vias willbe used later for precision alignment pins and alignment lo-cations for the circuitry. Using a laser exposure system, theoutline of the circuitry is patterned into the resist on bothsides of the frame. AZ351, an aqueous developer !ClariantCorporation, Somerville, NJ" is used to develop the resistand to expose the metal circuitry for electroplating. The de-veloping time is about 3–5 min. If interconnections betweenboth sides of the film are necessary, the ESI laser system canbe used to drill through the material to form fused vias.
Since the metallization of the PVDF film is very thin,the circuitry is electroplated with Cu to about 12.5 !m thick.This gives the device rigidity for probing and the correctbeam modulus. Following plate-up, the resist is strippedfrom both sides and then redeposited for the next patterningstep. After developing, the device is wet etched in a 30%nitric acid bath to remove the Ni/Cu metallization. Etchingtakes about 1 min, depending on the concentration of thesolution. This in turn exposes the PVDF film and defines thecircuitry. Once etching is complete the remaining resist canbe stripped to expose the completed circuit.
Figure 1!a" is a schematic view of the membrane sub-strate, showing a beam array in the middle. The circuitry toconnect beams is not shown here for simplicity. The beamlength increases progressively from 4 mm at one end to 8mm at the other end. This length gradient produces the stiff-ness gradient. There are 32 beams on this sample. Figure
FIG. 1. The membrane structure of a 32-beam ABM, not to scale. Thedimensions in this figure are in mm unless specified otherwise. !a" Thelayout schematic. This panel shows how the beams are arrayed on the mem-brane substrate. !b" Zoom-in view of the beam structure. !c" A schematic ofthe cross-sectional view of a beam section.
396 J. Acoust. Soc. Am., Vol. 119, No. 1, January 2006 Chen et al.: A hydro-mechanical biomimetic cochlea
1!b" shows a zoom-in view of the beams. On the sampleunder discussion, the beams are equally spaced along theABM, each being 400 !m wide. They are spaced 630 !mcenter to center, resulting in a gap of 230 !m between theedges of adjacent beams. Figure 1!c" shows a schematiccross-sectional view of a beam section, noting the thicknessdimensions of the layers. This figure shows that the two Culayers, each of 12.5 !m thickness, are coated on both sidesof the piezomembrane.
The Young’s modulus of the Cu is about 30–50 timesgreater than that of the piezomembrane !110 GPa vs. 2–4GPa". Hence this structure is expected to produce strong an-isotropy. However, a later study showed that the pretensionon the membrane during the fabrication greatly reduces theanisotropy. Therefore, a laser system !model #5200 from ESIin Portland, OR" was used to provide controlled, sharp, pre-cision cutting or slitting of the film. The spot size of thistriple YAG laser is about 18 !m. The laser slices through themembrane, resulting in a cut of about 100 !m width in themembrane between beams.
The frame of the ABM is made of plaskon !Amco Plas-tic Materials, Inc. in Farmingdale, NY", a thermo set epoxywidely used in the electronics industry as an encapsulant. Itwas chosen because of its ease of fabrication. The plaskon ismolded into a large substrate, 6 in. by 6 in., and approxi-mately 1 mm thick. The thickness will dictate the depth ofthe ACochlear fluid channel, as we will discuss in Sec.II A 2. If a different substrate thickness is needed, theplaskon can be lapped thinner or molded to the desired thick-ness. Post-molding, the plaskon is cleaned with an acetonewipe followed by a propanol wipe. This allows better adhe-sion to the adhesive layer. The adhesive layer is a 3M™
high-temperature acrylic film, similar to a double-sided tape.The adhesive is applied to the appropriate sides of theplaskon and trimmed with a razor blade. The adhesion pro-cess is used to sandwich the membrane substrate in the as-sembly of the ABM.
2. Assembly of the ABM
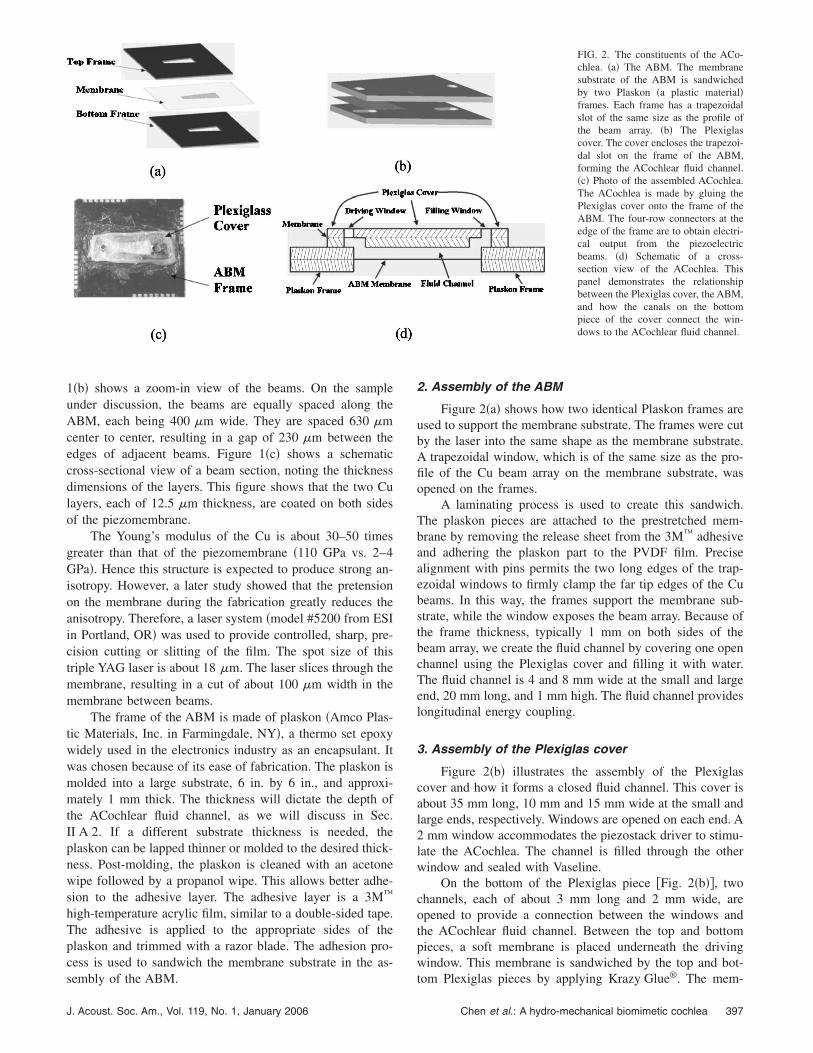
Figure 2!a" shows how two identical Plaskon frames areused to support the membrane substrate. The frames were cutby the laser into the same shape as the membrane substrate.A trapezoidal window, which is of the same size as the pro-file of the Cu beam array on the membrane substrate, wasopened on the frames.
A laminating process is used to create this sandwich.The plaskon pieces are attached to the prestretched mem-brane by removing the release sheet from the 3M™ adhesiveand adhering the plaskon part to the PVDF film. Precisealignment with pins permits the two long edges of the trap-ezoidal windows to firmly clamp the far tip edges of the Cubeams. In this way, the frames support the membrane sub-strate, while the window exposes the beam array. Because ofthe frame thickness, typically 1 mm on both sides of thebeam array, we create the fluid channel by covering one openchannel using the Plexiglas cover and filling it with water.The fluid channel is 4 and 8 mm wide at the small and largeend, 20 mm long, and 1 mm high. The fluid channel provideslongitudinal energy coupling.
3. Assembly of the Plexiglas cover
Figure 2!b" illustrates the assembly of the Plexiglascover and how it forms a closed fluid channel. This cover isabout 35 mm long, 10 mm and 15 mm wide at the small andlarge ends, respectively. Windows are opened on each end. A2 mm window accommodates the piezostack driver to stimu-late the ACochlea. The channel is filled through the otherwindow and sealed with Vaseline.
On the bottom of the Plexiglas piece #Fig. 2!b"$, twochannels, each of about 3 mm long and 2 mm wide, areopened to provide a connection between the windows andthe ACochlear fluid channel. Between the top and bottompieces, a soft membrane is placed underneath the drivingwindow. This membrane is sandwiched by the top and bot-tom Plexiglas pieces by applying Krazy Glue®. The mem-
FIG. 2. The constituents of the ACo-chlea. !a" The ABM. The membranesubstrate of the ABM is sandwichedby two Plaskon !a plastic material"frames. Each frame has a trapezoidalslot of the same size as the profile ofthe beam array. !b" The Plexiglascover. The cover encloses the trapezoi-dal slot on the frame of the ABM,forming the ACochlear fluid channel.!c" Photo of the assembled ACochlea.The ACochlea is made by gluing thePlexiglas cover onto the frame of theABM. The four-row connectors at theedge of the frame are to obtain electri-cal output from the piezoelectricbeams. !d" Schematic of a cross-section view of the ACochlea. Thispanel demonstrates the relationshipbetween the Plexiglas cover, the ABM,and how the canals on the bottompiece of the cover connect the win-dows to the ACochlear fluid channel.
J. Acoust. Soc. Am., Vol. 119, No. 1, January 2006 Chen et al.: A hydro-mechanical biomimetic cochlea 397
brane window separates the ACochlear fluid channel fromthe air and provides an interface for the piezodriver.
4. Constituents of the ACochlea and the method to fillthe fluid channel
Figure 2!c" shows the assembled ACochlea. The Plexi-glas cover is adhered to the Plaskon surface over the ABMusing a commercially available, quick setting, epoxy adhe-sive !Plastic Welder™ from Devcon". Figure 2!d" shows aschematic of the cross-section view along the longitudinalaxis. This view shows that the driving and filling window areconnected to the ACochlear fluid channel through the twocanals on the bottom piece of the Plexiglas cover. To fill thefluid channel, the whole ACochlea, as shown in Fig. 2!c", isplaced in a vessel and submerged in water and degassedusing a vacuum.
5. Efficacy of the design of our ACochlea
Our device is designed to mimic the passive cochlearmechanical signal processing features of the cochlea, not itssize, shape, or material properties. Only the top open channelof the ABM is covered. The bottom of the ABM is exposedto the air, so that our laser instrument could monitor thebeam’s vibrational activity. When a double channel imple-mentation was used, where both channels were covered by aPlexiglas piece, the plastic cover, and the fluid absorbed,deflected and scattered the laser light, both during incidenceand reflection, degrading the signal-to-noise ratio of the mea-surement. Theoretical analyses !Patuzzi, 1996" and the mod-eling study by an author !Chen, 2005" show that the singlechannel cochlea offers behavior very similar to its doublechannel counterpart.
B. Experimental measurements
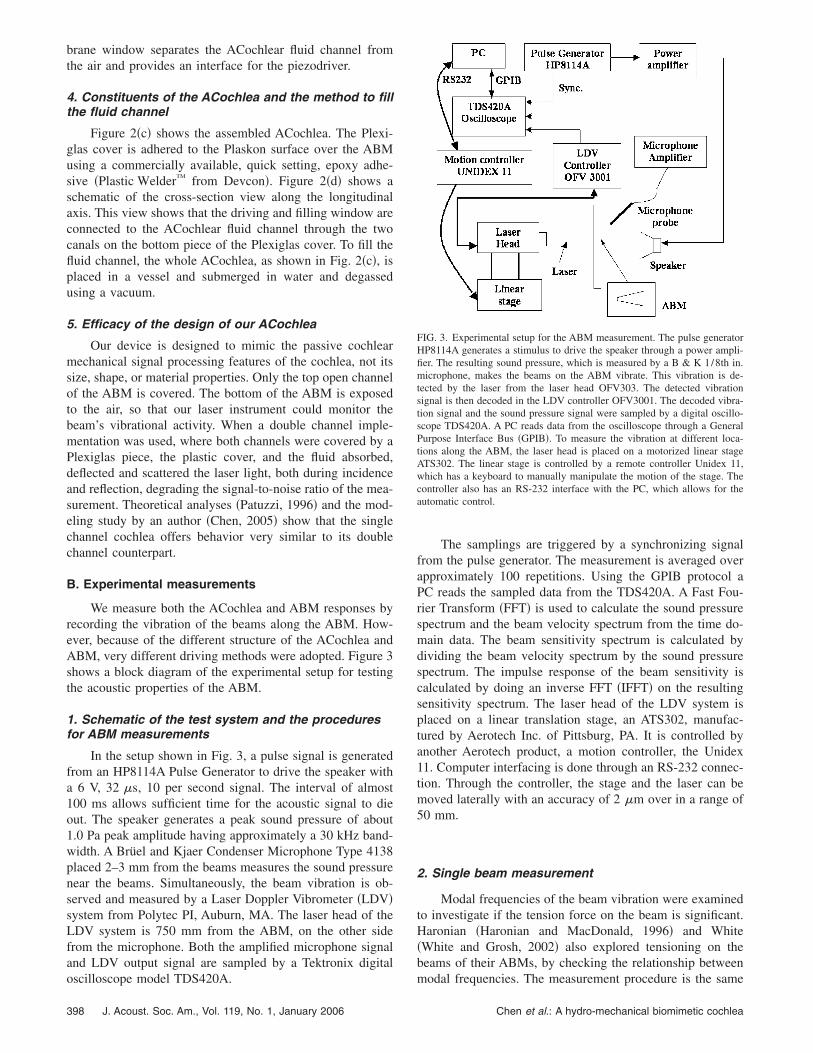
We measure both the ACochlea and ABM responses byrecording the vibration of the beams along the ABM. How-ever, because of the different structure of the ACochlea andABM, very different driving methods were adopted. Figure 3shows a block diagram of the experimental setup for testingthe acoustic properties of the ABM.
1. Schematic of the test system and the proceduresfor ABM measurements
In the setup shown in Fig. 3, a pulse signal is generatedfrom an HP8114A Pulse Generator to drive the speaker witha 6 V, 32 !s, 10 per second signal. The interval of almost100 ms allows sufficient time for the acoustic signal to dieout. The speaker generates a peak sound pressure of about1.0 Pa peak amplitude having approximately a 30 kHz band-width. A Brüel and Kjaer Condenser Microphone Type 4138placed 2–3 mm from the beams measures the sound pressurenear the beams. Simultaneously, the beam vibration is ob-served and measured by a Laser Doppler Vibrometer !LDV"system from Polytec PI, Auburn, MA. The laser head of theLDV system is 750 mm from the ABM, on the other sidefrom the microphone. Both the amplified microphone signaland LDV output signal are sampled by a Tektronix digitaloscilloscope model TDS420A.
The samplings are triggered by a synchronizing signalfrom the pulse generator. The measurement is averaged overapproximately 100 repetitions. Using the GPIB protocol aPC reads the sampled data from the TDS420A. A Fast Fou-rier Transform !FFT" is used to calculate the sound pressurespectrum and the beam velocity spectrum from the time do-main data. The beam sensitivity spectrum is calculated bydividing the beam velocity spectrum by the sound pressurespectrum. The impulse response of the beam sensitivity iscalculated by doing an inverse FFT !IFFT" on the resultingsensitivity spectrum. The laser head of the LDV system isplaced on a linear translation stage, an ATS302, manufac-tured by Aerotech Inc. of Pittsburg, PA. It is controlled byanother Aerotech product, a motion controller, the Unidex11. Computer interfacing is done through an RS-232 connec-tion. Through the controller, the stage and the laser can bemoved laterally with an accuracy of 2 !m over in a range of50 mm.
2. Single beam measurement
Modal frequencies of the beam vibration were examinedto investigate if the tension force on the beam is significant.Haronian !Haronian and MacDonald, 1996" and White!White and Grosh, 2002" also explored tensioning on thebeams of their ABMs, by checking the relationship betweenmodal frequencies. The measurement procedure is the same
FIG. 3. Experimental setup for the ABM measurement. The pulse generatorHP8114A generates a stimulus to drive the speaker through a power ampli-fier. The resulting sound pressure, which is measured by a B & K 1/8th in.microphone, makes the beams on the ABM vibrate. This vibration is de-tected by the laser from the laser head OFV303. The detected vibrationsignal is then decoded in the LDV controller OFV3001. The decoded vibra-tion signal and the sound pressure signal were sampled by a digital oscillo-scope TDS420A. A PC reads data from the oscilloscope through a GeneralPurpose Interface Bus !GPIB". To measure the vibration at different loca-tions along the ABM, the laser head is placed on a motorized linear stageATS302. The linear stage is controlled by a remote controller Unidex 11,which has a keyboard to manually manipulate the motion of the stage. Thecontroller also has an RS-232 interface with the PC, which allows for theautomatic control.
398 J. Acoust. Soc. Am., Vol. 119, No. 1, January 2006 Chen et al.: A hydro-mechanical biomimetic cochlea

as that used for the ABM measurement, except that the ABMis mounted so that the beam is in the horizontal direction andthe laser scans along the length of the beam.
3. ACochlea measurement
The basic experimental setup shown in Fig. 3 is alsoused to measure the ACochlear response, but using a pi-ezostack driver. The driver head, a cylindrical steel post of10 mm length and 2 mm in diameter, was glued on top of thestack driver. The piezostack was then glued on an aluminumpost, which was mounted on an XYZ micromanipulator tomove the driver head into the driving window. The pi-ezostack driver’s vibration was measured before it was ad-vanced into the driving window. The load of the ACochleashould not influence the vibration of the driver, because theacoustic impedance of the driver is at least 100 times largerthan that of the ACochlea, as calculated using our math-ematical models. Their outputs track the ACochlear and pi-ezodriver response well.
We also tested an ACochlea built using an ABM wherethe piezofilm between beams was sliced completely through,to reduce longitudinal coupling. The cuts allow slow waterleakage from the ACochlear fluid channel. Measurementstypically had to be done within 30-45 min, before significantleakage would occur.
C. Simulation methods
1. Mechanical model of the ABM
Here the ABM model is introduced using its mechanicalschematic. Each metal beam is represented by a dampedmass-spring oscillator. Contrary to the classical cochlearmodel !von Bekesy, 1960", where the coupling between theBM sections is ignored, most models of artificial cochleainclude longitudinal coupling. Lim !Lim et al., 2000" indi-cated that the longitudinal coupling can influence the slopeof the high-frequency rolloff of the artificial cochlea re-sponses. White and Grosh !White and Grosh, 2005" also usethe longitudinal stiffness to account for the shallow rolloff intheir measurements. Here a spring is used to represent thecoupling action of the membrane between the beams. Figure4 shows the mechanical schematic of three adjacent beams.
2. Circuit model of the ACochlea
Figure 5 shows a circuit model of the ACochlea, whichis a two-dimensional version of a traditional transmission-line structure !Peterson and Bogert, 1950; Zwislocki, 1950";
!see Hubbard and Mountain, 1996" for a review. Figure 5!a"shows the fluid channel, modeled as a two-dimensional ma-trix of inductors and resistors, representing the inertia andthe viscosity of the fluid, respectively. Figure 5!b" shows acircuit model for the ABM, which represents the mechanicalmodel shown in Fig. 4, now based on the electroacousticanalogy. Each beam is modeled as a series of circuit compo-nents, and is called a beam section. A middle section receivesinput both from the one before it and the one after it, affect-ing the longitudinal coupling. The fluid channel model isconstructed with an equal number of sections and connectedone-to-one with the ABM model, forming the ACochleamodel. Table I lists the corresponding components in theacoustical model and the circuit model, as well as their di-mensional units.
The stiffness of the beam section is due to the bendingand the pretension on the beam, and labeled Ty to distinguish
FIG. 4. The mechanical model of the ABM. In this model, each beam ismodeled as a mechanical resonator with a mass component, m!n", a damper,b!n", and a spring, k!n". The spring, kc!n", connecting two beam resonators,represents the coupling between beams through the membrane substrate.
FIG. 5. The circuit schematic for three adjacent beam sections of the ACo-chlear model. !a" The fluid channel model. The inductors and resistors hererepresent the fluid inertia and viscosity, respectively. !b" The ABM model.This is the circuit !acoustic units" implementation of the mechanical modelshown in Fig. 4. The dashpot damper b!n", spring k!n", and mass m!n" arereplaced by resistance RBM!n", capacitance CBM!n", and inductance LBM!n",respectively. The values of the circuit components for a beam section aredetermined by the beam geometry and its material characteristics. The effectof the interstage spring kc!n" between beams is represented by two voltagecontrolled voltage sources !VCVSs", EF!n" and EB!n", and the capacitorCC!n". This seemingly complex circuit is necessary to match the force equa-tion of the mechanical coupling. The value of the coupling components isdetermined by the geometry of the membrane and the pretension on themembrane. The floating nodes at the bottom of the fluid model are con-nected to those on the top of the ABM model, forming the ACochlear model.
J. Acoust. Soc. Am., Vol. 119, No. 1, January 2006 Chen et al.: A hydro-mechanical biomimetic cochlea 399
it from the longitudinal tension !Tx" on the membrane. Thestiffness due to bending is calculated by assuming aclamped–clamped boundary condition on the sandwichstructure shown in Fig. 1!c". The stiffness due to the preten-sion Ty is calculated from a string equation. The value of Tyis estimated in the single beam measurement by observinghow the modal frequencies of a beam section deviate fromthose of an ideal clamped–clamped beam.
In each beam section, the value of the capacitor C!n",which is a volume compliance, is calculated using the squareof the beam surface area divided by the total stiffness. Thevalue of inductor L!n" is calculated from the beam acousticmass, which is the mass of the beam scaled by the square ofthe beam surface area. The value of the damper, R!n", iscalculated from L!n" and C!n" by assigning a quality factor,Q.
The membrane between beams is modeled as a stringwith tension, represented by the coupling spring Kc!n". Byassigning a pretension Tx, the coupling spring value is calcu-lated by knowing the length and the cross-section area of themembrane. Three coupling components EF!n" , EB!n", andCC!n" are used to represent the coupling spring in order tosatisfy the mechanical equations. The values of Q and Tx areestimated in the ABM study by matching the measured re-sults with modeling results of a proper Q and Tx. #See Chen!2005" for details.$
III. EXPERIMENTAL RESULTS
A. The ABM
1. Results from an ABM with membrane couplingbetween beams
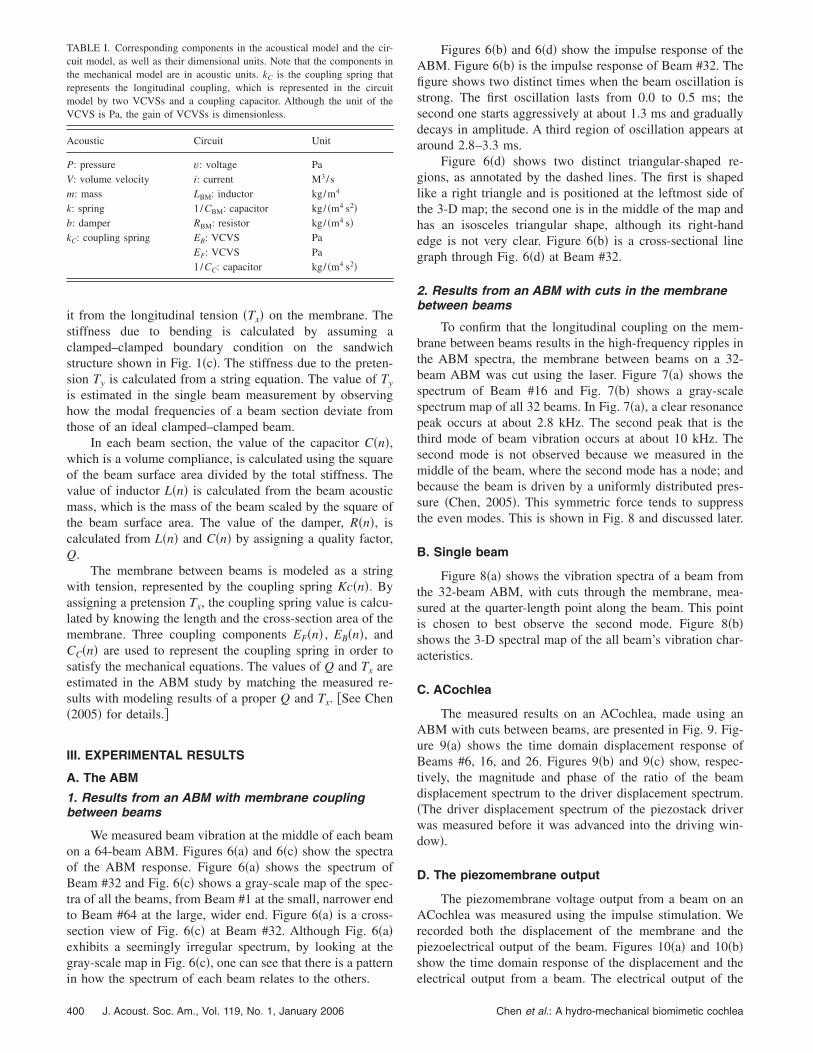
We measured beam vibration at the middle of each beamon a 64-beam ABM. Figures 6!a" and 6!c" show the spectraof the ABM response. Figure 6!a" shows the spectrum ofBeam #32 and Fig. 6!c" shows a gray-scale map of the spec-tra of all the beams, from Beam #1 at the small, narrower endto Beam #64 at the large, wider end. Figure 6!a" is a cross-section view of Fig. 6!c" at Beam #32. Although Fig. 6!a"exhibits a seemingly irregular spectrum, by looking at thegray-scale map in Fig. 6!c", one can see that there is a patternin how the spectrum of each beam relates to the others.
Figures 6!b" and 6!d" show the impulse response of theABM. Figure 6!b" is the impulse response of Beam #32. Thefigure shows two distinct times when the beam oscillation isstrong. The first oscillation lasts from 0.0 to 0.5 ms; thesecond one starts aggressively at about 1.3 ms and graduallydecays in amplitude. A third region of oscillation appears ataround 2.8–3.3 ms.
Figure 6!d" shows two distinct triangular-shaped re-gions, as annotated by the dashed lines. The first is shapedlike a right triangle and is positioned at the leftmost side ofthe 3-D map; the second one is in the middle of the map andhas an isosceles triangular shape, although its right-handedge is not very clear. Figure 6!b" is a cross-sectional linegraph through Fig. 6!d" at Beam #32.
2. Results from an ABM with cuts in the membranebetween beams
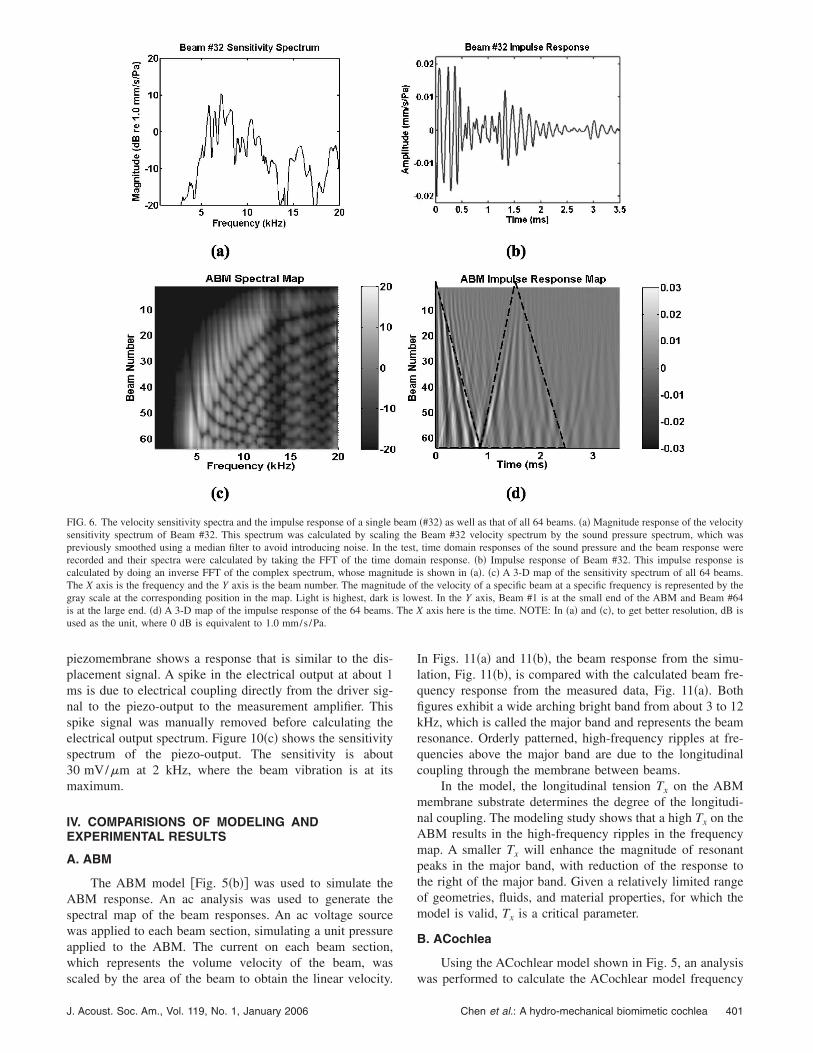
To confirm that the longitudinal coupling on the mem-brane between beams results in the high-frequency ripples inthe ABM spectra, the membrane between beams on a 32-beam ABM was cut using the laser. Figure 7!a" shows thespectrum of Beam #16 and Fig. 7!b" shows a gray-scalespectrum map of all 32 beams. In Fig. 7!a", a clear resonancepeak occurs at about 2.8 kHz. The second peak that is thethird mode of beam vibration occurs at about 10 kHz. Thesecond mode is not observed because we measured in themiddle of the beam, where the second mode has a node; andbecause the beam is driven by a uniformly distributed pres-sure !Chen, 2005". This symmetric force tends to suppressthe even modes. This is shown in Fig. 8 and discussed later.
B. Single beam
Figure 8!a" shows the vibration spectra of a beam fromthe 32-beam ABM, with cuts through the membrane, mea-sured at the quarter-length point along the beam. This pointis chosen to best observe the second mode. Figure 8!b"shows the 3-D spectral map of the all beam’s vibration char-acteristics.
C. ACochlea
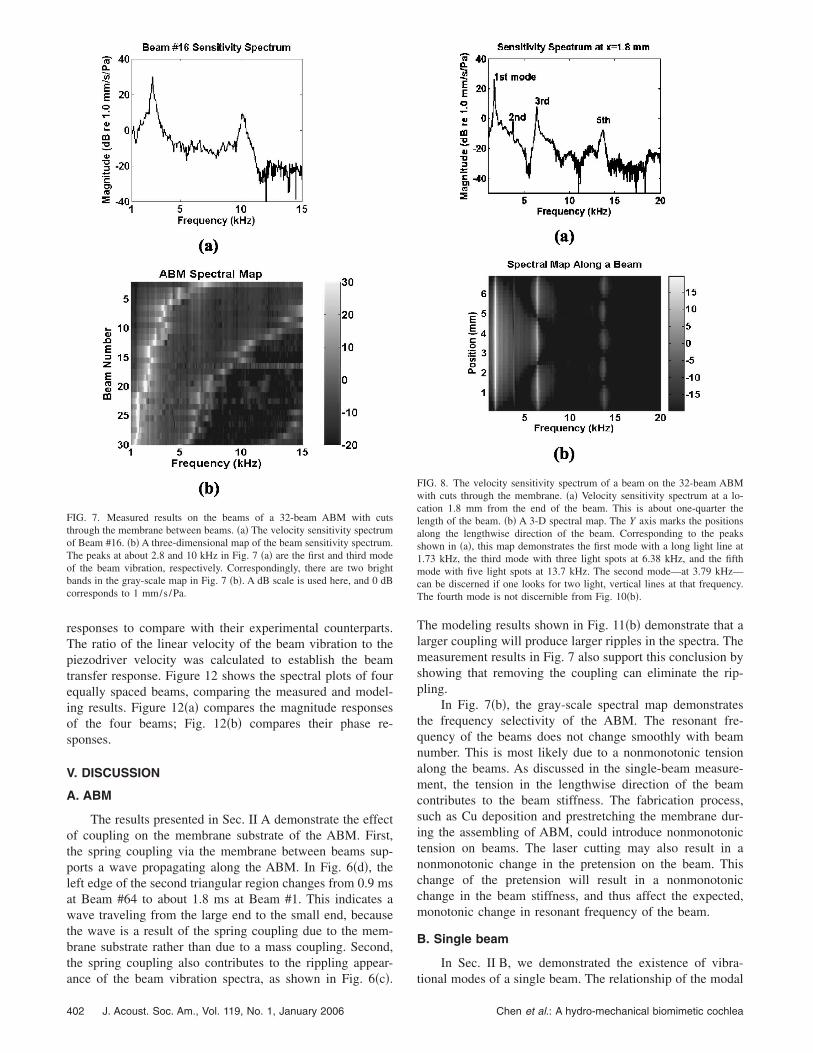
The measured results on an ACochlea, made using anABM with cuts between beams, are presented in Fig. 9. Fig-ure 9!a" shows the time domain displacement response ofBeams #6, 16, and 26. Figures 9!b" and 9!c" show, respec-tively, the magnitude and phase of the ratio of the beamdisplacement spectrum to the driver displacement spectrum.!The driver displacement spectrum of the piezostack driverwas measured before it was advanced into the driving win-dow".
D. The piezomembrane output
The piezomembrane voltage output from a beam on anACochlea was measured using the impulse stimulation. Werecorded both the displacement of the membrane and thepiezoelectrical output of the beam. Figures 10!a" and 10!b"show the time domain response of the displacement and theelectrical output from a beam. The electrical output of the
TABLE I. Corresponding components in the acoustical model and the cir-cuit model, as well as their dimensional units. Note that the components inthe mechanical model are in acoustic units. kC is the coupling spring thatrepresents the longitudinal coupling, which is represented in the circuitmodel by two VCVSs and a coupling capacitor. Although the unit of theVCVS is Pa, the gain of VCVSs is dimensionless.
Acoustic Circuit Unit
P: pressure v: voltage PaV: volume velocity i: current M3/sm: mass LBM: inductor kg/m4
k: spring 1/CBM: capacitor kg/ !m4 s2"b: damper RBM: resistor kg/ !m4 s"kC: coupling spring EB: VCVS Pa
EF: VCVS Pa1/CC: capacitor kg/ !m4 s2"
400 J. Acoust. Soc. Am., Vol. 119, No. 1, January 2006 Chen et al.: A hydro-mechanical biomimetic cochlea
piezomembrane shows a response that is similar to the dis-placement signal. A spike in the electrical output at about 1ms is due to electrical coupling directly from the driver sig-nal to the piezo-output to the measurement amplifier. Thisspike signal was manually removed before calculating theelectrical output spectrum. Figure 10!c" shows the sensitivityspectrum of the piezo-output. The sensitivity is about30 mV/!m at 2 kHz, where the beam vibration is at itsmaximum.
IV. COMPARISIONS OF MODELING ANDEXPERIMENTAL RESULTS
A. ABM
The ABM model #Fig. 5!b"$ was used to simulate theABM response. An ac analysis was used to generate thespectral map of the beam responses. An ac voltage sourcewas applied to each beam section, simulating a unit pressureapplied to the ABM. The current on each beam section,which represents the volume velocity of the beam, wasscaled by the area of the beam to obtain the linear velocity.
In Figs. 11!a" and 11!b", the beam response from the simu-lation, Fig. 11!b", is compared with the calculated beam fre-quency response from the measured data, Fig. 11!a". Bothfigures exhibit a wide arching bright band from about 3 to 12kHz, which is called the major band and represents the beamresonance. Orderly patterned, high-frequency ripples at fre-quencies above the major band are due to the longitudinalcoupling through the membrane between beams.
In the model, the longitudinal tension Tx on the ABMmembrane substrate determines the degree of the longitudi-nal coupling. The modeling study shows that a high Tx on theABM results in the high-frequency ripples in the frequencymap. A smaller Tx will enhance the magnitude of resonantpeaks in the major band, with reduction of the response tothe right of the major band. Given a relatively limited rangeof geometries, fluids, and material properties, for which themodel is valid, Tx is a critical parameter.
B. ACochlea
Using the ACochlear model shown in Fig. 5, an analysiswas performed to calculate the ACochlear model frequency
FIG. 6. The velocity sensitivity spectra and the impulse response of a single beam !#32" as well as that of all 64 beams. !a" Magnitude response of the velocitysensitivity spectrum of Beam #32. This spectrum was calculated by scaling the Beam #32 velocity spectrum by the sound pressure spectrum, which waspreviously smoothed using a median filter to avoid introducing noise. In the test, time domain responses of the sound pressure and the beam response wererecorded and their spectra were calculated by taking the FFT of the time domain response. !b" Impulse response of Beam #32. This impulse response iscalculated by doing an inverse FFT of the complex spectrum, whose magnitude is shown in !a". !c" A 3-D map of the sensitivity spectrum of all 64 beams.The X axis is the frequency and the Y axis is the beam number. The magnitude of the velocity of a specific beam at a specific frequency is represented by thegray scale at the corresponding position in the map. Light is highest, dark is lowest. In the Y axis, Beam #1 is at the small end of the ABM and Beam #64is at the large end. !d" A 3-D map of the impulse response of the 64 beams. The X axis here is the time. NOTE: In !a" and !c", to get better resolution, dB isused as the unit, where 0 dB is equivalent to 1.0 mm/s /Pa.
J. Acoust. Soc. Am., Vol. 119, No. 1, January 2006 Chen et al.: A hydro-mechanical biomimetic cochlea 401
responses to compare with their experimental counterparts.The ratio of the linear velocity of the beam vibration to thepiezodriver velocity was calculated to establish the beamtransfer response. Figure 12 shows the spectral plots of fourequally spaced beams, comparing the measured and model-ing results. Figure 12!a" compares the magnitude responsesof the four beams; Fig. 12!b" compares their phase re-sponses.
V. DISCUSSION
A. ABM
The results presented in Sec. II A demonstrate the effectof coupling on the membrane substrate of the ABM. First,the spring coupling via the membrane between beams sup-ports a wave propagating along the ABM. In Fig. 6!d", theleft edge of the second triangular region changes from 0.9 msat Beam #64 to about 1.8 ms at Beam #1. This indicates awave traveling from the large end to the small end, becausethe wave is a result of the spring coupling due to the mem-brane substrate rather than due to a mass coupling. Second,the spring coupling also contributes to the rippling appear-ance of the beam vibration spectra, as shown in Fig. 6!c".
The modeling results shown in Fig. 11!b" demonstrate that alarger coupling will produce larger ripples in the spectra. Themeasurement results in Fig. 7 also support this conclusion byshowing that removing the coupling can eliminate the rip-pling.
In Fig. 7!b", the gray-scale spectral map demonstratesthe frequency selectivity of the ABM. The resonant fre-quency of the beams does not change smoothly with beamnumber. This is most likely due to a nonmonotonic tensionalong the beams. As discussed in the single-beam measure-ment, the tension in the lengthwise direction of the beamcontributes to the beam stiffness. The fabrication process,such as Cu deposition and prestretching the membrane dur-ing the assembling of ABM, could introduce nonmonotonictension on beams. The laser cutting may also result in anonmonotonic change in the pretension on the beam. Thischange of the pretension will result in a nonmonotonicchange in the beam stiffness, and thus affect the expected,monotonic change in resonant frequency of the beam.
B. Single beam
In Sec. II B, we demonstrated the existence of vibra-tional modes of a single beam. The relationship of the modal
FIG. 7. Measured results on the beams of a 32-beam ABM with cutsthrough the membrane between beams. !a" The velocity sensitivity spectrumof Beam #16. !b" A three-dimensional map of the beam sensitivity spectrum.The peaks at about 2.8 and 10 kHz in Fig. 7 !a" are the first and third modeof the beam vibration, respectively. Correspondingly, there are two brightbands in the gray-scale map in Fig. 7 !b". A dB scale is used here, and 0 dBcorresponds to 1 mm/s /Pa.
FIG. 8. The velocity sensitivity spectrum of a beam on the 32-beam ABMwith cuts through the membrane. !a" Velocity sensitivity spectrum at a lo-cation 1.8 mm from the end of the beam. This is about one-quarter thelength of the beam. !b" A 3-D spectral map. The Y axis marks the positionsalong the lengthwise direction of the beam. Corresponding to the peaksshown in !a", this map demonstrates the first mode with a long light line at1.73 kHz, the third mode with three light spots at 6.38 kHz, and the fifthmode with five light spots at 13.7 kHz. The second mode—at 3.79 kHz—can be discerned if one looks for two light, vertical lines at that frequency.The fourth mode is not discernible from Fig. 10!b".
402 J. Acoust. Soc. Am., Vol. 119, No. 1, January 2006 Chen et al.: A hydro-mechanical biomimetic cochlea
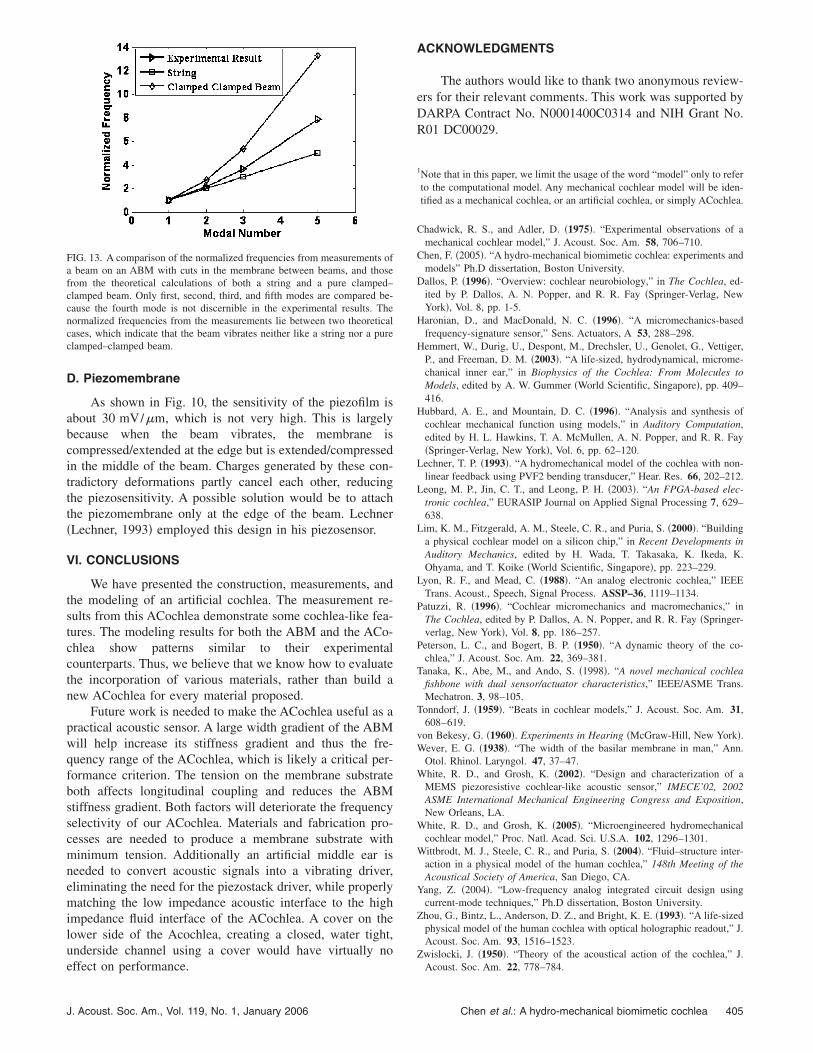
frequencies can be used to ascertain the behavior of the beam!von Bekesy, 1960". Haronian !Haronian and MacDonald,1996" indicated that the beam in their MEM-FSS behaveslike a string instead of an expected clamped–clamped beam.Here we compare the modal frequencies from experimentalresults with those estimated from the theory for both a stringand a pure clamped–clamped beam. For easy comparison,we normalize the higher frequencies using the first modefrequency. From Fig. 8, we note the frequencies of the first,second, third, and fifth modes to be 1.73, 3.79, 6.38, and 13.7kHz. The normalized frequencies are 1.0, 2.69, 3.69, and7.92. For a string, the higher mode frequencies are integer
multiples of the first mode, so the corresponding normalizedfrequencies are 1.0, 2.0, 3.0, and 5.0. For a pure clamped–clamped beam, they are 1.0, 2.75, 5.40, and 13.3. Figure 13plots the normalized frequencies in these three cases. Thus,the beam behavior is somewhere between a string and aclamped–clamped beam. This behavior of the beam is prima-rily due to the pretension on the beam, Ty.
It is well known that the stiffness of a pure clamped–clamped beam is inversely proportional to the cube of itslength. However, the stiffness of a string is inversely propor-tional only to its length. For the ABM with the same widthgradient, a string-like beam array will result in a muchsmaller stiffness gradient than a pure beam array. The string-like feature of the beam reduces the ABM stiffness gradient,which reduces the frequency range of the ACochlea madeusing this ABM.
FIG. 9. Displacement measured on beams along the ACochlea made upusing the ABM with cuts in the membrane between beams. !a" Time domainresponse. !b" Transfer function: Magnitude of the ratio of the beam displace-ment spectrum and the driver displacement spectrum. This high impedanceof the driver results in negligible changes on its response after loading withthe ACochlea. The frequency where the value of the magnitude response isabout −20 dB is defined as the cutoff frequency of that beam. Those fre-quencies are 2.3, 2.0, and 1.8 kHz for Beams #6, #16, and #26. In the figure,we also marked the slope of the high-frequency rolloff of the response. Theresponse of Beam #16 has a slope of 60 dB/octave. !c" The phase responseof the ratio. Phase plots from Beam #6, Beam #16, and Beam #26 show asteady increasing delay until the signal is lost in noise.
FIG. 10. The impulse response of a beam on an ACochlea. !a" Displacementoutput. !b" Electrical output. !c" Spectrum of the piezoresponse. This wascalculated by scaling the piezoelectric output spectrum by the beam dis-placement spectrum.
J. Acoust. Soc. Am., Vol. 119, No. 1, January 2006 Chen et al.: A hydro-mechanical biomimetic cochlea 403

C. ACochlea
The experimental results from our ACochlea, as shownin Fig. 9, demonstrate clear traveling wave features. The timedomain responses in Fig. 9!a" show the steadily increasingdelay from Beam #6 to #26. The delay is also demonstratedin Fig. 9!c" by the increasing phase lag from Beam #6 to#26. The time domain response in Fig. 9!a" demonstrates thewidening of the period of the oscillation. Correspondingly,the magnitude response in Fig. 9!b" shows a progressivelydecreasing cutoff frequency, viz. from about 2.3 kHz atBeam #6, to about 2.0 kHz at Beam #16, and to about 1.8kHz at Beam #26. This steady decrease of the roll-off fre-quency as a function of distance along its length demon-strates the tonotopic feature of the ACochlea.
In Fig. 9!b", the magnitude responses show high-frequency rolloffs of 67, 60, and 48 dB/octave for Beams#6, 16, and 26, respectively. The spectra also show a shallowslope in the low-frequency range. These features, a shallowslope in the low-frequency range and much steeper slope atthe high-frequency end, are also features of cochlear re-sponses.
Figure 9!b" shows a small cutoff frequency range fromBeam #6 to Beam #26. Two reasons mainly account for this
narrow frequency range. The first reason is the small stiff-ness gradient on the ABM. In our ABM, the large end is onlytwice as wide as the small end, compared, for example, toabout six times in the human BM !Wever, 1938". This smallwidth gradient, as well as the lack of a thickness gradient inour ABM, results in a much smaller stiffness gradient thanthat in the human cochlea. Additionally, the presence of thepretension on the beam, Ty, which results in a string-likebehavior on beams, also results in the reduction of the stiff-ness gradient along the ABM, as discussed in Sec. IV B. Thesecond reason is the coupling due to the residue from themembrane cutting. We have observed residue that bridges thecuts between beams !Chen, 2005". Simulations on the ACo-chlear model show that 1% of the original longitudinal ten-sion on the membrane significantly reduces the frequencyrange of the ABM.
Figure 12 shows a good match between the measuredand modeling results. Also, they both show ripples in thelow-frequency range, which are due to reflections at the endof both the ACochlea and its model. Our ACochlear model isa vetted representation of our Acochlea.
FIG. 11. A comparison of the velocitysensitivity !unit: dB re 1.0 mm/s /Pa"spectra of the 64-beam ABM betweenthe measured and modeled results. !a"Spectral map of the measured result.!b" Spectral map from the modelingresult. The spectra were calculated us-ing the ABM circuit model, as shownin Figure 5!b". In the simulation,model parameters were adjusted awayfrom their theoretical values to pro-duce the best match to the experimen-tal results.
FIG. 12. A comparison of the transferfunctions of the ACochlear model withthe measured transfer functions fromthe ACochlea. The solid lines repre-sent the modeling results and thedashed lines represent the measuredresults. !a" Transfer function: Magni-tude in dB of the displacement ratio ofthe beam vibration to the driver dis-placement. !b" Phase response of theratio. The phase plots of Beams #10,#15, and #20 show irregularity at fre-quencies above 2 kHz. This is due tothe unwrapping process of the phaseresponse. In that frequency range, theresponses are near the noise level, asshown in the magnitude plots.
404 J. Acoust. Soc. Am., Vol. 119, No. 1, January 2006 Chen et al.: A hydro-mechanical biomimetic cochlea
D. Piezomembrane
As shown in Fig. 10, the sensitivity of the piezofilm isabout 30 mV/!m, which is not very high. This is largelybecause when the beam vibrates, the membrane iscompressed/extended at the edge but is extended/compressedin the middle of the beam. Charges generated by these con-tradictory deformations partly cancel each other, reducingthe piezosensitivity. A possible solution would be to attachthe piezomembrane only at the edge of the beam. Lechner!Lechner, 1993" employed this design in his piezosensor.
VI. CONCLUSIONS
We have presented the construction, measurements, andthe modeling of an artificial cochlea. The measurement re-sults from this ACochlea demonstrate some cochlea-like fea-tures. The modeling results for both the ABM and the ACo-chlea show patterns similar to their experimentalcounterparts. Thus, we believe that we know how to evaluatethe incorporation of various materials, rather than build anew ACochlea for every material proposed.
Future work is needed to make the ACochlea useful as apractical acoustic sensor. A large width gradient of the ABMwill help increase its stiffness gradient and thus the fre-quency range of the ACochlea, which is likely a critical per-formance criterion. The tension on the membrane substrateboth affects longitudinal coupling and reduces the ABMstiffness gradient. Both factors will deteriorate the frequencyselectivity of our ACochlea. Materials and fabrication pro-cesses are needed to produce a membrane substrate withminimum tension. Additionally an artificial middle ear isneeded to convert acoustic signals into a vibrating driver,eliminating the need for the piezostack driver, while properlymatching the low impedance acoustic interface to the highimpedance fluid interface of the ACochlea. A cover on thelower side of the Acochlea, creating a closed, water tight,underside channel using a cover would have virtually noeffect on performance.
ACKNOWLEDGMENTS
The authors would like to thank two anonymous review-ers for their relevant comments. This work was supported byDARPA Contract No. N0001400C0314 and NIH Grant No.R01 DC00029.
1Note that in this paper, we limit the usage of the word “model” only to referto the computational model. Any mechanical cochlear model will be iden-tified as a mechanical cochlea, or an artificial cochlea, or simply ACochlea.
Chadwick, R. S., and Adler, D. !1975". “Experimental observations of amechanical cochlear model,” J. Acoust. Soc. Am. 58, 706–710.
Chen, F. !2005". “A hydro-mechanical biomimetic cochlea: experiments andmodels” Ph.D dissertation, Boston University.
Dallos, P. !1996". “Overview: cochlear neurobiology,” in The Cochlea, ed-ited by P. Dallos, A. N. Popper, and R. R. Fay !Springer-Verlag, NewYork", Vol. 8, pp. 1-5.
Haronian, D., and MacDonald, N. C. !1996". “A micromechanics-basedfrequency-signature sensor,” Sens. Actuators, A 53, 288–298.
Hemmert, W., Durig, U., Despont, M., Drechsler, U., Genolet, G., Vettiger,P., and Freeman, D. M. !2003". “A life-sized, hydrodynamical, microme-chanical inner ear,” in Biophysics of the Cochlea: From Molecules toModels, edited by A. W. Gummer !World Scientific, Singapore", pp. 409–416.
Hubbard, A. E., and Mountain, D. C. !1996". “Analysis and synthesis ofcochlear mechanical function using models,” in Auditory Computation,edited by H. L. Hawkins, T. A. McMullen, A. N. Popper, and R. R. Fay!Springer-Verlag, New York", Vol. 6, pp. 62–120.
Lechner, T. P. !1993". “A hydromechanical model of the cochlea with non-linear feedback using PVF2 bending transducer,” Hear. Res. 66, 202–212.
Leong, M. P., Jin, C. T., and Leong, P. H. !2003". “An FPGA-based elec-tronic cochlea,” EURASIP Journal on Applied Signal Processing 7, 629–638.
Lim, K. M., Fitzgerald, A. M., Steele, C. R., and Puria, S. !2000". “Buildinga physical cochlear model on a silicon chip,” in Recent Developments inAuditory Mechanics, edited by H. Wada, T. Takasaka, K. Ikeda, K.Ohyama, and T. Koike !World Scientific, Singapore", pp. 223–229.
Lyon, R. F., and Mead, C. !1988". “An analog electronic cochlea,” IEEETrans. Acoust., Speech, Signal Process. ASSP–36, 1119–1134.
Patuzzi, R. !1996". “Cochlear micromechanics and macromechanics,” inThe Cochlea, edited by P. Dallos, A. N. Popper, and R. R. Fay !Springer-verlag, New York", Vol. 8, pp. 186–257.
Peterson, L. C., and Bogert, B. P. !1950". “A dynamic theory of the co-chlea,” J. Acoust. Soc. Am. 22, 369–381.
Tanaka, K., Abe, M., and Ando, S. !1998". “A novel mechanical cochleafishbone with dual sensor/actuator characteristics,” IEEE/ASME Trans.Mechatron. 3, 98–105.
Tonndorf, J. !1959". “Beats in cochlear models,” J. Acoust. Soc. Am. 31,608–619.
von Bekesy, G. !1960". Experiments in Hearing !McGraw-Hill, New York".Wever, E. G. !1938". “The width of the basilar membrane in man,” Ann.
Otol. Rhinol. Laryngol. 47, 37–47.White, R. D., and Grosh, K. !2002". “Design and characterization of a
MEMS piezoresistive cochlear-like acoustic sensor,” IMECE’02, 2002ASME International Mechanical Engineering Congress and Exposition,New Orleans, LA.
White, R. D., and Grosh, K. !2005". “Microengineered hydromechanicalcochlear model,” Proc. Natl. Acad. Sci. U.S.A. 102, 1296–1301.
Wittbrodt, M. J., Steele, C. R., and Puria, S. !2004". “Fluid–structure inter-action in a physical model of the human cochlea,” 148th Meeting of theAcoustical Society of America, San Diego, CA.
Yang, Z. !2004". “Low-frequency analog integrated circuit design usingcurrent-mode techniques,” Ph.D dissertation, Boston University.
Zhou, G., Bintz, L., Anderson, D. Z., and Bright, K. E. !1993". “A life-sizedphysical model of the human cochlea with optical holographic readout,” J.Acoust. Soc. Am. 93, 1516–1523.
Zwislocki, J. !1950". “Theory of the acoustical action of the cochlea,” J.Acoust. Soc. Am. 22, 778–784.
FIG. 13. A comparison of the normalized frequencies from measurements ofa beam on an ABM with cuts in the membrane between beams, and thosefrom the theoretical calculations of both a string and a pure clamped–clamped beam. Only first, second, third, and fifth modes are compared be-cause the fourth mode is not discernible in the experimental results. Thenormalized frequencies from the measurements lie between two theoreticalcases, which indicate that the beam vibrates neither like a string nor a pureclamped–clamped beam.
J. Acoust. Soc. Am., Vol. 119, No. 1, January 2006 Chen et al.: A hydro-mechanical biomimetic cochlea 405