a journal of student-generated ideas from across the roosevelt … · 2019-04-02 · in north...
TRANSCRIPT
| CREATIVE COMMONS COPYRIGHT 2018 | ROOSEVELTINSTITUTE.ORG | 1
A Journal of Student-Generated Ideas from Across the Roosevelt Network
2019

2 | CREATIVE COMMONS COPYRIGHT 2018 | ROOSEVELTINSTITUTE.ORG |
Policy Coordinators CLARA HARTERADITYA KRISHNASWAMYADEN MUHAMMAD
Roosevelt StaffKENDRA BOZARTHSTACY BULLARDJESS FORDENJULIETTE KANG STABLESKIKRISTINA KARLSSON
Network StaffKATIE KIRCHNER, NATIONAL DIRECTOR
AUSTIN SHIRLEYMANON STEEL MATTHEW WALSH
RAKEEN MABUD KATY MILANIJENNY SHERMANVICTORIA STREKER
NICOLE ANNUNZIATA FERNANDA BORGES NOGUEIRA EAMON ROSS
ANNA N. SMITH JADE WILENCHIK
Roosevelt AlumniZACHARY AGUSHSAUMYA BOLLAMMIGUEL BOULAIN GALAZASHLEY CHAPPOBRIAN CLEMETEOLIVIA COHNRORY DOEHRINGJOE EASTMANJULIA EDDYNICOLE FELMUSGRANT FEROWICHLAWRENCE E. FRIEDSAMANTHA GARZILLOMEHAK GUPTAKEVIN HILKEJAMES HOBBSNELSON IGUNMABRIAN JENCUNASZACH KOMESANDREW LINDSAYAMY LITTLETON
HANNAH LOVEKIMBERLY MANRIQUEZTARA MARLOWEDAVID MENI ROSS MITTIGACHIARA S. MOORESYEDA SUNDUS MUJAHIDSABA MUNDLAYDAVID PERALMANJOHN PRESTON FORDCARLEY R. PRZYSTACLILY ROBERTSDOMINIC RUSSELSAMEER SANT GARRETT SHORDAWID SKALKOWSKIKEVIN SUYOOWEN URECHJOHN WEBERADAM WOODY CATHERINE ZINNEL
| CREATIVE COMMONS COPYRIGHT 2018 | ROOSEVELTINSTITUTE.ORG | 3
Who We AreThe Roosevelt Network trains, develops, and supports emerging progressive policymakers, researchers, and advocates, focusing on communities historically denied political power. With locations on campuses and in cities in nearly 40 US states, the network is founded on the principle that changing who writes the rules can help fulfill the promise of American democracy and build true public power. The network supports student-led, scalable policy campaigns that fight for the equitable provision, distribution, and accessibility of public goods at the campus, local, and state levels. In addition to its student-led activities, the organization leverages the power of its alumni network—which includes public officials, lawyers, teachers, nonprofit executives, and researchers—to expand opportunities for the next generation of policy leaders. A program of the Roosevelt Institute, the network operates alongside leading economists and political scientists to bring the ideals of Franklin and Eleanor Roosevelt into the 21st century.
What You’re HoldingNow in its 11th edition, the Roosevelt Network’s 10 Ideas journal is a testament to the importance of changing who writes the rules. The 10 student-developed policy proposals in this journal are visionary but also scalable. They chart bold new ways to deploy public power for the public good, spanning issue areas and geographies. Each proposal is the product of at least six months of work: identifying a problem, conducting formal research, and organizing and collaborating with local organizations and partners, plus an intensive editing and review period that includes feedback from Roosevelt staff and alumni. Past policies developed through this program have led to a multi-chapter partnership with the Discovery for Justice coalition to address wrongful convictions in New York, expanded access to free menstrual hygiene products at Connecticut College, and partnerships with Chicago neighborhood alliances to combat gentrification.
How You Can ParticipateTo learn more about our work and how to get involved, visit our website at www.rooseveltinstitute.org or follow us on Twitter at @VivaRoosevelt. Together, we can change who writes the rules and help fulfill the ideals of American democracy, revive our economy, and build true public power. Thank you for reading and supporting the work of Roosevelters.
Dear Readers, President Franklin D. Roosevelt once said that “government is ourselves.” Throughout American democracy, however, far too many communities have been denied political power and have seen government power deployed against them. This reality has been made clear at the federal, state, and local levels through intensified anti-immigrant policies, attacks on reproductive care for women, a tax code that benefits the wealthy few, and suppression of Black and Native American votes.
By training the next generation of policymakers, researchers, and activists and supporting the implementation of their ideas, Roosevelt is changing who writes the rules. In doing so, we believe that we can help fulfill the ideals of American democracy, revive our economy, and build true public power.
The student ideas published in this journal tackle some of today’s most pressing issues with bold, local solutions that were built collaboratively with the communities and organizations directly impacted by the issues. This year’s 10 Ideas push for sustainable energy production in Michigan, the expansion of affordable housing access in North Carolina, the inclusion of refugee voices in Cincinnati’s government, and the confrontation of racism in the Detroit public school system. The students leading these projects recognize that to redefine the American economy and our democracy, policy solutions must be robust and inclusive, and, most importantly, put people and communities first.
I hope that after reading 10 Ideas 2019 you are inspired by the ideas that our students have for bringing the ideals of Franklin and Eleanor Roosevelt into the 21st century.
Onward,
Katie Kirchner
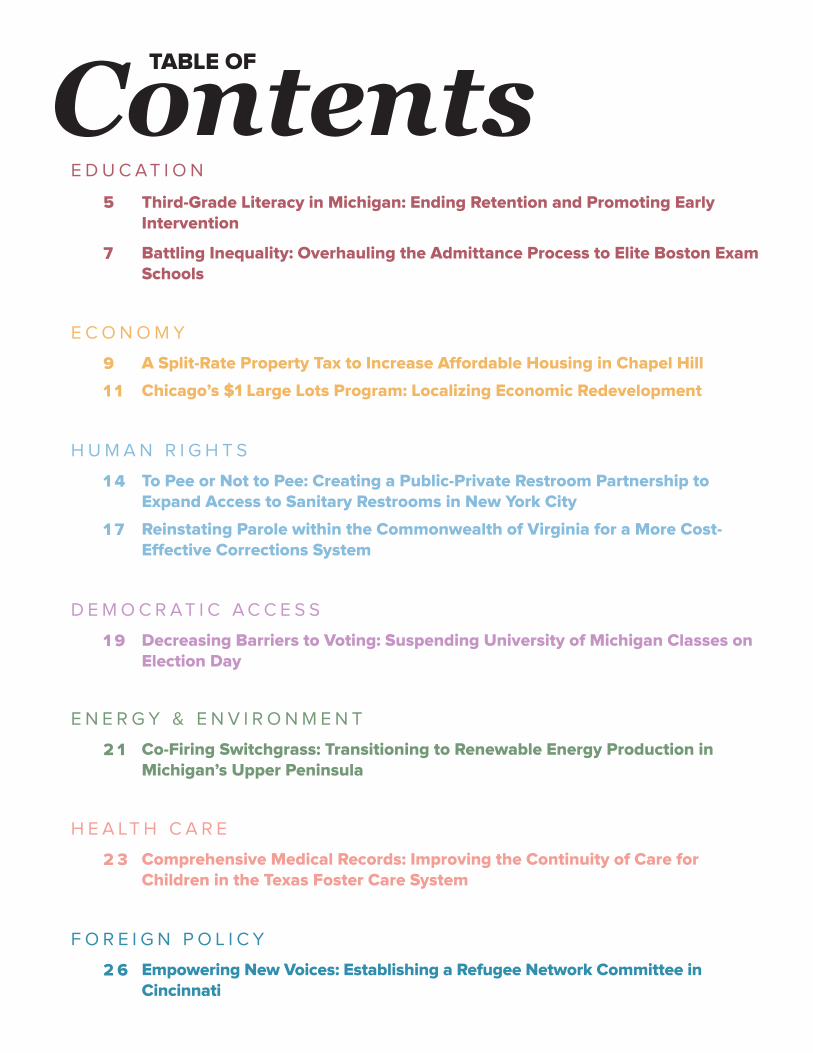
TABLE OFContentsE D U C A T I O N
5 Third-Grade Literacy in Michigan: Ending Retention and Promoting Early Intervention
7 Battling Inequality: Overhauling the Admittance Process to Elite Boston Exam Schools
9 A Split-Rate Property Tax to Increase Affordable Housing in Chapel Hill
E C O N O M Y
1 1 Chicago’s $1 Large Lots Program: Localizing Economic Redevelopment
H U M A N R I G H T S
1 4 To Pee or Not to Pee: Creating a Public-Private Restroom Partnership to Expand Access to Sanitary Restrooms in New York City
1 7 Reinstating Parole within the Commonwealth of Virginia for a More Cost-Effective Corrections System
H E A LT H C A R E
2 3 Comprehensive Medical Records: Improving the Continuity of Care for Children in the Texas Foster Care System
D E M O C R A T I C A C C E S S
1 9 Decreasing Barriers to Voting: Suspending University of Michigan Classes on Election Day
E N E R G Y & E N V I R O N M E N T
2 1 Co-Firing Switchgrass: Transitioning to Renewable Energy Production in Michigan’s Upper Peninsula
F O R E I G N P O L I C Y
2 6 Empowering New Voices: Establishing a Refugee Network Committee in Cincinnati
Third-Grade Literacy in Michigan:
By Yosef Gross, Ariella Meltzer, and Soraya Zrikem
ED
UC
AT
ION
THESIS:
To improve long-term outcomes for young students, Michigan school districts should grant retention exemptions to students who do not test proficient on the 3rd grade M-STEP literacy exam and implement early intervention techniques for reading, starting in kindergarten.
BACKGROUND & ANALYSIS
In 2015, Michigan placed 41st in the country in 4th grade reading and improved only slightly, to 36th, in 2017 (National Association of Educational Progress 2017). In an attempt to improve reading scores, Michigan legislators passed a law in 2016 that requires schools to assess students’ reading in kindergarten through 3rd grade. This law mandates that schools, beginning in the 2019–2020 school year, hold back and develop personal study programs for any 3rd grade student who does not achieve a “proficient” score on the literacy portion of the M-STEP, the test measuring student progress against state standards (Bashore-Berg 2018). Importantly, the law does not detail how funds will be allocated to schools for these study programs.
In Michigan, there is a huge disparity in reading proficiency among racial groups: 80 percent of Black students and 67 percent of Hispanic students failed to meet full proficiency, compared to the 47 percent of white students and 35 percent of Asian students (Michigan Department of Education 2018). Furthermore, economically advantaged students are twice as likely to be literacy proficient in 3rd grade, compared to students who are economically disadvantaged (Michigan Department of Education 2018). It is these children—low-income, Black, and Hispanic students—who will be most affected by the state’s retention policies. Essentially, the new law penalizes students for the failure of the state’s education system. Eight students from the Detroit Public Schools system, where only 9.9 percent of 3rd graders were proficient in reading in 2017, recently sued the state, alleging that their education is so poor that it is as if they are not attending school at all (Wong 2018). By requiring retention, Michigan is punishing students for the school system’s shortcomings.
TALKING POINTS
• Retaining students does not help them catch up with their classmates academically; in fact, students who are forced to repeat a year are more likely to drop out of school (US Department of Education 1999).
• By implementing early-intervention strategies that offer individualized assistance for students struggling to achieve reading proficiency, schools in Michigan can ensure that they are not forced to retain students in the 3rd grade.
• Kindergarteners and 1st graders are more likely than older students to put forth effort if they do not achieve positive outcomes in school, making it important to implement literacy intervention for younger children (Joseph 2017).
Roosevelt @ University of Michigan
THE POLICY IDEA
Given the harmful effects of retention on the academic and social development of students and the disproportionate number of minority and low-income students who would be retained under the new law, superintendents in Michigan should issue exemptions to students as allowed under Subsection 3 of the law. To improve literacy rates, schools should invest in additional support for students with reading deficiencies by providing literacy tutors and individualized programs, starting in kindergarten, using Title I funds already appropriated to the school district for that purpose. Given that the law does not increase funding for schools, the state may need to allocate more money to districts to support these programs.
5 | CREATIVE COMMONS COPYRIGHT 2019 | ROOSEVELTINSTITUTE.ORG |
Ending Retention and Promoting Early Intervention
POLICY ANALYSIS
ED
UC
AT
ION
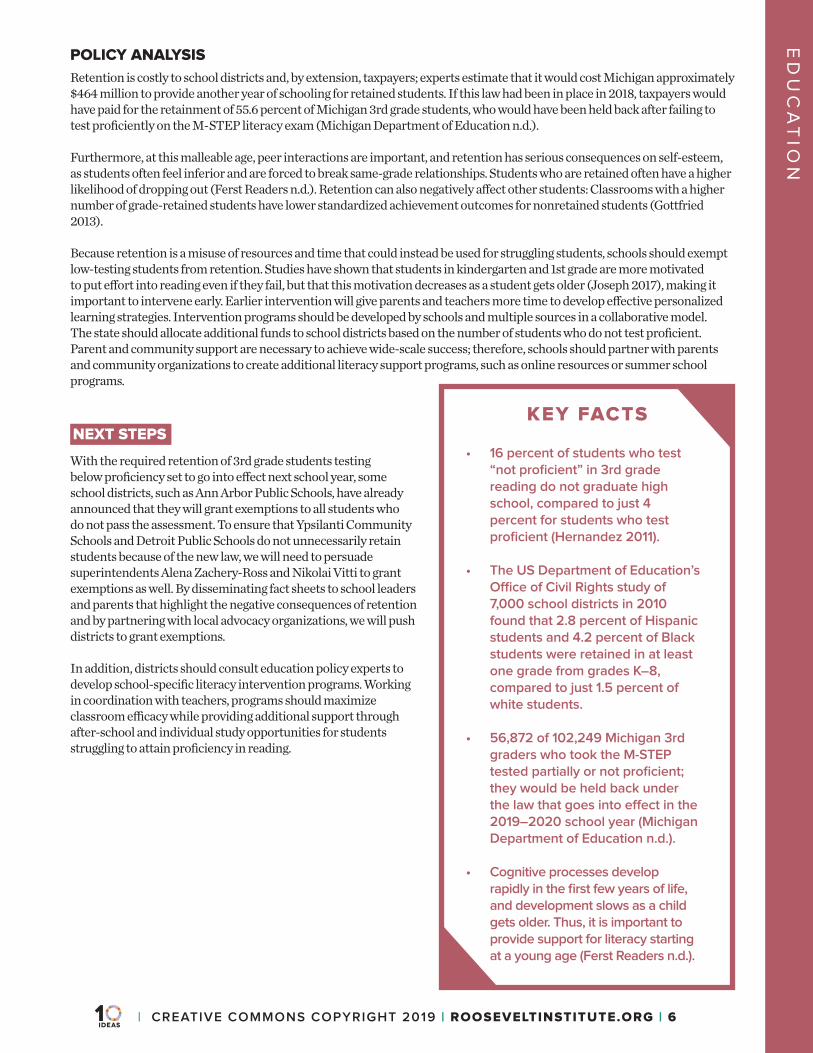
NEXT STEPS• 16 percent of students who test
“not proficient” in 3rd grade reading do not graduate high school, compared to just 4 percent for students who test proficient (Hernandez 2011).
• The US Department of Education’s Office of Civil Rights study of 7,000 school districts in 2010 found that 2.8 percent of Hispanic students and 4.2 percent of Black students were retained in at least one grade from grades K–8, compared to just 1.5 percent of white students.
• 56,872 of 102,249 Michigan 3rd graders who took the M-STEP tested partially or not proficient; they would be held back under the law that goes into effect in the 2019–2020 school year (Michigan Department of Education n.d.).
• Cognitive processes develop rapidly in the first few years of life, and development slows as a child gets older. Thus, it is important to provide support for literacy starting at a young age (Ferst Readers n.d.).
KEY FACTS
Retention is costly to school districts and, by extension, taxpayers; experts estimate that it would cost Michigan approximately $464 million to provide another year of schooling for retained students. If this law had been in place in 2018, taxpayers would have paid for the retainment of 55.6 percent of Michigan 3rd grade students, who would have been held back after failing to test proficiently on the M-STEP literacy exam (Michigan Department of Education n.d.).
Furthermore, at this malleable age, peer interactions are important, and retention has serious consequences on self-esteem, as students often feel inferior and are forced to break same-grade relationships. Students who are retained often have a higher likelihood of dropping out (Ferst Readers n.d.). Retention can also negatively affect other students: Classrooms with a higher number of grade-retained students have lower standardized achievement outcomes for nonretained students (Gottfried 2013).
Because retention is a misuse of resources and time that could instead be used for struggling students, schools should exempt low-testing students from retention. Studies have shown that students in kindergarten and 1st grade are more motivated to put effort into reading even if they fail, but that this motivation decreases as a student gets older (Joseph 2017), making it important to intervene early. Earlier intervention will give parents and teachers more time to develop effective personalized learning strategies. Intervention programs should be developed by schools and multiple sources in a collaborative model. The state should allocate additional funds to school districts based on the number of students who do not test proficient. Parent and community support are necessary to achieve wide-scale success; therefore, schools should partner with parents and community organizations to create additional literacy support programs, such as online resources or summer school programs.
With the required retention of 3rd grade students testing below proficiency set to go into effect next school year, some school districts, such as Ann Arbor Public Schools, have already announced that they will grant exemptions to all students who do not pass the assessment. To ensure that Ypsilanti Community Schools and Detroit Public Schools do not unnecessarily retain students because of the new law, we will need to persuade superintendents Alena Zachery-Ross and Nikolai Vitti to grant exemptions as well. By disseminating fact sheets to school leaders and parents that highlight the negative consequences of retention and by partnering with local advocacy organizations, we will push districts to grant exemptions.
In addition, districts should consult education policy experts to develop school-specific literacy intervention programs. Working in coordination with teachers, programs should maximize classroom efficacy while providing additional support through after-school and individual study opportunities for students struggling to attain proficiency in reading.
| CREATIVE COMMONS COPYRIGHT 2019 | ROOSEVELTINSTITUTE.ORG | 6

7 | CREATIVE COMMONS COPYRIGHT 2019 | ROOSEVELTINSTITUTE.ORG |
Battling Education Inequity:
By Meghan Camello
ED
UC
AT
ION
THESIS
To diversify the public exam schools in Boston, the Boston Public Schools system should redesign the admissions process by changing from the optional Independent School Entrance Examination (ISSE), given on a Saturday, to the Massachusetts Comprehensive Assessment System (MCAS), an exam that all students take in the 5th grade.
BACKGROUND & ANALYSIS
When Boston started the first public high school, in 1821, it established a legacy as the birthplace of American public education (Jenkins 1881). But today, the city’s three exam schools reinforce a hierarchical system of school inequality through an inequitable admissions process, challenging the very notion of public education. Boston’s exam schools are among the best-performing in the district. However, the exam schools’ student body does not accurately reflect the diversity of BPS (Boston Public Schools) as a whole. Nearly 75 percent of BPS students are Black or Hispanic, yet they represent only 40 percent of enrollment at the three exam schools and only 20 percent at the most elite, Boston Latin School (BLS) (Greenhouse 2018). Despite making up nearly 32 percent of district-wide enrollment, Black students comprised only 11 percent of BLS invitees for the 2018–2019 school year (ACLU Massachusetts 2017). Furthermore, majority-white neighborhoods have exam school admission rates above 55 percent, while majority-Black neighborhoods have admission rates below 50 percent (ACLU Massachusetts 2017).
Admittance to Boston’s exam schools is determined in equal parts by ISEE score and GPA (Massachusetts Department of Elementary and Secondary Education 2018). The ISEE is an optional exam that takes place on a Saturday in November, and parents have to register children more than a month in advance, raising concerns over equal access. Furthermore, a GPA fails to adequately reflect student intelligence or potential, and instead places value on attendance and parents’ ability to support their children’s learning outside of school. The admissions criteria have not been altered since 1999, when race was dropped as an admissions factor after the Boston School Committee faced legal challenges from white families citing the constitutionality of affirmative action (Vazinis 2018). Just a short drive over the Charles River, which separates Boston from Cambridge, a similar affirmative action case has been broiling at Harvard University. A group called Students for Fair Admissions has accused Harvard of discriminating against Asian-American applicants (Jung 2018).
Boston Public Schools needs to acknowledge the systemic detriments that continue to impact students of color by following the lead of the New York City Department of Education, which has taken steps to equalize its exam school admissions process to better reflect the diversity of the district.
TALKING POINTS
• Testing students on material that isn’t taught in the public school curriculum caters to private school students and those who have the financial means to enroll in exam prep classes.
• Providing universal access to the admissions process ensures that every student has an equal opportunity to gain admission.
• There is a significantly more diverse population of the top performers on the mandatory state-administered Massachusetts Comprehensive Assessment System (MCAS) exam, as opposed to the optional Independent School Entrance Examination (ISEE).
Roosevelt @ Northeastern University
THE POLICY IDEATo diversify Boston’s exam schools, BPS should alter the admissions process by eliminating the GPA requirement and switching from the ISEE to the MCAS exam. Transitioning from the optional Saturday ISEE exam to the standard MCAS exam will increase the applicant pool, which will better reflect the demographics of the district. Furthermore, the BPS curriculum is aligned with the state’s MCAS test material, so students in public elementary schools will have a fundamental basis of understanding for topics covered on the test (Boston Public Schools n.d.).
Overhauling the Admissions Process for Elite Boston Exam Schools
| CREATIVE COMMONS COPYRIGHT 2019 | ROOSEVELTINSTITUTE.ORG | 8
POLICY ANALYSIS
ED
UC
AT
ION
NEXT STEPS
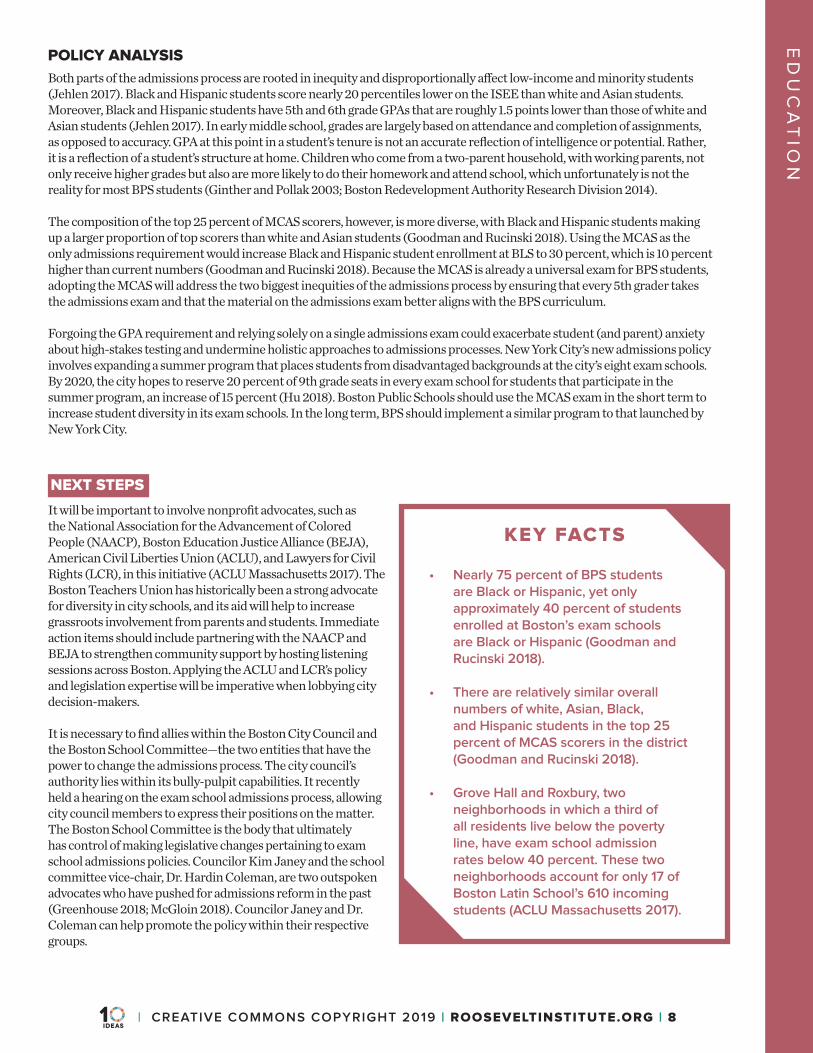
• Nearly 75 percent of BPS students are Black or Hispanic, yet only approximately 40 percent of students enrolled at Boston’s exam schools are Black or Hispanic (Goodman and Rucinski 2018).
• There are relatively similar overall numbers of white, Asian, Black, and Hispanic students in the top 25 percent of MCAS scorers in the district (Goodman and Rucinski 2018).
• Grove Hall and Roxbury, two neighborhoods in which a third of all residents live below the poverty line, have exam school admission rates below 40 percent. These two neighborhoods account for only 17 of Boston Latin School’s 610 incoming students (ACLU Massachusetts 2017).
KEY FACTS
Both parts of the admissions process are rooted in inequity and disproportionally affect low-income and minority students (Jehlen 2017). Black and Hispanic students score nearly 20 percentiles lower on the ISEE than white and Asian students. Moreover, Black and Hispanic students have 5th and 6th grade GPAs that are roughly 1.5 points lower than those of white and Asian students (Jehlen 2017). In early middle school, grades are largely based on attendance and completion of assignments, as opposed to accuracy. GPA at this point in a student’s tenure is not an accurate reflection of intelligence or potential. Rather, it is a reflection of a student’s structure at home. Children who come from a two-parent household, with working parents, not only receive higher grades but also are more likely to do their homework and attend school, which unfortunately is not the reality for most BPS students (Ginther and Pollak 2003; Boston Redevelopment Authority Research Division 2014).
The composition of the top 25 percent of MCAS scorers, however, is more diverse, with Black and Hispanic students making up a larger proportion of top scorers than white and Asian students (Goodman and Rucinski 2018). Using the MCAS as the only admissions requirement would increase Black and Hispanic student enrollment at BLS to 30 percent, which is 10 percent higher than current numbers (Goodman and Rucinski 2018). Because the MCAS is already a universal exam for BPS students, adopting the MCAS will address the two biggest inequities of the admissions process by ensuring that every 5th grader takes the admissions exam and that the material on the admissions exam better aligns with the BPS curriculum.
Forgoing the GPA requirement and relying solely on a single admissions exam could exacerbate student (and parent) anxiety about high-stakes testing and undermine holistic approaches to admissions processes. New York City’s new admissions policy involves expanding a summer program that places students from disadvantaged backgrounds at the city’s eight exam schools. By 2020, the city hopes to reserve 20 percent of 9th grade seats in every exam school for students that participate in the summer program, an increase of 15 percent (Hu 2018). Boston Public Schools should use the MCAS exam in the short term to increase student diversity in its exam schools. In the long term, BPS should implement a similar program to that launched by New York City.
It will be important to involve nonprofit advocates, such as the National Association for the Advancement of Colored People (NAACP), Boston Education Justice Alliance (BEJA), American Civil Liberties Union (ACLU), and Lawyers for Civil Rights (LCR), in this initiative (ACLU Massachusetts 2017). The Boston Teachers Union has historically been a strong advocate for diversity in city schools, and its aid will help to increase grassroots involvement from parents and students. Immediate action items should include partnering with the NAACP and BEJA to strengthen community support by hosting listening sessions across Boston. Applying the ACLU and LCR’s policy and legislation expertise will be imperative when lobbying city decision-makers.
It is necessary to find allies within the Boston City Council and the Boston School Committee—the two entities that have the power to change the admissions process. The city council’s authority lies within its bully-pulpit capabilities. It recently held a hearing on the exam school admissions process, allowing city council members to express their positions on the matter. The Boston School Committee is the body that ultimately has control of making legislative changes pertaining to exam school admissions policies. Councilor Kim Janey and the school committee vice-chair, Dr. Hardin Coleman, are two outspoken advocates who have pushed for admissions reform in the past (Greenhouse 2018; McGloin 2018). Councilor Janey and Dr. Coleman can help promote the policy within their respective groups.
9 | CREATIVE COMMONS COPYRIGHT 2019 | ROOSEVELTINSTITUTE.ORG |
EC
ON
OM
Y A Split-Rate Property Tax to Increase Affordable Housing in Chapel HillBy Megan Lambert, Liam Glen, Jack Deering, and Sergio Osnaya-Prieto
THESIS
Roosevelt @ University of North Carolina, Chapel Hill
To combat the growing lack of affordable housing, Chapel Hill should implement a split-rate property tax that would both encourage new development and raise funds for municipal affordable housing.
BACKGROUND & ANALYSIS
Chapel Hill, North Carolina, suffers from a serious shortage of affordable housing. According to the town’s 2018 fiscal year report, 52 percent of renters and 22 percent of homeowners spent more than 30 percent of their income on housing, and only 25 percent of housing units were affordable to households making less than 80 percent of the area median income (Chapel Hill Affordable Housing 2018). A study published by the Joint Center for Housing Studies of Harvard University affirms that “the 30-percent income standard is a widely used and accepted measure of the extent of housing affordability problems across the country” (Herbert, Hermann, and McCue 2018). These high housing costs disproportionately affect Black, Hispanic, and elderly residents of Chapel Hill because, on average, they fall into lower income brackets (Chapel Hill Affordable Housing 2018). Sixty-two percent of the area’s white population makes 80 percent or more of the AMI (average median income), whereas only 41 percent of the area’s Hispanic population and 42 percent of the area’s Black population make 80 percent or more of the AMI. This implies that minority groups pay a higher proportion of their income on housing (Orange County Affordable Housing Coalition 2018).
The supply of housing in the area clearly can’t accommodate the number of people who wish to live in Chapel Hill, leading to higher housing prices. The town’s main strategy to account for this market failure has been to build, maintain, and subsidize housing units rented to residents at an affordable price (Hartman 2018). In November 2018, Chapel Hill voters approved a $10 million bond with the purpose of building 400 new affordable housing units in the town and repairing 300 existing units. This is expected to improve the situation somewhat, but the housing shortage is still far from resolved (Grubb 2018). Political leaders in Chapel Hill understand the importance of addressing affordable housing and have encouraged local construction companies to designate 5 percent of new units in construction plans as affordable. The resources of local government, however, are limited: An estimated 40 percent of households in Orange County, where Chapel Hill is located, are eligible for income-based affordable housing, yet only 3 percent of area homes are permanently affordable (Orange County Affordable Housing Coalition 2018).
KEY FACTS
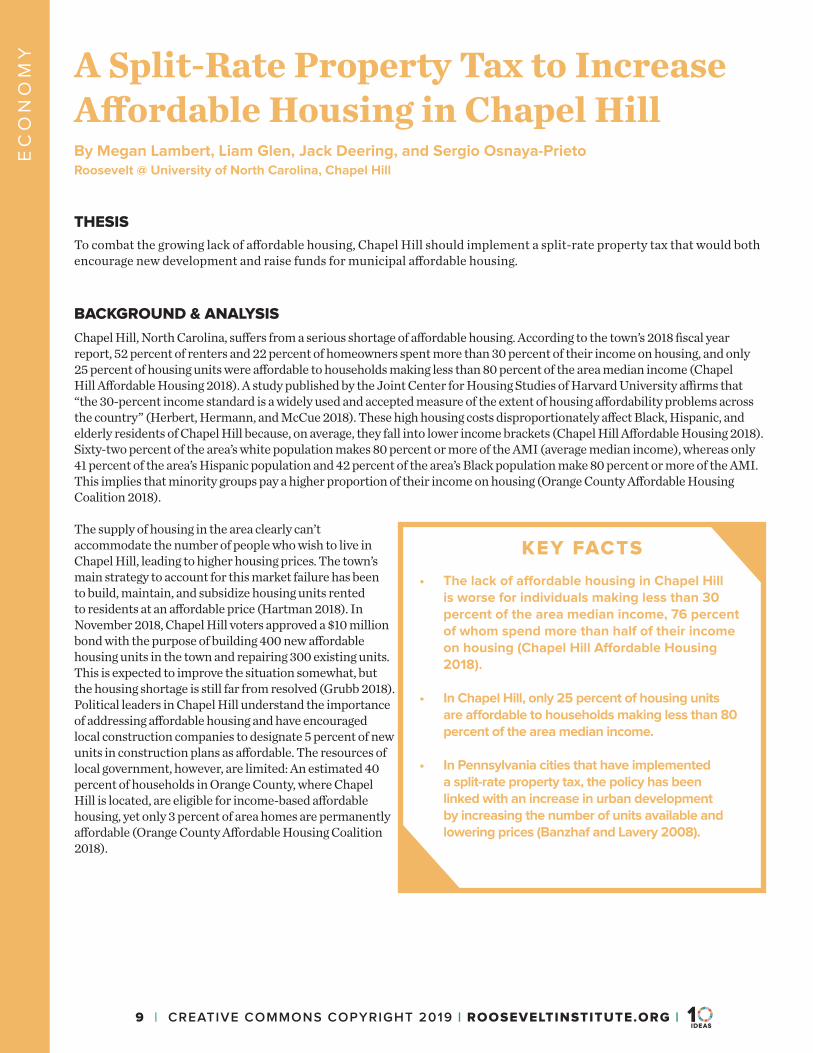
• The lack of affordable housing in Chapel Hill is worse for individuals making less than 30 percent of the area median income, 76 percent of whom spend more than half of their income on housing (Chapel Hill Affordable Housing 2018).
• In Chapel Hill, only 25 percent of housing units are affordable to households making less than 80 percent of the area median income.
• In Pennsylvania cities that have implemented a split-rate property tax, the policy has been linked with an increase in urban development by increasing the number of units available and lowering prices (Banzhaf and Lavery 2008).
TALKING POINTS
• Demand for affordable housing in Chapel Hill continues to increase, but the city’s current housing supply can’t meet that demand.
• The affordable-housing shortage is a complex issue that requires a mixture of market-based and government-led solutions. A split-rate property tax encompasses both of these strategies.
• A tax on land value is one of the most efficient sources of revenue, as it incentivizes developers to build more rental units, increasing rental revenue while increasing the supply of units (Cohen and Coughlin 2005).
| CREATIVE COMMONS COPYRIGHT 2019 | ROOSEVELTINSTITUTE.ORG | 10
EC
ON
OM
Y
THE POLICY IDEA
A split-rate property tax would separately tax the value of land and the developments built on that land. Because the tax burden on developments would be lower than in the current single-rate system, a split-rate property tax would encourage development of new properties in Chapel Hill. New development would increase the supply of housing, naturally suppressing prices. Meanwhile, the city would use revenue from the land-value tax to finance new affordable developments. This is a two-pronged approach that both incentivizes private development and funds public affordable housing.
POLICY ANALYSIS
The split-rate property tax has many benefits and few costs. Increasing the tax rate on the land value would raise revenue without distorting investment incentives for developers; despite a higher land-value tax, developers would be incentivized to invest in the land because the fixed amount of land presents opportunities to make a significant profit from building additional housing units. Furthermore, the burden of the land-value tax would fall entirely on landlords who could not shift the tax to renters because supply would be wholly determined by demand; developers would accept the market price rather than leave their units untenanted. If rents were to rise, it would be because the demand increased, meaning tenants were willing to pay more. A land-value tax, in itself, has no direct effect on tenants because it does not change the rent that tenants are willing to pay. Finally, decreasing the tax rate on developments on the land encourages developing more housing units on the land and discourages low-density urban sprawl (Dye and England 2010).
The split-rate tax would be beneficial for renters and homeowners, both of whom are affected by the affordable-housing crisis. For renters, the split-rate tax will increase the supply of housing units, which will drive down rental prices. Meanwhile, the city will use revenue accrued by the tax to build affordable, income-based rental units. For homeowners in other cities in the United States, the split-rate tax has proven to be beneficial. For example, across the 15 cities in Pennsylvania that implemented a split-rate tax, 85 percent of homeowners paid less in property taxes under the split-rate policy than under the flat-rate approach. The homeowners that did pay more did not pay significantly more and were mostly wealthier homeowners who could afford to pay more (Hartzok 1997). The homeowners affected by the affordable-housing crisis save money by having a much lower tax rate on their house, which outweighs the smaller tax increase on their land.
The split-rate property tax is a more feasible approach to increasing affordable housing in Chapel Hill, compared to other strategies. For example, mandatory inclusionary zoning for rentals, which requires developers to set aside a percentage of their units at an affordable rate, would be effective but not realistic; applying mandatory inclusionary zoning to rental developments would require repealing a state law passed in 1987 that bans rent control. Focusing on revising the tax code at the local level is more achievable, especially with the current support from the town council and community for affordable housing, as evidenced by the passing of the affordable housing bond in 2018. If no action is taken on the affordable housing crisis in Chapel Hill, rent will continue to rise, forcing low-income individuals and families to sacrifice spending on basic needs and increasing homelessness rates.
Our next steps include meeting with local policymakers and stakeholders to identify potential barriers to this policy implementation and gain support from the community. We will meet with Loryn Clark, Executive Director of Chapel Hill/Carrboro Housing and Community, to identify the compounding issues of the Low-Income Housing Tax Credits program, Section 8 housing assistance, and high student housing demand and their impact on a split-rate property tax. With this information, we will engage with local nonprofits, housing developers, and town leaders to construct a legislative plan supporting a split-rate property tax that we will bring before the town council. Finally, a public hearing will be finalized in conjunction with the town council to both inform and receive input from community members.
NEXT STEPS

EC
ON
OM
Y Chicago’s $1 Large Lots Program:
By Iván Cazarín, Giovanni A. García, Nicolas D. Robledo
THESIS
Roosevelt @ The University of Illinois at Chicago
To reduce the number of vacant lots and promote localized economic redevelopment in Chicago, the city should reform its Large Lots Program to allow renter participation and mandate that applicants’ primary residence be within the given community.
BACKGROUND & ANALYSIS
The Large Lots Program is a product of the Green Healthy Neighborhoods public planning process, approved by the Chicago Planning Commission in 2014. Designed to reduce the number of vacant lots in neighborhoods on the South Side and the West Side of the city, the program has dual goals: to give local residents greater control over vacant land in their neighborhood and return the land to the city’s tax rolls (Large Lots n.d.a.). A study on vacant lot reclamation demonstrated that community-led restorations encouraged resident engagement and nurtured a greater sense of agency over their neighborhoods (Branas et al. 2011).
The Large Lots Program is administered by the Chicago Department of Planning and Development (DPD) and collaborates with six neighborhood ambassador organizations that assist interested residents with the application process (Large Lots n.d.b.). The initiative works by selling city-owned lots of vacant land in piloted areas for an extensive range of uses, from playgrounds and community spaces to new residential buildings and greenhouses, with approval from the Department of Zoning and an Easy Permit from the Department of Buildings (Large Lots n.d.c.).
The potential usage of the lots is flexible, but access to them is not. To qualify for the Large Lots Program, applicants must own property on the same block as the vacant lot that they wish to purchase. A “block” area is defined as being located on the same side of the lot’s street, across the street, or across the alley behind the property. After an applicant is approved—a process that takes approximately 9–12 months (Large Lots n.d.b.)—the vacant lot is then sold to the applicant for $1 via a quit-claim deed. The buyer must pay closing costs of $60 to the Cook County Recorder of Deeds for the recording of the new deed (Large Lots n.d.b.; City of Chicago 2017). The Large Lots Program allows lot owners to sell their property after five years of ownership, which presents an excellent opportunity to increase community wealth and re-localize control of community land.
The neighborhoods with a large number of vacant lots in the program include Englewood, East Garfield Park, and South Chicago, all of which are predominantly Black and Latinx neighborhoods. These neighborhoods also have high rates of renters. For example, in Englewood, the neighborhood in which the Large Lots Program started, 74.3 percent of occupied housing units were occupied by renters. In East Garfield Park, that number is 77 percent, and in South Chicago, renters occupied 61.7 percent of occupied housing units (Chicago Metropolitan Agency for Planning n.d.), compared to 55 percent of occupied housing units occupied by renters in Chicago (Census Reporter n.d.) and an overall 44 percent renter rate in Cook County (Institute
11 | CREATIVE COMMONS COPYRIGHT 2019 | ROOSEVELTINSTITUTE.ORG |
Localizing Economic Redevelopment
KEY FACTS
• Renters occupy more than 60 percent of the housing units in the Englewood and South Chicago neighborhoods, which the Large Lots Program serves (Chicago Metropolitan Agency for Planning n.d.).
• As of 2016, the median income in Englewood and South Chicago, which are renter-dominant communities of color, was $20,112 and $28,824, respectively, compared to the city median of $50,434 (Chicago Metropolitan Agency for Planning n.d.). Households in these and similar neighborhoods often struggle to gather the capital traditionally required to purchase property (Institute for Housing Studies at DePaul University 2018).
• Black homeownership rates are 29 percent lower, and Latinx homeownership rates 26 percent lower, than white homeownership rates (Large Lots n.d.a.).
EC
ON
OM
Y
THE POLICY IDEA
Expanding applicant eligibility by removing the mandate on property ownership will allow the Large Lots Program to provide more equitable access to the individual and community benefits of property ownership. The Large Lots Program should also prioritize applications from community residents. Restructuring these requirements emphasizes local interests by expanding community members’ access to ownership of land.
POLICY ANALYSIS
The Large Lots Program attracts long-term residents; the majority of owners participating in the program have lived in their neighborhood for at least 10 years (65 percent), and even more plan to stay for another 10 years (69 percent) (Chicago Metropolitan Agency for Planning n.d.; Large Lots n.d.b.). Though renters are generally more likely to frequently change residences than homeowners, in 2016, the median move-in year of renters in both Englewood and South Chicago was 2009 (City-Data.com n.d.a.; n.d.b.), demonstrating the viability of including renters in the Large Lots Program. Interested renters would need to show a minimum primary residence period of at least four years on the given block of the lot that they wish to purchase. This policy would thus engage long-time community renters, rather than short-term renters.
As of 2016, the median income in Englewood and South Chicago, which are renter-dominant communities of color, was $20,112 and $28,824, respectively, compared to the city median of $50,434 (Chicago Metropolitan Agency for Planning n.d.). With incomes well below the city’s median income, households in these and similar neighborhoods often struggle to gather the capital traditionally required to purchase and maintain property (Institute for Housing Studies at DePaul University 2018). Englewood residents also bear a disproportionately heavy property tax burden, with an effective property tax rate in 2017 of 4.87 percent—more than twice the rate of Cook County’s 2.10 percent (Chicago City Wire 2018; Rodkin 2018). Expanding access to the Large Lots Program could potentially remedy the housing market’s historic inaccessibility to low-income renters and people of color.
Without regulations in place to ensure that residents have priority access to purchasing the lots, the program is vulnerable to speculation by outside investors who do not demonstrate need for the subsidy. For example, in 2016, the program sold a lot that housed an East Garfield Park community agricultural space, the Fulton Garden—even after the garden group received explicit written permission to develop and maintain the garden from their alderman. The buyer was a nonresident landlord, McInerney Builders Inc., which shut down the valuable community space (Qin 2018). The company was owned by Mike McInerney, a resident of Beverly, Chicago. Located 30 minutes south of the acquired lot, Beverly’s average median income (AMI) of $91,007 is more than three times that of East Garfield’s $29,000 AMI (Chicago Metropolitan Agency for Planning n.d.). On another occasion, the Large Lots Program attempted to sell a community garden space in Englewood, the Wood Street Meet and Greet. The garden offered not only part-time jobs to youth but also a safe space for children to play and fresh produce. The sale was protested by Illinois State Rep. Sonya Harper, who gathered more than 400 signatures on a petition to protest and eventually halt the sale of the garden lot to a landlord on the block (Qin 2018).
Permitting renters to participate in land-ownership initiatives in their neighborhood at subsidized prices will ensure that any potential appreciation in their neighborhood property values directly benefits community members. Acknowledging the racialized history of access to capital, the majority of racial wealth gaps are a result of the lack of intergenerational wealth transfers for families of color (Bright 2017). Allowing low-income communities of color greater access to subsidized land ownership in their neighborhoods could increase their assets and collective wealth and begin to address the stark generational wealth gap between white and Black households. This program would also allow current residents to exercise localized control over neighborhood land and maintain a material stake in their community.
| CREATIVE COMMONS COPYRIGHT 2019 | ROOSEVELTINSTITUTE.ORG | 12
for Housing Studies at DePaul University 2018). Because Black and Latinx homeownership rates are 29 percent and 26 percent lower, respectively, than their white counterparts (Joint Center for Housing Studies of Harvard University 2018), the program disproportionately excludes renters of color. Limiting this opportunity to property owners systematically excludes the majority of people who live in these neighborhoods. These same communities often face disproportionate property tax burdens; for example, the effective property tax rate in the Englewood neighborhood in 2017 was more than twice that of Cook County (Chicago City Wire 2018; Tepper 2018). The subsidized $1 deed to the vacant lot helps mitigate historically racialized property-tax rates in low-income communities of color by allowing access to land-ownership at a significantly reduced cost.
EC
ON
OM
Y
13 | CREATIVE COMMONS COPYRIGHT 2019 | ROOSEVELTINSTITUTE.ORG |
Reforming the Large Lots Program is an effort that will require collaboration across community and government groups. The main stakeholders of this policy are the residents of the South Side and the West Side communities in which this program operates, and the first plan of action will be to meet with existing community organizations and understand their agenda for the program. Teamwork Englewood is a neighborhood organization that was instrumental in establishing this program; meeting with them and other Englewood community members will be invaluable in identifying equitable next steps. Because organizations such as Greencorps Chicago and the Safer Foundation have encountered issues with nonresident lot acquisition (Branas and MacDonald 2014), engaging with these groups to understand the threat of surrendering community spaces to nonresident property owners will be paramount in expressing the need to reform the program. On-campus resources, including the UIC Survey Design Research Lab, will support the transparent collection and management of community opinions.
Establishing relationships with political representatives, such as Rep. Harper, who have previously allied themselves with community concerns and developed critical neighborhood networks, will encourage a holistic discussion of this policy. Meeting with the program funders, including LISC and the Knight Foundation, will offer perspective on the financial viability and implications of this policy change.
After attaining community input and buy-in, we would meet with the DPD, which administers the program and has the authority to change its requirements, to formally request these revisions to the next cycle of the Large Lots Program. For future additional enhancements, research is recommended on requiring program applicants to be within a representative range of the given neighborhood’s median income.
NEXT STEPS
TALKING POINTS
• By limiting eligibility to property owners, the Large Lots Program disproportionally excludes renters, who constitute more than 60 percent of residents in communities of color, such as Englewood and South Chicago (Chicago Metropolitan Agency for Planning n.d.). Opening up eligibility to renters simultaneously increases the applicant pool and allows for the inclusion of a demographic much more representative of the neighborhood.
• A study on the renewal of vacant urban space reported that community-led restorations gave residents a greater sense of agency over their neighborhood and encouraged community engagement and cohesion (Branas et al. 2011).
• Renters in Large Lots Program neighborhoods often stay in their community for a prolonged period of time. Establishing a minimum residency period of four years would allow long-time renters to participate in the program while also prioritizing local residents in property ownership.
HU
MA
N R
IGH
TS
| CREATIVE COMMONS COPYRIGHT 2019 | ROOSEVELTINSTITUTE.ORG | 14
To Pee or Not to Pee:
By Maeve Flaherty
THESIS
Roosevelt @ Columbia University
The severe lack of clean, functional public restrooms in New York City limits the access of homeless and other people to sanitary restrooms and leads to rampant public urination and defecation. To combat this problem, New York City should pay local businesses a monthly stipend for allowing the public to use their restrooms for free.
BACKGROUND & ANALYSIS
In the mid-1970s, a campaign by the Committee to End Pay Toilets in America argued that pay toilets were sexist because they charged for stall access but not access to urinals, which disproportionately affected women (Faircloth 2016). The campaign led to local laws across the country banning pay toilets (Gordon 2014). Although the campaign succeeded in “freeing the toilet,” cities did not follow up by building and maintaining free public toilets, claiming that it is difficult to keep them clean and safe (House 2018). Existing toilets have fallen into disrepair, and new public toilets are not being built (House 2018). In 1940, New York City had public toilets in 1,676 subway stations and all 1,500 public parks (Nosowitz 2016). Currently, there are only 700 public restrooms in city parks, most of which close at 8 p.m. and some of which are closed all winter, and only 78 in subway stations (Jaffe 2013). These numbers, however, are inexact and potentially smaller; users regularly report that bathrooms that are supposedly open are locked or inaccessible. Some private businesses allow access to their bathrooms without requiring a purchase for use: Starbucks, which has made its bathrooms publically available since 2018, has 327 stores in New York City, and department stores such as Macy’s and Bloomingdale’s also have publicly accessible restrooms (Gajanan 2018; González-Rivera and Bowles 2018). However, a significant majority of the city’s department stores and two-thirds of all Starbucks stores in the city (227 locations) are in Manhattan, leaving the other four boroughs with a clear minority of the publicly accessible, privately owned bathrooms (González-Rivera and Bowles 2018). Approximately 1,100 public toilets in a city of 8.6 million is clearly insufficient; compare this paucity to Singapore’s 30,000 public toilets for 5.6 million residents (Nosowitz 2016). The lack of public toilets has a negative sanitary effect on New York’s streets: in 2015, the New York Police Department issued 17,744 summonses for public urination (Kirby 2016). Insufficient access to restrooms is also a citywide health risk. Lack of hand-washing facilities is linked with the spread of Hepatitis A, which health officials claim fueled San Diego’s Hepatitis A outbreak in 2017 that left 20 people dead (DeHaven 2017; San Diego County n.d.). Both the health risks and the residual effects of public urination impact all residents but disproportionately affect the homeless (Denvir 2015). Floyd Parks, who spent years on the streets or in a Safe Haven shelter in the Bronx, was given a ticket for public urination that was later dismissed. He said, “People are in really bad situations now to find a place to go to the bathroom without getting a ticket, without getting harassed” (Trangle 2018).
KEY FACTS
• There are only roughly 1,100 public toilets, many of which close at 8 p.m. and are only open seasonally, for 8.6 million New York City residents (Nosowitz 2016). In 1940, comparatively, the city had more than twice that many: 1,676 public toilets in subway stations and 1,500 bathrooms in parks (Nosowitz 2016).
• The NYPD issued 17,744 summonses for public urination in 2015 (Kirby 2016).
• Lack of access to hand-washing facilities and sanitary restrooms contributes to the spread of disease, including Hepatitis A. An outbreak of Hepatitis A that was linked to insufficient toilet facilities led to 20 deaths in San Diego in 2018 (DeHaven 2017).
Creating a Public-Private Restroom Partnership to Expand Access to Sanitary Restrooms in New York City
15 | CREATIVE COMMONS COPYRIGHT 2019 | ROOSEVELTINSTITUTE.ORG |
HU
MA
N R
IGH
TS TALKING POINTS
• New York City has a severe lack of public toilets, a sanitation issue that endangers public health. This leads to significant public urination and personal discomfort for the New York City populace.
• The New York City government does not have the political will to build or maintain sufficient public toilet facilities.
• Paying local businesses to provide and advertise free public access to their existing toilets immediately increases public access to sanitary restrooms while minimizing the burden on local government.
THE POLICY IDEA
To improve public access to sanitary restrooms, New York City should pay local businesses a monthly stipend for allowing the public to use their restrooms for free. The city should identify and recruit businesses with sufficient, accessible facilities at key locations, and then advertise those businesses through an identifying sign or sticker. The city government already runs NYC 311, a resource that provides information on nonemergency government services (City of New York n.d.). New Yorkers use the NYC 311 app to check on the status of city services and make service requests (City of New York n.d.). The city should add a component to the NYC 311 app to allow users to easily look up the locations of participating businesses offering public bathrooms.
POLICY ANALYSIS
The lack of public restrooms is a public health risk that the New York City government continues to ignore. Even where investment has been made, the city falters due to planning and permission issues. In 2006, Mayor Bloomberg’s administration ordered 20 automated public toilets from the Spanish company Cemusa for New York City. Of the 20, only 5 have been installed. The rest have been stored for the past 10 years in a warehouse in Queens (Trangle 2018). Multiple times, the city has proposed locations for these toilets but has failed to move these proposals past various planning and zoning commissions and the Public Design Commission (Kirby 2016). In a city with limited public space, new infrastructure is difficult to introduce. The city has neither the political will nor the space to build or install new toilet infrastructure. Cities across Germany have adopted the Nette Toilette (Nice Toilet) system, in which city governments pay local business a monthly fee to allow the public to use their restrooms without purchasing anything. The fee, determined in negotiations between the cities and the businesses, ranges from €20 to €150 and includes the use of Nette Toilette’s branding and app (O’Sullivan 2016). The businesses place a sticker in their windows to indicate that their restrooms are available to the public. The city of Bremen, which adopted the plan and now has the lowest resident-to-public-restroom ratio in Germany (3,210 people per public toilet), pays €150,000 annually for a system it estimates would have cost €1.1 million had it been run exclusively by the city (O’Sullivan 2016). The monthly flat fee that the city pays to the businesses covers maintenance, cleaning, and security, which if provided by unionized city employees would cost the city more and require a significant commitment of city labor. The Nette Toilette system, which has expanded to 210 member cities since launching in 2000, is privately run (O’Sullivan 2016). New York should instead establish its own, publicly run system by branding public toilets in private businesses. With the lavatory infrastructure already built, the city would need to hire managers to work with the businesses and maintain the online and app resources, but it would not need to pay to purchase land, clean restrooms, or maintain secure facilities, drastically reducing the costs that would otherwise be associated with increasing the city’s stock of public toilets.
The design of the system allows it to be deployed neighborhood by neighborhood, enabling the program to be tested before it is implemented citywide. The start-up costs would be relatively low in relation to the impact on bathroom access: The technological costs would primarily include the development of a new feature for the existing NYC 311 app; organizational investment would consist of managerial expenses and expenses related to reviewing and overseeing the continued accessibility of the participating toilets. The Nette Toilette system places the burden of care for the toilets on the owners of the restrooms, rather than on the city. The creation of a public-private restroom partnership in New York City has relatively limited start-up costs and the ability to transform public access to safe, hygienic restroom facilities.
| CREATIVE COMMONS COPYRIGHT 2019 | ROOSEVELTINSTITUTE.ORG | 16
HU
MA
N R
IGH
TS
To be enacted, the policy must gain the support of both the mayor and the New York City Council to be included in the city budget and move forward. A bill creating the program must be written and introduced by a council member and then go through a process of public hearings before the city council votes on it. The policy therefore needs strong advocates within the city council and dedicated public support at public hearings. The key supporters in the city council are District 7 Councilmember Mark Levine, who is the chair of the Committee on Health, and District 34 Councilmember Antonio Reynoso, who is chair of the Committee on Sanitation and Solid Waste Management. If, however, the mayor takes up the issue himself, it will move much faster, as he could include funding for it in his proposed city budget, which he presents each year to the city council. The policy should therefore be advocated for within both the City Council and Mayor’s office.
The lack of public toilets affects large swathes of New York City residents and visitors, enabling the development of a diverse coalition of partners. The first step for such development should be partnering with Public Hygiene Lets Us Stay Human (PHLUSH), a national group that advocates for equitable public restroom availability. PHLUSH provides a Public Toilet Advocacy Toolkit and offers publicity and support to local public-toilet advocates.
Within New York, there are many organizations that advocate for those who are affected by the current situation: pregnant women are represented by a variety of mothers’ rights groups, and citizens with bladder dysfunction are represented by the National Association for Continence. The homeless predominantly have limited access to clean facilities, so a potential partner is the New York City–based homelessness advocacy group Coalition for the Homeless. Taxi drivers have difficulty accessing public restrooms during their shifts, making the New York Taxi Workers Alliance a possible stakeholder. In addition, the city’s roughly 62.8 million tourists, while roaming the city and far from their hotel bathrooms, are regularly inconvenienced by the lack of toilets (González-Rivera 2018). Advocacy groups focusing on tourism include the New York State Hospitality & Tourism Association and the New York State Tourism Industry Association.
Finally, for the policy to be successful, it requires the support of the business owners who would be opening their bathrooms to the public; their concerns must be taken into account in any attempt to share their facilities. The monthly flat fee would provide them with a reliable addition to their income, but they will only participate if it offsets the additional costs of increased bathroom use. Working with the Partnership for New York City, an advocacy and policy organization representing the city’s business leaders, and the Greater New York Chamber of Commerce would ensure that the concerns of businesses would shape the development of the policy and ensure its ultimate success.
NEXT STEPS
HU
MA
N R
IGH
TS Reinstating Parole within the
Commonwealth of Virginia for a More Cost-Effective Corrections SystemBy Ashley Stewart
THESIS
Roosevelt @ George Mason University
Virginia’s General Assembly should reinstate discretionary parole to alleviate overcrowding in local jails and the financial burden placed on Virginia’s taxpayers.
BACKGROUND & ANALYSIS
The Truth in Sentencing Act passed by Gov. George Allen in 1995 effectively abolished parole in Virginia. The law, passed during the tough-on-crime era, requires that inmates serve at least 85 percent of their sentence and eliminates their ability to receive earned sentence credit (Carter 2017). Though this act was intended to close the gap between how much of a person’s sentence is actually served, it has resulted in overincarceration in the state, with overcrowding in both jails and prisons and expensive maintenance of these facilities (Bradford 2013).
According to the 2011 Recidivism Trend Report released by the Virginia Department of Corrections, the total length of stay for incarcerated individuals has been gradually increasing since the abolition of parole (Celi and Turner 2011). In fact, the 2015 Virginia Commission on Parole Review found that 21 percent of parole-eligible inmates had already served more time for their offenses than the high end of the truth-in-sentencing guidelines recommendations (2015). Virginia’s total prison population in 1980 was approximately 9,000 prisoners; by January 2018, this population had more than tripled to roughly 30,000 prisoners. Virginia’s corrections system disproportionately affects Black Americans, who make up 60.8 percent of state prison populations (Bradford 2013), so this surge in the number of inmates has drastic consequences for people of color.
Because prisons are near capacity, local jails are being used to contain state inmates (Carter 2017). In 2015, a Virginia Department of Corrections report found that 22 percent of prisoners who were supposed to be in state prisons were being held in jails instead (Reutter 2017). According to a study by the Justice Policy Institute, local jails in Virginia have to operate at almost 150 percent capacity at times, while state prisons operate at roughly 96 percent capacity (Carter 2017). These facilities have important differences: Jails are designed for short-term stays and serve more-transient populations, while prisons are designed for long-term incarceration (Hg.org n.d.). Consequently, prisons are better suited for the living needs of their populations, and jails generally have less-developed facilities (Hg.org n.d.). The state’s prisoners are therefore living in inadequate facilities that also create unsuitable working environments for the state’s corrections workers—the turnover rate for officers and senior officers in the first four months of fiscal year 2018 exceeded 27 percent (Martz 2018).
The current state of the incarceration system is costly, ineffective, and unfair for all Virginians. Politicians have attempted to address the situation. In 2015, Gov. Terry McAuliffe appointed a Commission on Parole Review to review the 1995 decision to abolish parole. Unfortunately, because of time constraints, the commission was unable to specifically address reinstating discretionary parole (Virginia Commission on Parole Review 2015). Virginia is one of 16 states that have abolished parole, but none are currently considering reinstatement. Because Virginia’s political climate has been warming to the idea of reinstatement, the mood for reform is promising, and the state has the opportunity to create a parole-reform standard that other states can follow.
THE POLICY IDEA
The Virginia General Assembly should reinstate discretionary parole to combat overcrowding in jails and prisons, alleviate the financial burden placed on Virginia taxpayers, and give incarcerated individuals a chance to reintegrate into society.
17 | CREATIVE COMMONS COPYRIGHT 2019 | ROOSEVELTINSTITUTE.ORG |
HU
MA
N R
IGH
TS
TALKING POINTS
• Tough-on-crime policies are proven to be ineffective: A Virginia Department of Corrections study found that longer prison terms were ineffective at reducing recidivism (Bradford 2013).
• The effective abolition of parole, the removal of earned sentence credit, and mandatory minimum sentencing have all contributed to an explosion in the state’s inmate population.
• In Virginia, jails—designed for short-term stays—are severely overcrowded and have inadequate resources for the long-term living needs of the state’s prison population.
• Reinstating parole, instead of enforcing outdated sentencing guidelines, will lessen the financial burden on Virginia’s taxpayers, help with overcrowding in corrections facilities, and give prisoners a chance to reintegrate into society.
KEY FACTS
• In 2016, Virginia received only $135,000 from the federal government for a corrections budget that has almost doubled since 2001 to $1 billion (Carter 2017).
• The 2015 Virginia Commission on Parole Review found that 21 percent of parole-eligible inmates had served more time for their offenses than the high end of the recommendations found in truth-in-sentencing guidelines (2015).
• As of 2016, it cost $29,000 for the corrections system to house each prisoner every year, resulting in Virginia taxpayers spending $850 million annually (Carter 2017; Reutter 2017).
• Virginia’s population of prisoners over the age of 50 grew from 4.5 percent in 1990 to 20 percent in 2015. That same year, a Department of Corrections report found that 22 percent of prisoners who were supposed to be in state prisons were being held in local jails instead (Reutter 2017).
POLICY ANALYSIS
At the time of the Truth in Sentencing Act’s passing, Virginia lawmakers claimed that there were financial incentives to using truth-in-sentencing guidelines. In 1996, Virginia received $1.2 million from the federal government to be used toward its corrections budget of $542 million. However, in 2001, the federal government stopped giving money to states that used Truth in Sentencing guidelines (Carter 2017). As of 2016, it cost $29,000 to house each prisoner every year, resulting in Virginia taxpayers spending $850 million enforcing outdated sentencing guidelines—and a corrections budget that has reached $1 billion.
Whether or not these costs are worthwhile is questionable. Tough-on-crime policies have since been proven to be ineffective: A Virginia Department of Corrections study found that longer prison terms were ineffective at reducing recidivism (Bradford 2013). Meanwhile, Virginia’s growing population of prisoners is also growing older. The population of prisoners over the age of 50 increased from 4.5 percent in 1990 to 20 percent in 2015. The 9 percent of state prisoners over age 60 use 22 percent of the prison system’s budget for medical care (Reutter 2017). A United States Sentencing Commission report found that offenders between the ages of 50 and 54 have a 12.4 percent rate of being reincarcerated, and individuals between 60 and 64 have an 8.8 percent rate of reincarceration (Hunt and Easely 2017). Reinstating parole would allow these older inmates, who are statistically less likely to recidivate, to rejoin society and free space for newer offenders. The Urban Institute’s Justice Policy Center memo on successful reentry plans for formerly incarcerated individuals recommends that, prior to release, individuals should undergo a written assessment of their mental and physical healthcare status and needs (La Vigne et al. 2008). Upon release, they should receive contact information for a healthcare facility or provider in the community that they plan to reside in (La Vigne et al. 2008).
There has yet to be a member of the Virginia General Assembly to introduce a bill directly asking to reinstate parole within the Commonwealth. Conducting a study on reinstating discretionary parole would spur the drafting of such a bill. This study would fill the data and statistical gap left by the 2015 Commission on Parole Review and would provide much-needed state-specific information on parolee populations. This study would need support in the legislature. Several members of the General Assembly have worked on reforming parole; Delegates Vivian Watts and Joseph Lindsey and Senator Jennifer McClellan have recently introduced bills attempting to reform parole. These legislators are Democrats, but there are Republicans, such as Delegate Matt Fariss, who have jails in their districts and are open to ideas on how to better those facilities, making this proposal attractive for a bipartisan initiative.
Grassroots organizations in Virginia that are calling for parole reform include the Virginia Prison Justice Network and Resource, Information, Help for the Disadvantaged and Disenfranchised. These groups would be crucial in gaining traction for proposed legislation, talking with legislators, and elevating the voices of incarcerated individuals.
NEXT STEPS
| CREATIVE COMMONS COPYRIGHT 2019 | ROOSEVELTINSTITUTE.ORG | 18
19 | CREATIVE COMMONS COPYRIGHT 2019 | ROOSEVELTINSTITUTE.ORG |
DE
MO
CR
AT
IC A
CC
ES
S Decreasing Barriers to Voting:
By Amanda Kaplan, Morgan Showen, Meredith Days, Claire Vapnek, and Bennett Bramson
THESIS
Roosevelt @ University of Michigan
To decrease barriers to voting and increase historically low student turnout, the University of Michigan should make Election Day a campus-wide holiday and suspend classes.
BACKGROUND & ANALYSIS
At the University of Michigan, voter turnout in both 2014 and 2016 was lower than the national average (Institute for Democracy and Higher Education 2017). Students often work part-time or full-time jobs, and having the day off could ease the burden of voting in person. For many college students, who are likely to be first-time voters, the day off would be beneficial because they could vote in Ann Arbor or in their home community without worrying about missing class or other scholastic obligations (Washtenaw County 2016).
Many universities observe election day as a school holiday, including Clemson University, Columbia University, and Princeton University (Markosian and Serrano n.d.). Furthermore, in South Korea, Mexico, France, and Australia, national elections are national holidays, and voting rates in these countries are much higher than rates in the United States (DeSilver 2018). France holds elections over the weekend; 67.93 percent of voting-age individuals voted in its 2017 elections, demonstrating how eliminating work or school conflicts on election days can increase turnout (Bradfield and Johnson 2016). In a study of American voting patterns, 30 percent of people who didn’t vote in 2014 cited being “too busy” (Bradfield and Johnson 2016). Allowing a day off for voting can decrease the number of people who don’t vote because of time constraints.
TALKING POINTS
• Students often work part-time or full-time jobs, besides managing coursework and other academic obligations, all of which make finding time to vote difficult.
• Other universities have cancelled classes to encourage voting during presidential elections, and these initiatives have seen positive results. A campus-wide holiday at the University of Michigan follows this tradition while inspiring peer institutions to do the same.
• For full-time students who find it difficult to schedule the time to vote, having the day off could remove this barrier to voting.
THE POLICY IDEA
The implementation of a campus-wide holiday during the presidential election will provide University of Michigan students, staff, and faculty with a better opportunity to vote. Giving these individuals the day off from classes and work would encourage higher voting rates for all, including those with some of the lowest participation rates in our democracy—students (Wolcott 2018). This initiative would include measuring the effects of having the day off on student, staff, and faculty voting rates and would provide impetus for peer institutions to do the same. This policy is designed to address one aspect of the greater, general challenge that is low voter turnout in the US.
Suspending University of Michigan Classes on Election Day
| CREATIVE COMMONS COPYRIGHT 2019 | ROOSEVELTINSTITUTE.ORG | 20
DE
MO
CR
AT
IC A
CC
ES
S
POLICY ANALYSIS
Multiple universities have cancelled classes to encourage voting during presidential elections, and these initiatives have seen positive results (Markosian and Serrano n.d.). In 2008, Clemson University was one of two American universities with more than 6,000 students that had more than 70 percent of the student body vote (Nixon 2010). The University of Michigan, by comparison, saw a mere 44.7 percent of students vote in the highly competitive 2016 election—less than the national university average of 50.4 percent (Institute for Democracy and Higher Education 2017).
Though students face many barriers to voting, in the 2016 presidential election, 17.5 percent of 18-to-24-year-olds cited being too busy as their main reason for not voting (Markosian and Serrano n.d.). With 18-to-29-year-old voter turnout in the 2018 midterms increasing by 10 percent and setting a record high for the last seven midterms, a policy with the potential to increase student voter turnout by 17.5 percent would be comparatively significant (McAndrew 2018). Providing a campus-wide election holiday will not solve all voter-access problems related to race and class, but it would provide some relief to students who struggle to make it to the ballot box.
The University of Michigan administration has so far resisted initiatives for a campus-wide election holiday, citing a standing policy of denying all changes to confirmed academic calendars. It has, however, taken cautious steps toward this ultimate policy solution by agreeing to cancel exams on upcoming election days. Because the school has confirmed its academic calendars through 2021, this proposal includes a far-reaching timetable to garner support and acceptance of the ultimate goal: a campus-wide holiday that would take effect during the 2024 general election. From that year forward, the Office of the Registrar should add a day to the academic calendar at the beginning of the semester to account for the lost day of classes. There are no additional financial costs associated with simply cancelling classes for one day.
Because this would be a campus-wide policy, the institution responsible for the proposed change is the University of Michigan administration—specifically, the branches of the administration that create the academic calendar. These include the offices of the provost, the registrar, and the president, which are responsible for listening to the concerns expressed by student and faculty representative bodies. Without assent from these key stakeholders, this policy cannot be implemented.
Key allies needed in the initial stages of this policy’s implementation include major political groups on campus from both sides of the aisle, such as the university’s chapters of College Democrats and College Republicans. Other student organizations, such as student governments representing different colleges; the University Council, which includes a representative from each degree-granting institution on campus (Central Student Government n.d.); and the Senate Advisory Committee on University Affairs, the faculty senate of the university, have previously indicated their support for this policy. A grassroots, bottom-up strategy aims to convince these groups and administrators of this policy’s benefits. Besides encouraging additional voter-registration strategies, we will conduct research into other reasons behind low voter turnout among students on campus. The policy’s extended implementation timeline will allow for such research to be conducted and the findings included in future efforts.
KEY FACTS
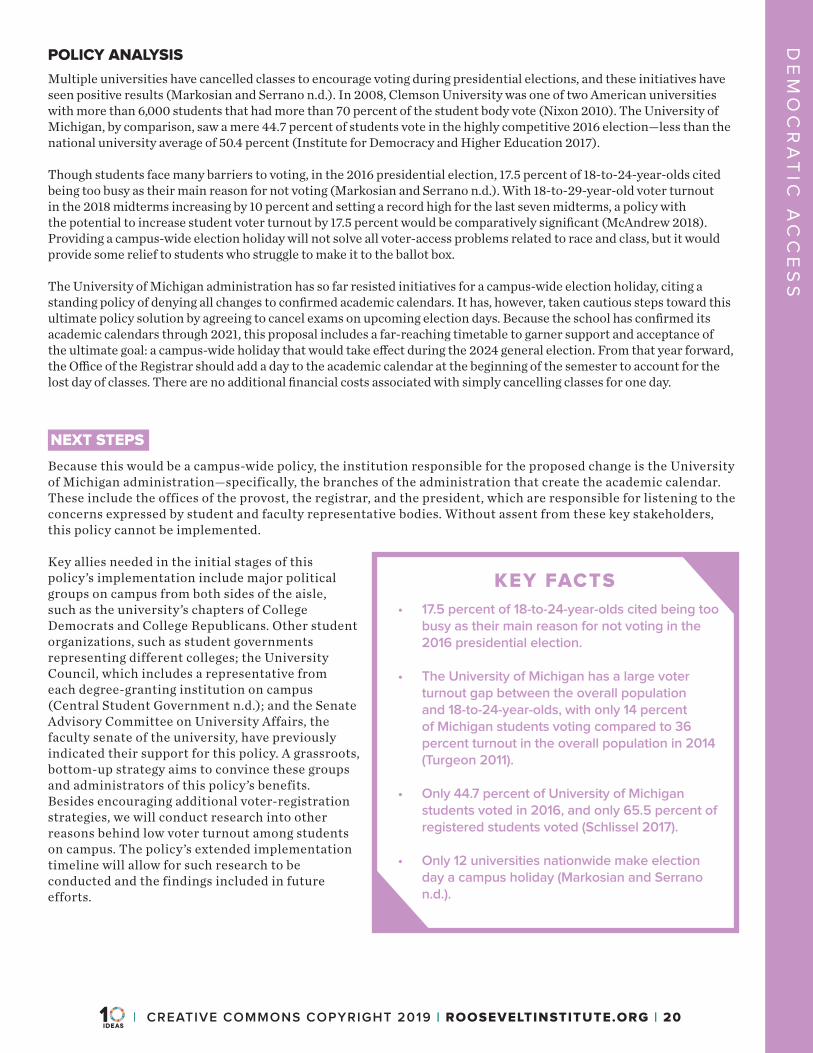
• 17.5 percent of 18-to-24-year-olds cited being too busy as their main reason for not voting in the 2016 presidential election.
• The University of Michigan has a large voter turnout gap between the overall population and 18-to-24-year-olds, with only 14 percent of Michigan students voting compared to 36 percent turnout in the overall population in 2014 (Turgeon 2011).
• Only 44.7 percent of University of Michigan students voted in 2016, and only 65.5 percent of registered students voted (Schlissel 2017).
• Only 12 universities nationwide make election day a campus holiday (Markosian and Serrano n.d.).
NEXT STEPS
21 | CREATIVE COMMONS COPYRIGHT 2019 | ROOSEVELTINSTITUTE.ORG |
EN
ER
GY
& E
NV
IRO
NM
EN
T Co-Firing Switchgrass:
By Hannah Bradshaw, Hannah Boettcher, and Matthew May
THESIS
Roosevelt @ University of Michigan
Coal-burning power plants in Michigan’s Upper Peninsula should be required to co-fire using switchgrass as a low-cost method to transition to renewable energy.
BACKGROUND & ANALYSIS
Michigan relies on coal-powered plants for 37 percent—or 4,393 thousand megawatt hours—of electricity production, and this coal use accounts for 35.8 percent of the state’s carbon dioxide (CO2) emissions (US Energy Information Administration 2018a). Only 8 percent of Michigan’s energy comes from renewable sources (US Energy Information Administration 2018b). Michigan’s Upper Peninsula is particularly dependent on coal because there are few alternatives for renewables-based electricity production beyond hydroelectric sources; hydroelectric power generation accounts for only 115.3 megawatts (MW) of the area’s electricity generation, compared to coal’s 533.7 MW (US Energy Information Administration 2018b).
Though conventional energy production remains nominally less expensive than production using renewable energy sources (Lazard 2017), high capital costs are still associated with conventional energy sources, such as natural gas. The two primary energy companies in Michigan, DTE Energy and Consumers Energy, plan to switch to using natural gas in some plants and later to renewables. Rather than make two major, high-capital investments in transitioning energy systems, current energy systems can be modified to use cleaner fuels until renewables-only systems can be adopted. To accomplish this, coal-fired power plants can co-fire using biofuels. Switchgrass is a low-cost crop ($65 per ton) (Perrin and Harlow 2014) that, when co-fired with coal, can reduce greenhouse gas (GHG) emissions by 8.6–13.7 percent (Idaho National Laboratory and Pacific Northwest National Laboratory 2013), making it a potentially promising biofuel. And it can be grown, harvested, processed, and distributed in the Upper Peninsula—an area that is lagging in terms of renewable energy.
TALKING POINTS
• According to the 2018 International Panel on Climate Change report, reducing our greenhouse gas emissions, especially in regions that overwhelmingly rely on nonrenewable energies, is vital to combatting irreversible damage to the environment.
• Incremental changes in energy production methods will help regions lacking the capital resources necessary to invest immediately in renewable energy generation.
• Switchgrass, in particular, is a promising biofuel because of its hardiness, low-maintenance production requirements, and efficiency as a biofuel source.
• The proposed alternative to coal, natural gas, emits methane (CO4) and nitrous oxide (NO2), which traps 82 times the amount of heat that carbon dioxide (CO2) does over a 20-year period and creates smog and acid rain, respectively (Union of Concerned Scientists n.d.).
KEY FACTS
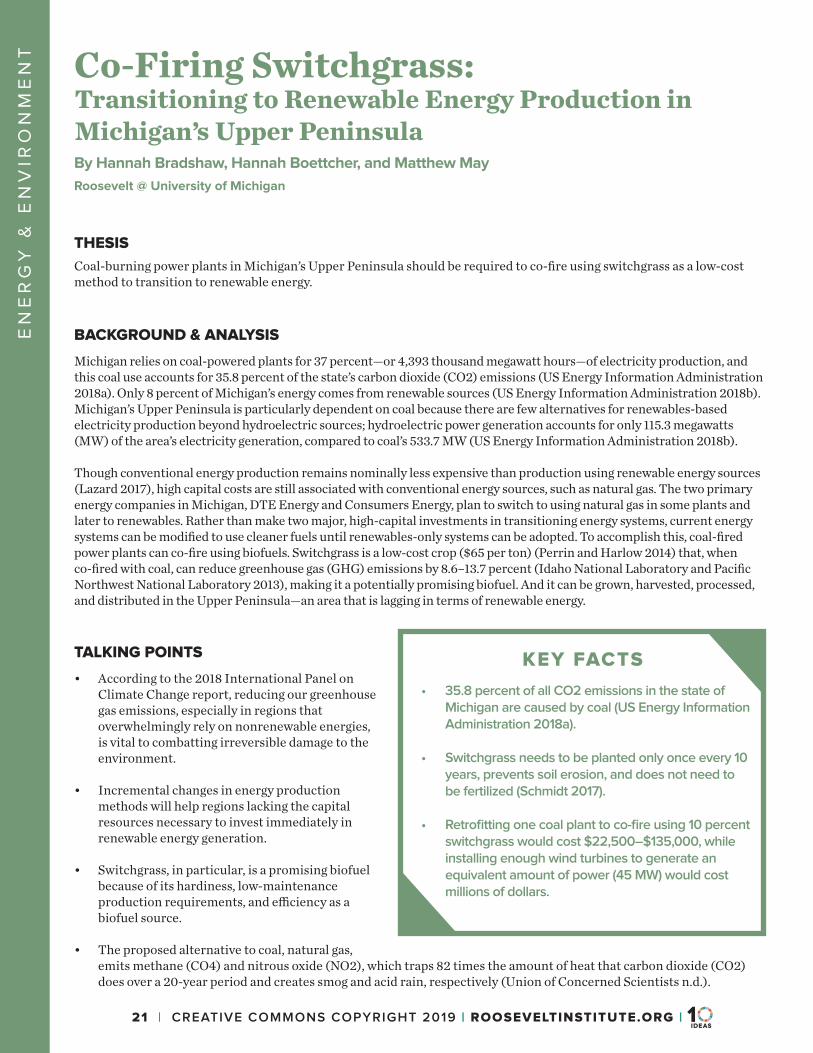
• 35.8 percent of all CO2 emissions in the state of Michigan are caused by coal (US Energy Information Administration 2018a).
• Switchgrass needs to be planted only once every 10 years, prevents soil erosion, and does not need to be fertilized (Schmidt 2017).
• Retrofitting one coal plant to co-fire using 10 percent switchgrass would cost $22,500–$135,000, while installing enough wind turbines to generate an equivalent amount of power (45 MW) would cost millions of dollars.
Transitioning to Renewable Energy Production in Michigan’s Upper Peninsula
| CREATIVE COMMONS COPYRIGHT 2019 | ROOSEVELTINSTITUTE.ORG | 22
EN
ER
GY
& E
NV
IRO
NM
EN
T
THE POLICY IDEA
Switchgrass, a perennial grass native to North America, can be cultivated for use as a biomass—a plant-based fuel source. In pellet form, it can be co-fired with coal using mostly existing infrastructure. Doing so would reduce the emissions of coal-fired energy plants. Because of the currently restrictive costs of other renewables, Michigan should require coal plants to co-fire using a minimum of 20 percent switchgrass biomass, which would provide an economically feasible transition to renewable energy at significantly lower costs.
POLICY ANALYSIS
Switchgrass is a robust bioenergy crop that has a high yield of biomass—meaning that there is more usable biomass per unit and little plant waste—and a high tolerance to a variety of soils and climates, making the hardy plant ideal for cultivation in the harsh growing conditions of the Upper Peninsula (Bughrara et al. 2007). Economically and environmentally sustainable, switchgrass would integrate exceedingly well into Michigan’s agricultural systems. It would not displace any native flora; corn and soy grow poorly in the Upper Peninsula, and switchgrass could replace these unsuccessful crops without disrupting the market for them. In southern Michigan, switchgrass could be used as a winter cover crop and a buffer crop—both uses are already incentivized by the Natural Resources Conservation Service and do not displace corn or soy. Environmental side effects are marginal; switchgrass actually prevents soil erosion, and it captures fertilizer runoff from traditional crop cultivation. Because switchgrass does not need to be fertilized or irrigated and needs to be planted only once every 10 years, cultivating the plant requires much less fuel and less-intensive farming practices (Schmidt 2017).
The crop is a source of ethanol, which can be used to generate energy, but it can also be pelletized—a simple process that switchgrass farmers could do themselves—and combusted in coal-fired power plants to reduce CO2, sulfur dioxide (SO2), and nitrous oxide (NO2) emissions. Co-firing using switchgrass has been shown to reduce total GHG emissions by up to 13.7 percent, with a 31 percent decrease in NOx emissions (Nicholls and Zerbe 2012). The one-time cost of retrofitting coal plants to accommodate biofuel co-firing is estimated to be $50–$300 per kilowatt of biomass capacity (Nicholls and Zerbe 2012). Marquette’s Presque Isle Power Plant could be retrofitted to co-fire using 10 percent switchgrass for a cost of only $22,500–$135,000 (Nicholls and Zerbe 2012). Making this switch at all existing coal plants in the Upper Peninsula alone would add 106.74 MW of renewable energy to the region. This would represent a 33 percent increase in the total share of renewable energies (US Energy Information Administration 2018b).
Retrofitting existing power plants to accommodate co-firing with switchgrass as a means of energy transition presents a more cost-effective alternative to retiring coal power plants and replacing them with plants that use nonrenewable natural gas (Balaskovitz 2017). A number of case studies have presented the viability of co-firing with switchgrass, though no state currently uses the plant as a major biofuel. This policy proposal therefore offers an innovate solution for Michigan and, potentially, other midwestern states.
The implementation of switchgrass co-firing policies requires state regulation with approval from the Michigan Legislature. We plan to contact State Rep. Yousef Rabhi, who has been a longtime advocate of environmental sustainability, as an ally and potential backer of this policy. In addition, we will reach out to members of the Michigan House Energy Committee, such as State Rep. Donna Lasinski and the Upper Peninsula representative from Marquette, Sara Cambensy. The utility companies DTE Energy and Consumers Energy and the labor unions that represent coal plant workers are powerful stakeholders that will likely oppose regulations that affect coal burning. Demonstrating the cost-effectiveness of making a small investment in bettering coal-based energy production, rather than a large one in transitioning to natural gas, will be important in persuading energy companies to support this proposal. As with many environmental regulations, fines will likely be needed to enforce the policy.
Building partnerships with Michigan’s Conservation Districts, especially those in the Upper Peninsula, will ensure that the proposal considers input from the farmers and environmental groups represented by these small district-level units of government in each Michigan county. Finally, partnership with the Upper Peninsula Environmental Coalition will provide important insight and advocacy advice needed to implement the policy.
NEXT STEPS
23 | CREATIVE COMMONS COPYRIGHT 2019 | ROOSEVELTINSTITUTE.ORG |
HE
AL
TH
CA
RE Comprehensive Medical Records:
By Priyanka Agrawal, Snipta Mallick, Nidhish Lokesh, and Wesley Miaw
THESIS
Roosevelt @ The University of Texas at Dallas
To significantly improve health care delivery for individuals in the Texas foster care system, the Texas Legislature should introduce a measure to consolidate patient information by linking electronic health record (EHR) systems with the state foster care system’s Superior HealthPlan Health Passport platform.
BACKGROUND & ANALYSISAfter the US District Court found key deficiencies in the Texas foster care system in M.D. v. Abbott (Civil Action No. 2:11-CV-84 (S.D. Tex. 2015)), the Superior HealthPlan Health Passport application was introduced to provide portable, web-based health information on children in foster care. The initial intention was to reduce misdiagnosis and gain a better understanding of a patient’s health interactions. Though planned as a larger, more comprehensive system, the Health Passport application has failed to perform adequately and has serious shortcomings. It does not contain complex medical information regarding behavioral and mental health typically found in electronic health record (EHR) progress notes and family histories (Superior Healthplan n.d.). Surface-level information on patient demographics, claimed visits, allergies, lab test results, immunizations, and filled medications do not offer a clear picture of the patient’s mental and behavioral health status. Most problematic is that the Health Passport tool restricts medical providers from updating any information outside of allergies, vital signs, and forms data; conversely, it restricts other types of providers within the foster care system from accessing EHR information. As a result, all care providers face a significant barrier to viewing comprehensive medical information on foster care children (Superior Healthplan n.d.).
The consequences are devastating. In 2015, the Texas health care system overmedicated 37 percent of children in foster care with psychotropic drugs as a result of misdiagnosis, which can be attributed, in part, to informational gaps in health records (Levinson 2018). That same year, children in foster care with fetal alcohol spectrum disorder were 10–15 times more likely to be misdiagnosed with attention deficit hyperactivity disorder (ADHD)—a diagnosis that is often coupled with psychotropic medication prescription (Bakhireva et al. 2018). In 2017, 900 children in the Texas foster care system were prescribed more than four psychotropic medications, and 200 were prescribed more than five drugs, which can be life-threatening for young children if the side effects of polypharmacy are not monitored appropriately (Texas Health and Human Services Commission n.d.).
Today, approximately 35 percent of children in the Texas foster care system are prescribed psychotropic drugs—some of whom do need this medication to treat mental and behavioral health issues, such as attention deficit disorder, schizophrenia, and depression. But many do not: Nationally, children in foster care receive psychotropic medications 2–3 times more frequently than children outside of the foster care system (Raghavan et al. 2005). Whether or not psychotropic medications are justified, their harmful potential side effects (Vaughn et al. 2007), including depression, anxiety, weight gain, and insomnia (National Institute of Mental Health 2016), can systematically diminish the quality of life of this vulnerable population.
The overprescription of psychotropic drugs can be directly linked to a lack of adequate health information available in the Health Passport, which increases the likelihood of misdiagnosis and subsequent incorrect prescriptions (Szilagyi et al. 2015). The Health Passport does not contain comprehensive medical histories; it serves primarily as a billing record, updated by claims data, resulting in superficial record-keeping. Health information can become lost or incorrectly recorded in databases when children move between caregivers, caseworkers, or medical providers—a frequent occurrence for children experiencing the upheaval of foster care (Texas Department of Family and Protective Services 2016).
Improving the Continuity of Care for Children in the Texas Foster Care System
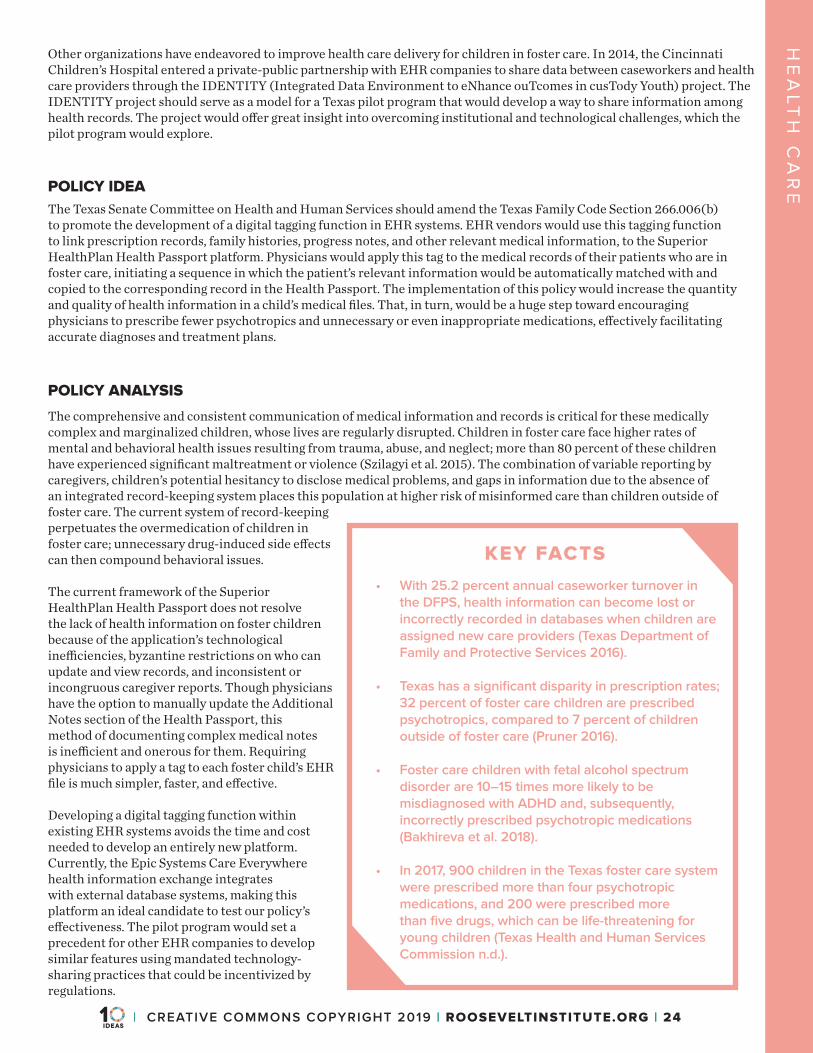
| CREATIVE COMMONS COPYRIGHT 2019 | ROOSEVELTINSTITUTE.ORG | 24
HE
AL
TH
CA
REPOLICY IDEA
The Texas Senate Committee on Health and Human Services should amend the Texas Family Code Section 266.006(b) to promote the development of a digital tagging function in EHR systems. EHR vendors would use this tagging function to link prescription records, family histories, progress notes, and other relevant medical information, to the Superior HealthPlan Health Passport platform. Physicians would apply this tag to the medical records of their patients who are in foster care, initiating a sequence in which the patient’s relevant information would be automatically matched with and copied to the corresponding record in the Health Passport. The implementation of this policy would increase the quantity and quality of health information in a child’s medical files. That, in turn, would be a huge step toward encouraging physicians to prescribe fewer psychotropics and unnecessary or even inappropriate medications, effectively facilitating accurate diagnoses and treatment plans.
POLICY ANALYSIS
The comprehensive and consistent communication of medical information and records is critical for these medically complex and marginalized children, whose lives are regularly disrupted. Children in foster care face higher rates of mental and behavioral health issues resulting from trauma, abuse, and neglect; more than 80 percent of these children have experienced significant maltreatment or violence (Szilagyi et al. 2015). The combination of variable reporting by caregivers, children’s potential hesitancy to disclose medical problems, and gaps in information due to the absence of an integrated record-keeping system places this population at higher risk of misinformed care than children outside of foster care. The current system of record-keeping perpetuates the overmedication of children in foster care; unnecessary drug-induced side effects can then compound behavioral issues.
The current framework of the Superior HealthPlan Health Passport does not resolve the lack of health information on foster children because of the application’s technological inefficiencies, byzantine restrictions on who can update and view records, and inconsistent or incongruous caregiver reports. Though physicians have the option to manually update the Additional Notes section of the Health Passport, this method of documenting complex medical notes is inefficient and onerous for them. Requiring physicians to apply a tag to each foster child’s EHR file is much simpler, faster, and effective.
Developing a digital tagging function within existing EHR systems avoids the time and cost needed to develop an entirely new platform. Currently, the Epic Systems Care Everywhere health information exchange integrates with external database systems, making this platform an ideal candidate to test our policy’s effectiveness. The pilot program would set a precedent for other EHR companies to develop similar features using mandated technology-sharing practices that could be incentivized by regulations.
Other organizations have endeavored to improve health care delivery for children in foster care. In 2014, the Cincinnati Children’s Hospital entered a private-public partnership with EHR companies to share data between caseworkers and health care providers through the IDENTITY (Integrated Data Environment to eNhance ouTcomes in cusTody Youth) project. The IDENTITY project should serve as a model for a Texas pilot program that would develop a way to share information among health records. The project would offer great insight into overcoming institutional and technological challenges, which the pilot program would explore.
KEY FACTS
• With 25.2 percent annual caseworker turnover in the DFPS, health information can become lost or incorrectly recorded in databases when children are assigned new care providers (Texas Department of Family and Protective Services 2016).
• Texas has a significant disparity in prescription rates; 32 percent of foster care children are prescribed psychotropics, compared to 7 percent of children outside of foster care (Pruner 2016).
• Foster care children with fetal alcohol spectrum disorder are 10–15 times more likely to be misdiagnosed with ADHD and, subsequently, incorrectly prescribed psychotropic medications (Bakhireva et al. 2018).
• In 2017, 900 children in the Texas foster care system were prescribed more than four psychotropic medications, and 200 were prescribed more than five drugs, which can be life-threatening for young children (Texas Health and Human Services Commission n.d.).
25 | CREATIVE COMMONS COPYRIGHT 2019 | ROOSEVELTINSTITUTE.ORG |
HE
AL
TH
CA
RE
TALKING POINTS
• In 2015, US District Judge Janis Graham Jack ruled the Texas foster care system unconstitutional under due process because foster children were harmed in a state custody system where “rape, abuse, psychotropic medication, and instability are the norm” (Pruner 2016).
• In 2015, the Texas health care system overmedicated 37 percent of children in foster care with psychotropic drugs as a result of misdiagnosis, which can be attributed, in part, to informational gaps in health records (Levinson 2018).
• The Health Passport, which serves more as a billing record rather than a physician-operated EHR, does not contain comprehensive medical histories (Superior Healthplan n.d.).
• Developing a tagging function that adds progress notes and family histories from EHR systems to the Health Passport platform would create a more complete health record for children in Texas foster care, resulting in more appropriate treatment.
State Sen. Nathan Johnson has filed Senate Bill 1911, which amends the Texas Family Code Section 266.006(b) by adding Subsection 6 to alter the Health Passport and include “to the extent allowed by federal law, information from the child’s electronic health record, as defined by Section 32.201, Human Resources Code, including the child’s medical history, medical progress notes, and medication list.” Sen. Johnson will help bring this issue to the forefront of legislative discussion. It is crucial to organize a legislative advocacy campaign targeting stakeholders, including parents, Texas Department of Family and Protective Services caseworkers, caregivers, children, EHR vendors, hospitals, and the Texas Health and Human Services Commission, which would fund the implementation of this policy.
Understanding the diverse perspectives on health in foster care is critical, so we will reach out to other health care and foster care interest groups, such as The Children’s Defense Fund and the National Foster Care Coalition, for advice on how to manage coordinated technological and legislative efforts. Proponents of foster care reform outside of Texas, such as those involved in the IDENTITY project at Cincinnati Children’s Hospital, may offer additional perspectives on how to integrate EHR systems with Health Passport and caseworker information (Dexheimer 2018).
NEXT STEPS
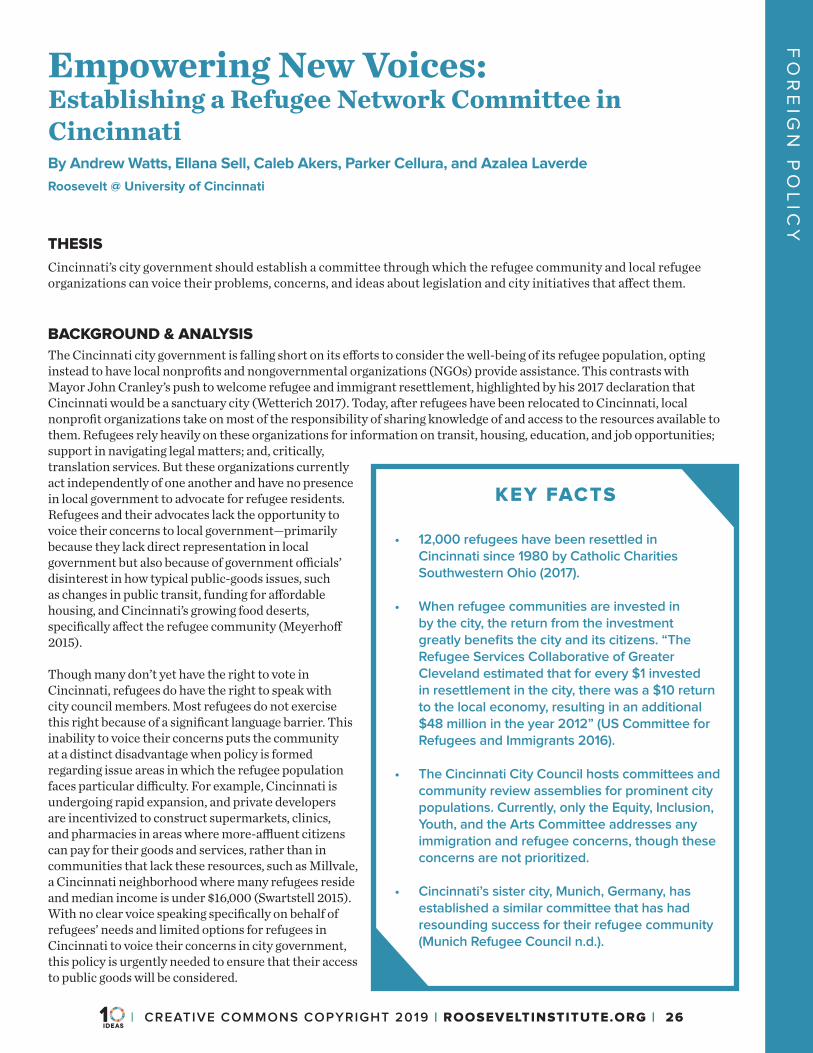
| CREATIVE COMMONS COPYRIGHT 2019 | ROOSEVELTINSTITUTE.ORG | 26
FO
RE
IGN
PO
LIC
Y
Empowering New Voices:
By Andrew Watts, Ellana Sell, Caleb Akers, Parker Cellura, and Azalea Laverde
THESIS
Roosevelt @ University of Cincinnati
Cincinnati’s city government should establish a committee through which the refugee community and local refugee organizations can voice their problems, concerns, and ideas about legislation and city initiatives that affect them.
BACKGROUND & ANALYSIS
The Cincinnati city government is falling short on its efforts to consider the well-being of its refugee population, opting instead to have local nonprofits and nongovernmental organizations (NGOs) provide assistance. This contrasts with Mayor John Cranley’s push to welcome refugee and immigrant resettlement, highlighted by his 2017 declaration that Cincinnati would be a sanctuary city (Wetterich 2017). Today, after refugees have been relocated to Cincinnati, local nonprofit organizations take on most of the responsibility of sharing knowledge of and access to the resources available to them. Refugees rely heavily on these organizations for information on transit, housing, education, and job opportunities; support in navigating legal matters; and, critically, translation services. But these organizations currently act independently of one another and have no presence in local government to advocate for refugee residents. Refugees and their advocates lack the opportunity to voice their concerns to local government—primarily because they lack direct representation in local government but also because of government officials’ disinterest in how typical public-goods issues, such as changes in public transit, funding for affordable housing, and Cincinnati’s growing food deserts, specifically affect the refugee community (Meyerhoff 2015).
Though many don’t yet have the right to vote in Cincinnati, refugees do have the right to speak with city council members. Most refugees do not exercise this right because of a significant language barrier. This inability to voice their concerns puts the community at a distinct disadvantage when policy is formed regarding issue areas in which the refugee population faces particular difficulty. For example, Cincinnati is undergoing rapid expansion, and private developers are incentivized to construct supermarkets, clinics, and pharmacies in areas where more-affluent citizens can pay for their goods and services, rather than in communities that lack these resources, such as Millvale, a Cincinnati neighborhood where many refugees reside and median income is under $16,000 (Swartstell 2015). With no clear voice speaking specifically on behalf of refugees’ needs and limited options for refugees in Cincinnati to voice their concerns in city government, this policy is urgently needed to ensure that their access to public goods will be considered.
Establishing a Refugee Network Committee in Cincinnati
KEY FACTS
• 12,000 refugees have been resettled in Cincinnati since 1980 by Catholic Charities Southwestern Ohio (2017).
• When refugee communities are invested in by the city, the return from the investment greatly benefits the city and its citizens. “The Refugee Services Collaborative of Greater Cleveland estimated that for every $1 invested in resettlement in the city, there was a $10 return to the local economy, resulting in an additional $48 million in the year 2012” (US Committee for Refugees and Immigrants 2016).
• The Cincinnati City Council hosts committees and community review assemblies for prominent city populations. Currently, only the Equity, Inclusion, Youth, and the Arts Committee addresses any immigration and refugee concerns, though these concerns are not prioritized.
• Cincinnati’s sister city, Munich, Germany, has established a similar committee that has had resounding success for their refugee community (Munich Refugee Council n.d.).
FO
RE
IGN
PO
LIC
Y
27 | CREATIVE COMMONS COPYRIGHT 2019 | ROOSEVELTINSTITUTE.ORG |
THE POLICY IDEA
Cincinnati city government should establish the Immigration and Refugee Committee, comprising refugee resettlement leaders, refugee community leaders, and a chairing city council member. This committee would be provided a formal space within the city government to voice its needs and concerns about problems affecting the Cincinnati refugee community that go undiscussed in the policy sphere. The committee would provide city leaders a chance to focus specifically on this community. It could function similarly to the refugee council supported by our sister city, Munich, Germany. That council’s goal is to not only advocate for the refugee population within city government but also inform Munich’s established population of the struggles that refugees face acclimating to life in the city (Munich Refugee Council n.d.). Although Munich’s refugee council is supported by the city council, integrating the Immigration and Refugee Committee into Cincinnati’s city government would allow these nonvoting refugee community members democratic access to local government.
POLICY ANALYSIS
According to the US Census Bureau, Cincinnati had 301,301 residents in 2017. The city has more than 12,000 refugees from countries including Burundi, Bhutan, Iraq, Congo, Eritrea, and Sudan, as reported by Catholic Charities Southwestern Ohio (2017). This means that refugees make up almost 4 percent of Cincinnati’s population. A relatively new influx of Bhutanese refugees has recently arrived, but minimal support exists to help them in the resettlement process. By contrast, Columbus, Ohio, has roughly 20,000 Bhutanese-Nepali residents—the largest population in the country. Because of this large, established population and the extensive network supporting them, these refugees in Columbus are better prepared for success (Community Refugee & Immigration Services n.d.). With a committee created to represent this and other refugee communities in Cincinnati, new residents will have more comprehensive assistance integrating into their new communities. They will also have a more direct voice in city legislation that affects them.
Potential opposition could come from longstanding residents of neighborhoods or communities that question the prioritization of refugee needs over their own. However, the Refugee Services Collaborative of Greater Cleveland in 2012 estimated a tenfold return to the local economy for every dollar spent on resettlement efforts—representing an additional $48 million (US Committee for Refugees and Immigrants 2016). Enabling representation of one vulnerable community decreases the likelihood of abuse of other communities and would increase democratic access for all communities in Cincinnati. Much like Munich’s refugee council’s efforts, it is important for the Immigration and Refugee Committee to make this point clear to all residents: Cincinnati, as a whole, stands to benefit from this initiative.
The committee would support intersectionality by bringing together community leaders and NGOs that represent different groups within the refugee community. The Immigration and Refugee Committee, aside from discussing issues faced by the community, will be able to propose legislation and voice concerns on new city ordinances. The committee would communicate with other committees already existing within municipal government, such as the Equity, Inclusion, Youth, and the Arts Committee and the Neighborhoods Committee. Having a chairing city council member will ensure that the community is represented when the council votes on city legislation.
Fiscally, there is no need for an extensive budget. Aside from normal operating costs for live-streaming committee meetings, possible costs could include promotional efforts to make the refugee populations aware of this new committee and translation services (some refugee organizations provide their own translation services). Taxpayers may fund some of these standard operating costs; expenses for special events and other ancillary costs will be covered by the representative organizations.
With Cincinnati facing ongoing issues such as food deserts, lack of reliable public transit options, and unaffordable housing, it is imperative that Cincinnati establish this committee before the city council passes more legislation that will ultimately affect the refugee community. This policy provides an opportunity to scale the solution to other cities, which can use Cincinnati’s Immigration and Refugee Committee as an example of best practices to support refugee populations.
TALKING POINTS
• There is a large refugee community in Cincinnati, representing 4 percent of the total population, that is underserved and has no representation in local government for its specific and pressing needs.
• To maintain its commitment to assisting immigrant populations alongside an ever-increasing global migrant and refugee population, the city of Cincinnati should create the Immigration and Refugee Committee to properly coordinate the efforts of entities in the city that serve this population.
• The Immigration and Refugee Committee, aside from discussing issues that the community currently faces, will be able to propose legislation and voice refugee concerns on new city ordinances that affect them.
FO
RE
IGN
PO
LIC
Y
With support from refugee organization leaders, University of Cincinnati professors, and city council members such as P. G. Sittenfeld, who has already supported the refugee community and its partners through his policy and advocacy efforts, this committee can be established through a vote by the city council. A formal proposal will be submitted to the mayor. The committee will be funded the same way that other active committees are funded. The committee will be able to host the leaders of other organizations that may benefit their cause, such as the Better Bus Coalition to discuss accessible bus routes. This committee will also be able to discuss funding issues that are challenging the refugee community and discuss possible policies that will help refugees better integrate with the general Cincinnati populace. Next steps include partnering with existing coalitions and committees, such as the Equity, Inclusion, Youth, and the Arts Committee, to further the shared goal of intersectionality within the city and expanding the proposal to include the general immigrant population of Cincinnati.
NEXT STEPS
| CREATIVE COMMONS COPYRIGHT 2019 | ROOSEVELTINSTITUTE.ORG | 28
29 | CREATIVE COMMONS COPYRIGHT 2019 | ROOSEVELTINSTITUTE.ORG |
Bashore-Berg, Tamara. 2018. “Michigan Is in the Midst of a Literacy Crisis.” Bridge Magazine, July 31, 2018. Accessed November 10, 2018. https://www.bridgemi.com/guest-commentary/opinion-michigan-midst-literacy-crisis.
Ferst Readers. n.d. “Fifty Top Literacy Statistics.” Accessed November 19, 2018. https://ferstreaders.org/resources/fifty-top-literacy-statistics.
Gottfried, Michael A. 2013. “The Spillover Effects of Grade-Retained Classmates: Evidence from Urban Elementary Schools.” American Journal of Education 119, no. 3 (May 2013): 405–44. Accessed November 2, 2018. https://doi.org/10.1086/669851.
Hernandez, Donald. 2011. “The Link Between Third Grade Reading Skills and High School Graduation Rates.” Slide deck presentation for a Lecture for The Edward J. Bloustein School of Planning and Public Policy and The National Institute for Early Education Research. Accessed November 2, 2018. https://www.fcd-us.org/assets/2016/04/Rutgers-1-FINAL-for-Sept-20-2011-presentation-for-FCD.pdf.
Joseph, Laurice. 2017. “Best Practices in Planning Interventions for Students with Reading Problems.” Reading Rockets, October 27, 2017. Accessed November 18, 2018. http://www.readingrockets.org/article/best-practices-planning-interventions-students-reading-problems.
Michigan Department of Education. 2018. “Annual Education Report for the 2017–2018 School Year.” MI School Data (website). Accessed December 1, 2018. https://www.mischooldata.org/AER2018/Default.aspx.
Michigan Department of Education. n.d. “Student Assessment.” MI School Data (website). Accessed December 1, 2018. https://www.mischooldata.org/DistrictSchoolProfiles2/AssessmentResults/AssessmentGradesProficiency.aspx.
National Association of Educational Progress. 2017. “NAEP Reading: State Average Scores.” The Nation’s Report Card. Accessed November 10, 2018. https://www.nationsreportcard.gov/reading_2017/states/scores?grade=4.
US Department of Education. 1999. “Taking Responsibility for Ending Social Promotion: A Guide for Educators and State and Local Leaders.” May 1999. Accessed November 19, 2018. https://eric.ed.gov/?id=ED430319.
Wong, Alia. 2018. “Students in Detroit Are Suing the State Because They Weren’t Taught to Read.” Atlantic, July 6, 2018. Accessed November 15, 2018. https://www.theatlantic.com/education/archive/2018/07/no-right-become-literate/564545/.
ReferencesTHIRD-GRADE LITERACY IN MICHIGAN: ENDING RETENTION
AND PROMOTING EARLY INTERVENTION
BATTLING INEQUALITY: OVERHAULING THE ADMITTANCE PROCESS TO ELITE BOSTON EXAM SCHOOLS
ACLU Massachusetts. 2017. “Incoming Exam School Classes Fail to Reflect Boston’s Diversity, Especially Boston Latin School.” Boston: ACLU Massachusetts. May 9, 2017. Accessed October 29, 2018. https://www.aclum.org/en/press-releases/incoming-exam-school-classes-fail-reflect-bostons-diversity-especially-boston-latin.
Boston Public Schools. n.d. “MCAS 2.0.” Educator Resources. Accessed November 22, 2018. https://www.bostonpublicschools.org/Page/4191.
Boston Redevelopment Authority Research Division. 2014. “Boston’s Children.” March 2014. Accessed February 12, 2019. http://www.bostonplans.org/getattachment/a8171712-3adf-43ed-86db-4eee527dd57e.
| CREATIVE COMMONS COPYRIGHT 2019 | ROOSEVELTINSTITUTE.ORG | 30
Ginther, Donna, and Robert Pollak. 2003. “Does Family Structure Affect Children’s Educational Outcomes?” NBER Working Paper Series 9628. Cambridge, MA: National Bureau of Economic Research. April 2003. Accessed on February 12, 2019. https://www.nber.org/papers/w9628.pdf.
Goodman, Joshua, and Melanie Rucinski. 2018. “Increasing Diversity in Boston’s Exam Schools.” Rappaport Institute for Greater Boston. Cambridge, MA: Harvard Kennedy School. October 2018. Accessed October 31, 2018. https://www.hks.harvard.edu/sites/default/files/centers/rappaport/files/examschools%20v10.pdf.
Greenhouse, Pat. 2018. “City Councilors Call for Hearing on Exam Schools Admissions Process.” Boston Globe, October 15, 2018. Accessed October 20, 2018. https://www.bostonglobe.com/metro/2018/10/15/city-councilors-call-for-hearing-exam-schools-admissions-process/A0m8wSg1CutCjTvYxo9h6M/story.html.
Hu, Winnie. 2018. “Elite New York High Schools to Offer 1 in 5 Slots to Those Below Cutoff.” New York Times, August 13, 2018. Accessed March 4, 2019. https://www.nytimes.com/2018/08/13/nyregion/discovery-program-specialized-schools-nyc.html.
Jehlen, Alain. 2017. “How to Get Boston’s Exam Schools to Look More Like Boston.” Schoolyard News, November 26, 2017. Accessed October 21, 2018. https://schoolyardnews.com/how-to-get-bostons-exam-schools-to-look-more-like-boston-81a534eaaf13.
Jenkins, Henry. 1881. “The Boston Public Latin School.” The Harvard Register. Boston: Franklin Press. Accessed March 4, 2019. https://archive.org/stream/bostonpubliclat02jenkgoog/bostonpubliclat02jenkgoog_djvu.txt.
Jung, Carrie. 2018. “Harvard Discrimination Trial Ends, But Lawsuit Is Far from Over.” National Public Radio (website). November 2, 2018. Accessed March 4, 2019. https://www.npr.org/2018/11/02/660734399/harvard-discrimination-trial-is-ending-but-lawsuit-is-far-from-over.
Massachusetts Department of Elementary and Secondary Education. 2018. “School and District Profiles.” Boston Public Schools district profile 2018. Accessed November 22, 2018. http://profiles.doe.mass.edu/general/general.aspx?topNavID=1&leftNavId=100&orgcode=00350000&orgtypecode=5&dropDownOrgCode=2.
McGloin, Catherine. 2018. “Council to Review Exam School Test.” Bay State Banner, October 24, 2018. Accessed October 29, 2018. https://www.baystatebanner.com/2018/10/24/council-to-review-exam-school-test.
Vazinis, James. 2018. “Is the Test for Boston’s Exam Schools Receiving a Failing Grade?” Boston Globe, October 10, 2018. Accessed March 4, 2019. https://www.bostonglobe.com/metro/2018/10/09/test-for-exam-schools-must-some-parents-and-advocates-say/30W3BhWReAZQP1iKxQ1ZhJ/story.html.
A SPLIT-RATE PROPERTY TAX TO INCREASE AFFORDABLE HOUSING IN CHAPEL HILL
Banzhaf, H. Spencer, and Nathan Lavery. 2008. “Can the Land Tax Help Curb Urban Sprawl? Evidence from Growth Patterns in Pennsylvania.” Journal of Urban Economics 67 (August 2008): 169–79. Accessed on November 14, 2018. https://papers.ssrn.com/sol3/papers.cfm?abstract_id=1247862.
Chapel Hill Affordable Housing. 2018. “Affordable Housing Annual Report: Fiscal Year 2018.” Town of Chapel Hill (website).
Accessed November 12, 2018. https://www.chapelhillaffordablehousing.org/affordable-housing-quarterly-report.
Cohen, Jeffrey P., and Cletus C. Coughlin. 2005. “An Introduction to Two-Rate Taxation of Land and Buildings.” Federal Reserve Bank of St. Louis Review 87, no. 3 (May/June 2005): 359–74. Accessed on November 13, 2018. https://files.stlouisfed.org/files/htdocs/publications/review/05/05/CohenCoughlin.pdf.
Dye, Richard F., and Richard W. England. 2010. “Assessing the Theory and Practice of Land Value Taxation.” Lincoln Institute of Land Policy. February 2010. Accessed on November 14, 2018. https://www.lincolninst.edu/publications/policy-focus-reports/assessing-theory-practice-land-value-taxation.
Grubb, Tammy. 2018. “Chapel Hill Voters Approve $10M Bond for Affordable Housing.” The News and Observer, November 6, 2018. Accessed on November 14, 2018. https://www.newsobserver.com/news/politics-government/article221033365.html.
31 | CREATIVE COMMONS COPYRIGHT 2019 | ROOSEVELTINSTITUTE.ORG |
CHICAGO’S $1 LARGE LOTS PROGRAM: LOCALIZING ECONOMIC REDEVELOPMENT
Branas, Charles C., Rose A. Cheney, John M. MacDonald, Vicky W. Tam, Tara D. Jackson, Thomas R. Ten Have. 2011. “A Difference-in-Differences Analysis of Health, Safety, and Greening Vacant Urban Space.” American Journal of Epidemiology 174, no. 11 (December 2011), 1296–1306. Accessed February 15, 2019. https://doi.org/10.1093/aje/kwr273.
Branas, Charles C., and John M. MacDonald. 2014. “A Simple Strategy to Transform Health, All Over the Place.” Journal of Public Health Management and Practice 20 (2): 157–59.
Bright, Marcus. 2017. “Broken Dreams and Financial Illusions: The Secret Depression of Black Men.” Huffington Post, May 30, 2017. Accessed February 15, 2019. https://www.huffingtonpost.com/entry/broken-dreams-and-financial-illusions-the-secret-depression_us_5925e674e4b0aa7207986a5c.
Census Reporter. n.d. “Census Profile: Chicago, IL.” Accessed November 29, 2018. https://censusreporter.org/profiles/16000US1714000-chicago-il/.
Chicago City Wire. 2018. “Analysis: Englewood Pays Property Taxes 4.09 times National Average.” Chicago City Wire, November 10, 2018. Accessed March 5, 2019. https://chicagocitywire.com/stories/511607923-analysis-englewood-pays-property-taxes-4-09-times-national-average.
Chicago Metropolitan Agency for Planning. n.d. “Community Data Snapshots.” Accessed November 29, 2018. https://www.cmap.illinois.gov/data/community-snapshots.
City of Chicago. 2017. “Nearly 1,000 Additional Vacant Lots Approved for $1 Sales Through Mayor Emanuel’s Large Lots Program.” Department of Planning and Development. October 11, 2017. Accessed February 15, 2019. https://www.chicago.gov/city/en/depts/dcd/provdrs/planning_and_policydivision/news/2017/september/952-vacant-lots-proposed-for--1-sales-through-mayor-emanuel-s-la.html.
City-Data.com. n.d.a. “Englewood neighborhood in Chicago, Illinois (IL), 60621.” Detailed neighborhood profile. Accessed March 5, 2019. http://www.city-data.com/neighborhood/Englewood-Chicago-IL.html.
City-Data.com. n.d.b. “South Chicago neighborhood in Chicago, Illinois (IL), 60617.” Detailed neighborhood profile. Accessed March 5, 2019. http://www.city-data.com/neighborhood/South-Chicago-Chicago-IL.html.
Institute for Housing Studies at DePaul University. 2018. “2018 State of Rental Housing in Cook County.” Accessed November 29, 2018. https://www.housingstudies.org/research-publications/state-of-housing/2018-state-rental-housing-cook-county/.
Joint Center for Housing Studies of Harvard University. 2018. “The State of the Nation’s Housing 2018.” Harvard Joint Center for Housing Studies. December 21, 2018. Accessed February 15, 2019. http://www.jchs.harvard.edu/state-nations-housing-2018.
Hartman, Matt. 2018. “Eight Years Ago, Chapel Hill Enacted the Most Progressive Affordable Housing Policy in the Triangle. Here’s How It Failed.” INDY Week, August 22, 2018. Accessed on November 12, 2018. https://indyweek.com/news/eight-years-ago-chapel-hill-enacted-progressive-affordable-housing-policy-triangle.-failed./.
Hartzok, Alanna. 1997. “Pennsylvania’s Success with Local Property Tax Reform.” American Journal of Economics and Sociology 56, no. 2 (April 1997): 205–13. Accessed on November 14, 2018. https://www.jstor.org/stable/3487258.
Herbert, Christopher, Alexander Hermann, and Daniel McCue. 2018. “Measuring Housing Affordability: Assessing the 30 Percent of Income Standard.” Joint Center for Housing Studies of Harvard University. Accessed February 14, 2018. http://www.jchs.harvard.edu//research-areas/working-papers/measuring-housing-affordability-assessing-30-percent-income-standard.
Orange County Affordable Housing Coalition. 2018. “Orange County Affordable Housing Summit.” February 23, 2018. Accessed on November 13, 2018. https://communityempowermentfund.org/oc_summitreport18/.
| CREATIVE COMMONS COPYRIGHT 2019 | ROOSEVELTINSTITUTE.ORG | 32
Large Lots. n.d.a. “The City of Chicago Sells Vacant Residential Lots for $1 through the Large Lot Program.” Accessed November 28, 2018. https://largelots.org/#/browse?pin=26051060010000.
Large Lots. n.d.b. “Frequently Asked Questions.” Accessed November 26, 2018. https://largelots.org/faq/.
Large Lots. n.d.c. “Lot Uses.” Accessed February 15, 2019. https://largelots.org/lot-uses/. Lincoln Institute of Land Policy. “Property Tax at a Glance.” Accessed March 5, 2019. https://www.lincolninst.edu/research-data/data-toolkits/significant-features-property-tax/state-state-property-tax-glance/property-tax-data-visualization#state=IL&table=&row=.
Qin, Amy. 2018. “A Lot to Lose.” South Side Weekly, May 24, 2018. Accessed February 15, 2019. https://southsideweekly.com/a-lot-to-lose-large-lots-rep-sonya-harper/.
Rodkin, Dennis. 2018. “Homeowners Here Pay Higher Property Taxes than 93% of U.S.” Crain’s Chicago Business, April 6, 2018. Accessed March 5, 2019. https://www.chicagobusiness.com/article/20180406/CRED0701/180409929/chicago-area-property-taxes-higher-than-93-percent-of-biggest-counties.
Tepper, Nona. 2018. “The Collateral Damage of $1 Vacant Lots.” Chicago Magazine, November 19, 2018. Accessed November 27, 2018. http://www.chicagomag.com/city-life/November-2018/The-Collateral-Damage-of-Large-Lots/.
TO PEE OR NOT TO PEE: CREATING A PUBLIC-PRIVATE RESTROOM PARTNERSHIP TO EXPAND ACCESS TO SANITARY RESTROOMS IN NEW YORK CITY
City of New York. n.d. “About NYC 311.” Official Website of the City of New York. Accessed February 11, 2019. https://www1.nyc.gov/311/our-mission.page.
City of New York. n.d. “NYC 311 Mobile App.” Official Website of the City of New York. Accessed February 11, 2019. https://www1.nyc.gov/nyc-resources/service/5460/nyc311-mobile-app.
DeHaven, James. 2017. “San Diego Officials Were Warned about Restroom Shortage Repeatedly Before Hepatitis Outbreak.” San Diego Union Tribune, September 20, 2017. Accessed November 20, 2018. https://www.sandiegouniontribune.com/news/watchdog/sd-me-grand-jury-20170920-story.html.
Denvir, Daniel. 2015. “Peeing Is Not a Crime.” CityLab, July 21, 2015. Accessed November 17, 2018. https://www.citylab.com/equity/2015/07/peeing-is-not-a-crime/399068/.
Faircloth, Kelly. 2016. “The 1970s Feminist Fight Against Pay Toilets.” Jezebel, April 26, 2016. Accessed on November 19, 2018. https://pictorial.jezebel.com/the-1970s-feminist-fight-against-pay-toilets-1773143625.
Gajanan, Mahita. 2018. “Starbucks Says Bathrooms Will be Open to Everyone After Controversial Arrest of 2 Black Men.” TIME, May 11, 2018. Accessed February 10, 2019. http://time.com/5273969/starbucks-bathrooms/.
González-Rivera, Christian. 2018. “Destination New York.” Center for an Urban Future, May 2018: 3. https://nycfuture.org/research/destination-new-york.
González-Rivera, Christian, and Jonathan Bowles. 2018. “State of the Chains, 2018.” Center for an Urban Future, December 2018: 9. https://nycfuture.org/research/state-of-the-chains-2018.
Gordon, Aaron. 2014. “Why Don’t We Have Pay Toilets in America?” Pacific Standard, September 17, 2014. Accessed November 19, 2018. https://psmag.com/economics/dont-pay-toilets-america-bathroom-restroom-free-market-90683.
House, Sophie. 2018. “Pay Toilets Are Illegal in Much of the US. They Shouldn’t Be.” CityLab, November 19, 2018. Accessed November 17, 2018. https://www.citylab.com/perspective/2018/11/pay-toilets-should-have-another-chance-world-toilet-day/576169/.
33 | CREATIVE COMMONS COPYRIGHT 2019 | ROOSEVELTINSTITUTE.ORG |
Jaffe, Eric. 2013. “Why Don’t American Subway Stations Have Public Bathrooms?” CityLab, January 3, 2013. Accessed November 18, 2018. https://www.citylab.com/transportation/2013/01/why-dont-american-subway-stations-have-public-bathrooms/4304/.
Kirby, Jen. 2016. “Why You Can’t Go Here: NYC’s Perpetual Toilet Problem.” New York Magazine, February 19, 2016. Accessed November 16, 2018. http://nymag.com/intelligencer/2016/02/why-you-cant-find-a-public-toilet-in-nyc.html?gtm=top.
Nosowitz, Dan. 2016. “Why New York City Has a Bathroom Problem.” Atlas Obscura, January 28, 2016. Accessed November 19, 2018. https://www.atlasobscura.com/articles/why-new-york-city-has-a-public-bathroom-problem.
O’Sullivan, Feargus. 2016. “Germany Found a Cheap Way to Fix Its Lack of Public Toilets.” CityLab, November 1, 2016. Accessed November 16, 2019. https://www.citylab.com/solutions/2016/11/not-enough-public-restrooms-nice-toilet-program-germany/506075/.
San Diego County. n.d. “Hepatitis A Outbreak in San Diego County is Officially Over.” San Diego County Health and Human Services. Accessed Nov 20, 2018. https://www.sandiegocounty.gov/content/sdc/hhsa/programs/phs/community_epidemiology/dc/Hepatitis_A/outbreak.html.
Trangle, Sarina. 2018. “Finding a Public Toilet in New York Still Difficult 10 Years into Program Launch.” AMNewYork, February 5, 2018. Accessed November 29, 2018. https://www.amny.com/news/new-york-public-toilets-1.16544793.
REINSTATING PAROLE WITHIN THE COMMONWEALTH OF VIRGINIA FOR A MORE COST-EFFECTIVE CORRECTIONS SYSTEM
Bradford, Spike. 2013. “Virginia’s Justice System: Expensive, Ineffective and Unfair.” Washington, DC: The Justice Policy Institute. November 2013. Accessed December 1, 2018. http://www.justicepolicy.org/research/6870.
Carter, Madison. 2017. “In Depth: Virginia’s Parole System Under the Microscope Part 1.” NBC29, December 27, 2017. Accessed December 01, 2018. http://www.nbc29.com/story/37146308/in-depth-virginias-parole-system-under-the-microscope-part-1.
Celi, Tami S., and John E. Turner. 2011. “Recidivism Trend FY1990–FY2006.” Virginia Department of Corrections, Researching & Forecasting, March 2011. Accessed March 6, 2019. vadoc.virginia.gov/about/facts/research/recidivism/recidivism-trend-report-1990-2006.pdf.
Hg.org. n.d. “What Is the Difference Between Jail and Prison?” Accessed February 11, 2019. https://www.hg.org/legal-articles/what-is-the-difference-between-jail-and-prison-31513.
Hunt, Kim Steven, and Bill Easely. 2017. “The Effects of Aging on Recidivism Among Federal Offenders.” US Sentencing Commission, December 2017. Accessed March 6, 2019. www.ussc.gov/sites/default/files/pdf/research-and-publications/research-publications/2017/20171207_Recidivism-Age.pdf.
La Vigne, Nancy, Elizabeth Davies, Tobi Palmer, and Robin Halberstadt. 2008. “Release Planning for Successful Reentry.” Washington, DC: Urban Institute, Justice Policy Center. October 8, 2008, (17–21). Accessed February 11, 2019. https://www.urban.org/research/publication/release-planning-successful-reentry.
Martz, Michael. 2018. “Correctional Officers Express Concerns about Pay, High Turnover Rate.” Richmond Times-Dispatch, January 23, 2018. Accessed March 6, 2019. www.richmond.com/news/virginia/government-politics/general-assembly/correctional-officers-express-concerns-about-pay-high-turnover-rate/article_f019aa58-14e1-50f0-bfd6-7eeec0ed460c.html.
Reutter, David. 2017. “Parole Remains Elusive for Virginia Prisoners.” Prison Legal News, October 9, 2017. Accessed December 1, 2018. https://www.prisonlegalnews.org/news/2017/oct/9/parole-remains-elusive-virginia-prisoners/.
Virginia Commission on Parole Review. 2015. “Final Report.” December 4, 2015. Accessed December 3, 2018. parolecommission.virginia.gov/resources/final-report/2015-12-04-parole-commission-final-report.pdf.
| CREATIVE COMMONS COPYRIGHT 2019 | ROOSEVELTINSTITUTE.ORG | 34
DECREASING BARRIERS TO VOTING: SUSPENDING UNIVERSITY OF MICHIGAN CLASSES ON ELECTION DAY
Bradfield, Caitlyn, and Paul Johnson. 2016. “The Effect of Making Election Day a Holiday an Original Survey and a Case Study of French Presidential Elections Applied to the U.S. Voting System.” Undergraduate working paper, Brigham Young University, May 1, 2016. https://www.researchgate.net/publication/303313297_The_Effect_of_Making_Election_Day_a_Holiday_An_Original_Survey_and_a_Case_Study_of_French_Presidential_Elections_Applied_to_the_US_Voting_System.
Central Student Government. n.d. “University Council.” University of Michigan Central Student Government (website). Accessed November 29, 2018. https://csg.umich.edu/legislative/university-council/.
DeSilver, Drew. 2018. “U.S. Trails Most Developed Countries in Voter Turnout.” PEW Research Center, May 11, 2018. Accessed November 27, 2018. http://www.pewresearch.org/fact-tank/2018/05/21/u-s-voter-turnout-trails-most-developed-countries/.
Institute for Democracy and Higher Education. 2017. “2012 and 2016 Campus Report: Student Voting Rates for University of Michigan-Ann Arbor.” National Study of Learning, Voting, and Engagement. Jonathan M. Tisch College of Civic Life, Tufts University, August 2017. Accessed November 26, 2018. http://obp.umich.edu/wp-content/uploads/pubdata/surveys/NSLVE_UMAA_2012_2016.pdf.
Markosian, Christopher, and Julieline Serrano. n.d. “A Proposal to Increase Student Voter Turnout.” Rutgers University Student Assembly Academic Affairs Committee. http://senate.rutgers.edu/RUSAProposalToIncreaseStudentVoterTurnout.pdf.
McAndrew, Jen. 2018. “Exclusive Analysis: Youth Turnout Rate Way up in 2018.” Tufts Now, November 7, 2018. Accessed March 6, 2019. https://now.tufts.edu/news-releases/exclusive-analysis-youth-turnout-rate-way-2018.
Nixon, Angela. 2010. “Clemson Recognized for Student Voter Turnout in 2008 Election.” Newsstand, January 21, 2010. Accessed November 27, 2018. http://newsstand.clemson.edu/mediarelations/clemson-recognized-for-student-voter-turnout-in-2008-election/.
Schlissel, Mark. 2017. “Welcome to the Big Ten Voting Challenge.” University of Michigan Office of the President (website). September 17, 2017. Accessed November 29, 2018. https://president.umich.edu/news-communications/letters-to-the-community/welcome-to-the-big-ten-voting-challenge/.
Turgeon, Mathieu. 2011. “Voting Behavior in Dual Ballot Contests: The Case of French Presidential Elections.” PsycEXTRA Dataset, 2011. https://doi.org/10.1037/e515432012-001.
Washtenaw County. 2016. “Washtenaw County Official Election Results: November 6th, 2018.” Washtenaw County (website). Accessed November 20, 2018. https://webmapssecure.ewashtenaw.org/ElectionRedirect/WebMap/nov2018/results.html?entry=.
Wolcott, R. J. 2018. “Does Michigan Make It Too Hard for College Students to Vote? Some Say Yes.” Lansing State Journal, October 4, 2018. Accessed November 28, 2018. https://www.lansingstatejournal.com/story/news/local/2018/10/04/michigan-voters-turnout-college-students-voting-register/1290815002/.
CO-FIRING SWITCHGRASS: TRANSITIONING TO RENEWABLE ENERGY PRODUCTION IN MICHIGAN’S UPPER PENINSULA
Balaskovitz, Andy. 2017. “As Coal Plants Close, Groups Scrutinize Plans for More Gas-fired Generation in Michigan.” Energy News Network, August 17, 2017. Accessed February 15, 2019. https://energynews.us/2017/08/18/midwest/as-coal-plants-close-groups-scrutinize-plans-for-more-gas-fired-generation-in-michigan/.
35 | CREATIVE COMMONS COPYRIGHT 2019 | ROOSEVELTINSTITUTE.ORG |
COMPREHENSIVE MEDICAL RECORDS: IMPROVING THE CONTINUITY OF CARE FOR CHILDREN IN THE TEXAS FOSTER CARE SYSTEM
Bakhireva, Ludmila N., Laura Garrison, Shikhar Shrestha, Janet Sharkis, Rajesh Miranda, and Karen Rogers. 2018. “Challenges of Diagnosing Fetal Alcohol Spectrum Disorders in Foster and Adopted Children.” Alcohol 67 (March 2018): 37–43. Accessed November 2018. doi:10.1016/j.alcohol.2017.05.004.
Dexheimer, Judith. 2018. “Researchers Create Personal Health Records to Link Data, Improve Outcomes in Foster Care Youth.” CincyInformatix, May 24, 2018. Accessed November 2018. https://cincyinformatix.org/personal-health-records-link-data-foster-care-youth.
Levinson, Daniel R. 2018. “Second-Generation Antipsychotic Drug Use Among Medicaid-Enrolled Children: Quality-of-Care Concerns.” US Department of Health and Human Services, Office of Inspector General. September 2018. Accessed November 2018. https://oig.hhs.gov/oei/reports/oei-07-12-00320.asp.
National Institute of Mental Health. 2016. “Mental Health Medications.” Overview. Updated October 2016. Accessed February 15, 2019. https://www.nimh.nih.gov/health/topics/mental-health-medications/index.shtml.
Pruner, Dagney. 2016. “Texas Foster Care System Faces Concerns about Overmedication of Children.” Reporting Texas, December 15, 2016. Accessed November 2019. http://reportingtexas.com/texas-foster-system-faces-concerns-about-overmedication-of-children/.
Bughrara, Suleiman, Richard Leep, Doo-Hong Min, Daniel Hudson, and Tim Dietz. 2007. “Switchgrass as a Biofuel for Michigan.” MSU Extension Bulletin E-2987, Michigan State University Extension. May 2007. https://www.canr.msu.edu/resources/switchgrass_as_a_biofuel_for_michigan_e29871.
Idaho National Laboratory and Pacific Northwest National Laboratory. 2013. “Logistics, Costs, and GHG Impacts of Utility-Scale Cofiring with 20% Biomass.” Technical report prepared for the US Department of Energy Bioenergy Technology Office under DOE Idaho Operations Office Contract DE-AC07-05ID14517. June 2013. https://www.pnnl.gov/main/publications/external/technical_reports/PNNL-23492.pdf.
International Panel on Climate Change. 2018. “Special Report: Global Warming of 1.5 ºC.” International Panel on Climate Change. October 2018. https://www.ipcc.ch/sr15/.
Lazard. 2017. “Levelized Cost of Energy 2017.” Lazard, November 2, 2017. Accessed February 15, 2019. https://www.lazard.com/perspective/levelized-cost-of-energy-2017/.
Nicholls, David, and John Zerbe. 2012. “Cofiring Biomass and Coal for Fossil Fuel Reduction and Other Benefits—Status of North American Facilities in 2010.” General Technical Report PNW-GTR-867. Portland, OR: US Department of Agriculture, Forest Service, Pacific Northwest Research Station. https://doi.org/10.2737/PNW-GTR-867.
Perrin, Richard, and Susan J. Harlow. 2014. “The Economics of Switchgrass for Biofuel.” eXtension, July 17, 2014. Accessed February 15, 2019. https://articles.extension.org/pages/71073/the-economics-of-switchgrass-for-biofuel#.VVni1pMdX7E.
Schmidt, Silke. 2017. “Engineering a Better Biofuel.” UWM Report. UWM Research. March 8, 2017. Accessed February 15, 2019. https://uwm.edu/news/engineering-switchgrass-for-better-biofuel/.
Union of Concerned Scientists. n.d. “Environmental Impacts of Natural Gas.” Accessed February 15, 2019. https://www.ucsusa.org/clean-energy/coal-and-other-fossil-fuels/environmental-impacts-of-natural-gas#.XGYr91xKjZu.
US Energy Information Administration. 2018a. “Energy-Related Carbon Dioxide Emissions by State, 2000–2015.” Independent Statistics & Analysis US Energy Information Administration. January 2018. https://www.eia.gov/environment/emissions/state/analysis/pdf/table2.pdf.
———. 2018b. “Michigan State Profile of Energy and Estimates.” Independent Statistics & Analysis. Updated April 19, 2018. Accessed February 15, 2019. https://www.eia.gov/state/?sid=MI#tabs-4.
| CREATIVE COMMONS COPYRIGHT 2019 | ROOSEVELTINSTITUTE.ORG | 36
Raghavan, Ramesh, Bonnie T. Zima, Ronald M. Andersen, Arleen A. Leibowitz, Mark A. Schuster, and John Landsverk. 2005. “Psychotropic Medication Use in a National Probability Sample of Children in the Child Welfare System.” Journal of Child and Adolescent Psychopharmacology 15, no. 1 (March 1, 2005): 97–106. Accessed November 13, 2018. https://doi.org/10.1089/cap.2005.15.97
Szilagyi, Miora A., David S. Rosen, David Rubin, and Sarah Zlotnik. 2015. “Health Care Issues for Children and Adolescents in Foster Care and Kinship Care.” Pediatrics 136, no. 4 (October 2015). Accessed November 2018. doi:10.1542/peds.2015-2656.
Superior HealthPlan. n.d. “Health Passport FAQs.” STAR Health - Resources For Providers & Agencies. Accessed November 2018. https://www.fostercaretx.com/for-providers/health-passport/health-passport-faqs.html.
Texas Department of Family and Protective Services. 2016. “The State of Texas 2016 Annual Progress and Services Report: Title IV-B Child and Family Services Plan, Fiscal Years 2015–2019.” Accessed November 2018. https://www.dfps.state.tx.us/About_DFPS/Title_IV-B_State_Plan/2016_Progress_Report/2015_Texas_Title_IV-B_State_Plan.pdf.
Texas Health and Human Services Commission. n.d. “Update on the Use of Psychotropic Medications for Children in Texas Foster Care Fiscal Years 2002–2017.” Accessed November 2018. https://www.dfps.state.tx.us/Child_Protection/Medical_Services/documents/reports/2017-10_Update_on-Psychotropic_Medications_in_Texas_Foster_Childen.pdf.
Vaughn, Michael G., Marcia T. Ollie, J. Curtis Mcmillen, Lionel Scott Jr., and Michelle Munson. 2007. “Substance Use and Abuse among Older Youth in Foster Care.” Addictive Behaviors 32, no. 9 (September 2007): 1929–935. Accessed November 14, 2018. doi:10.1016/j.addbeh.2006.12.012.
EMPOWERING NEW VOICES: ESTABLISHING A REFUGEE NETWORK COMMITTEE IN CINCINNATI
Catholic Charities Southwestern Ohio. 2017. “2017 Annual Report.” Catholic Charities Southwestern Ohio, November 31, 2017. Accessed November 20, 2018. https://ccswoh.org/assets/2017-Annual-Report.pdf.
Community Refugee & Immigration Services. “Bhutanese-Nepali.” Community Refugee & Immigration Services. Accessed March 5, 2019. https://www.crisohio.org/bhutanese-nepali/.
Meyerhoff, Pamela. 2015. “Food Accessibility in Cincinnati, Ohio: Measuring the Effect of Census Tract Poverty Rate on Grocers.” Xavier Journal of Politics 5 (2014–2015): 1–17. Accessed November 29, 2018. https://www.xavier.edu/xjop/volume-v.
Munich Refugee Council. n.d. “About Us.” Munich Refugee Council (website). Accessed November 30, 2018. http://muenchner-fluechtlingsrat.de/en/about-us/.
Swartstell, Nick. 2015. “Seeking Refuge.” CityBeat, April 24, 2015. Accessed November 30, 2018. https://www.citybeat.com/home/article/13002677/seeking-refuge.
US Committee for Refugees and Immigrants. 2016. “USCRI Cleveland Helps Make Their City a Home for Incoming Refugees.” US Committee for Refugees and Immigrants, October 2016. Accessed November 30, 2018. https://refugees.org/news/uscri-cleveland-helps-make-city-home-incoming-refugees/.
Wetterich, Chris. 2017. “Cranley Declares Cincinnati a Sanctuary City.” Cincinnati Business Courier, January 30, 2017. Accessed November 30, 2018. https://www.bizjournals.com/cincinnati/news/2017/01/30/cranley-declares-cincinnati-a-sanctuary-city.html.

R O O S E V E LT I N S T I T U T E . O R G