a laboratory providing hands on experience with … · a laboratory providing hands-on experience...
TRANSCRIPT
2006-743: A LABORATORY PROVIDING HANDS-ON EXPERIENCE WITH ASPARK IGNITION ENGINE IN A REQUIRED THERMODYNAMICS COURSE
Ralph Volino, U.S. Naval AcademyAssociate Professor. Mechanical Engineering Department, United States Naval Academy since1995. M.S., Ph.D., University of Minnesota. B.S., Michigan State University.
Andrew Smith, U.S. Naval AcademyAssistant Professor. Mechanical Engineering Department, United States Naval Academy since2001. Ph.D., University of Virginia. B.S., Villanova University.
© American Society for Engineering Education, 2006
Page 11.59.1
A Laboratory Providing Hands-On Experience with a Spark
Ignition Engine in a Required Thermodynamics Course
Abstract
A new experimental laboratory exercise is described involving the disassembly, reassembly and testing of a small spark ignition engine. The laboratory is designed to give a large group of students a hands-on experience with a piston engine, and to directly relate the mechanical device to the theory in a typical thermodynamics course. The exercise was deliberately limited in scope, as a single laboratory in a multi-subject thermodynamics course. Equipment cost was low and included multiple engines and a small dynamometer. Experimental results agreed well with theoretical calculations. Results of a pre and post course student surveys indicate that students learned information they would not have gained without the laboratory and retained it several months after the course. Introduction
Direct familiarity with mechanical devices is highly desirable for engineering students. Many students entering engineering programs, however, lack such experience. There is a perception that students today have less practical experience than those from past decades. After graduation most engineers will at some point be designing or evaluating designs of actual equipment. In order to be effective they must be able to relate theory to hardware. Most engineering courses do not teach the workings of mechanical devices as complete systems integrated with other concepts. Piston-cylinder devices, for example, are considered extensively in all thermodynamics courses, but are not typically tied directly to the mechanical devices that perform the thermodynamic cycles. There are practical reasons for this disconnect. Within the time available for an engineering degree program, it would be ineffective to teach all the details of many complex mechanical devices. In addition to the volume of information required, as technology advances, many of these devices will become obsolete. Students need to acquire the fundamentals of analysis and design, so that they can keep learning after graduation and apply these concepts in integrated engineering problems. It is still desirable, however, to provide students with some examples of complete systems that integrate concepts from several courses. Capstone design projects provide this in a significant way, but a capstone course provides only one experience with a particular project. It is valuable to introduce the idea in smaller ways, when possible. Reciprocating engines provide a good vehicle for tying together many engineering concepts. All students are familiar, at least as users, with piston engines. Their practicality is therefore obvious. Thermodynamics, heat transfer, combustion, fluid mechanics, mechanism design, material science, strength of materials, and electrical circuits are all needed to produce an operating engine. Seeing this connection directly can provide motivation for study of the individual subjects, and a realization that required courses are not completely unrelated. Goals and Integration in the Curriculum
The goal of the present laboratory is to provide students with a hands-on experience with an actual piston engine. They can see how it works and how its parts fit together, and relate it
Page 11.59.2
directly to the thermodynamic cycle that the engine executes. The broader educational objectives are to improve the students’ understanding of thermodynamics, to help them integrate this knowledge with other subjects, and to give them a better basic understanding of how an internal combustion engine works. This particular laboratory has been introduced in a required second thermodynamics course for all mechanical engineering students at the United States Naval Academy. Introduction in the first thermodynamics course might be more desirable, as it would provide motivation for the study of piston cylinder devices and thermodynamic work when they are first introduced, but a delay to the second course was chosen for practical reasons. The first thermodynamics course at the Naval Academy is taught to all engineering students (approximately 200 students every semester). It is a very full course and does not include a laboratory component. Only 50 minute class periods are available. Introducing the present laboratory into this course would be costly in terms of resources, difficult to schedule, and would require a sacrifice of other material in the course. The second thermodynamics course is taught only in the spring semester and only to mechanical engineering majors (approximately 80 each year). The course has a laboratory component with a 2 hour block every week. The course already included an internal combustion (IC) engine component with a laboratory that could either be supplemented with a new laboratory or replaced. In the previous laboratory, a single-cylinder, spark ignition, cooperative fuels research (CFR) engine was instrumented with a pressure transducer in the cylinder. Cylinder pressure was recorded as a function of crank angle, along with fuel consumption rate and engine speed. Students used the data to construct P-V diagrams and compute cycle work. This was done for several compression ratios, as the compression ratio is easily changed in a CFR engine. While this was a valuable lab, a CFR engine is relatively large and expensive, so it was not practical to have multiple engines available. The students did run the engine themselves, but with only one engine available for class sections of about 20 students, each student had only a limited hands-on experience. For most of the laboratory period, the students were simply watching. Also, the engine was not disassembled, so the students did not see its internal operation. Given the size and weight of a CFR engine, disassembly and reassembly by inexperienced students would have been difficult in a 2 hour period. One requirement for the new laboratory was that it be clearly limited in scope. A full course in IC engines is already available at the Naval Academy and is a very popular elective, but the present laboratory was designed to fit earlier in the curriculum into a required course for all mechanical engineering students. The IC engines component is only part of a multi subject course that also includes gas turbines, steam power plants, compressible flow, refrigeration cycles, and psychrometrics. The course includes several other laboratories, and field trips to a local steam power plant and a gas turbine testing facility. The new laboratory had to fit into one or two lab periods to avoid sacrifice of any of these other valuable components of the course. Another requirement was that each student have a hands-on experience with an engine. Groups of 3 to 5 students were to take it apart, examine it, and put it back together. Larger groups would have resulted in some students simply watching. With section sizes of about 20 students, this required 4 engines for disassembly. To relate to the thermodynamics, an engine would also be run on a dynamometer and performance data would be acquired. Previous experience suggested that inexperienced students could easily disassemble and reassemble a simple engine in 2 hours, but they could not typically do it with enough attention to tolerances so that the engine would
Page 11.59.3

actually run. Since the laboratory was to be limited in scope and the aim was not to train the students in mechanical skills, a fifth, identical engine, which was not disassembled was used for operation and testing on a dynamometer. The resources required for the laboratory were limited by financial, space and infrastructure requirements. No institution has unlimited resources, but unusual circumstances provided additional motivation for setting up a laboratory quickly with very limited resources. The existing laboratory equipment was lost due to flooding damage in the fall of 2003. At that time, the estimated time to restore the building and equipment was in excess of two years. Given the situation and the goals of the laboratory, small simple engines (e.g. lawnmower engines) were desired. Small engines could be easily transported by hand, up and down stairs if necessary. They could be disassembled on table tops in regular classrooms, even mobile classrooms. Small simple engines could be disassembled using simple, inexpensive tools. A small engine would be complex enough to provide students with an appreciation for the basics of IC engine operation, while lacking the auxiliary (and potentially confusing for a single lab period exercise) equipment of an automotive engine. A small engine could also be mounted on a small water brake dynamometer (described below) and operated outdoors, so that a test cell with ventilation would not be required. Finally, small engines could be purchased quickly at relatively low cost, reducing the time needed to secure funding and the lead time for delivery. Equipment
A list of equipment with approximate costs is shown in Table 1.
Table 1. Laboratory Equipment Single cylinder engines (5, $325 each) $1,625
Tool kits (4, $50 each) $200
Water brake dynamometer (1) $2,500
Laptop computer $1,500
Miscellaneous equipment $50
Total Cost $5,875
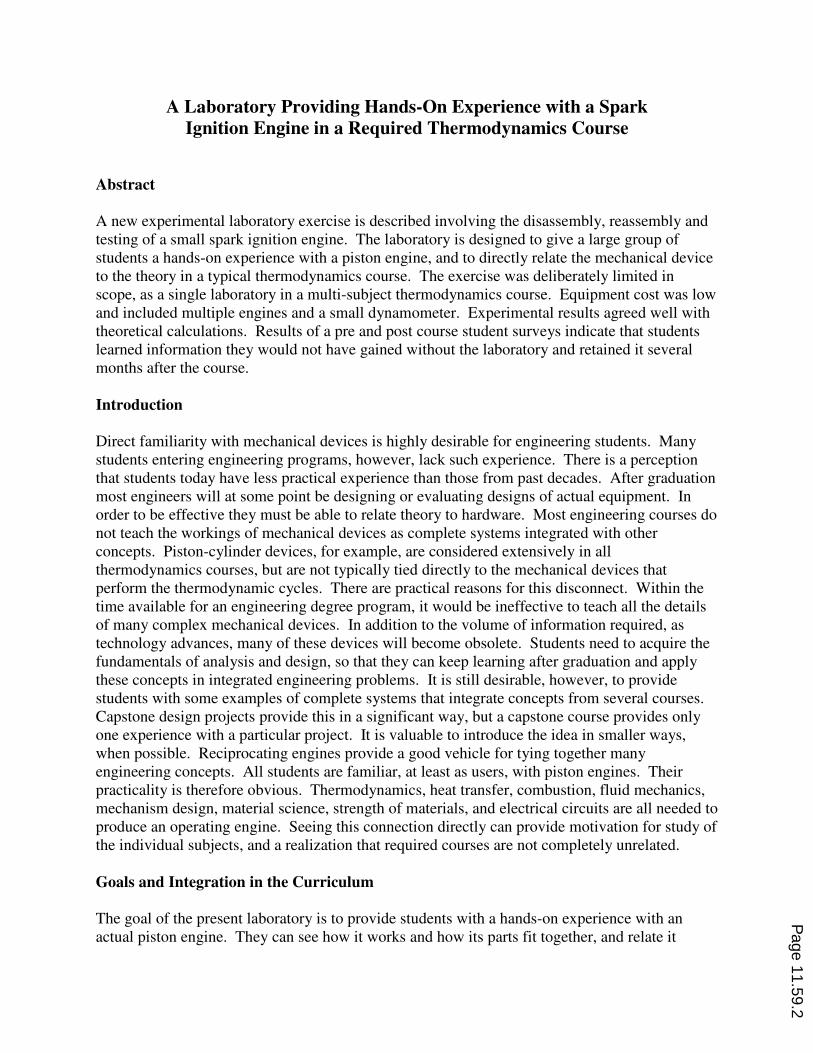
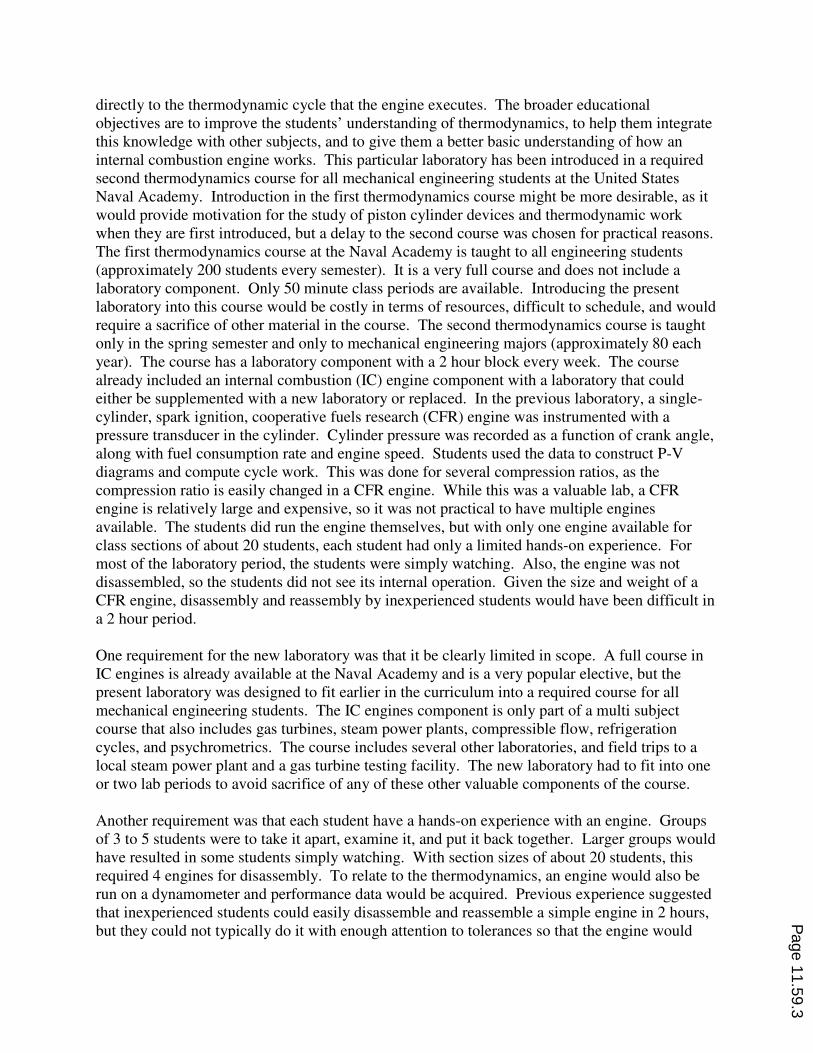
The engines were Briggs and Stratton, Raptor 3 Racing Engines. They were 5 hp, single cylinder, 4-stroke, carbureted, spark ignition engines. A photograph is shown in Fig. 1, and more information is available from the manufacturer1. The engines were designed for go-cart racing. Stock engines were purchased with no modification for laboratory use. Each laboratory group was supplied with a small tool kit including a set of socket wrenches for taking the engine apart. A set of calipers was included for measuring the bore and stroke of the engine. The cost of the calipers is included in the price of the tool kit listed in Table 1, but the calipers were not purchased solely for use in this laboratory. They had been purchased previously for the heat transfer laboratory described in Smith and Volino2. A DYNO-mite Kart Dynamometer from Land & Sea Inc. was purchased for engine testing and is shown in Fig. 2. It consists of a stand for holding an engine and a water brake. Torque and speed can be adjusted using the engine’s throttle (a butterfly valve in the air intake) and/or the flow rate to the water brake. The engine’s air fuel ratio can be adjusted with a screw on the
Page 11.59.4
carburetor. The water brake is instrumented to provide engine speed and torque data. Software provided with the dynamometer is loaded on a standard laptop PC, providing a graphical display of the torque, power and speed. The laptop price is included in Table 1. It was purchased, however, for the laboratory described in Smith and Volino2, and was not dedicated for use in the present laboratory. The flowrate for the water brake is low, so city water from a standard faucet is sufficient. The discharge can be sent to a drain or into the street when operating outdoors. Miscellaneous equipment such as a wrench for removing the engine’s flywheel, a ring compressor, assorted screwdrivers, a graduated cylinder, a funnel, and a garden hose for connecting the water brake to a faucet were also available.
Figure 1. Photograph of the engine
Figure 2. Photograph of the dynamometer
Page 11.59.5
Procedure
The instructions provided to the students for engine disassembly and reassembly are given below. Engine disassembly and reassembly procedure: Four 5 hp engines will be provided for each class. They are spark ignition engines designed to run on gasoline. Students should divide themselves as evenly as possible on the engines and take turns working on the engine so that everyone has a chance to participate and everyone has a working understanding of how the engine works.
1. Remove the bolts holding the front cover and remove the cover to expose the flywheel. The main purpose of the flywheel is to provide inertia to keep the engine rotation rate nearly constant. Without the flywheel, the engine speed would increase during the power stroke and decrease (and possibly stop) during the compression stroke. The flywheel in the present engine also serves two other purposes. Note the blades on the flywheel. These serve as a fan, drawing air in though the cover and forcing it past the fins on the engine, providing cooling. The flywheel also contains a magnet. The magnet passes the spark plug lead during each cycle, generating a voltage and causing the spark plug to fire.
2. Remove the bolts on the top of the engine and remove the shroud. The shroud helps direct the cooling air
drawn in by the flywheel across the engine’s fins for cooling.
3. Remove the remaining bolts on the top of the engine and remove the head (top cover of the engine). You will now be able so see the intake and exhaust valves as well as the piston. Turn the crankshaft to see the valves open and close and the piston move up and down. Note the timing of the valves opening and closing with regard to the position of the piston in the cycle. Note the source of the air and fuel for the intake valve and the exhaust port location.
4. Measure and record the bore (the cylinder diameter) using a micrometer.
5. Measure and record the stroke using a micrometer. The stroke is the distance the piston travels from top
dead center (highest position in the cylinder) to bottom dead center (lowest position in the cylinder).
6. Measure the clearance volume. This is the minimum volume in the cycle and is equal to the volume at top dead center. Hold the head upside down, and fill the clearance volume with water. Pour the water through a funnel into a graduated cylinder.
7. Remove the bolts on the back of the engine and remove the back plate to open the crank case. Turn the
engine and observe the mechanism which causes the piston to move. Also observe how the camshaft causes the valves to open and close.
8. Remove the camshaft. Note the markings on the crankshaft gear and the camshaft gear. When the engine
is assembled, these markings must line up to provide the proper valve timing. Observe how the cam pushes the valve lifters, causing the valves to open and close.
9. Remove the bolts holding the piston to the crankshaft. Remove the piston by pulling it out the top of the
cylinder.
10. Measure the piston diameter just below the rings. Compute the piston clearance. The clearance is the distance between the piston and the cylinder wall. It is equal (bore – piston diameter)/2.
11. Remove the flywheel. Observe how the keyway fixes the position of the magnet in the flywheel relative to
the position of the crankshaft. This sets the spark timing.
12. Working in reverse order, reassemble the engine. A ring compressor will be needed to insert the piston back into the cylinder.
Page 11.59.6

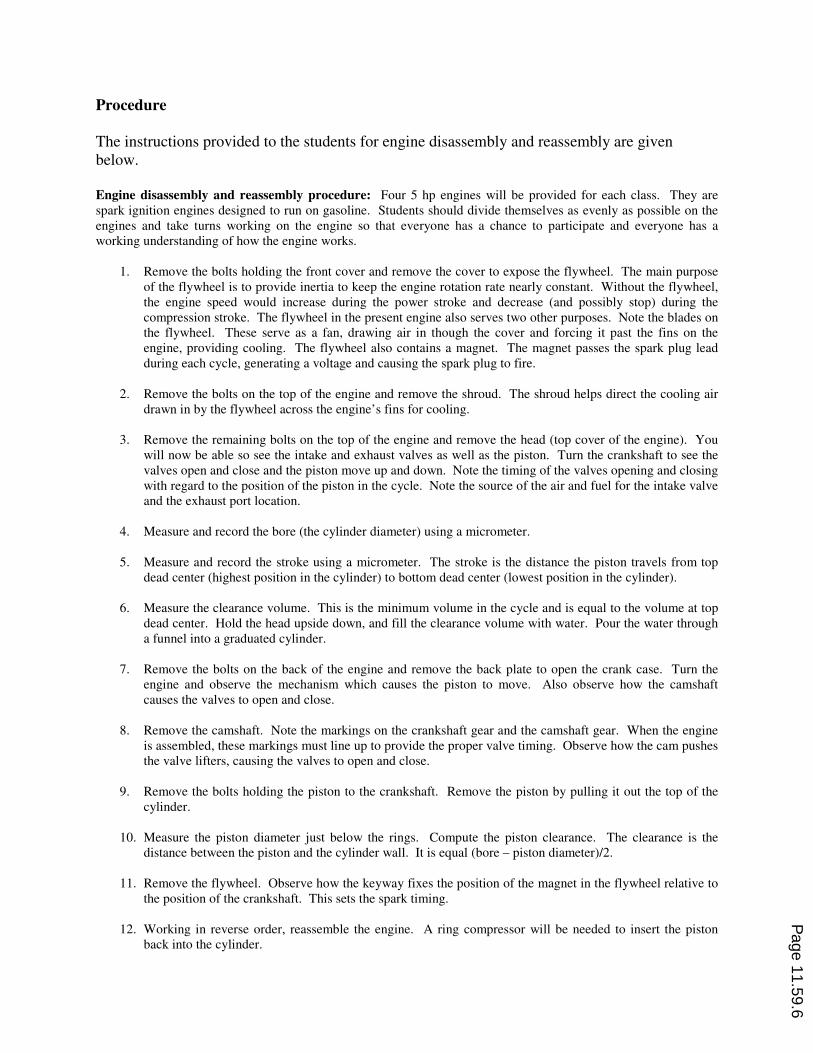
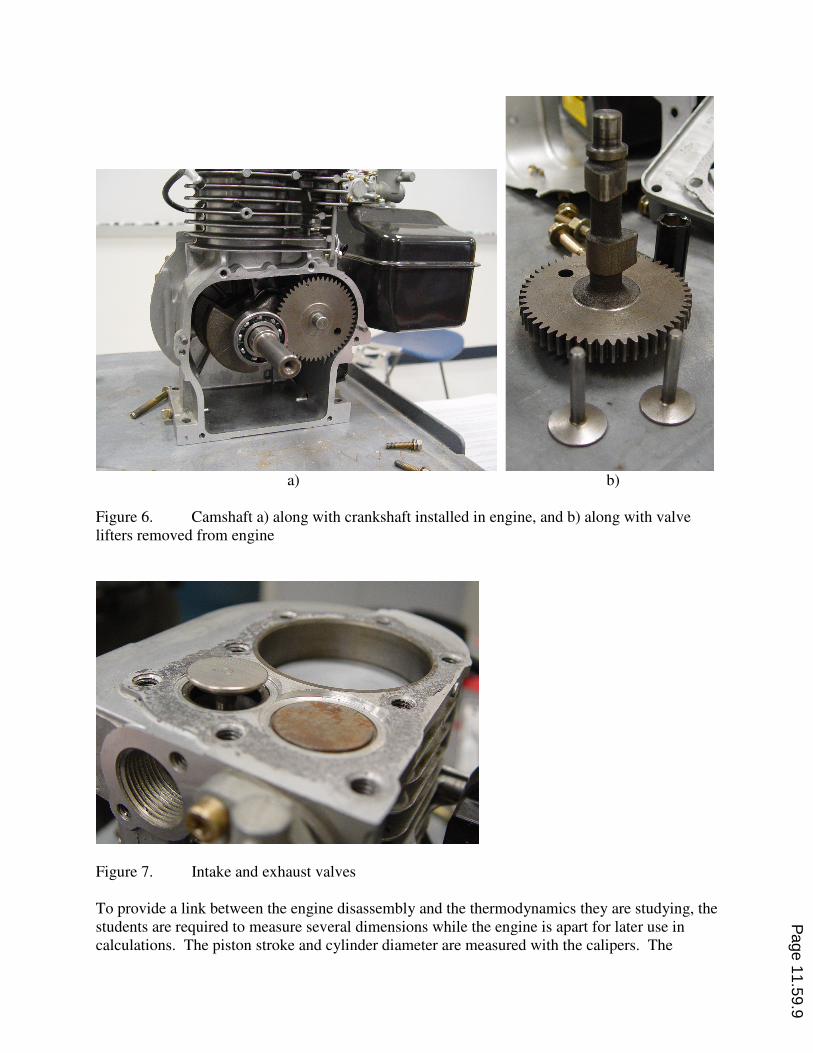
The course instructor and a laboratory technician circulate among the laboratory groups during this procedure to point out the purpose of various engine components and to ask questions prompting the students to think about the parts they are handling and how they are all related to the engine’s operation. The instructor and technician are also available to answer questions either directly related to the lab procedure or of general interest. The interaction between instructor and students is a very important part of the laboratory and is not necessarily limited to the items in the procedure provided to the students. The instructor can point out how the magnet in the flywheel (Fig. 3) is used with a small generator to drive the spark plug. Students can hold the spark plug lead and spin the flywheel by hand to feel the spark. If they spin the flywheel fast enough, the spark is strong enough to give them a memorable jolt, although not strong enough to hurt anyone. The students can be queried about the purpose of a pin extending from the piston rod (Fig. 4). The pin is used to splash oil from the crankcase onto the cylinder walls for lubrication. The function of the piston rings (allowing for clearance between the piston and cylinder walls so the piston can move, while maintaining compression by separating the combustion chamber from the crankcase) can be noted (Fig. 5). The use of a butterfly valve to restrict the airflow into the engine can be related to the fluid dynamics course the students are taking concurrently with their thermodynamics course, as can the carburetor’s venturi, which is used to draw fuel through a small tube the students can see in the fuel tank. The purpose of the engine’s aluminum cooling fins and the flow of air drawn in by the flywheel and sent over the fins can be noted. The effect of the cooling on the thermodynamic cycle can be noted, and the heat transfer mechanism can be touched upon and related to the heat transfer course the students will take the following semester. The choice of a cast aluminum block with a steel cylinder liner can be related to their material science course. The mechanical timing of the engine, with the gearing of the crank and cam shafts (Fig. 6) and the operation of the intake and exhaust valve lifters can be related to their mechanical design course. The students are encouraged to turn the engine by hand and note the opening and closing of the valves (Fig. 7) and relate them to the 4-stroke cycle they have studied in class.
Figure 3. Engine with flywheel exposed
Page 11.59.7
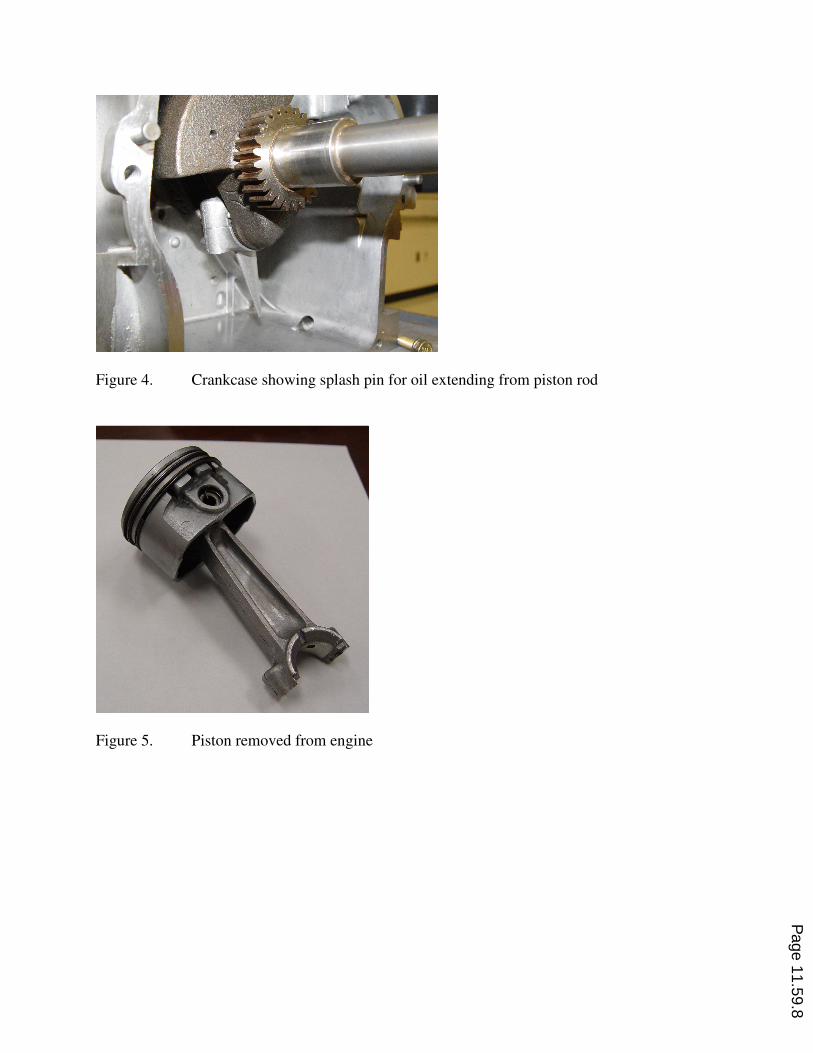
Figure 4. Crankcase showing splash pin for oil extending from piston rod
Figure 5. Piston removed from engine
Page 11.59.8
a) b)
Figure 6. Camshaft a) along with crankshaft installed in engine, and b) along with valve lifters removed from engine
Figure 7. Intake and exhaust valves To provide a link between the engine disassembly and the thermodynamics they are studying, the students are required to measure several dimensions while the engine is apart for later use in calculations. The piston stroke and cylinder diameter are measured with the calipers. The
Page 11.59.9
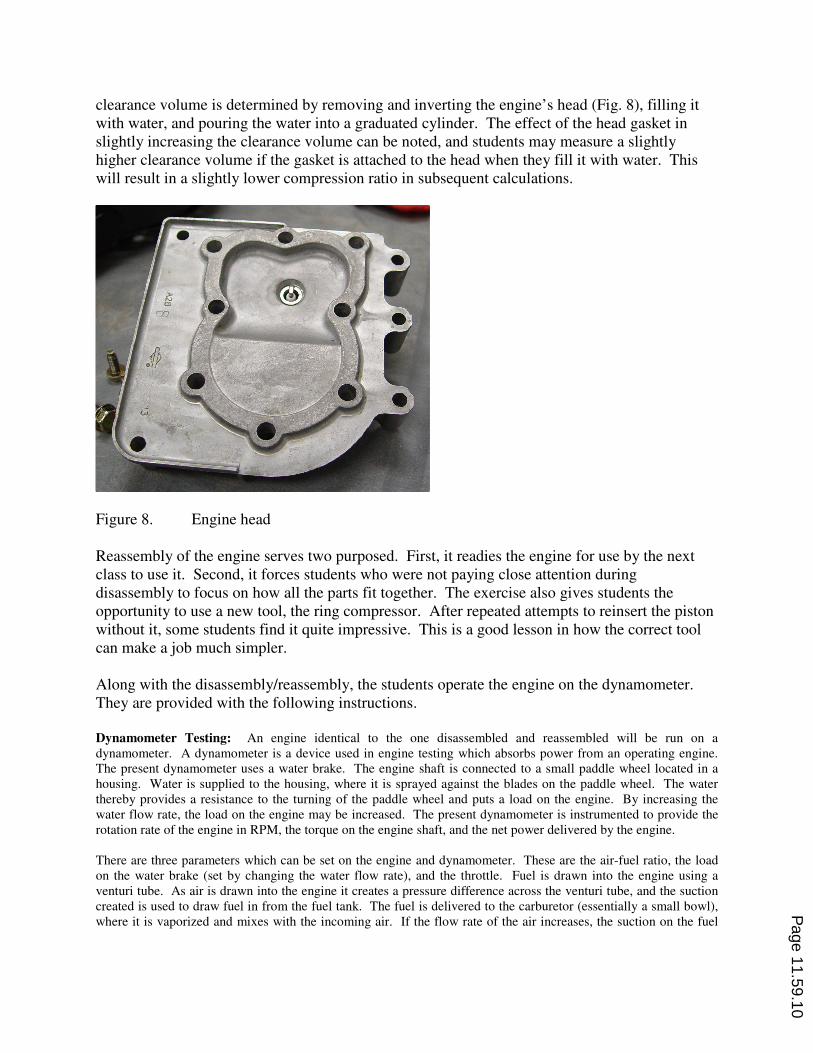
clearance volume is determined by removing and inverting the engine’s head (Fig. 8), filling it with water, and pouring the water into a graduated cylinder. The effect of the head gasket in slightly increasing the clearance volume can be noted, and students may measure a slightly higher clearance volume if the gasket is attached to the head when they fill it with water. This will result in a slightly lower compression ratio in subsequent calculations.
Figure 8. Engine head Reassembly of the engine serves two purposed. First, it readies the engine for use by the next class to use it. Second, it forces students who were not paying close attention during disassembly to focus on how all the parts fit together. The exercise also gives students the opportunity to use a new tool, the ring compressor. After repeated attempts to reinsert the piston without it, some students find it quite impressive. This is a good lesson in how the correct tool can make a job much simpler. Along with the disassembly/reassembly, the students operate the engine on the dynamometer. They are provided with the following instructions. Dynamometer Testing: An engine identical to the one disassembled and reassembled will be run on a dynamometer. A dynamometer is a device used in engine testing which absorbs power from an operating engine. The present dynamometer uses a water brake. The engine shaft is connected to a small paddle wheel located in a housing. Water is supplied to the housing, where it is sprayed against the blades on the paddle wheel. The water thereby provides a resistance to the turning of the paddle wheel and puts a load on the engine. By increasing the water flow rate, the load on the engine may be increased. The present dynamometer is instrumented to provide the rotation rate of the engine in RPM, the torque on the engine shaft, and the net power delivered by the engine. There are three parameters which can be set on the engine and dynamometer. These are the air-fuel ratio, the load on the water brake (set by changing the water flow rate), and the throttle. Fuel is drawn into the engine using a venturi tube. As air is drawn into the engine it creates a pressure difference across the venturi tube, and the suction created is used to draw fuel in from the fuel tank. The fuel is delivered to the carburetor (essentially a small bowl), where it is vaporized and mixes with the incoming air. If the flow rate of the air increases, the suction on the fuel
Page 11.59.10
line increases proportionally, so that the ratio of the air and fuel flow rates remains approximately constant. A screw near the air intake port can be adjusted to change the flow across the venturi and thereby change the air-fuel ratio. The throttle is an obstruction in the air intake path. As the throttle is opened, air can more freely enter the engine with less of a pressure drop. This results in more mass flow into the engine, providing more power. For a fixed engine load, opening the throttle will cause the engine speed to increase.
1. With the air-fuel ratio set near stoichiometric, run the engine at several different loads by adjusting the water flow rate through the water brake. Do not change the throttle setting. For each load, record the engine speed, torque and power output.
2. Repeat the above test with the air-fuel ratio set to a lean setting. 3. Repeat the test again with the air-fuel ratio set to a rich setting.
Groups of 5 to 10 students are shown the dynamometer and given a brief explanation of the water brake and how it is used to vary load (torque) on the engine. Increased load reduces engine speed. Since power is the product of speed and torque, an engine will produce maximum power at some optimal speed. Students will see this when they plot power versus speed. When the load becomes high enough, engine speed and power become so low that the engine stops running. The engine is run with a single throttle position at several loads set by the water brake. Students record torque and speed for each load. The procedure is repeated for three air fuel settings (approximately stoichiometric, rich and lean) as set by the laboratory technician. The dynamometer is set up prior to the lab by the technician, so the exercise is run primarily as a demonstration and takes only about 15 minutes. Students can be pulled away from the disassembly procedure in small groups to run the engine, or the engine can be run at a later time after the disassembly exercise. The latter allows the instructor to be present for both the disassembly and engine operation for all of the students. Analysis
The students are given the following instructions for analysis of their data and prediction of engine performance. Calculations: Using an air standard analysis with variable specific heats, compute the engine power in hp, torque in kN-m, and fuel efficiency as functions of engine RPM. This will require the following extra steps in addition to the standard Otto cycle calculations. 1. Assume the air temperature at the start of the compression stroke (T1) is equal to the outside air temperature. The pressure at this state point (P1) is below atmospheric, however, due to losses as the air flows through the throttle and intake valve. From fluid mechanics, we know that the pressure loss is equal to a loss coefficient multiplied by the fluid velocity squared. The air velocity is directly proportional to the engine speed. For the present engine, assume
P1 = Patm – 0.000002(RPM)2 With P1 and Patm both in kPa and RPM in revolutions per minute. 2. Using the measured stroke, bore, and clearance volume, compute the volume at the beginning of the compression stroke and the compression ratio (V1/V2).
Page 11.59.11
3. The temperature at the end of the heat addition process requires a combustion calculation. It will probably be simplest to perform this computation using a separate EES program, and then input the products temperature into your Otto cycle program as T3. Assume complete combustion of octane vapor in stoichiometric air. Also assume a heat loss of 2508000 kJ/kmol of fuel for the combustion process. The real engine is not adiabatic, so assuming this heat loss provides a means for correcting the ideal Otto cycle results to more realistic values that are closer to the actual engine operating conditions. Using T2 from the Otto cycle as the reactants temperature, compute the products temperature. 4. Compute the power for the cycle as the product of the specific work per cycle (w), the mass in the cylinder (mair), and the engine speed.
Power = mairℜwℜRPM/2 Note that the engine speed in revolution/min must be divided by 2 since there are two revolutions per cycle for a 4 stroke engine. Apply the proper unit conversions to express the power in kW and horsepower. 4. Compute the engine torque by dividing the power by the engine speed in radians/s. Apply the proper unit conversions to express the torque in kN-m. 5. Compute the fuel efficiency. The fuel efficiency is defined here as net power divided by the energy content of the fuel supplied. Using the mass of air (m) and specific work per cycle (w) computed above, the lower heating value of the fuel (LHV) and the air fuel ratio (AFmass) from the combustion calculation, the efficiency is given as
ηfuel = (mairℜw)/(mfuelℜLHV) = (AFmass w)/(LHV) 6. Repeat the steps above for complete combustion with 130% theoretical air. 7. Repeat the steps above for combustion with 80% theoretical air. Assume that the products contain unburned fuel (5% of the fuel in the reactants), CO2, CO, H2O and N2. Report: A memorandum report addressed to your instructor should be submitted for each group. Work in groups of two. The report should include the following, based on the tests and calculations described above.
1. For the theoretical calculation, plot power in hp verses engine speed in RPM for the stoichiometric, lean and rich cases. Comment on how the power changes as the air-fuel ratio is changed and explain why this happens. You should see that power increases with RPM up to a peak value and then decreases as RPM is increased further. Explain why this happens.
2. For the theoretical calculation, plot torque in kN-m verses engine speed in RPM for the stoichiometric, lean
and rich cases. Comment on how the torque changes as the air-fuel ratio is changed and explain why this happens. You should see that torque decreases with engine speed. Explain why this happens.
3. Using the experimental data from the dynamometer, plot power in hp verses engine speed in RPM for the
stoichiometric, lean and rich cases. Compare to the plot based on the theoretical calculation. Comment on similarities, and explain differences.
4. Using the experimental data from the dynamometer, plot torque in kN-m verses engine speed in RPM for
the stoichiometric, lean and rich cases. Compare to the plot based on the theoretical calculation. Comment on similarities, and explain differences.
5. Report the fuel efficiency for the theoretical cases (stoichiometric, lean and rich cases). Explain
differences. Note that for the dynamometer tests we only know the air-fuel ratio qualitatively, so efficiency can not be calculated for these tests.
6. The above items should be included in the body of the memorandum. Attach all data tables, EES programs
and other supporting materials used in the calculations.
Page 11.59.12

Gas mixtures and combustion are taught at the beginning of the semester, so the students are familiar with them before they execute the present laboratory. This arrangement of topics is somewhat unconventional for a second thermodynamics course and does not follow the order of presentation in most textbooks. It has proven very effective, however. Energy balances are covered in the students’ first thermodynamics course and chemical reactions in their freshman chemistry courses. They are ready for a discussion of combustion without further background material. By presenting combustion early, it is possible to integrate it with power cycles throughout the course, as in the present laboratory. Students are also introduced to the Engineering Equation Solver (EES) software3 early in the course. This software allows the user to type equations into a worksheet and then solves them simultaneously. Thermodynamic property calls within EES can be built into the equations, eliminating the need for table lookups. This greatly facilitates parametric studies, such as the determination of engine performance as a function of speed in the calculations described above. Students are encouraged to utilize the software whenever they wish, and are free to use it in all aspects of the course, including homework assignments, exams, design problems, and laboratories. Calculation of the correct trend in power versus engine speed required recognition of the decreasing mass flow though the intake as speed increases. This decrease is caused by the pressure drop in the air as it enters the engine. If the pressure drop is not included in the calculations, the theoretical engine power will increase linearly with engine speed, without an upper limit. An empirical formula for the air pressure at the beginning of the compression stroke was determined by the authors and given to the students in the instructions above. A heat loss for the combustion process was also specified by the authors to allow more accurate determination of the engine power and efficiency. The value for the heat loss was set to give a peak engine power of about 5 hp, the nominal power rating for the engine. Examples of the theoretically calculated and experimentally measured power and torque are shown below in Figs. 9, 10 and 11 for the stoichiometric, rich and lean cases respectively.
0 1000 2000 3000 4000 5000 6000
0
1
2
3
4
5
6
0
0.002
0.004
0.006
0.008
0.01
0.012
0.014
RPM [rev /min]
Wh
p
[hp
]
WhpWhp
torq
ue
[k
N*m
]
torquetorque
torqueexptorqueexp
Whp,expWhp,exp
Fig. 9: Theoretical and experimental engine power and torque for stoichiometric operation.
Page 11.59.13

0 1000 2000 3000 4000 5000 6000
0
1
2
3
4
5
6
0
0.002
0.004
0.006
0.008
0.01
0.012
0.014
RPM [rev /min]
Wh
p
[hp
]
WhpWhp
torq
ue
[k
N*m
]
torquetorque
torqueexptorqueexp
Whp,expWhp,exp
Fig. 10: Theoretical and experimental engine power and torque for rich operation.
0 1000 2000 3000 4000 5000 6000
0
1
2
3
4
5
6
0
0.002
0.004
0.006
0.008
0.01
0.012
0.014
RPM [rev /min]
Wh
p
[hp
]
WhpWhp
torq
ue
[k
N*m
]
torquetorque
torqueexptorqueexp
Whp,expWhp,exp
Fig. 11: Theoretical and experimental engine power and torque for lean operation. The agreement between the theoretical and experimental values is reasonable, although not perfect. In the stoichiometric case (Fig. 9), the experimental power and torque are higher than the theoretical prediction. The peak experimental power and torque values are within 10% of values provided by the manufacturer1. Some disagreement should be expected since the assumptions of pure octane for the fuel, complete combustion, and the educated guess for the combustion heat loss are not strictly correct. Instantaneous combustion, as in an ideal Otto cycle is also assumed, while the spark timing in the actual engine is 22 degrees before top dead center. Lowering the estimated combustion heat loss by 20% would result in good agreement between the experimental and theoretical peak power and torque for the stoichiometric case. At low engine speeds the experimental torque begins to drop, while the theoretical value continues to rise. This is likely due to friction within the engine, which must be overcome with an increasingly higher fraction of the engine’s total power at lower speeds. This causes both output power and output torque to drop and eventually causes the engine to stall. The theoretical calculation does not account for this. In the rich combustion case (Fig. 10), the theoretical calculation predicts much lower power and torque than in the stoichiometric case due to incomplete combustion. The experimental data do
Page 11.59.14
not agree, showing values about equal to those in the stoichiometric case. Lowering the specified combustion heat loss by 20% improves agreement between the theoretical and experimental values, as in the stoichiometric case, but the peak experimental power still remains about 30% higher than the theoretical value after this correction. There was no way to accurately set the air fuel ratio in the experiment, so it is likely that the air fuel ratio in the rich case was closer to stoichiometric than anticipated. It is also possible that the assumptions about the components of the rich exhaust were inaccurate for the theoretical calculation. In the lean combustion case (Fig. 11), the comparison between the experimental and theoretical values is similar to that in the stoichiometric case, with the theoretical values somewhat below the experimental. Lowering the combustion heat loss by 20% again improves the agreement. Both the experimental and theoretical values show the expected trend of reduced power and torque as the air fuel ratio is increased above the stoichiometric value. Potential Lab Improvements
A few improvements are suggested by the experimental results. First, an oxygen sensor could be acquired for relatively low cost and used to set the air fuel ratio of the engine more precisely. At present the mixture is set based on an experienced guess by a laboratory technician. For further improvement, an exhaust gas analyzer could be used to determine the actual components of the combustion products. This would greatly increase the cost and complexity of the laboratory beyond its original intent, however. The complexity of the combustion calculation for the students would also be increased beyond the original intent. A relatively simple modification to the apparatus would allow direct calculation of the experimental fuel efficiency for the engine and comparison to the theoretical value. A sight glass could be installed in the fuel tank so that the rate of fuel drop in the tank could be watched and timed with a stopwatch. Given the dimensions of the tank, the rate of fuel consumption could be determined. The scope of the laboratory could be expanded if instrumentation for temperature and pressure measurements were added to the cylinder. This would allow comparison between the actual engine and the ideal Otto cycle calculations. Such instrumentation is not recommended, however. The accuracy of such measurements would likely be poor with the present engine and could be better implemented with a different engine, such as the CFR engine mentioned above. Increasing the complexity of the lab would also go against the original intention of a limited scope exercise for a single laboratory in a multi subject course. A single thermocouple in the exhaust would be simple to install and could provide a useful comparison between the experimental and theoretical exhaust temperatures. It might also be used to back out an estimate of the engine heat loss. Uncertainty analysis is an important part of all experiments, but was not included in the present exercise. It could certainly be added. In a compromise between including this important topic and limiting student workload, the present authors have chosen to include uncertainty analysis in some of the exercises in the course where it is most important for explaining results and not in others.
Page 11.59.15
Assessment of Student Learning
As stated above, the educational objectives of the present laboratory are to improve the students’ understanding of thermodynamics, help them integrate this knowledge with other subjects, and to give them a better basic understanding of how an internal combustion engine works. Assessment of the impact on the first two objectives is difficult, since the students learn about thermodynamics from many sources, and separation of the effect of a single laboratory from other effects would be difficult if not impossible. A control group of students who have completed the same course but without the lab is also unavailable. Assessment of the third objective (regarding the students understanding of IC engines) is more manageable and has been attempted. A survey consisting of a few short questions about the operation of a small engine was given to students before and after the course in question. The questions were designed to be specific to the present laboratory. More general topics that might have been considered elsewhere in the present course or another required course were avoided. A question regarding the calculation of power, for example, was not included because this subject was covered outside the laboratory and there was no way to assess the impact of the laboratory on the responses. The questions are listed below. Internal Combustion Engine Lab Survey The objective of this survey is to assess the impact of a particular EM320 lab by questioning students before and after taking the course. Please try to answer the following questions to the best of your ability. A) Had you disassembled or studied piston engines prior to taking EM320? If yes, indicate where and describe what you did or studied. B) Have you disassembled or studied piston engines since taking EM320? If yes, indicate where and describe what you did or studied. 1) Explain how oil from the crankcase in a 4-stroke internal combustion engine gets to the cylinder walls for lubrication in an engine without an oil pump. 2) Explain why a flywheel is an important component of an internal combustion engine. 3) Describe the function of a carburetor. 4) Is the throttle valve on a spark ignition engine located in the air flow path or the fuel flow path? 5) Describe how the intake and exhaust valves are mechanically opened and closed.
One group of 86 students was surveyed at the very beginning of the course in January 2006. This group had not yet completed the laboratory and is referred to as Group I. Question B was removed from the survey for this group, as it was not applicable to them. A second group of 63 students took the course during the spring semester in 2005, completing the laboratory in January 2005. They were surveyed 11 months later in December 2005. This post-course group is referred to as Group II. It is recognized that two different groups of students were surveyed for the pre and post course assessment. This introduces an uncontrolled variable into the analysis, as the two cohorts may have had different backgrounds coming into the course and different
Page 11.59.16
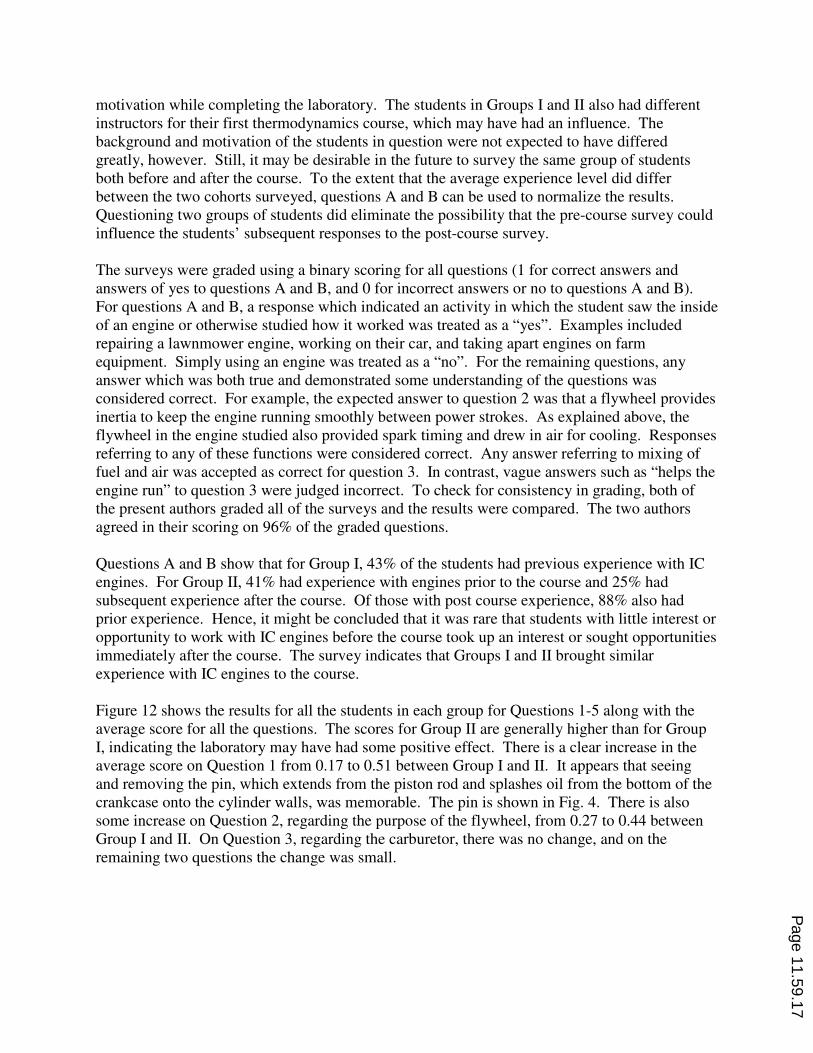
motivation while completing the laboratory. The students in Groups I and II also had different instructors for their first thermodynamics course, which may have had an influence. The background and motivation of the students in question were not expected to have differed greatly, however. Still, it may be desirable in the future to survey the same group of students both before and after the course. To the extent that the average experience level did differ between the two cohorts surveyed, questions A and B can be used to normalize the results. Questioning two groups of students did eliminate the possibility that the pre-course survey could influence the students’ subsequent responses to the post-course survey. The surveys were graded using a binary scoring for all questions (1 for correct answers and answers of yes to questions A and B, and 0 for incorrect answers or no to questions A and B). For questions A and B, a response which indicated an activity in which the student saw the inside of an engine or otherwise studied how it worked was treated as a “yes”. Examples included repairing a lawnmower engine, working on their car, and taking apart engines on farm equipment. Simply using an engine was treated as a “no”. For the remaining questions, any answer which was both true and demonstrated some understanding of the questions was considered correct. For example, the expected answer to question 2 was that a flywheel provides inertia to keep the engine running smoothly between power strokes. As explained above, the flywheel in the engine studied also provided spark timing and drew in air for cooling. Responses referring to any of these functions were considered correct. Any answer referring to mixing of fuel and air was accepted as correct for question 3. In contrast, vague answers such as “helps the engine run” to question 3 were judged incorrect. To check for consistency in grading, both of the present authors graded all of the surveys and the results were compared. The two authors agreed in their scoring on 96% of the graded questions. Questions A and B show that for Group I, 43% of the students had previous experience with IC engines. For Group II, 41% had experience with engines prior to the course and 25% had subsequent experience after the course. Of those with post course experience, 88% also had prior experience. Hence, it might be concluded that it was rare that students with little interest or opportunity to work with IC engines before the course took up an interest or sought opportunities immediately after the course. The survey indicates that Groups I and II brought similar experience with IC engines to the course. Figure 12 shows the results for all the students in each group for Questions 1-5 along with the average score for all the questions. The scores for Group II are generally higher than for Group I, indicating the laboratory may have had some positive effect. There is a clear increase in the average score on Question 1 from 0.17 to 0.51 between Group I and II. It appears that seeing and removing the pin, which extends from the piston rod and splashes oil from the bottom of the crankcase onto the cylinder walls, was memorable. The pin is shown in Fig. 4. There is also some increase on Question 2, regarding the purpose of the flywheel, from 0.27 to 0.44 between Group I and II. On Question 3, regarding the carburetor, there was no change, and on the remaining two questions the change was small.
Page 11.59.17
0
0.1
0.2
0.3
0.4
0.5
0.6
0.7
1 2 3 4 5 Average
Question Number
Fra
cti
on
Co
rrect
Group I
Group II
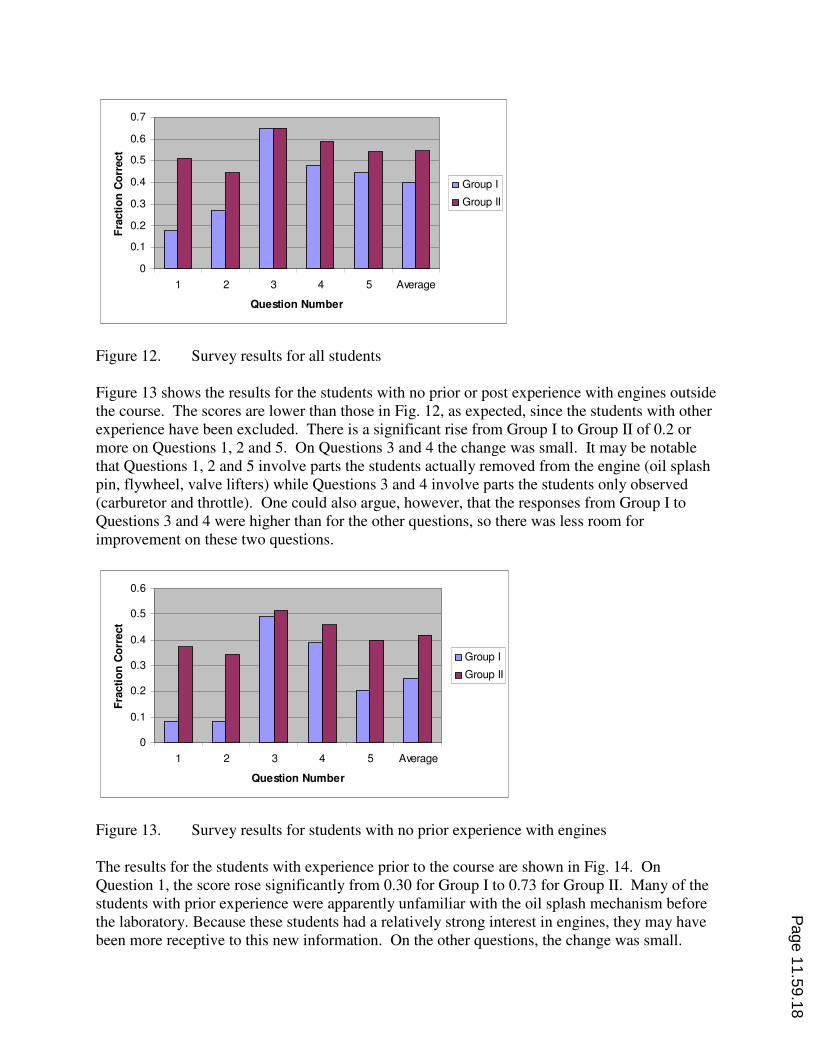
Figure 12. Survey results for all students Figure 13 shows the results for the students with no prior or post experience with engines outside the course. The scores are lower than those in Fig. 12, as expected, since the students with other experience have been excluded. There is a significant rise from Group I to Group II of 0.2 or more on Questions 1, 2 and 5. On Questions 3 and 4 the change was small. It may be notable that Questions 1, 2 and 5 involve parts the students actually removed from the engine (oil splash pin, flywheel, valve lifters) while Questions 3 and 4 involve parts the students only observed (carburetor and throttle). One could also argue, however, that the responses from Group I to Questions 3 and 4 were higher than for the other questions, so there was less room for improvement on these two questions.
0
0.1
0.2
0.3
0.4
0.5
0.6
1 2 3 4 5 Average
Question Number
Fra
cti
on
Co
rrect
Group I
Group II
Figure 13. Survey results for students with no prior experience with engines The results for the students with experience prior to the course are shown in Fig. 14. On Question 1, the score rose significantly from 0.30 for Group I to 0.73 for Group II. Many of the students with prior experience were apparently unfamiliar with the oil splash mechanism before the laboratory. Because these students had a relatively strong interest in engines, they may have been more receptive to this new information. On the other questions, the change was small.
Page 11.59.18
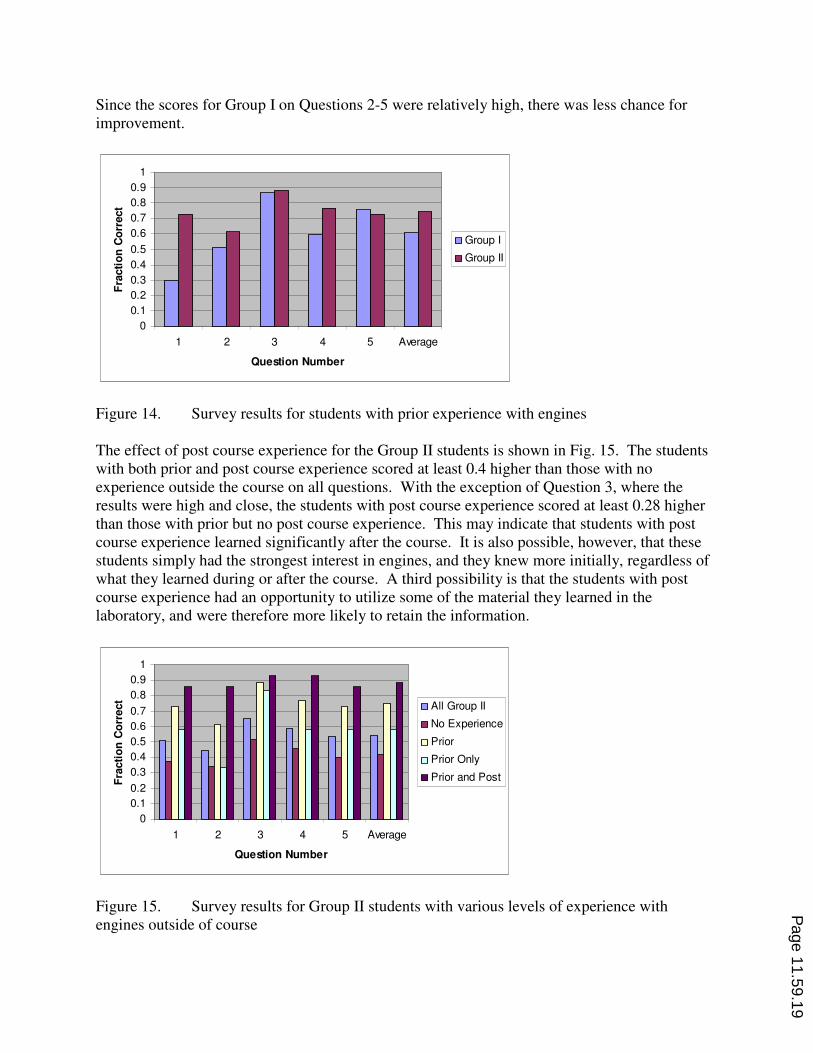
Since the scores for Group I on Questions 2-5 were relatively high, there was less chance for improvement.
0
0.1
0.2
0.3
0.4
0.5
0.6
0.7
0.8
0.9
1
1 2 3 4 5 Average
Question Number
Fra
cti
on
Co
rrect
Group I
Group II
Figure 14. Survey results for students with prior experience with engines The effect of post course experience for the Group II students is shown in Fig. 15. The students with both prior and post course experience scored at least 0.4 higher than those with no experience outside the course on all questions. With the exception of Question 3, where the results were high and close, the students with post course experience scored at least 0.28 higher than those with prior but no post course experience. This may indicate that students with post course experience learned significantly after the course. It is also possible, however, that these students simply had the strongest interest in engines, and they knew more initially, regardless of what they learned during or after the course. A third possibility is that the students with post course experience had an opportunity to utilize some of the material they learned in the laboratory, and were therefore more likely to retain the information.
0
0.1
0.2
0.3
0.4
0.5
0.6
0.7
0.8
0.9
1
1 2 3 4 5 Average
Question Number
Fra
cti
on
Co
rrect
All Group II
No Experience
Prior
Prior Only
Prior and Post
Figure 15. Survey results for Group II students with various levels of experience with engines outside of course
Page 11.59.19

Conclusions A new laboratory in which students disassembled and tested small internal combustion engines has been described. The laboratory was designed for low cost and set up with modest effort. It provides a large group of students in a required course with a hands-on experience with a real engine. The students see the internal mechanisms of an engine and relate the mechanical device to the theory learned in their thermodynamics courses. The scope of the laboratory is deliberately limited, so it is suitable as a single laboratory in a multi topic course. Theoretical and experimental results agree well, and differences are explainable and expected. Pre and post course surveys indicate that the students have gained some practical information from the laboratory, and many have retained the information for several months after the course. Acknowledgements
The authors thank Mr. John Hein and Mr. Robert Banks of the Technical Support Department at the United States Naval Academy for their help in setting up and running the laboratory. Bibliography
1. Briggs & Stratton Motorsports (www.briggsracing.com/home.html). 2. Smith, A.N. and Volino, R.J. “Versatile Heat Transfer Lab for Conducting Bench-Top Experiments,”
Proceedings of the 2005 ASEE Annual Conference 3. F-Chart Software. “Engineering Equation Solver” (www.fchart.com).
Page 11.59.20